Pask integrates hormonal signaling with histone modification via Wdr5 phosphorylation to drive myogenesis
- University of Utah School of Medicine, United States
- Howard Hughes Medical Institute, University of Utah School of Medicine, United States
Figures
Figure 1 with 4 supplements
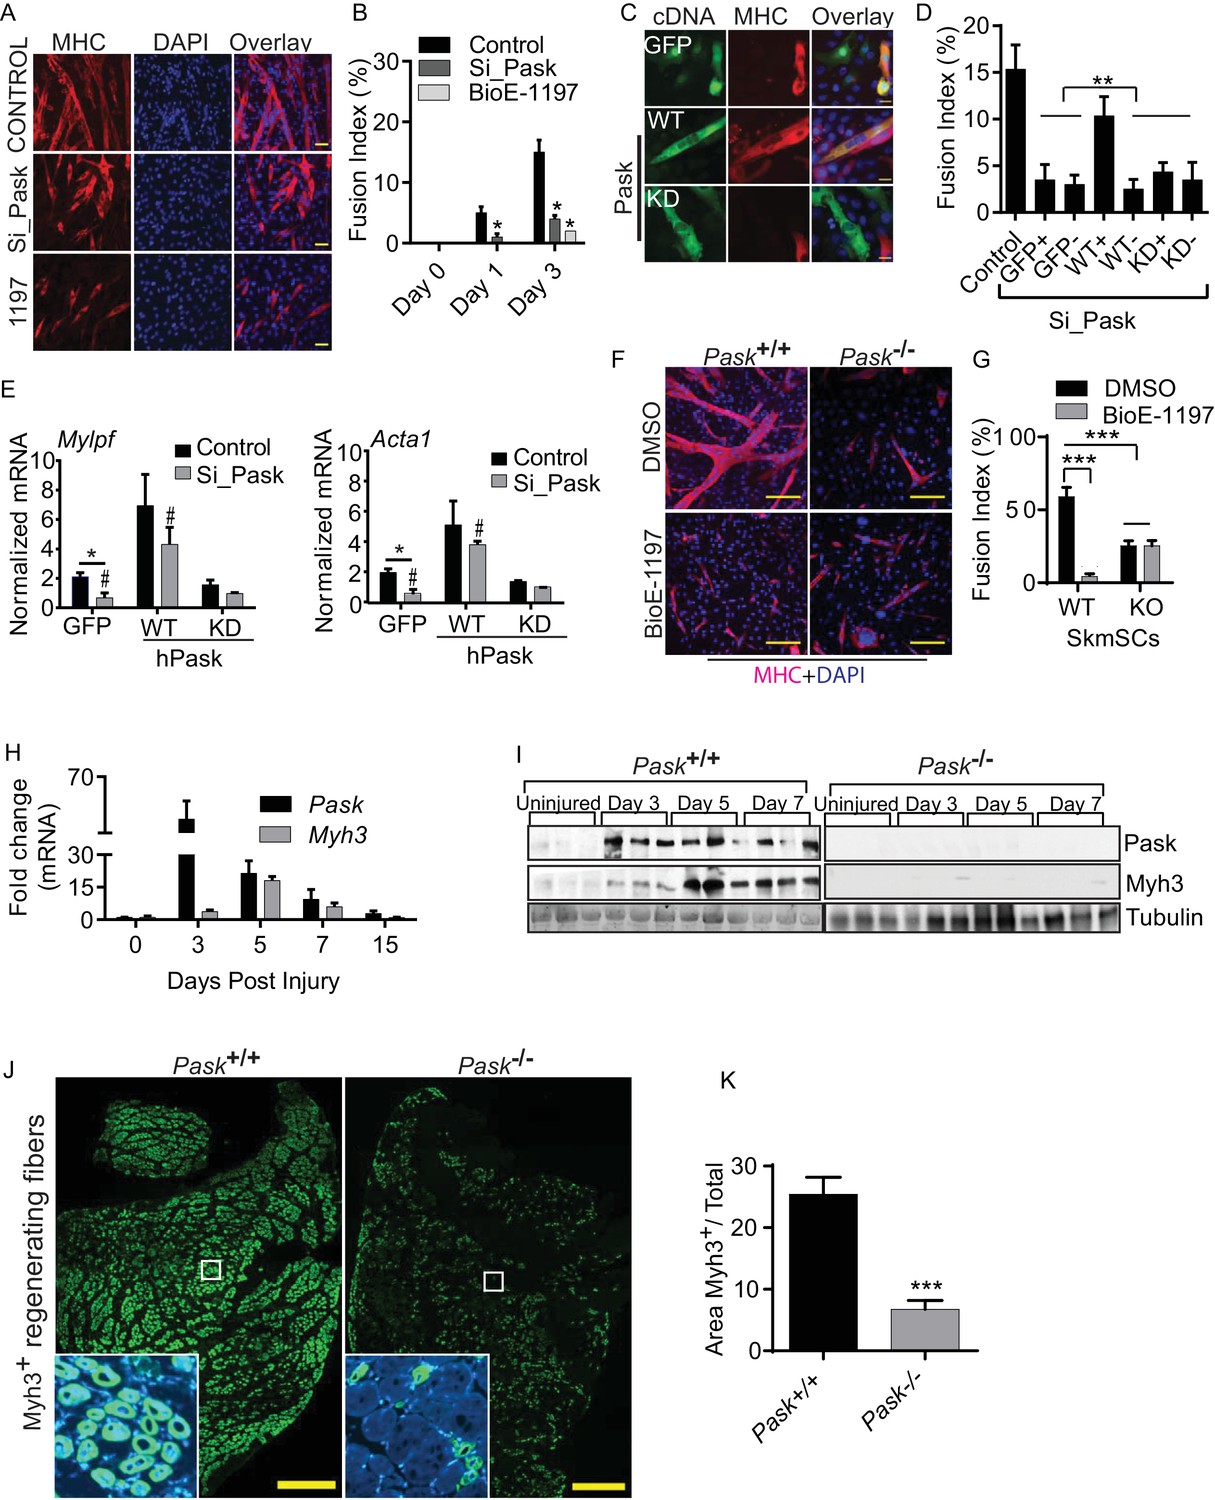
Pask is required for skeletal muscle regeneration after acute muscle injury.
(A) Differentiation of C2C12 myoblasts was assessed after Pask was either knocked down using pooled siRNA or inhibited using 25 µM BioE-1197. Control cells were transfected with pooled non-targeting siRNA. DMSO vehicle control (v/v) was used for BioE-1197 samples and it was indistinguishable from siRNA control. 48 hr after siRNA or BioE-1197 treatment, differentiation was stimulated using 10nM insulin and myotube formation was visualized using anti-MHC (MF20-Red) antibody 3 days later. Scale bar = 40 µM. (B) Comparison of fusion index between control and siRNA (Si_Pask) or inhibitor (BioE-1197)-treated C2C12 cells from (A). n = 3 independent experiments each with 100 cells counted. Error bars ± S.D. *p<0.05 (C) GFP, Flag-WT or Flag-KD (K1028R) human Pask were expressed using retrovirus in Pask-silenced C2C12 cells. Differentiation was initiated 24 hr after transgene introduction and was analyzed using anti-MHC staining on day 3 as in (A). Expression of Pask was visualized using anti-Flag staining. Scale bar = 20 µm. (D) Fusion index (as in (B)) of cells from (C) that were individually scored as with (+) or without (−) GFP, WT Pask or KD Pask expression. Note that only those cells expressing WT Pask show restoration of fusion index. n = 3 independent experiments each with 100 cells counted. Error bars ± S.D. **p<0.005. (E) qRT-PCR analysis of C2C12 cells showing abundance of Mylpf and Acta1 mRNAs in Pask-silenced cells expressing GFP, WT or KD Pask. 18S rRNA was used as normalizer. Error bars ± S.D. *p<0.05, #p<0.05 WT vs KD Pask in control samples, #p<0.05 WT vs KD hPask in Si_Pask samples. (F) Myogenesis of primary myoblasts derived from WT and Pask-/- skeletal muscle was assessed using anti-MHC staining after four days of differentiation. Nuclei are stained with DAPI. Scale bar = 100 µM. (G) Quantification of fusion index from (F) at Day 4. ***p<0.0005. (H) qRT-PCR analysis of fold change in the expression of Pask and Myh3 mRNA following BaCl2 induced muscle injury to TA muscle relative to uninjured (DPI 0). 18S rRNA was used as normalizer. (I) Western blot analysis of isolated TA muscle following BaCl2 induced muscle injury from WT and Pask-/- mice. (J) Representative cross-section of TA muscle 5d post injury showing levels of Myh3 (green) expression between WT (Pask+/+) and Pask-/- animals. Nuclei are stained with DAPI (blue). Scale bars = 100 µM. n = 5 (K) Quantification of the Myh3 positive area/total was determined by measuring Myh3 staining intensities across 3 representative sections from each independent animal, n = 5. Error bars ± S.D. ***p<0.0005.
-
Figure 1—source data 1
Numerical values from graphs represennted in Figure 1.
- https://doi.org/10.7554/eLife.17985.003
Figure 1—figure supplement 1
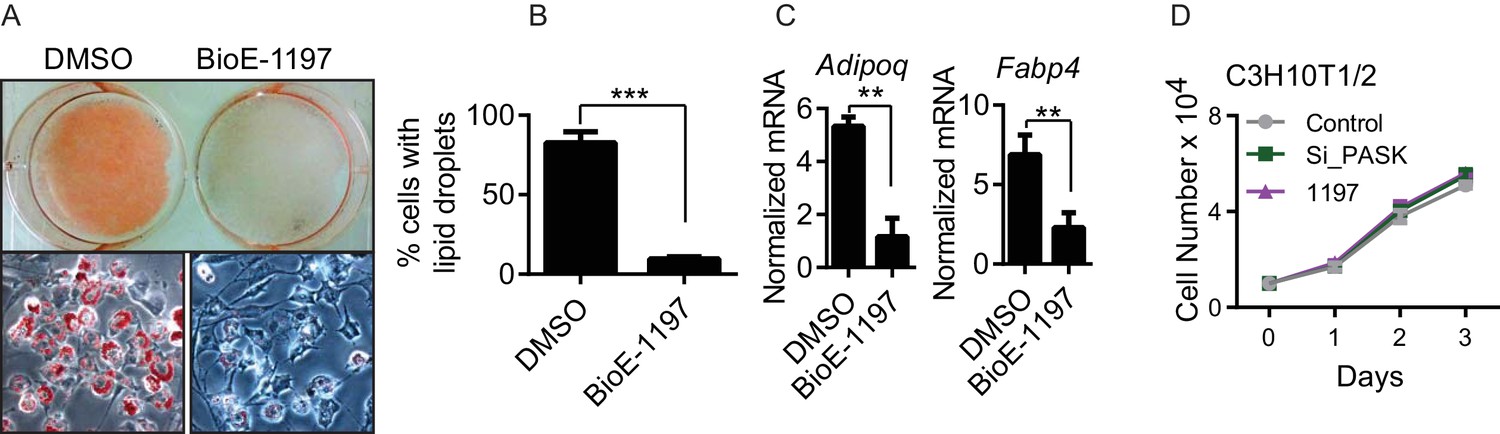
Pask is required for adipogenesis of mesenchymal stem cell.
(A) C3H10T1/2 cells were treated with either DMSO or 25µM BioE-1197 48 hr prior to induction of adipocyte differentiation. Adipocyte differentiation was induced as described in Experimental Procedures. Cells were processed for Oil Red O staining 8 days after differentiation. (B) Quantification of percent of cells with lipid droplets after 8 days of differentiation from (A). n = 3. Error bars ± S.D. ***p<0.0001 (C) qRT-PCR analysis of markers of adipocyte differentiation in DMSO or BioE-1197 treated samples from (A). n = 3. Error bars ± S.D. **p<0.005. (D) The proliferation rate of C3H10T1/2 cells was measured by seeding cells at 10,000 cells/well and counting cells using a hemocytometer over the ensuing three days.
Figure 1—figure supplement 2
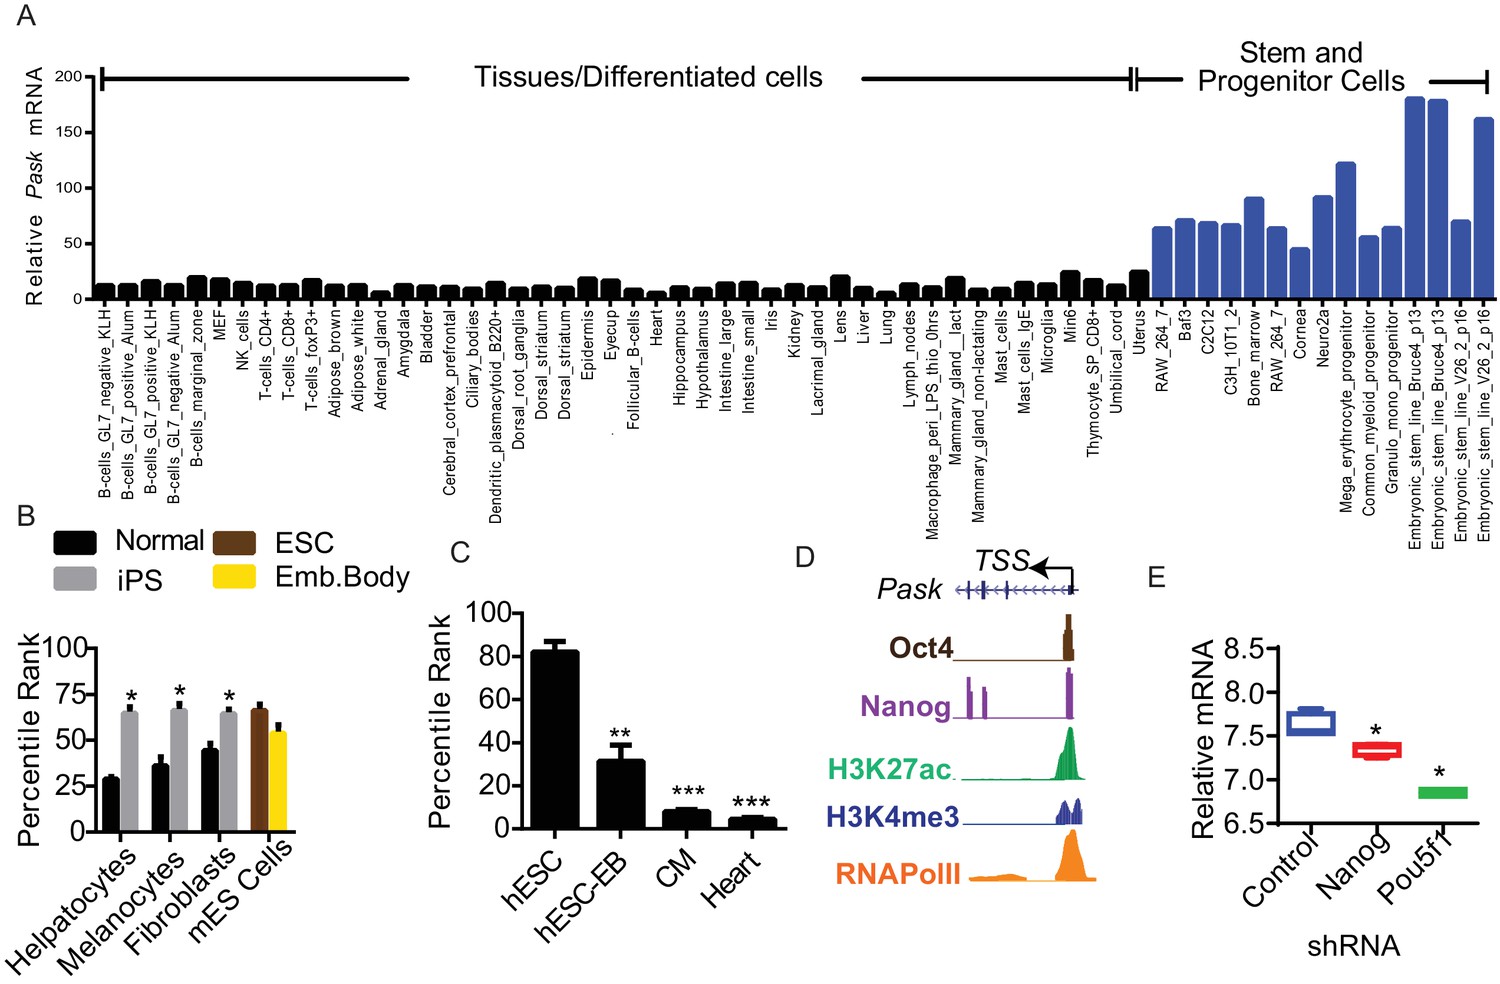
Pask is enriched in stem cells and is required for terminal differentiation of neuronal, adipogenic and myogenic cell types.
(A) Comparison of Pask mRNA expression profile from GeneAtlas MOE430 dataset obtained from BioGPS (B) Induction of Pask mRNA expression during iPSC formation from indicated differentiated cell types plotted as percentile rank across all genes. (C) Pask mRNA expression during differentiation of hESCs into cardiomyocytes and in comparison with adult heart expressed as a percentile rank across all genes. (D) Depiction of the mouse Pask locus showing positions of Oct4 and Nanog transcription factor binding and corresponding chromatin marks indicative of active transcription in ESCs. ChIP-Seq data was obtained from ENCODE browser, see main text for citation.
Figure 1—figure supplement 3
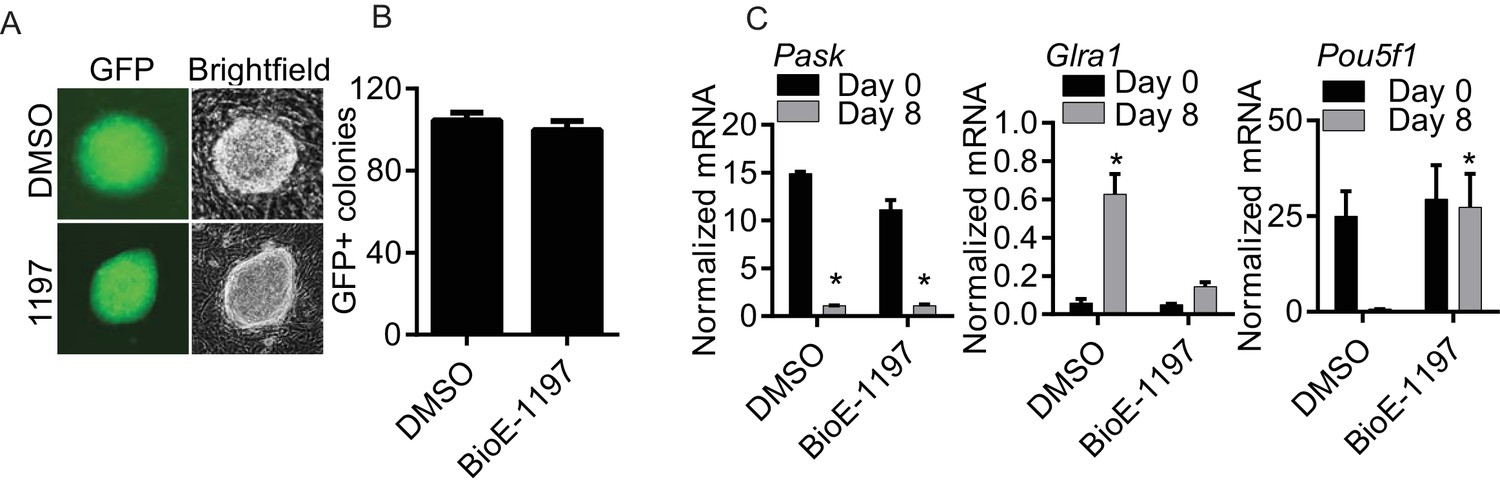
Pask is required for differentiation of ES cells but not for iPS reprograming.
(A) Mouse embryonic fibroblasts (MEFs) containing an IRES-GFP cassette expressed from the Oct4 locus were induced for reprogramming by mSTEMCCA factors as described in Materials and methods in the presence of DMSO or 50 µM BioE-1197. Representative images of iPS colonies at day 8 post-initiation of reprogramming showing expression of GFP and its corresponding brightfield image are shown. (B) Quantification of GFP+ colonies 8 days after initiation of reprograming from experiment in (A). (C) Mouse ES cells were treated with either DMSO or 25µM BioE-1197 24 hr prior to induction of neuronal differentiation. Neuronal differentiated was initiated by the addition of 1.5 µg/ml of Retinoic Acid (RA) in the presence of DMSO or 25 µM BioE-1197. Differentiation was determined by qRT-PCR analysis of the indicated genes eight days after initiation of differentiation. n = 3 Error bars ± S.D.
Figure 1—figure supplement 4
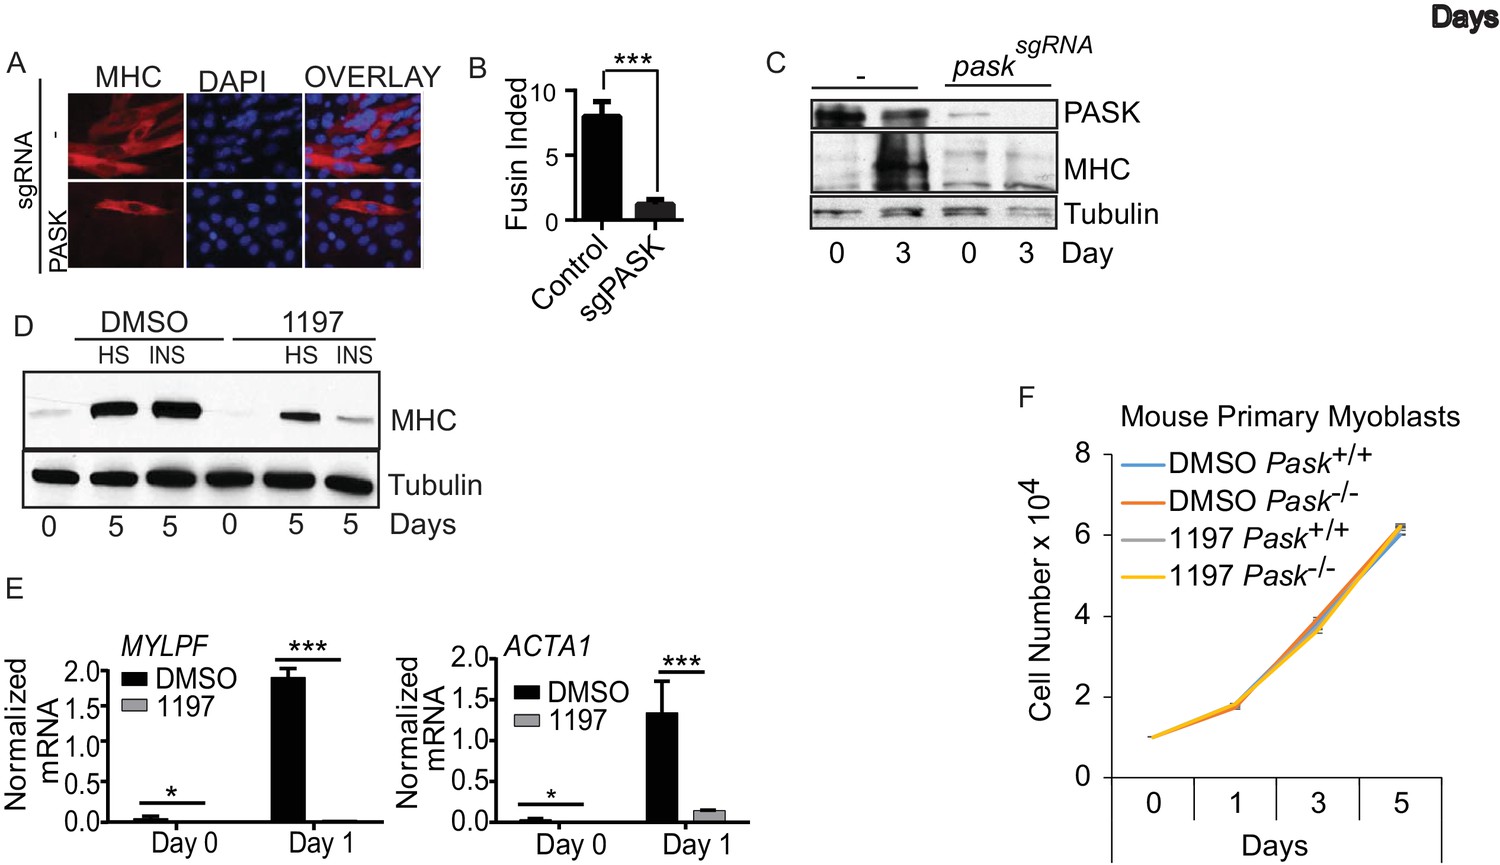
Genetic and pharmacological inhibition of Pask suppresses myogenesis of mouse and human myoblasts.
(A) MHC staining of C2C12 cells with Cas9 guided deletion of Pask during differentiation. (B) Fusion index calculation from Figure (A). (B) Western blot analysis MHC expression during differentiation of C2C12 cells with Cas9 guided Pask deletion. (C) Human primary myoblasts were subjected to differentiation by either 2% horse serum or 100 nM insulin in presence of DMSO or BioE-1197. Protein extracts were prepared three days of differentiation and probed for MHC or β-tubulin. (D) mRNA expression levels of human MYLPF and ACTA1 were determined from human primary myoblasts subjected to insulin stimulated differentiation at indicated time point. (E) The proliferation rate of mouse primary myoblasts derived from WT or Pask-/- mice treated with DMSO or BioE-1197 were measured as in figure supplement 1L at indicated time points.
Figure 2 with 3 supplements
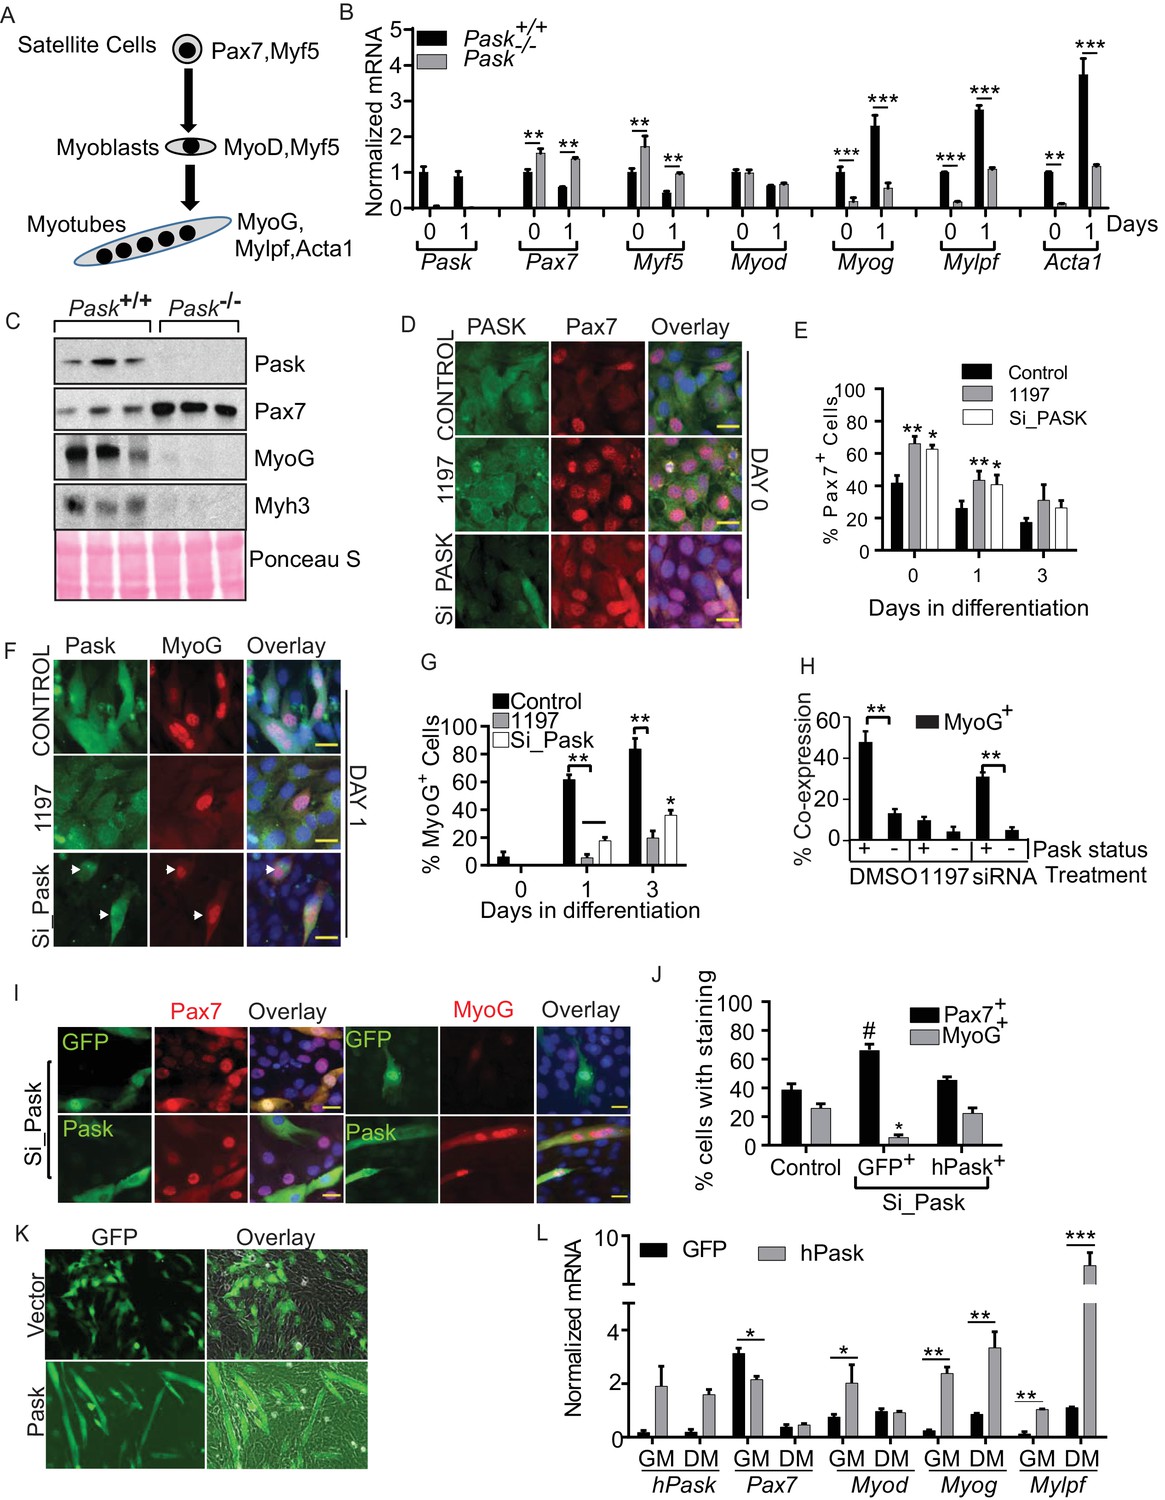
Pask is required for transcriptional activation of MyoG in response to differentiation cues.
(A) Schematic of myogenesis from satellite cells that depicts the progression of transcription factors during myogenesis. (B) qRT-PCR analysis of WT and Pask-/- satellite cells prior to (day 0) or at the indicated time after initiation of differentiation with 100 nM insulin in serum free DMEM. 18S rRNA was used as normalizer. Transcript levels of WT cells at Day 0 was set at 1 to calculate fold changes during differentiation. Error bars ± S.D. *p<0.05, **p<0.005, ***p<0.001. (C) Western blot analysis of the indicated proteins at five days post-injury from isolated TA muscles of WT and Pask-/- mice. (D) Immunofluorescence microscopic examination of Pax7 expression in control, Pask-siRNA or 25µM BioE-1197 treated samples on Day 0 of differentiation. (E) Quantification of Pax7+ cell numbers from experiment in (D) along the differentiation time course. n=3 independent experiments each with 100 cells counted. Error bars = S.D. *p<0.05. (F) Immunofluorescence microscopy showing MyoG and Pask in control, Pask-siRNA or 25 µM BioE-119- treated cells at Day 1 of differentiation. (G) Percent MyoG+ cells in Control, Pask-siRNA or 25 µM BioE-1197-treated cells during differentiation as in (F). n = 3 independent experiments each with 100 cells counted. Error bars ± S.D. **p<0.005, *p<0.05. (H) Percent co-expression of Pask+ and MyoG+ cells at Day 1 of differentiation as in (F). n = 3 independent experiments each with 100 cells counted. Error bars ± S.D. **p<0.005. (I) Representative images from Pask-silenced C2C12 cells expressing GFP control or Flag-human Pask at 24 hr after initiation of differentiation to detect endogenous Pax7 (left) or MyoG (right) together with GFP or Flag-Pask. Scale bar = 20 µM. (J) Quantification of Pax7+ and MyoG+ cells counting only those cells that are GFP+ or Pask+ from (I). n = 3 independent experiments each with 100 cells counted. Error bars ± S.D. *p<0.05 Control vs. Pask silenced GFP+ cells, #p<0.05 Pask silenced GFP+ vs. Pask silenced hPask+ cells. (K) Empty GFP vector or GFP vector containing hPask were retrovirally introduced to proliferating C2C12 cells at a sub-confluent density in growth media. Cells were allowed to grow in growth media for 72 hr and imaged for GFP. (L) qRT-PCR analysis of GFP or hPask-expressing C2C12 myoblasts after puromycin selection from (I). Cells were collected from growth media (GM) or 24 hr after addition of differentiation media (DM). n = 3, Error bars ± S.D. *p<0.05, **p<0.005, ***p<0.0005.
-
Figure 2—source data 1
Numerical data from qPCR analysis off WT vs Pask-/- satellite cells from the graph represented in Figure 2B and quantification of Pax7+ and MyoG+ cell numbers.
- https://doi.org/10.7554/eLife.17985.009
Figure 2—figure supplement 1

Pask is required for transcriptional activation of MyoG in response to differentiation cues.
(A) Western blot analysis of abundance of the indicated proteins during myoblast differentiation in control or Pask-silenced C2C12 cells using 2% Horse Serum media. (B) qRT-PCR analysis of DMSO or 25 µM BioE-1197 treated C2C12 cells prior to (day 0) or 3 days after 10 nM insulin-stimulated differentiation. 18S rRNA was used as normalizer. Error bars = S.D. *p<0.05, ***p<0.0005. (C) WT or KD (K1028R) Pask or GFP were expressed in Pask-silenced C2C12 cells via retroviral infection 48 hr prior to differentiation. Three days after induction of differentiation, mRNA abundance of Pax7, Myog and Acta1 was assessed by qRT-PCR. Error bars = S.D. *p<0.05.
Figure 2—figure supplement 2
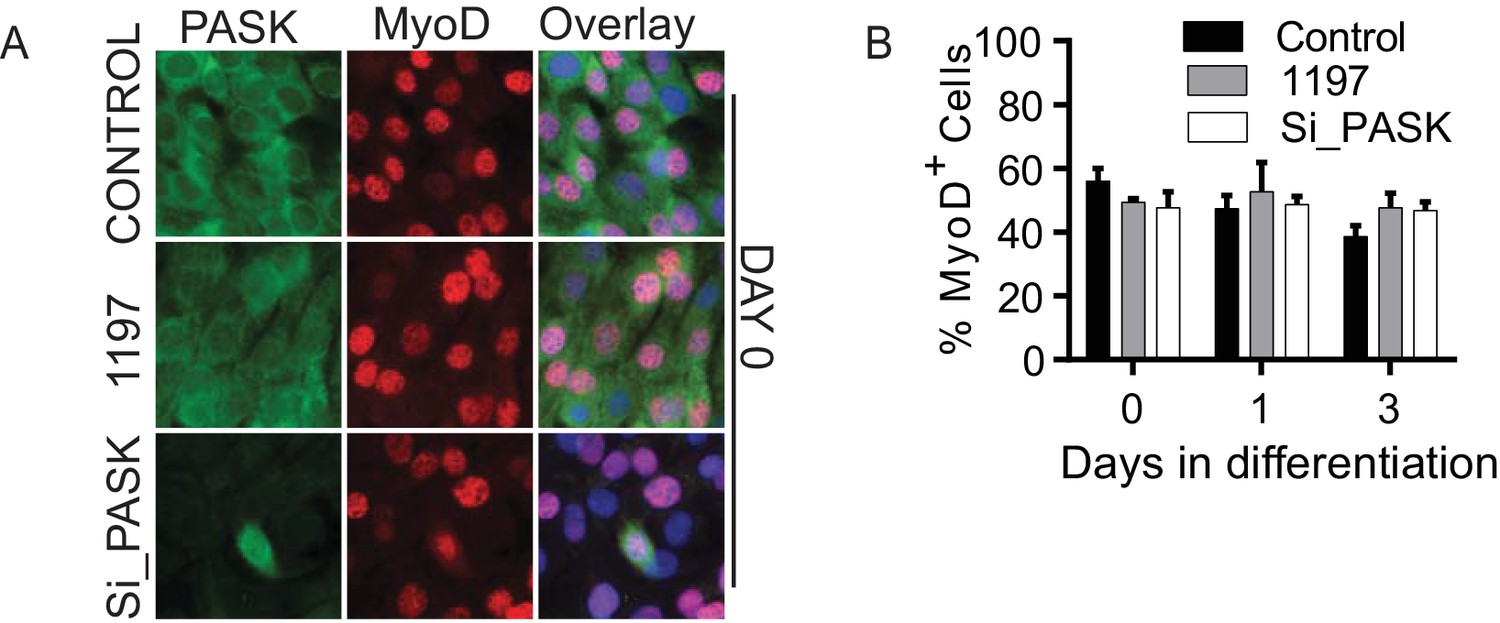
Pask does not regulate MyoD+ cell population.
(A) Immunofluorescence microscopy showing MyoD expression and localization in control, Pask-siRNA or 25 µM BioE-1197 treated cells on Day 0 of differentiation. (B) Quantification of MyoD+ cell numbers from experiment in (A) along the differentiation time course. n=3 independent experiments each with 100 cells counted.
Figure 2—figure supplement 3
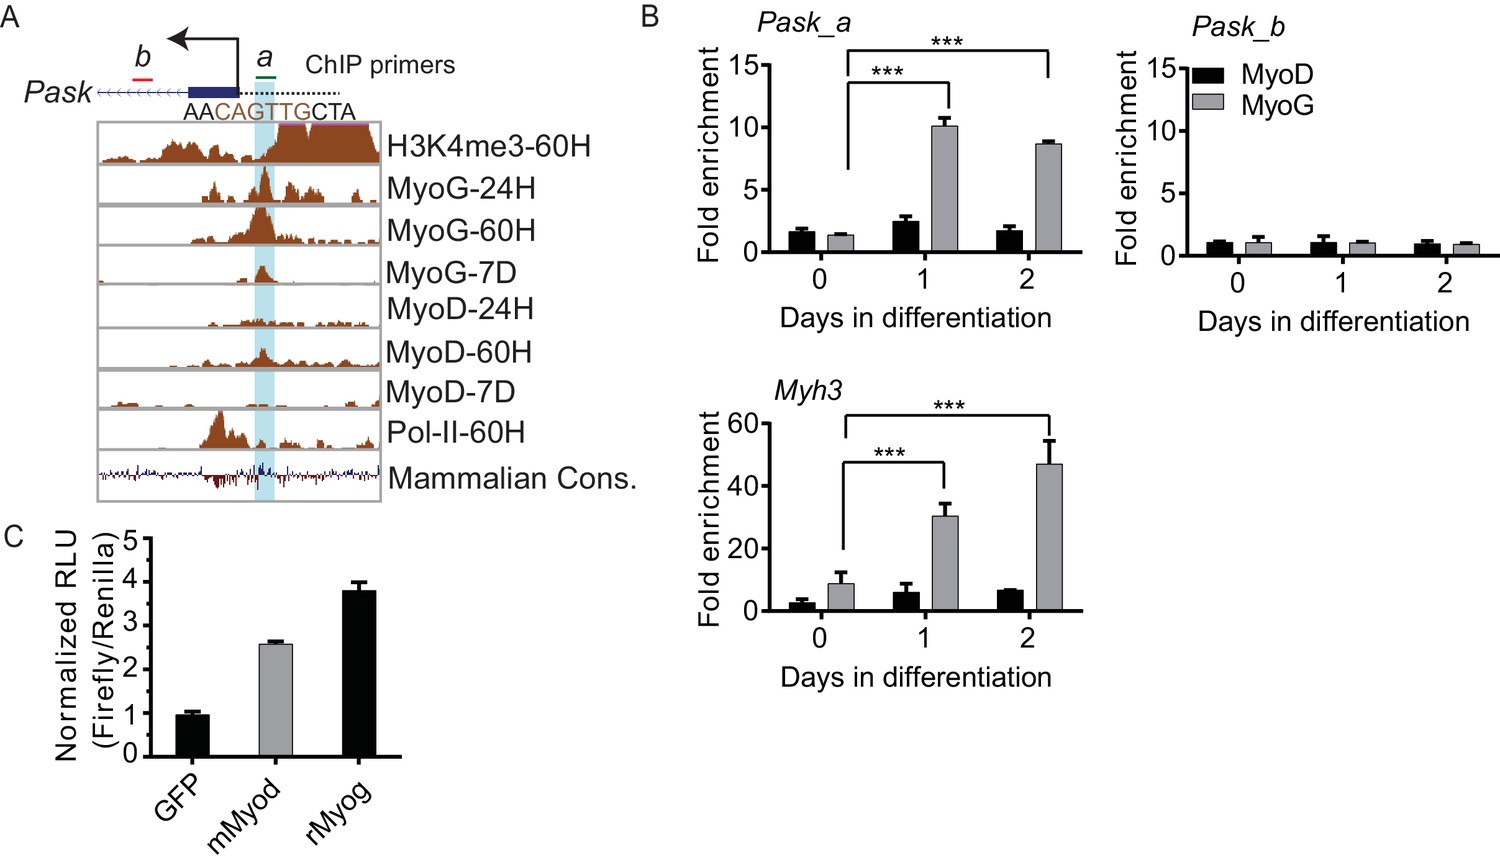
Pask promoter is occupied by MyoG and MyoD during differentiation.
(A) ChIP-Seq data from the ENCODE dataset for H3K4me3 levels, MyoG, MyoD and POL II binding at the indicated time-points at the Pask promoter during C2C12 differentiation. The vertical turquois line represents the peak of MyoG/MyoD binding at the predicted E-Box motif (sequence in brown). The transcription start site is indicated by an arrow. The green and red horizontal bars represent Pask_a and Pask_b ChIP primer sets used in (A). (B) MyoG and MyoD ChIP was performed from proliferating (Day 0) or differentiating (Day 1 and Day 2) C2C12 cells and analyzed by Pask_a and Pask_b primer sets. Myh3 primers spanning −100 bp from TSS were used as a positive control for MyoG binding. n = 3, Error bars ± S.D. ***p<0.0005 (C) A region containing ~300 bp upstream of the predicted Pask transcriptional start site, which contains a putative E-box element (See Figure 2— figure supplement 2A), was cloned upstream of firefly luciferase. This construct was co-expressed with GFP, MyoG or MyoD in HEK293T cells. Luciferase activity, indicative of activation of the Pask promoter, was measured using a luminometer and normalized to CMV-driven Renilla. RLU: Relative Light Units.
Figure 3 with 1 supplement
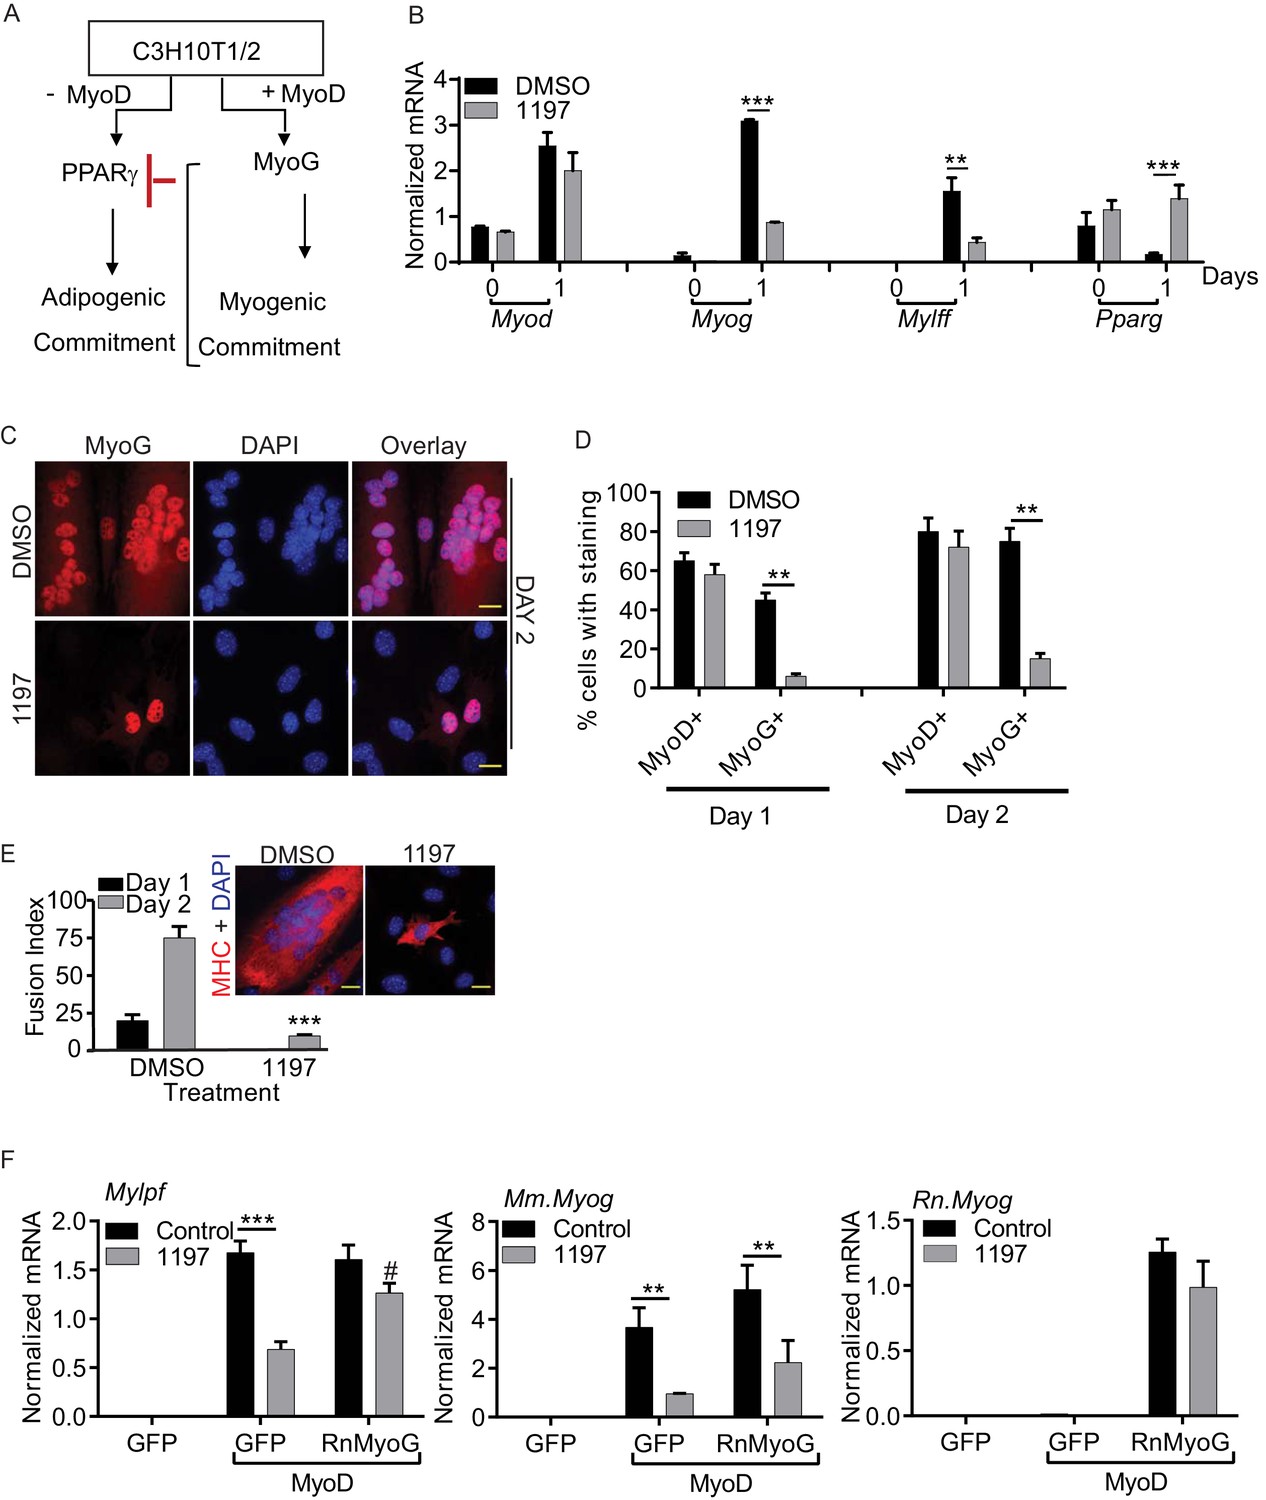
Pask is required for myogenic conversion of C3H10T1/2 cells by MyoD.
(A) Schematic depiction of the mechanism by which MyoD-induces the myogenic conversion of adipogenic C3H10T1/2 cells. (B) qRT-PCR analysis of the indicated mRNAs in C3H10T1/2 cells expressing MyoD in the presence of DMSO or 25 µM BioE-1197 during differentiation. n = 3, Error bars ± S.D ***p<0.0005, p<0.005. (C) MyoD-expressing C3H10T1/2 cells were allowed to differentiate in the presence of DMSO or 25 µM BioE-1197 and processed for immunofluorescence microscopy using anti-MyoG antibody. Scale bar = 20 µm. (D) Quantification of MyoD+ and MyoG+ cells in the presence of DMSO or BioE-1197 from (C). n = 3 independent experiments each with 100 cells counted. Error bars ± S.D. **p<0.005. (E) Fusion index on Day 1 and 2 of differentiation for C3H10T1/2 cells expressing MyoD in the presence of DMSO or 25 µM BioE-1197. Inset shows representative MHC staining on Day 2 of differentiation. Scale bar = 20 µm. (F) qRT-PCR analysis of endogenous mouse Mylpf and Myog and rat Myog upon GFP or rat MyoG expression in MyoD-expressing C3H10T1/2 cells treated with either DMSO or 25 µM BioE-1197. n = 3, Error bars ± S.D. ***p<0.0005, **p<0.005.
-
Figure 3—source data 1
Numerical values from qPCR analysis in Figure 3A and quantification of MyoD+ and MyoG+ cell numbers from Figure 3D.
- https://doi.org/10.7554/eLife.17985.014
Figure 3—figure supplement 1

Pask is required for myogenic conversion of mesenchymal stem cells by MyoD.
(A) Immunofluorescence of MyoD expression in DMSO or BioE-1197 treated samples at Day 1 and Day 2. See main text Figure 4D for quantification. (B) Immunofluorescence of MyoG expression in DMSO or BioE-1197 treated samples at Day 1 and Day 2. See main text Figure 4D for quantification.
Figure 4 with 1 supplement
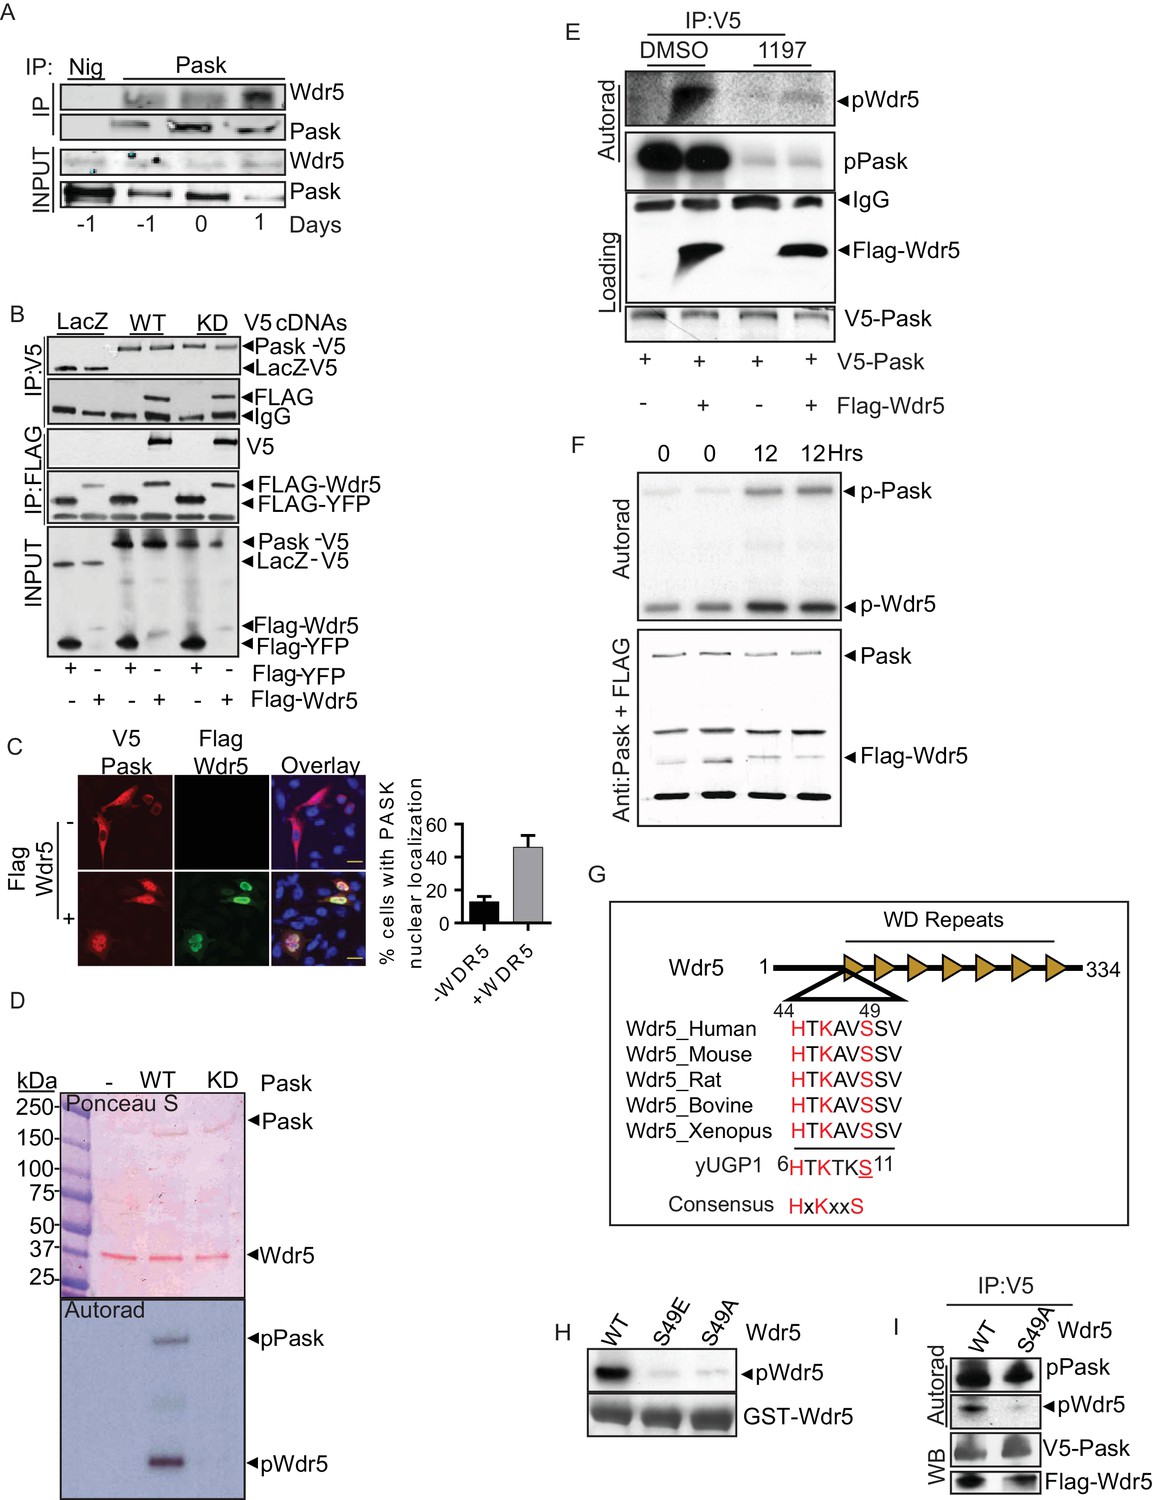
Pask directly interacts with and phosphorylates Wdr5 at Ser49.
(A) Endogenous Pask was immunoprecipitated from C2C12 cells, either before (day -1, 0) or after induction of differentiation (Day 1). Immunoprecipitates were analyzed by western blot for Pask and Wdr5, indicating an enrichment of co-immunoprecipitation at Day 1 of differentiation. (B) V5-tagged LacZ, WT Pask or KD (K1028R) Pask was co-expressed with Flag-YFP or Flag-Wdr5 in 293T cells. V5 or Flag-tagged proteins were immunoprecipitated and examined by western blot using anti-Flag or V5 antibody. (C) V5-hPask was expressed in HEK293T cells with control or Flag-Wdr5 vector. V5 and Flag were stained using Alexa Flour 568 or Alexa Flour 488, respectively. The fraction of cells with nuclear Pask localization was scored as a function of the presence (+) or absence (−) of Wdr5. (D) In vitro phosphorylation of purified His-Wdr5 was performed using WT or KD Pask and analyzed by autoradiogram of the reaction mixture after western blotting, with total protein visualized by Ponceau S staining. pPask indicates autophosphorylation of WT-Pask during kinase reaction. (E) The Pask-Wdr5 complex was immunoprecipitated from cells incubated with 32P in the presence of DMSO or 25 µM BioE-1197. Immunoprecipitates were analyzed by SDS-PAGE and autoradiography or western blot. (F) Endogenous Pask was immunoprecipitated from C2C12 cells growing in growth media or 12 hr after replacement with differentiation media containing 10 nM Insulin and was incubated with purified Flag-Wdr5 and [γ-32P] ATP. Autoradiogram shows incorporation of 32P into Pask (p-Pask) and Wdr5 (p-Wdr5). (G) Schematic showing Ser49 and upstream sequence in Wdr5, compared to the site of Pask phosphorylation in Ugp1, a bona fide substrate of S. cerevisiae Pask. (H) GST-tagged WT, S49A or S49E Wdr5 was incubated with Pask and [γ-32P] ATP and phosphorylation was detected by autoradiography after SDS-PAGE. (I) WT or S49A Wdr5 was co-immunoprecipitated with Pask from cells incubated with 32P-phosphate and analyzed as in (E).
Figure 4—figure supplement 1

Pask directly interacts with and phosphorylates Wdr5 at Ser49.
(A) Flag-tagged YFP or indicated members of various protein complexes of which Wdr5 is a member were expressed in 293T cells. Flag tagged proteins were immunoprecipitated using anti-Flag antibody. Co-immunoprecipitation of Pask was detected via western blotting of anti-Flag immunoprecipitates. (B) Bacterially purified GST-Wdr5 or GST control was attached to glutathione sepharose and purified His-tagged Pask was passed over and the beads were washed extensively. Bound protein was detected by Coomassie staining or anti-Pask immunoblot. (C) Domain truncation of Pask to determine Wdr5 binding region. V5-tagged versions of various Pask truncation mutants were co-expressed with Flag-Wdr5 in HEK293T cells. Wdr5 was detected using anti-Flag antibody after V5 immunoprecipitation. (D) In vitro phosphorylation of Wdr5 by Pask in the presence of DMSO or 25 µM 1197 as described in the Experimental Procedures. (E) Bacterially purified GST-(Flag)-WT, S49A or S49E Wdr5 were used for GST pull-down assays of Pask as in (B). (F) HEK293T cells expressing Flag tagged YFP or the indicated Wdr5 variants were lysed and Flag-tagged proteins were imunoprecipitated. Endogenous interaction of various members of protein complexes with WT or mutant Wdr5 were determined by Western blotting using the indicated antibodies.
Figure 5 with 1 supplement
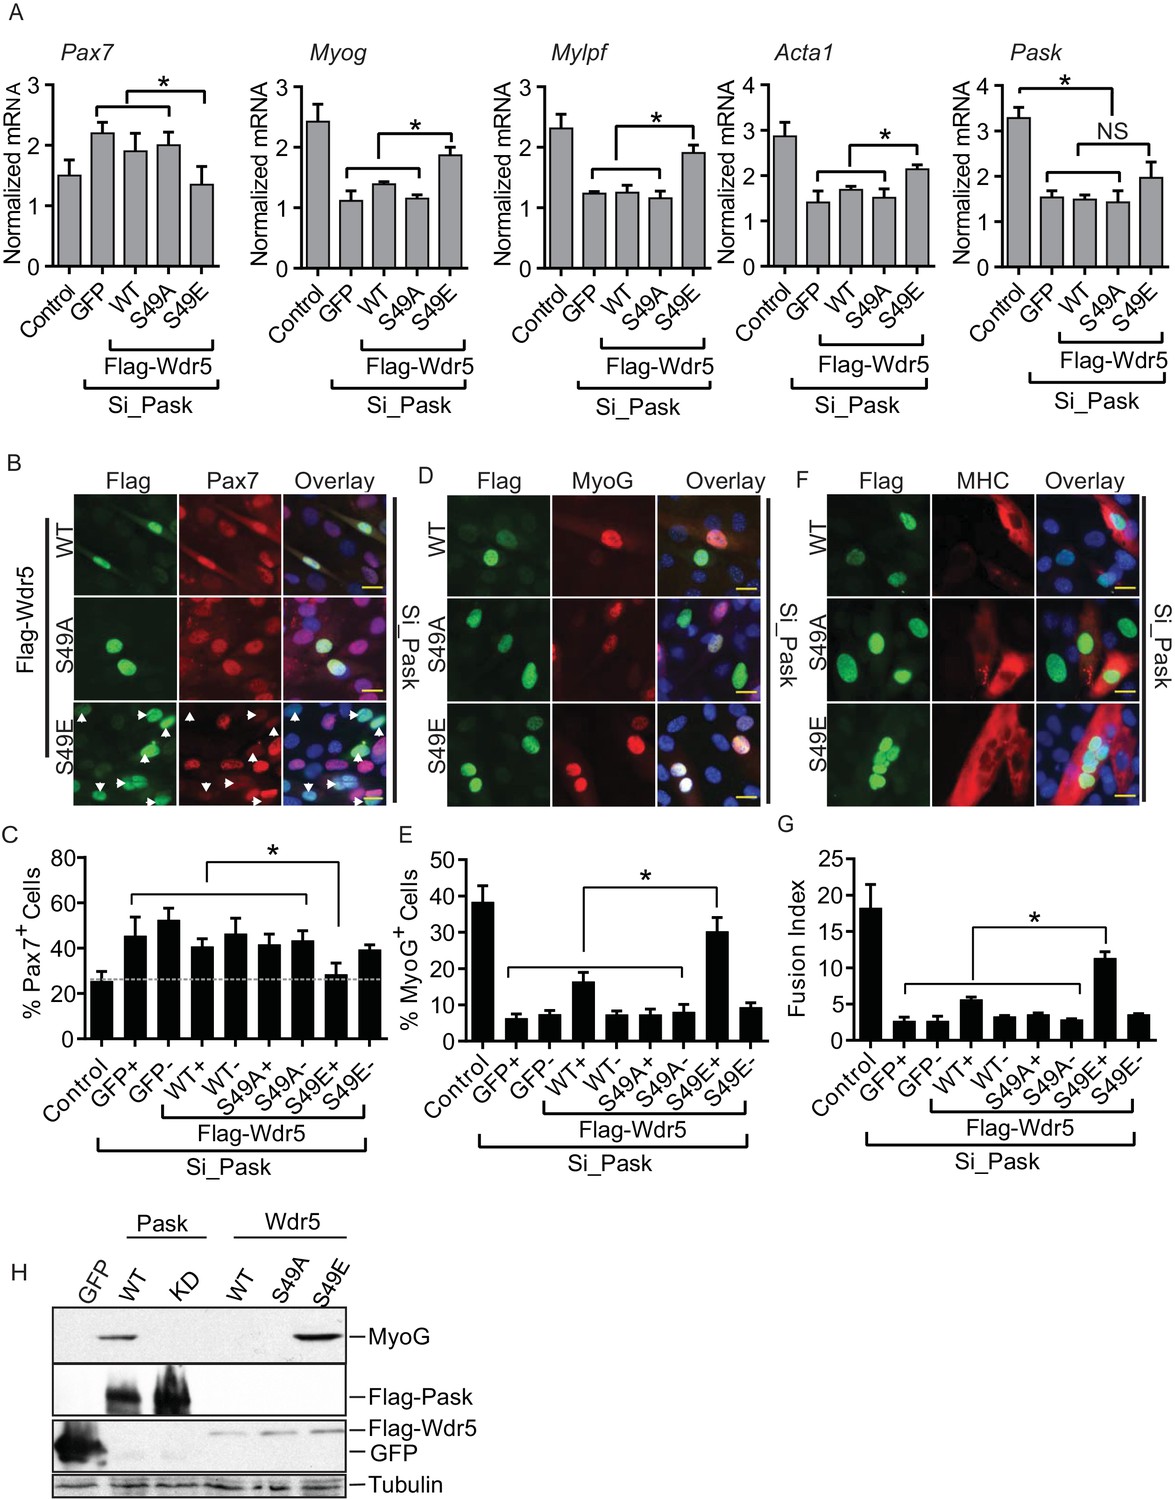
The phospho-mimetic S49E Wdr5 mutant rescues myogenesis in Pask-silenced cells.
(A) GFP or WT, S49A or S49E Wdr5 were retrovirally expressed in Pask-siRNA C2C12 cells. qRT-PCR analysis was performed for the indicated mRNA on day 3 of differentiation. 18S rRNA was used as normalizer. n = 3. Error bars ± S.D *p<0.05. (B) Flag-tagged WT, S49A or S49E Wdr5 was expressed in Pask-siRNA C2C12 cells. After 24 hr, cells were stained for Pax7 at Day 0 of differentiation. Arrows show Wdr5S49E-expressing cells and the corresponding cell autonomous decrease in Pax7 expression. Scale bar = 20 µM. (C) Quantification of percent Pax7+ cells from (B) as a function of the presence (+) or absence (−) of GFP or Wdr5. n = 3 independent experiments each with 100 cells counted. Error bars ± S.D. *p<0.05. (D) As in (B), except cells were stained for MyoG on Day 1 of differentiation. (E) Quantification of percent MyoG+ cells from (D) as a function of the presence (+) or absence (−) of GFP or Wdr5. n = 3 independent experiments each with 100 cells counted. Error bars ± S.D. *p<0.05. (F) As in (B), except cells were stained for MHC on Day 3 of differentiation. (G) Quantification of fusion index from (F) as a function of the presence (+) or absence (−) of GFP or Wdr5. n = 3 independent experiments each with 100 cells counted. Error bars ± S.D. *p<0.05. (H) C2C12 myoblasts were infected with retrovirus expressing GFP, Flag tagged WT or KD Pask or WT, S49A or S49E Wdr5 and infected cells were selected with puromycin in growth media for 48 hr. Cells were lysed after selection and abundance of the indicated proteins was determined by Western blotting.
-
Figure 5—source data 1
Quantification of the Pax7+ and MyoG+ cell numbers and the fusion index in Wdr5S49E expressing cells.
- https://doi.org/10.7554/eLife.17985.019
Figure 5—figure supplement 1

Wdr5S49E expression rescues genetic loss of Pask.
C2C12 myoblasts were transduced with retrovirus carrying WT, S49A or S49E mutants of Wdr5 and were selected with 3µg/ml puromycin for 48 hr. Pask (or control) was knocked down at 70% cell density in these populations by pooled Pask siRNA. 24 hr after siRNA treatment, differentiation was initiated with 2% horse serum-containing media.
Figure 6
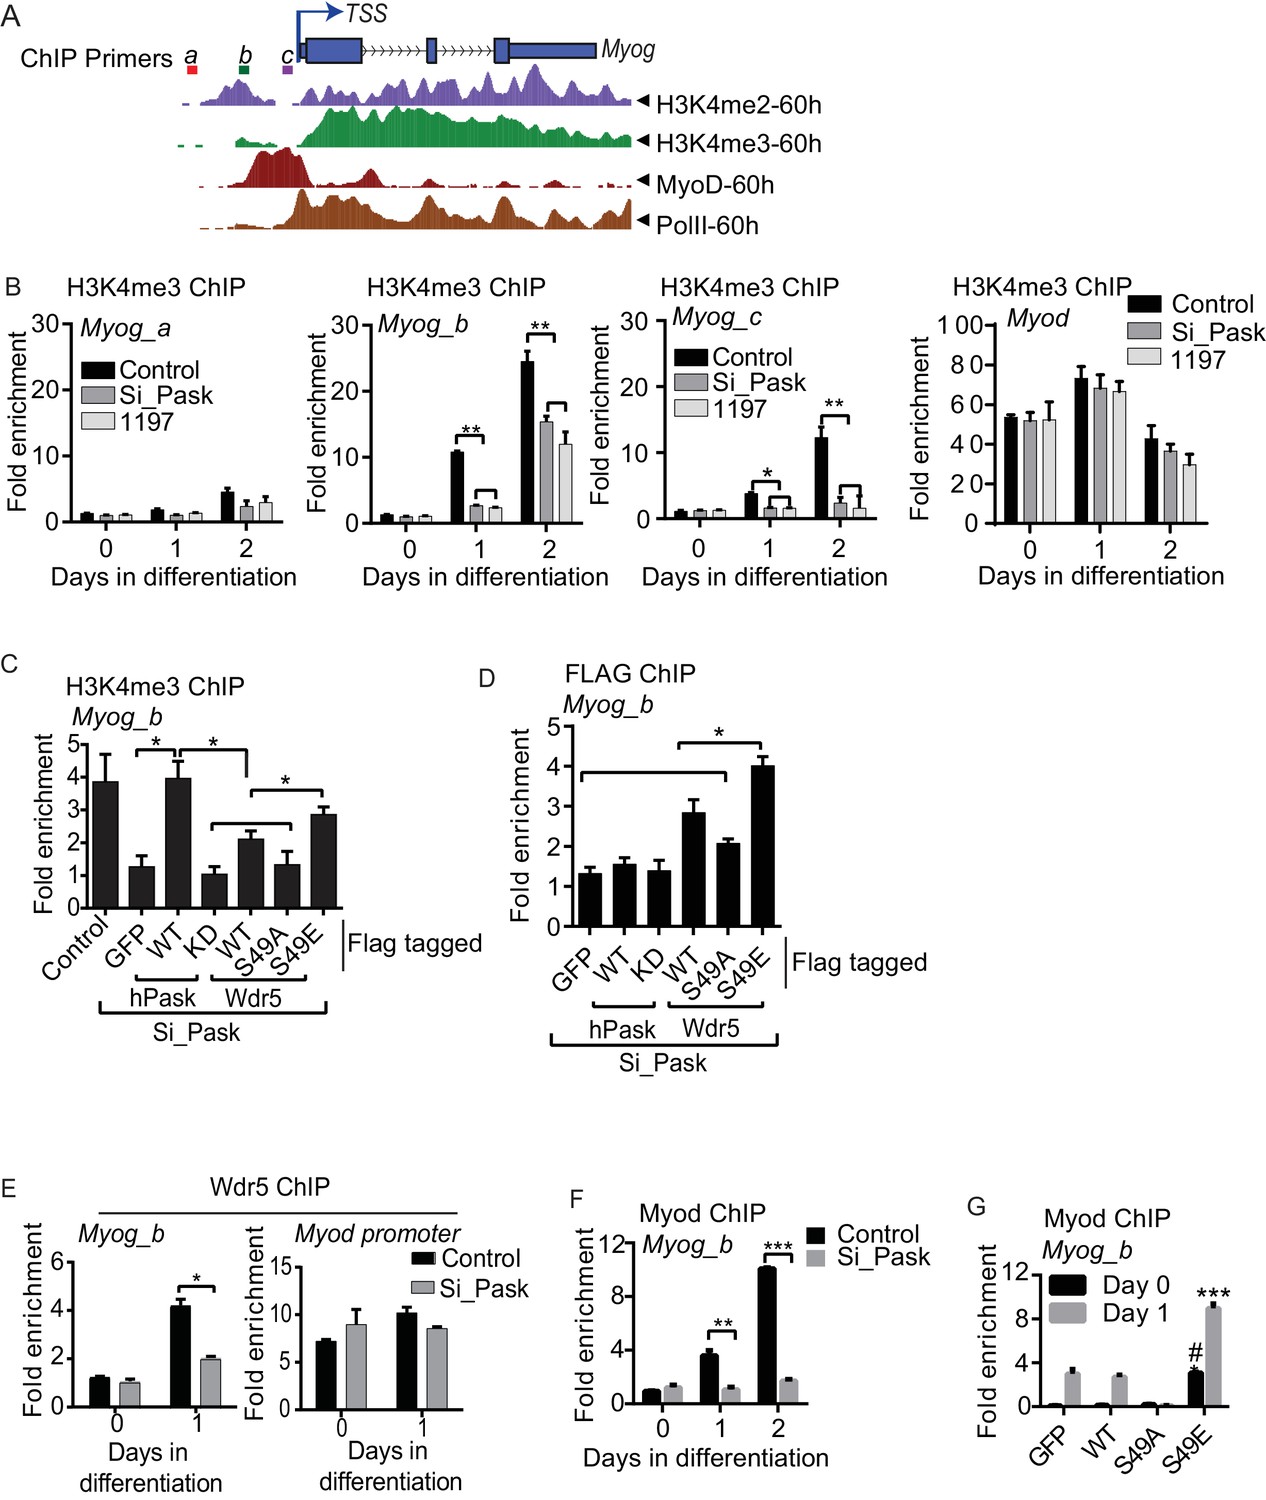
Pask is required for recruitment of Wdr5 and MyoD to the Myog promoter during differentiation.
(A) A depiction of the Myog genomic locus depicting MyoD and RNAPolII occupancy as well as H3K4me2 and H3K4me3 abundance at 60 hr of differentiation from the ENCODE dataset for the C2C12 cell line. TSS: Transcription Start Site. Colored horizontal bars indicate the positions of ChIP amplicons a, b or c. (B) Fold H3K4me3 enrichment in control, Pask-siRNA or BioE-1197-treated C2C12 cells was assessed by ChIP-qPCR of the indicated amplicon followed by normalization against H3K4me3-deficient negative control region of the actb gene. n = 3. Error bars ± S.D. *p<0.05, **p<0.005. Because the b amplicon showed the most significant enrichment of H3K4me3 in control samples, it was selected for future studies. (C) H3K4me3 ChIP was performed from control or Pask silenced C2C12 cells expressing GFP, WT or KD Pask or WT, S49A or S49E Wdr5 at Day 1 of differentiation. n = 3. Error bars ± S.D. *p<0.05. (D) Flag ChIP was performed from Pask silenced C2C12 cells expressing GFP, WT or KD Pask or WT, S49A or S49E Wdr5 at Day 1 of differentiation. n = 3. Error bars ± S.D. *p<0.05. (E) Endogenous Wdr5 ChIP was performed from control or Pask-siRNA C2C12 cells at Day 0 or Day 1 of differentiation and fold enrichment on the Myog promoter was determined by qRT-PCR. Error bars ± S.D. *p<0.05. (F) MyoD ChIP was performed from control or Pask-siRNA C2C12 cells at Day 0, Day 1 or Day 2 of differentiation and fold enrichment of MyoD occupancy on the Myog promoter was determined by qRT-PCR. n = 3. Error bars ± S.D. **p<0.05, ***p<0.0005. (G) MyoD ChIP was performed from proliferating (Day 0) or differentiating (Day 1) C2C12 cells expressing GFP, Wdr5WT, Wdr5S49A or Wdr5S49E. n = 3. Error bars ± S.D. #, ***p<0.0005, Wdr5 S49E vs GFP, Wdr5WT or Wdr5S49A at Day 0 and Day 1 respectively.
-
Figure 6—source data 1
Numerical values from the ChIP analysis represented in Figure 6.
- https://doi.org/10.7554/eLife.17985.022
Figure 7 with 1 supplement
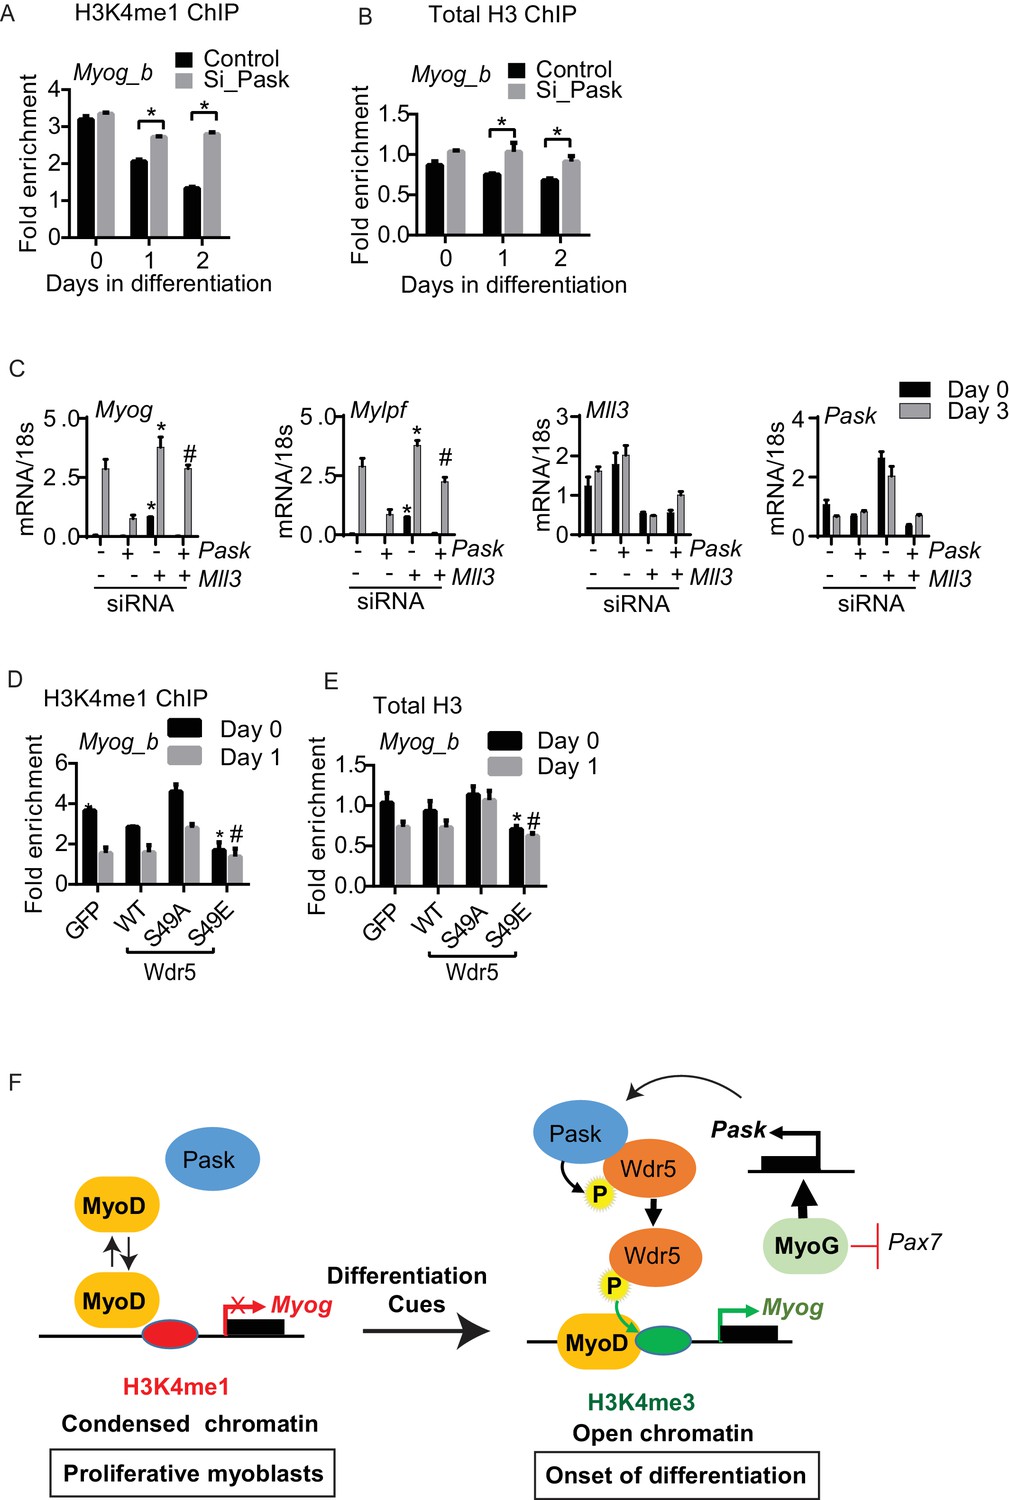
Differentiation induced H3K4me1 to H3K4me3 conversion is dependent upon Pask phosphorylation of Wdr5.
(A) H3K4me1 and (B) total H3 ChIP were performed from control or Pask-siRNA C2C12 cells at the indicated day of differentiation and fold enrichment on the Myog promoter was determined by qRT-PCR using primer set b. Error bars ± S.D. *p<0.05, **p<0.005. (C) The differentiation potential of C2C12 myoblasts subjected to Pask or Mll3 siRNA treatments was assessed by qRT-PCR using primers specific for Myog, Mylpf, Mll3 and Pask. (D) H3K4me1 or (E) total H3 ChIP was performed from proliferating (Day 0) or differentiating (Day 1) C2C12 cells expressing GFP, Wdr5WT, Wdr5S49A or Wdr5S49E. n = 3. Error bars ± S.D. *,#p<0.05, Wdr5 S49E vs GFP, Wdr5WT or Wdr5S49A at Day 0 and Day 1 respectively. (F) Model depicting the role of Pask and Wdr5 phosphorylation in regulating MyoD recruitment to the Myog promoter during differentiation. See Discussion for detail.
-
Figure 7—source data 1
Numerical values from the ChIP analysis represented in Figure 7.
- https://doi.org/10.7554/eLife.17985.024
Figure 7—figure supplement 1

Pask and phosphomimetic Wdr5 promote H3K4me1 to H3K4me3 conversion and MyoD recruitment to the Myog promoter.
(A) Depiction of the Myog locus showing abundance of position of enhancer and promoter region as well as H3K4me3 levels and MyoD occupancy 60 hr after initiation of differentiation from ENCODE datasets deposited by Barbara Wold lab. (B) ChIP-qPCR analyzing of differentiation time course of Control vs Pask silenced C2C12 cells using MyoD, H3K4me1, H3K27ac and H3K4me3 antibodies. Primers for enhancer and promoters are situated inside the boxed region depicted in figure supplement 6A. Actb negative region was used as normalizer. *p<0.05, **p<0.005, ***p<0.001 (C) H3K4me1 ChIP of control and Pask silenced C2C12 cells using primers spanning the indicated gene and position relative to the TSS. actb negative control region was used as the normalizer. *p<0.05, **p<0.005. (D) H3K4me3 ChIP of control and Pask silenced C2C12 cells using primers spanning the indicated gene and position relative to the TSS. actb negative control region was used as the normalizer. *p<0.05, **p<0.005, ***p<0.001.
Author response image 1

Wdr5 silencing affects proliferation rate in C2C12 myoblasts.
https://doi.org/10.7554/eLife.17985.026
Author response image 2

Wdr5 silencing suppresses myotube formation in C2C12 myoblasts.<Author response image 2>
https://doi.org/10.7554/eLife.17985.027
Author response image 3

Wdr5 is required expression of myogenin (MyoG) and myosin (MHC) during differentiation in C2C12 myoblasts.
https://doi.org/10.7554/eLife.17985.028
Author response image 4

C2C12 cells were infected with retrovirus expressing GFP (Control) or WT, S49A or S49E‐Wdr5 cDNAs. 24 hrs after infection, puromycin selection was performed for four days.
1000 cells from each samples were plated into 96 well plates and after two days, total cell number was counted for each cell types.
Author response image 5

H3K4me3 ChIP was performed from C2C12 myoblasts after control or MyoD knockdown expressing WT, S49A or S49E WDR5 mutants at Day 0 and Day 1 of differentiation.
* P<0.05 between Wdr5S49E vs. Wdr5WT at Day 0 in control samples.
Author response image 6

Representative images of C2C12 myoblasts at Day 1 of differentiation after control or MyoD knockdown in WT, S49A or S49E WDR5 mutants expressing cells.
https://doi.org/10.7554/eLife.17985.031Download links
A two-part list of links to download the article, or parts of the article, in various formats.
Downloads (link to download the article as PDF)
Open citations (links to open the citations from this article in various online reference manager services)
Cite this article (links to download the citations from this article in formats compatible with various reference manager tools)
Pask integrates hormonal signaling with histone modification via Wdr5 phosphorylation to drive myogenesis
eLife 5:e17985.
https://doi.org/10.7554/eLife.17985


