In vivo genetic dissection of tumor growth and the Warburg effect
- University of California, Los Angeles, United States
Figures
Figure 1 with 1 supplement

LDH induction by a single activated oncogene.
Wing discs are from wandering third instar larvae. Scale bars, 50 μm. (a–b) LDH enzymatic activity is induced by Pvract (full genotype: dppblk-1-Gal4, UAS- GFP, UAS-Pvract) stained for LDH activity (brown precipitate). The green channel is not shown in this panel for clarity. (a) Control, (dpp-Gal4, UAS-GFP) no detectable LDH enzymatic activity. (b) Expression of Pvract (dpp-Gal4, UAS-GFP, UAS-Pvract) induces LDH activity. (c–j) LDH-GFP transgene induction (shown in green) monitors the expression of LDH. Nuclei are marked with To-Pro (blue). Full genotype in each panel includes the driver (dppblk-1-Gal4), a UAS-transgene as indicated and mCherry to mark expressing cells (red channel omitted for clarity). (c) Control. No LDH-GFP expression is detected in dpp-Gal4, UAS-mCherry wing disc. (d) Pvract (dpp-Gal4, UAS-mCherry, UAS-Pvract) causes robust LDH-GFP induction. (e–j) Either no expression or very mild expression (arrows in e, h) of LDH is seen when Rasact (e), wingless (f), unpaired (g), yorkie (h), InRact (i), or Egfract (j) transgenes are expressed under the control of dpp-Gal4 in the wing disc.
Figure 1—figure supplement 1
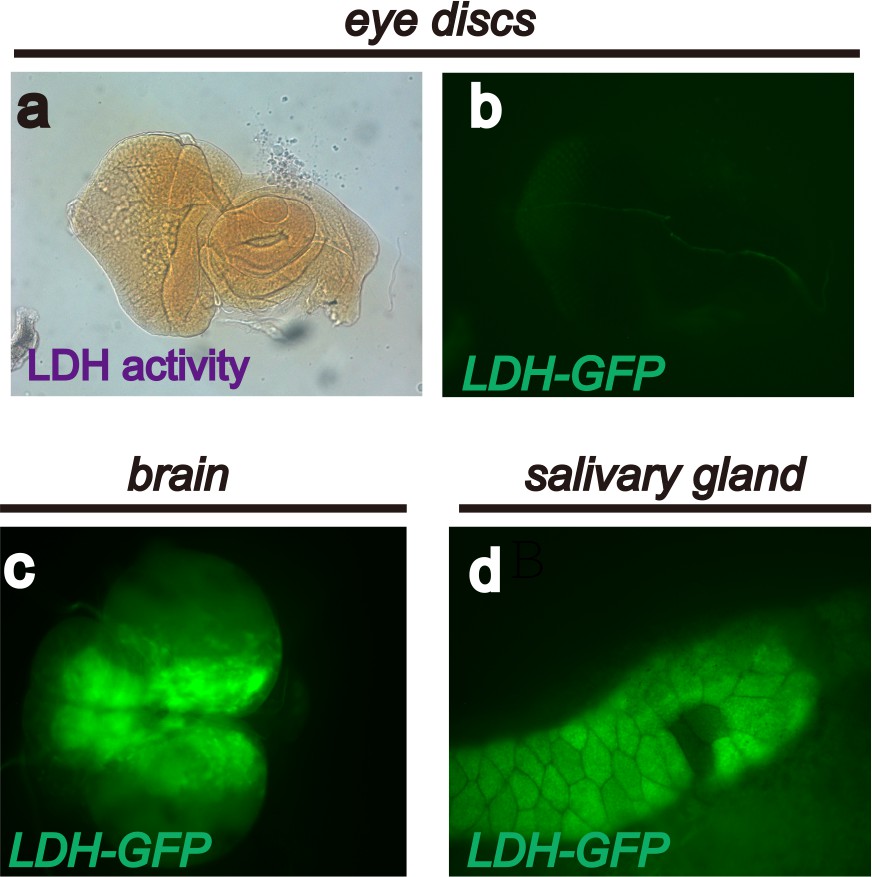
Endogenous LDH activity and expression in Drosophila larval tissues.
A limited number of Drosophila larval tissues are endogenously glycolytic and express active LDH protein. The expression assay (using the LDH-GFP transgene) and activity assay (using histochemical methods) result from glycolytic activation caused by oncogene activation. See text and Figure 1. These panels show that no LDH activity (a), or LDH-GFP expression (b) is detectable in wild-type eye discs. Strong endogenous LDH-GFP expression is evident in the larval brain (c) and salivary gland (d).
Figure 2 with 1 supplement
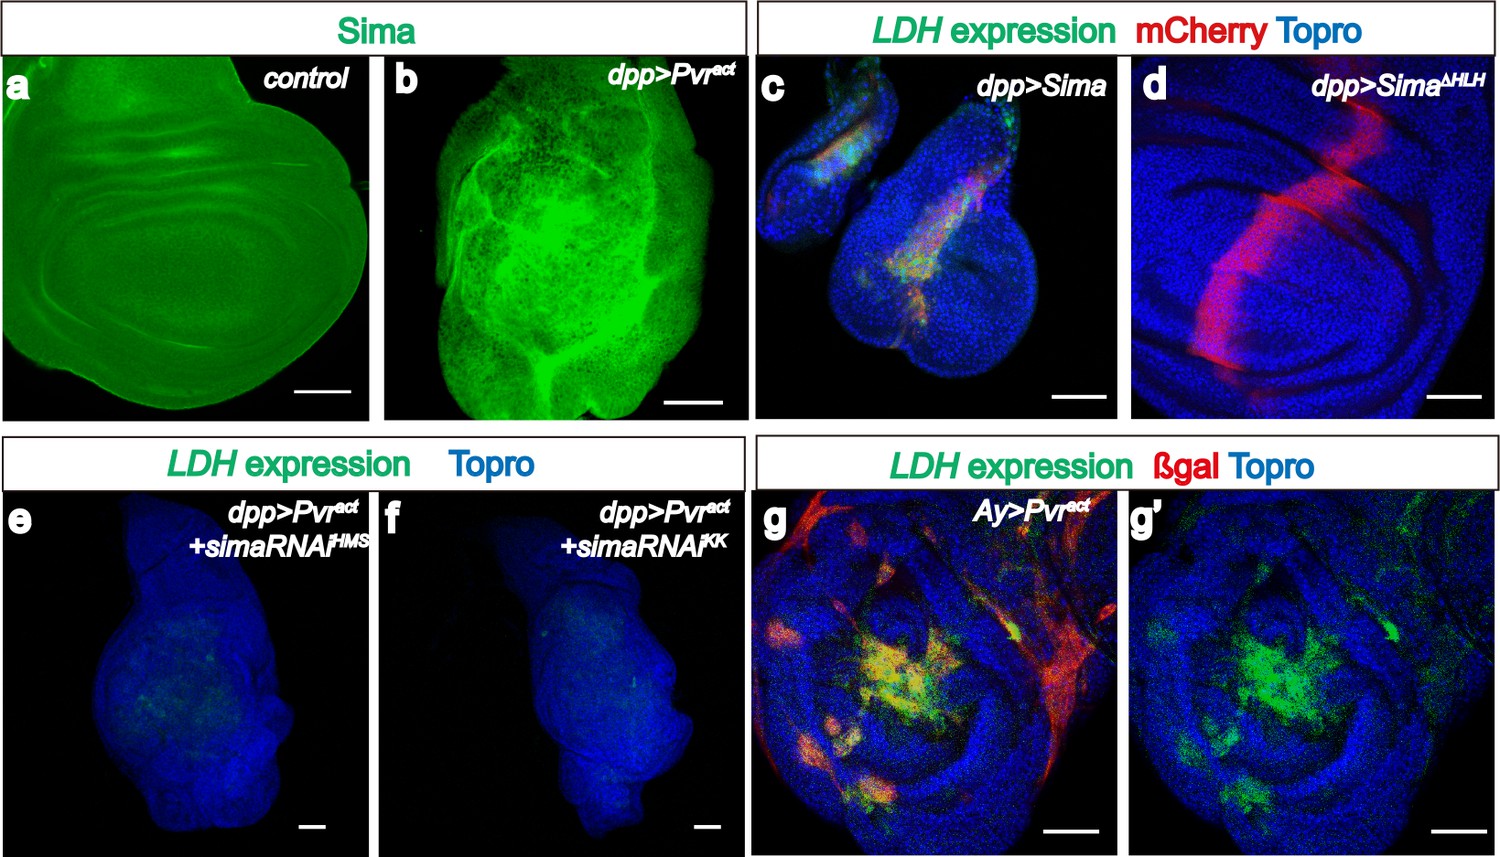
Sima mediates LDH expression.
All wing discs shown are from wandering third instar larvae. All transgenes are driven using dppblk-1-Gal4. Scale bars, 50 μm. Nuclei are marked with To-Pro (blue). (a–b) Sima protein accumulation upon Pvract expression is detected with an α-Sima antibody (green). The expression domains are independently marked (not shown for clarity). (c–d) Direct overexpression of Sima protein (c), but not Sima lacking DNA-binding domain (d) leads to LDH-GFP (green) expression. mCherry (red) independently marks the zone of expression. (e–f) Two independent RNAi constructs against Sima (simaRNAiHMS and simaRNAiKK) can each suppress Pvract-induced expression of LDH-GFP. (g–g’) Ay-Gal4 induced small clones expressing Pvract (g, marked in red) autonomously induces LDH-GFP (green) (hs-flp, UAS-lacZ, UAS-Pvract).
Figure 2—figure supplement 1
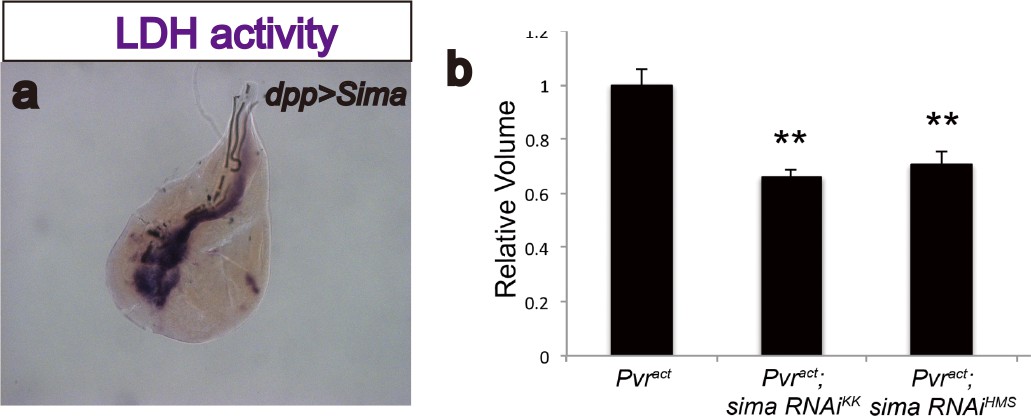
Sima (Drosophila Hif-α) regulates LDH activity and has moderate effects on tumor growth.
(a) Overexpression of sima is sufficient to induce LDH activity. Expression of sima in the third-instar imaginal wing disc (driven by dppblk-1-Gal4) induces robust LDH activity staining (brown precipitate). (b) Total wing disc volume (see Materials and methods ) is calculated for each genotype, and averages for each are quantified relative to expression of Pvractalone. At least 10 wing discs are averaged per genotype per experiment. Error bars indicate standard error of the mean. Values for each genotype are compared to corresponding control (Pvract alone) using a t-test, and p-values are indicated using asterisks (* indicates p<0.05; ** indicates p<0.001). Actual p-values are as follows: sima RNAiKK106187, p=1.6 × 10⁻⁴; sima RNAiHMS00832, p=8.4 × 10⁻⁴.
Figure 3 with 1 supplement

Downstream of Pvract, ERK and PI3K pathways control Sima translation.
All wing discs shown are from wandering third instar larvae. All transgenes are expressed using the dppblk-1-Gal4 driver. Scale bars, 50 μm. (a–f) Differential activation of ERK and PI3K pathways by RTKs. Phospho-specific antibodies against dp-ERK (a–c, green) or p-Akt (d–f, green) are used to detect activation of the corresponding pathways. (a–c) dp-ERK staining is seen in in Egfract(a) and Pvract(c) backgrounds, but not upon activation of InR (b). (d–f) In contrast to (a–c), p-Akt is detected upon activation of InR (e) and Pvr (f) but not Egfr (d). Thus only Pvract causes both the ERK (assayed by ERK phosphorylation) and PI3K (assayed by Akt phosphorylation) pathways to be activated. (g–v) Both PI3K and ERK pathways must be activated for LDH-GFP induction. Expression of LDH-GFP (green) marks glycolytic tissue. In (r), the Ay-Gal4 system is used to generate clones with nuclear β-Galactosidase staining (red) marking the clones. LDH-GFP (green) expression (g; Pvract control) is suppressed upon loss of ERK pathway members Ras (using a dominant negative, h), Downstream of Raf1, (Dsor1, using an RNAi construct, i), and ERK (Rolled, using an RNAi construct, j). (k–n) PI3K pathway components are also essential for LDH-GFP expression. LDH-GFP (green) expression (g; Pvract control) is suppressed upon loss of PI3K pathway members Ras (using a dominant negative, h), PI3K (using an RNAi construct, k or a dominant negative version, l), Akt (using an RNAi construct, m), or TOR (RNAi; n). (o–r) ERK and PI3K pathways must be co-activated for LDH expression. (o–p) Single activation of the ERK pathway (using hRafact; o), or of the PI3K pathway (using PI3Kact; p) is insufficient for LDH-GFP expression. (q,r) Co-activation of both pathways by co-expression of hRafact and PI3Kact together, either using a dpp-Gal4 driver (q) or in small Ay-Gal4-derived clones (r) induces robust LDH-GFP expression. (s–v) Translational regulators are essential for LDH transcriptional control. A dominant-negative form of S6k (s) or overexpression of Thor/4EBP (u), both acting downstream of PI3K as well as loss of a single copy of Mnk/Lk6 (t), functioning downstream of ERK, abolish transcription of LDH-GFP. In contrast, loss of the major transcriptional factor in the ERK pathway, the ETS domain protein, Pointed (v) has no effect on LDH transcription.
Figure 3—figure supplement 1

PI3K and ERK pathway members are required for Sima accumulation.
All wing disc images shown are obtained from wandering third instar larvae. Sima protein accumulation detected by using α-Sima antibody (green). All transgenes are driven with dppblk-1-Gal4. Scale bars, 50 μm. Knockdown of Dsor1 (a) or Akt (b) suppresses Sima accumulation seen in Pvract background (e). Co-activation of PI3K and ERK pathways is sufficient to induce Sima expression (c–d). Block of the translational module downstream of PI3K (using S6KDN) (f) or ERK (using lk62 mutant) (g) pathway suppresses Sima accumulation seen in Pvract background (e). Knock down of Sima suppresses LDH-GFP expression induced by co-activation of PI3K and ERK pathways (h–i).
Figure 4 with 1 supplement
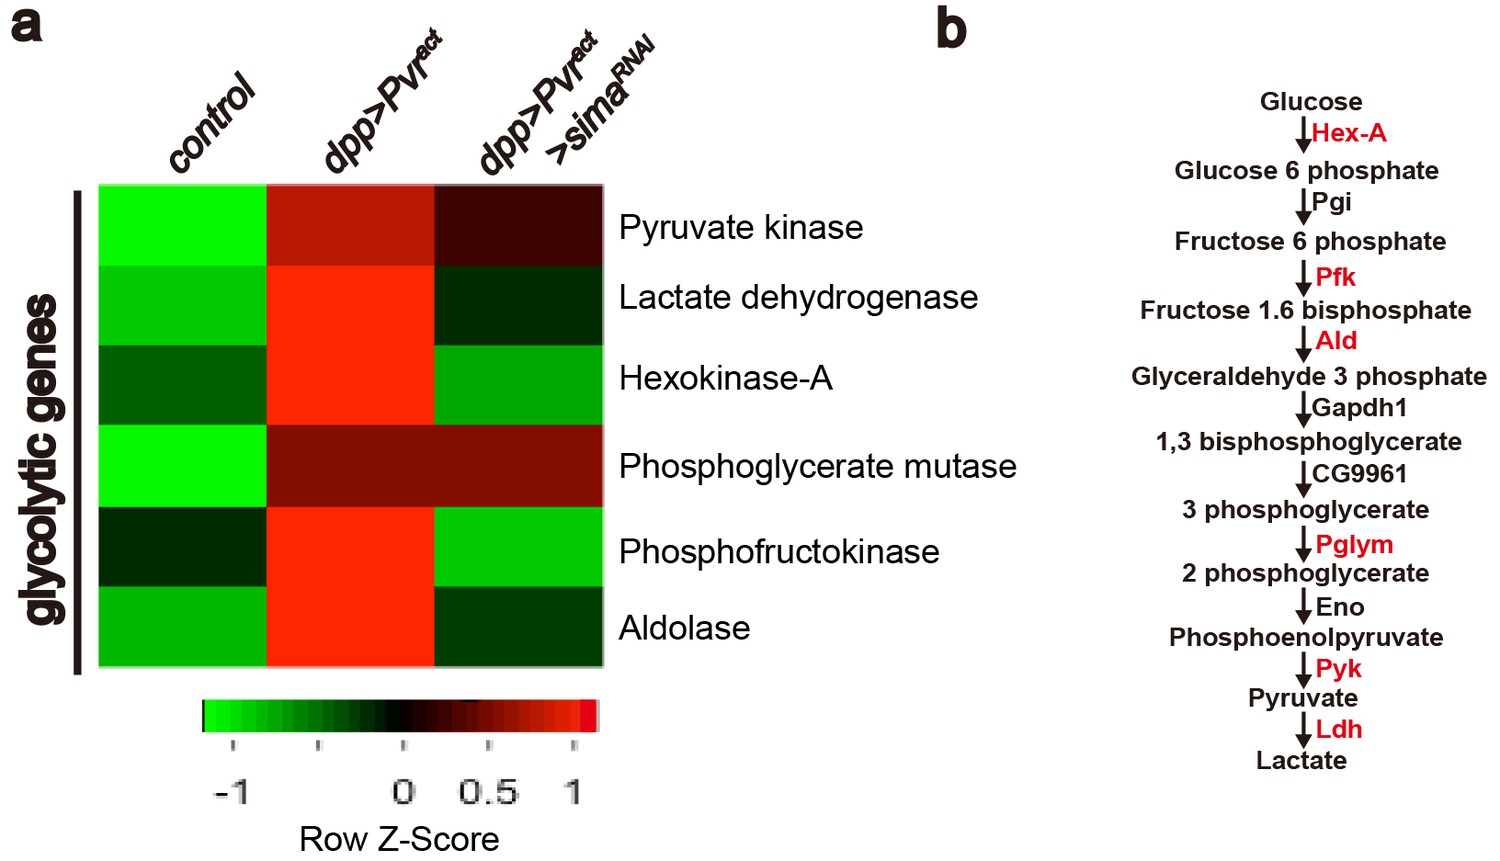
Heat map of sima-dependent glycolytic gene expression.
An unsupervised hierarchical cluster heat map based on differential mRNA expression patterns yielded 73 sima-dependent genes responding to the GO term analysis as metabolic genes (see Figure 4—figure supplement 1). This includes transcripts for six up-regulated enzymes (marked in red) that belong to the glycolytic pathway (b). RNAs for four glycolytic enzymes are induced by Pvract in a Sima dependent manner (a).
Figure 4—figure supplement 1

Expression of 73 metabolic genes are up-regulated by Pvract in a Sima dependent manner.
An unsupervised hierarchical cluster heat map based on differential mRNA expression patterns yielded 73 sima-dependent genes responding to the GO term analysis as metabolic genes. Z-score indicates relative fold change (log2 transformed). Green and red indicate low and high expression, respectively.
Figure 5 with 1 supplement
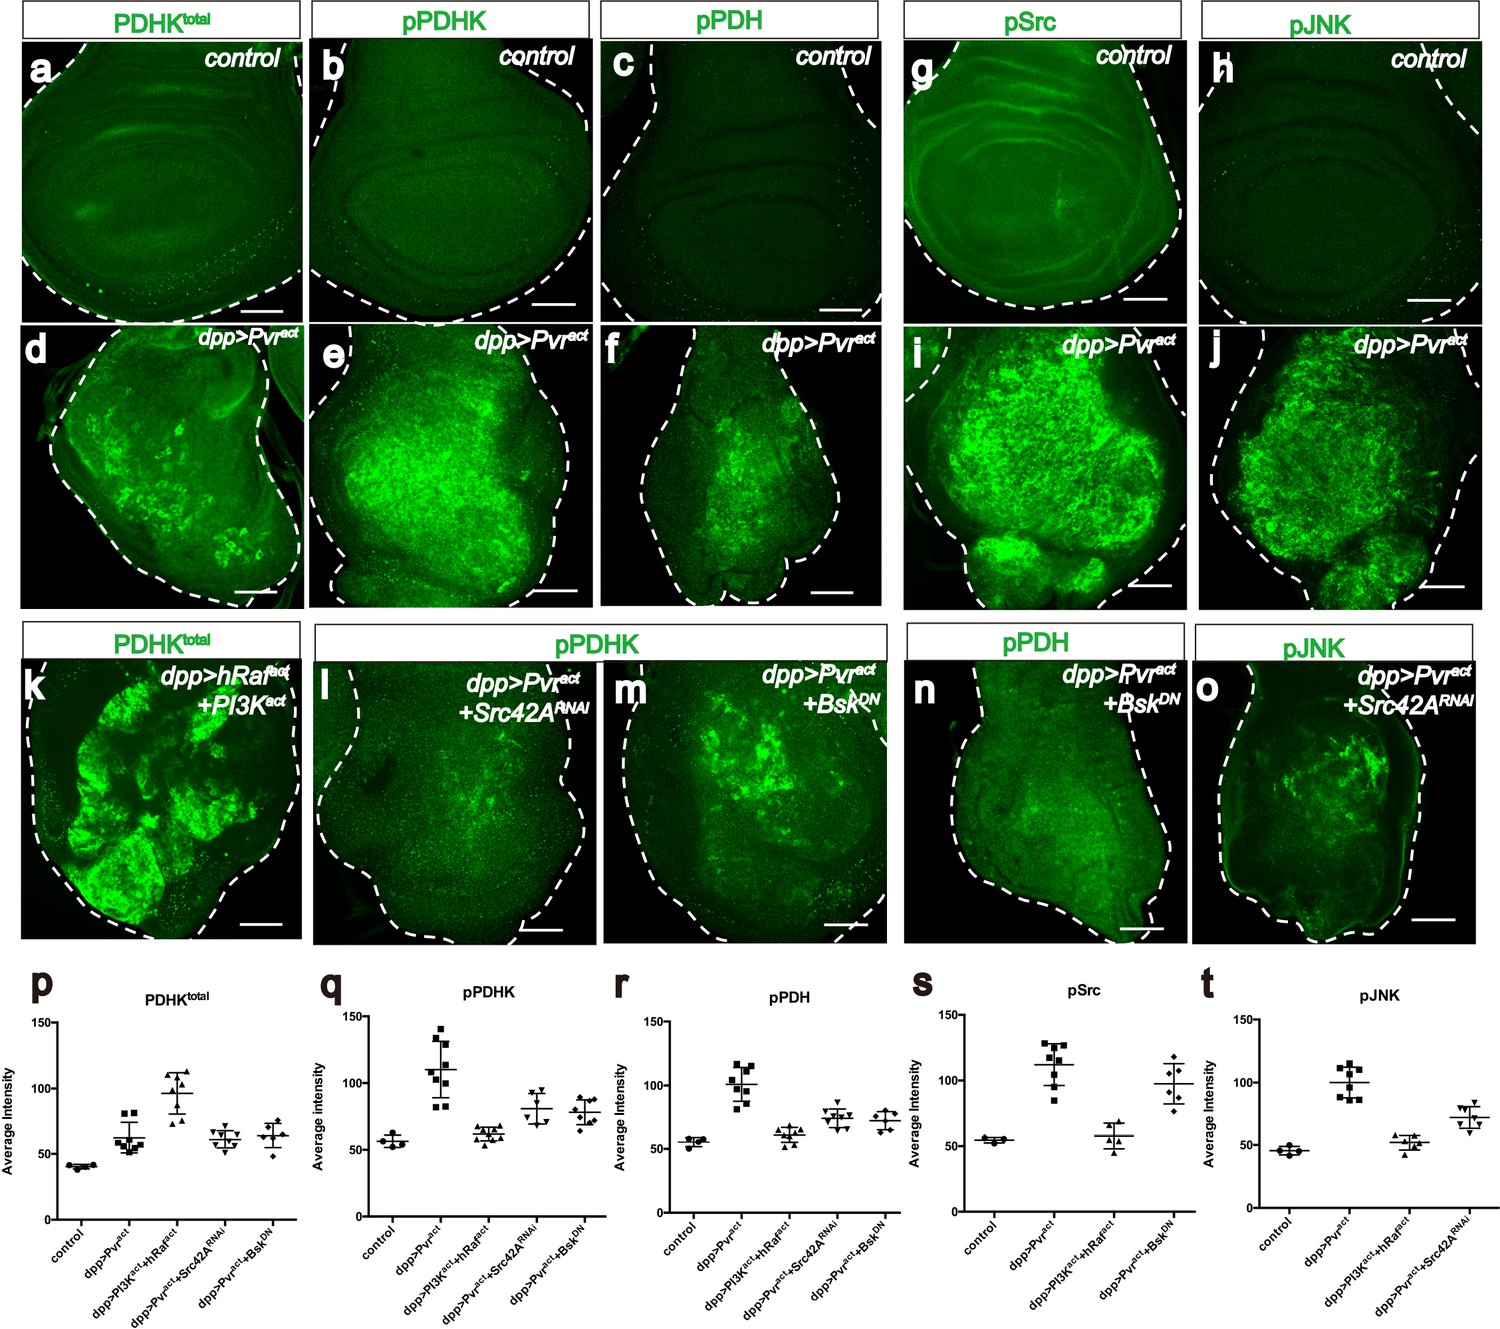
Src42A and JNK inhibit mitochondrial function by regulating PDHK activity.
All wing discs shown are from wandering third instar larvae. All transgenes are expressed using the dppblk-1-Gal4 driver. Scale bars, 50 μm. (a–f) Pvract up-regulates PDHK expression as well as its activity. Total PDHK protein expression detected using an α-PDHK1 antibody (a, d, green) while phospho PDHK-specific antibody detects only the activated form (b, e, green). p-PDH (c, f, green) is detected only if PDH is phosphorylated and inactivated by p-PDHK. Compared to control, Pvract tissue shows elevated expression of PDHKtotal (a, d), p-PDHK (b, e), and p-PDH (c, f). (g–j) Pvract activates Src and JNK. Compared with controls, Pvract tissue shows increased expression of activated Src ((g, i) phospho Src specific, green) and activated p-JNK ((h, j) phospho JNK specific, green). (k) Co-activation of ERK and PI3K pathways dramatically increases PDHKtotal (green) expression, but this PDHK is inactive (see Supplementary Figure 5c). (l–o) Src and JNK activate PDHK, which in turn inactivates PDH. p-PDHK (green) is suppressed upon loss of Src42A (using RNAi; l), or JNK (using a dominant-negative version BskDN; m). (n) Reduction in JNK signaling reduces p-PDH (o) Reduction in Src42A suppresses p-JNK (green) but loss of JNK does not affect p-Src (s) suggesting that JNK functions downstream of Src42A. (p–t) Quantitative analysis of p-PDHK, p-PDH, p-Src, p-JNK expression in various genotypes, indicated in each graph. Error bars indicate standard error of the mean with significance determined by t-test. (p) Activation of either Pvr or a combination of ERK and PI3K pathways causes translational up-regulation of PDHK protein (p=0.0045 and 0.0001), independent of Src and JNK (p=0.7864 and 0.7935). (q) Activation of PDHK by phosphorylation required Src and JNK function (p=0.0086, 0.0005 and 0.0013) downstream of Pvr, but is independent of the PI3K and ERK pathways (p=0.0978). (r) Src and JNK function downstream of Pvr (p=0.0002 and 0.0005), independent of PI3K/ERK pathway (p=0.1201) to inactivate PDH. (s) Pvr activates Src (p=0.0002). This regulation is independent of ERK/PI3K pathways (p=0.6064). (t) JNK phosphorylation requires Src (p=0.0002) but Src phosphorylation does not require JNK (p=0.1117). The regulation of JNK is independent of the ERK and PI3K pathways (p=0.0855).
-
Figure 5—source data 1
The numerical data for Figure 5p–t.
The quantitative intensity values of immuno-stainning (pPDHK, totalPDHK, pPDH, pSrc, pJNK) images between different genotype used in Figure 5p–t are shown.
- https://doi.org/10.7554/eLife.18126.011
Figure 5—figure supplement 1

Pvract induces PDHK translation through ERK and PI3K pathways.
(a–o) All wing disc images shown are obtained from wandering third instar larvae. All transgenes are driven with dppblk-1-Gal4. Scale bars, 50 μm. Phospho-PDH-specific antibody is used to detect inactivation of PDH (a, b, e, f, green). Phospho PDHK, phospho JNK, and phospho Src-specific antibodies are used to detect activation of PDHK, JNK and Src respectively (c, d, g, h, green). Total PDHK protein expression detected using a α-PDHK1 antibody (i–o, green). The dppblk-1-Gal4, UAS Pvractcontrols are shown in the main Figure 5. (a–h) Src/JNK but not ERK/PI3K regulates activity of PDHK and PDH. Compared to Pvract control (see Figure 5f, green), knockdown of PDHK (a), hep (JNKK) (e), or Src42A (f) reduces p-PDH expression. Co-activation of ERK and PI3K pathways is not sufficient to inactive PDH (b, green) or to activate PDHK(c, green). While co-activation of ERK, PI3K and JNK can induce mild p-PDHK expression (d, green). Co-activation of ERK and PI3K pathways is not sufficient to active Src (g, green) or JNK (h, green). (i–q) Both ERK and PI3K pathways are required for PDHK translation. Knockdown of Src42A (i), or block of JNK (j) does not alter PDHK protein expression (green). Single expression of PI3Kact (k) or hRafact(l) is not sufficient to increase PDHK protein (green) amount. Reduction of Akt (m), Dsor1 (n), or elF4E (o) suppresses PDHK expression (green). (p–q) Real-time RT-PCR analysis of LDH and PDHK transcripts. The data were normalized with respect to the expression of RpL10 transcripts. Each experiment is done in triplicate. Compared with control, LDH level significantly increases in Pvract (p=0.0001, p) or hRafact+PI3Kact(p=0.0005, q) background, whereas PDHK level does not (p=0.6577, p; p=0.1941, q).
Figure 6 with 1 supplement

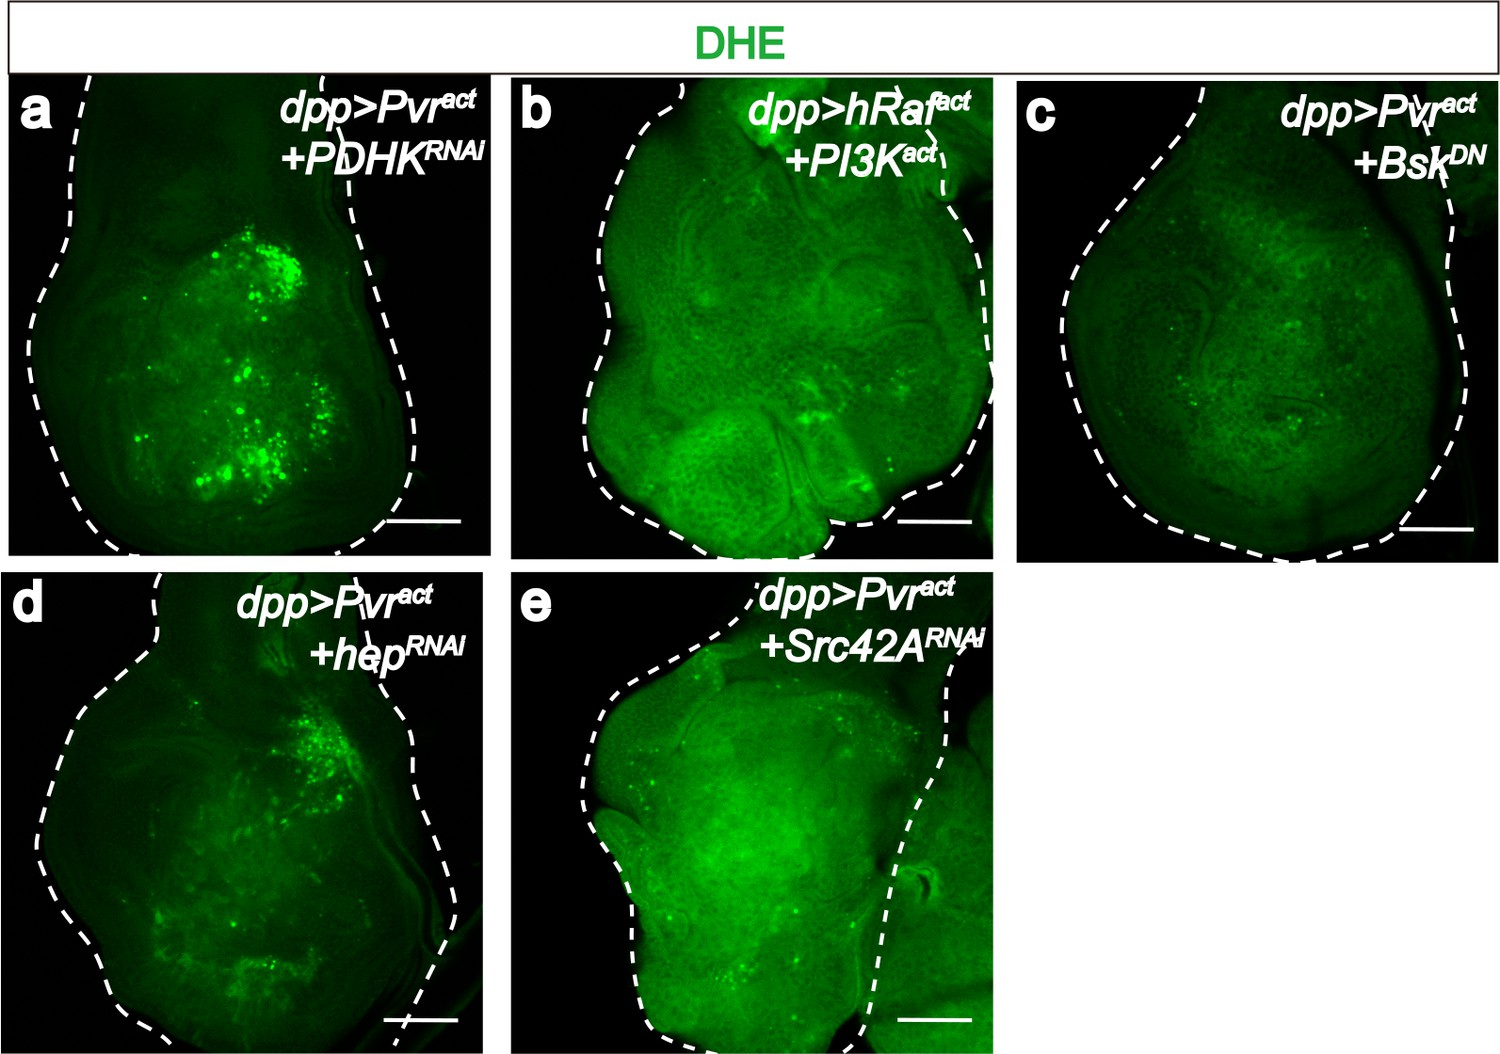
ROS strengthens the metabolic reprogramming.
All wing discs shown are from wandering third instar larvae. All transgenes are expressed using the dppblk-1-Gal4 driver. Nuclei are marked with DAPI (blue; c–l). Scale bars, 50 μm. (a–f) JNK mediates ROS induction. DHE staining (green; a, b) directly monitors ROS levels and gstD-GFP expression (green; c–f) is a measure of oxidative stress caused by the generated ROS. No detectable ROS stress is seen in control discs (a, c), while Pvract causes robust ROS and gstD generation (b, d). Co-expression of hRafact and PI3Kact does not phenocopy Pvract in causing oxidative stress (e). A dominant negative form of JNK (BskDN) effectively suppresses ROS generation (f). (g–m) A ROS feedback signal plays a central role in Pvract induced metabolic reprogramming. Sima accumulation is detected by using an α-Sima antibody (m–n). Pvract induced ROS generation (g), p-JNK expression (i), LDH expression (k), and Sima accumulation (m), are all strongly suppressed by expressing a scavenger gene, Peroxidasin (Pxn h, j, l and n).
Figure 6—figure supplement 1
PDHK and JNK are required for generating ROS in Pvract cells.
All wing disc images shown are obtained from wandering third instar larvae. To monitor oxidative stress, DHE staining (green) is used. All transgenes are driven with dppblk-1-Gal4. Scale bars, 50 μm. Knock down of PDHK (RNAi, a), blocking of JNK signaling (using a dominant negative version of JNK, c), silencing of JNKK (RNAi, d), or silencing of Src42A (RNAi, e) reduces ROS production (green), while co-activation of ERK and PI3K pathways (b) is not sufficient to increase ROS level.
Figure 7
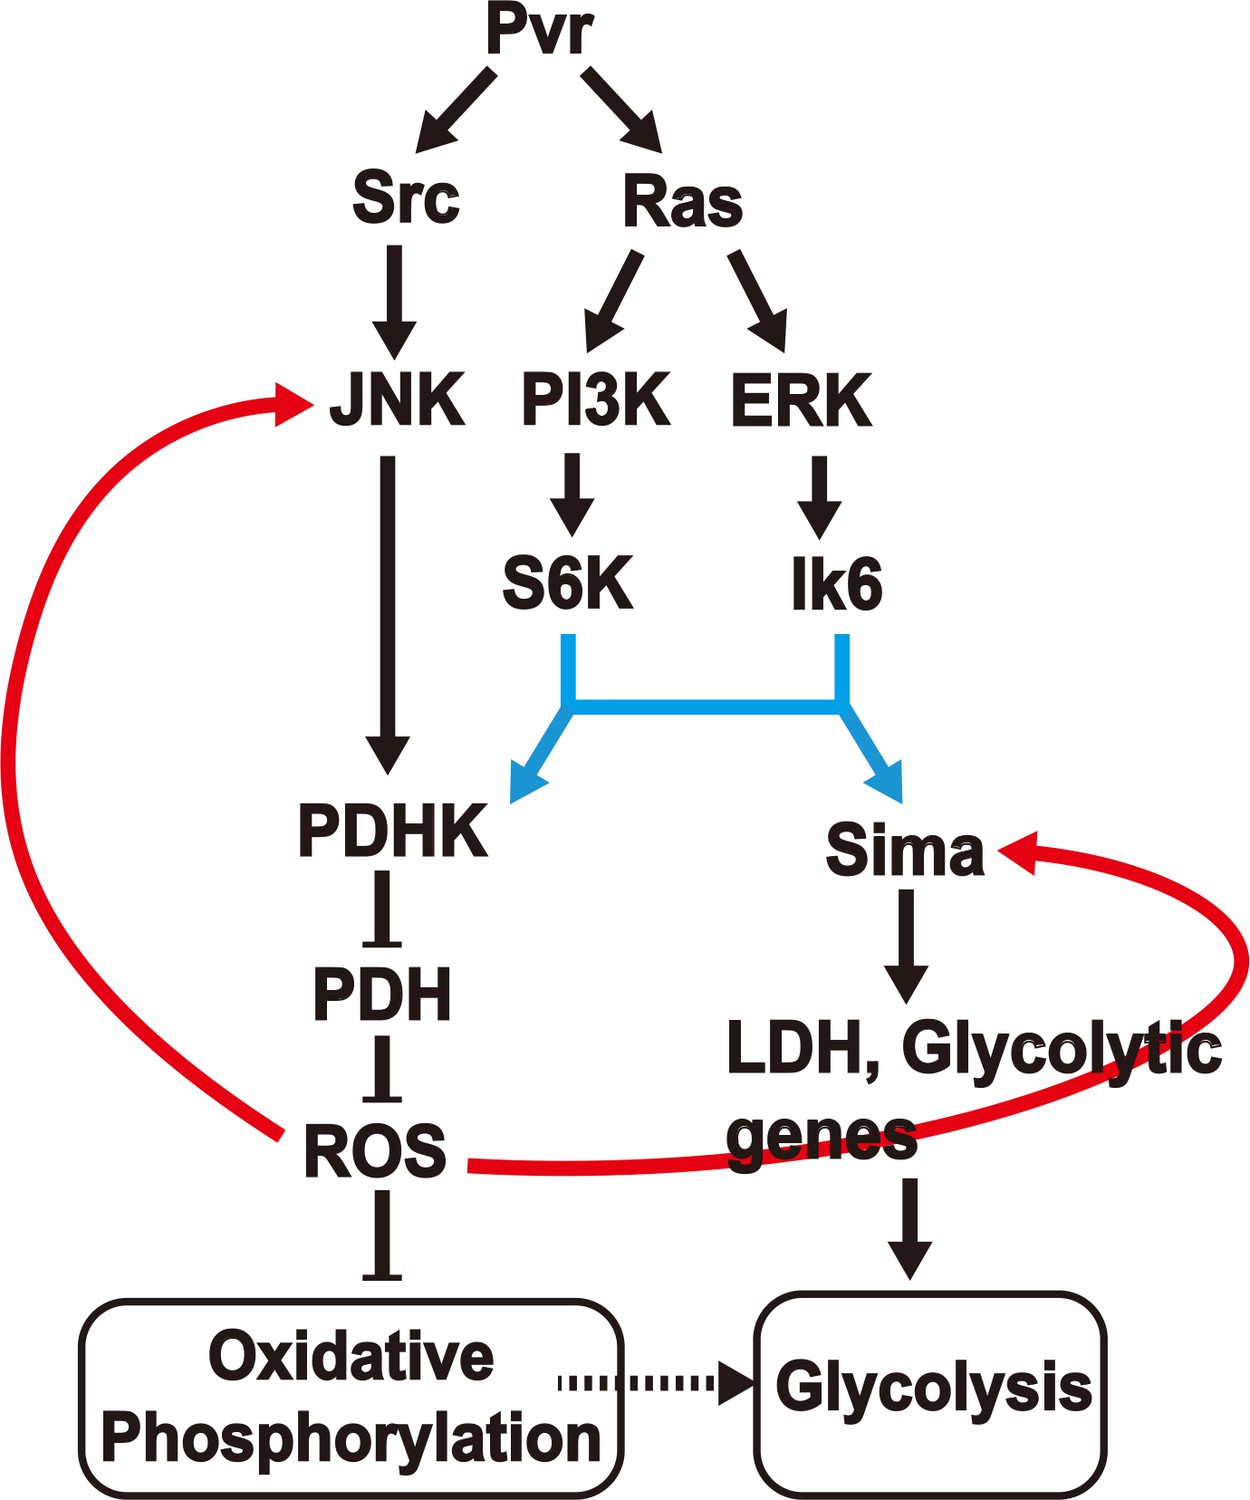
A model for induction and maintenance of a metabolic reprogramming.
Pvract induced tumor tissues show a robust metabolic reprogramming from oxidative phosphorylation to aerobic glycolysis. The model describes the relationship between many pathways that are activated in response to the Pvract signal. ROS, generated as a consequence of the initial metabolic reprogramming feeds back to upstream components, to consolidate and maintain the Warburg effect. See text for details.
Additional files
-
Supplementary file 1
RNA-seq result indicating comparative gene expression values between different genotype.
Gene ID, values of gene expression level of different genotype (Dcl for the dpp>mCherry control; InR for dpp>InRact; Pvr for dpp>Pvract; Sima for dpp>Pvract+SimaRNAi), fold change (log2) of expression level between two genotypes, p-values and significance in RNA-seq analysis are shown.
- https://doi.org/10.7554/eLife.18126.016
Download links
A two-part list of links to download the article, or parts of the article, in various formats.
Downloads (link to download the article as PDF)
Open citations (links to open the citations from this article in various online reference manager services)
Cite this article (links to download the citations from this article in formats compatible with various reference manager tools)
In vivo genetic dissection of tumor growth and the Warburg effect
eLife 5:e18126.
https://doi.org/10.7554/eLife.18126


