Dpp dependent Hematopoietic stem cells give rise to Hh dependent blood progenitors in larval lymph gland of Drosophila
- Indian Institute of Science Education and Research Mohali, India
Figures
Figure 1 with 2 supplements
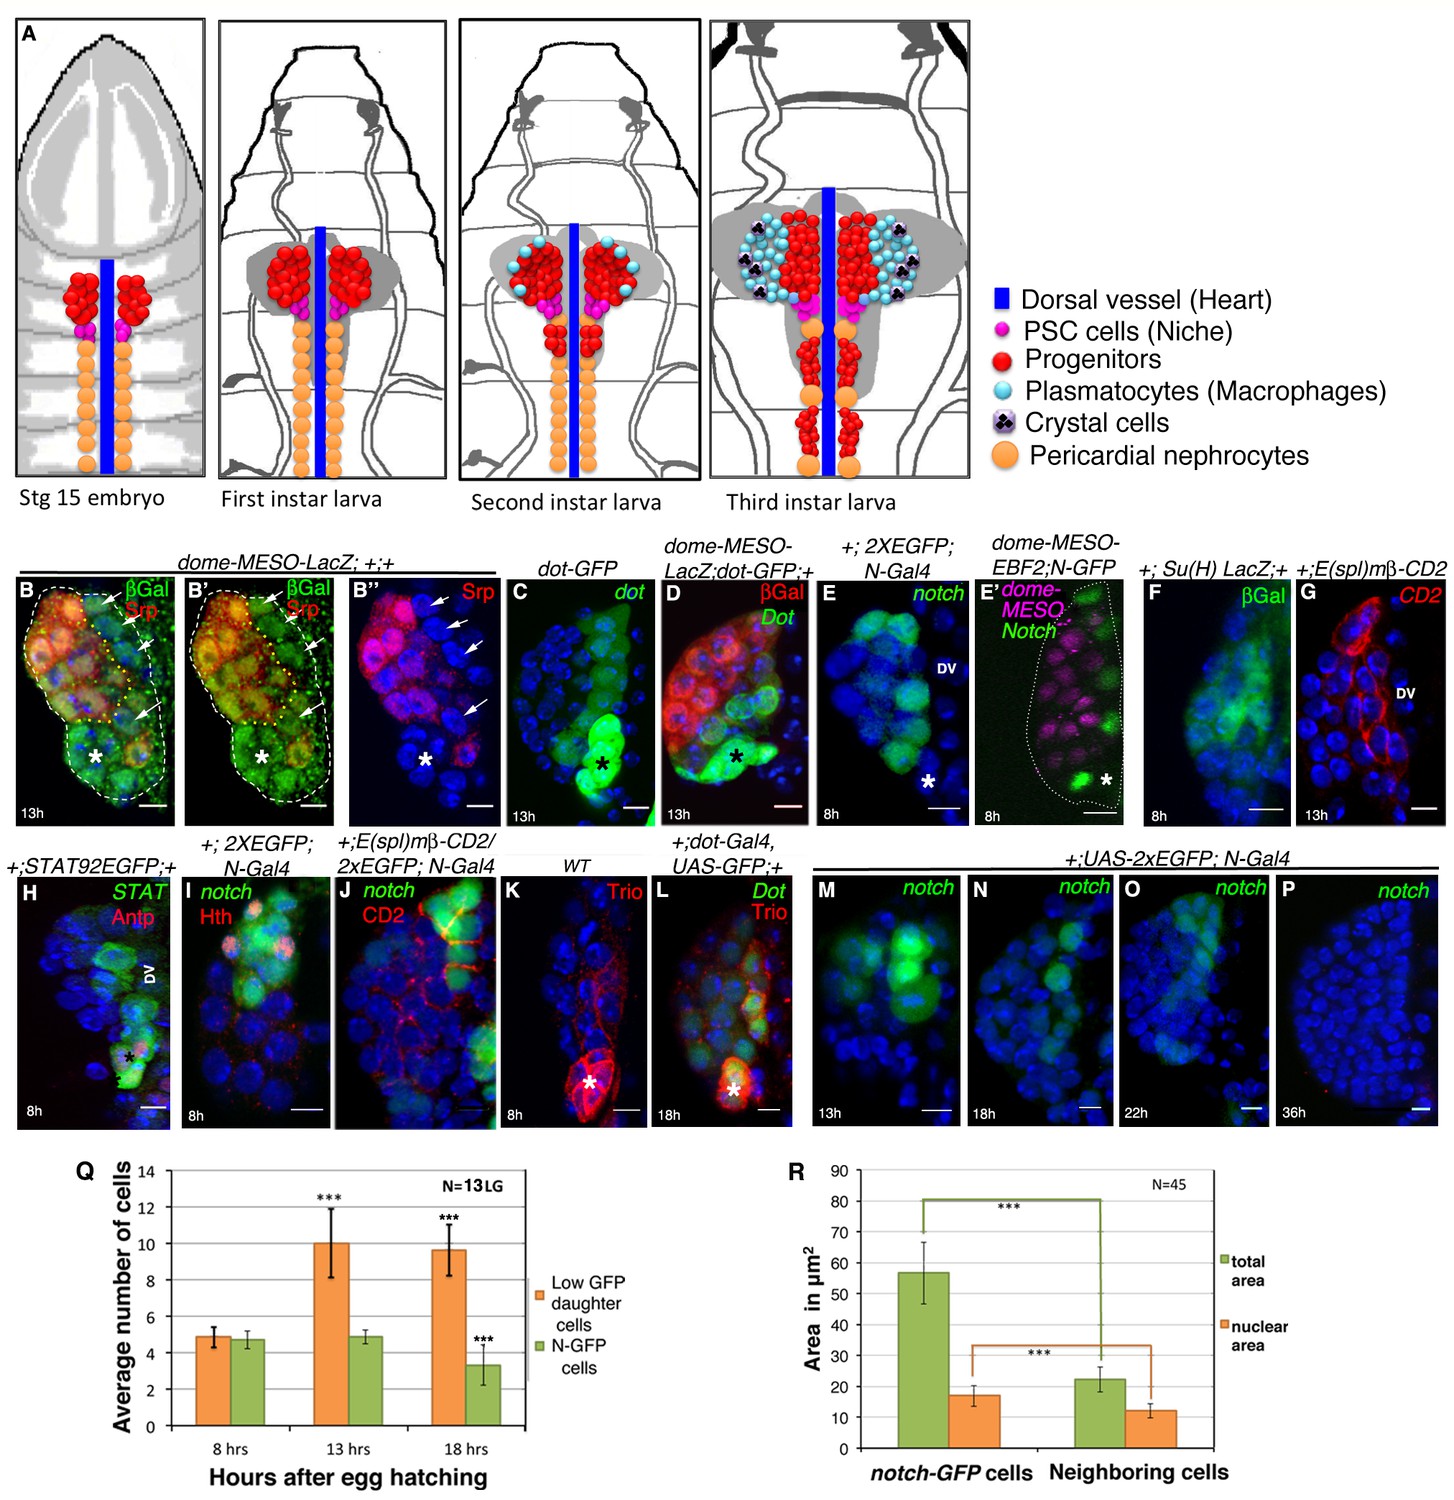
Presence of distinct cells in the first instar larval lymph glands of Drosophila that express several unique molecular markers.
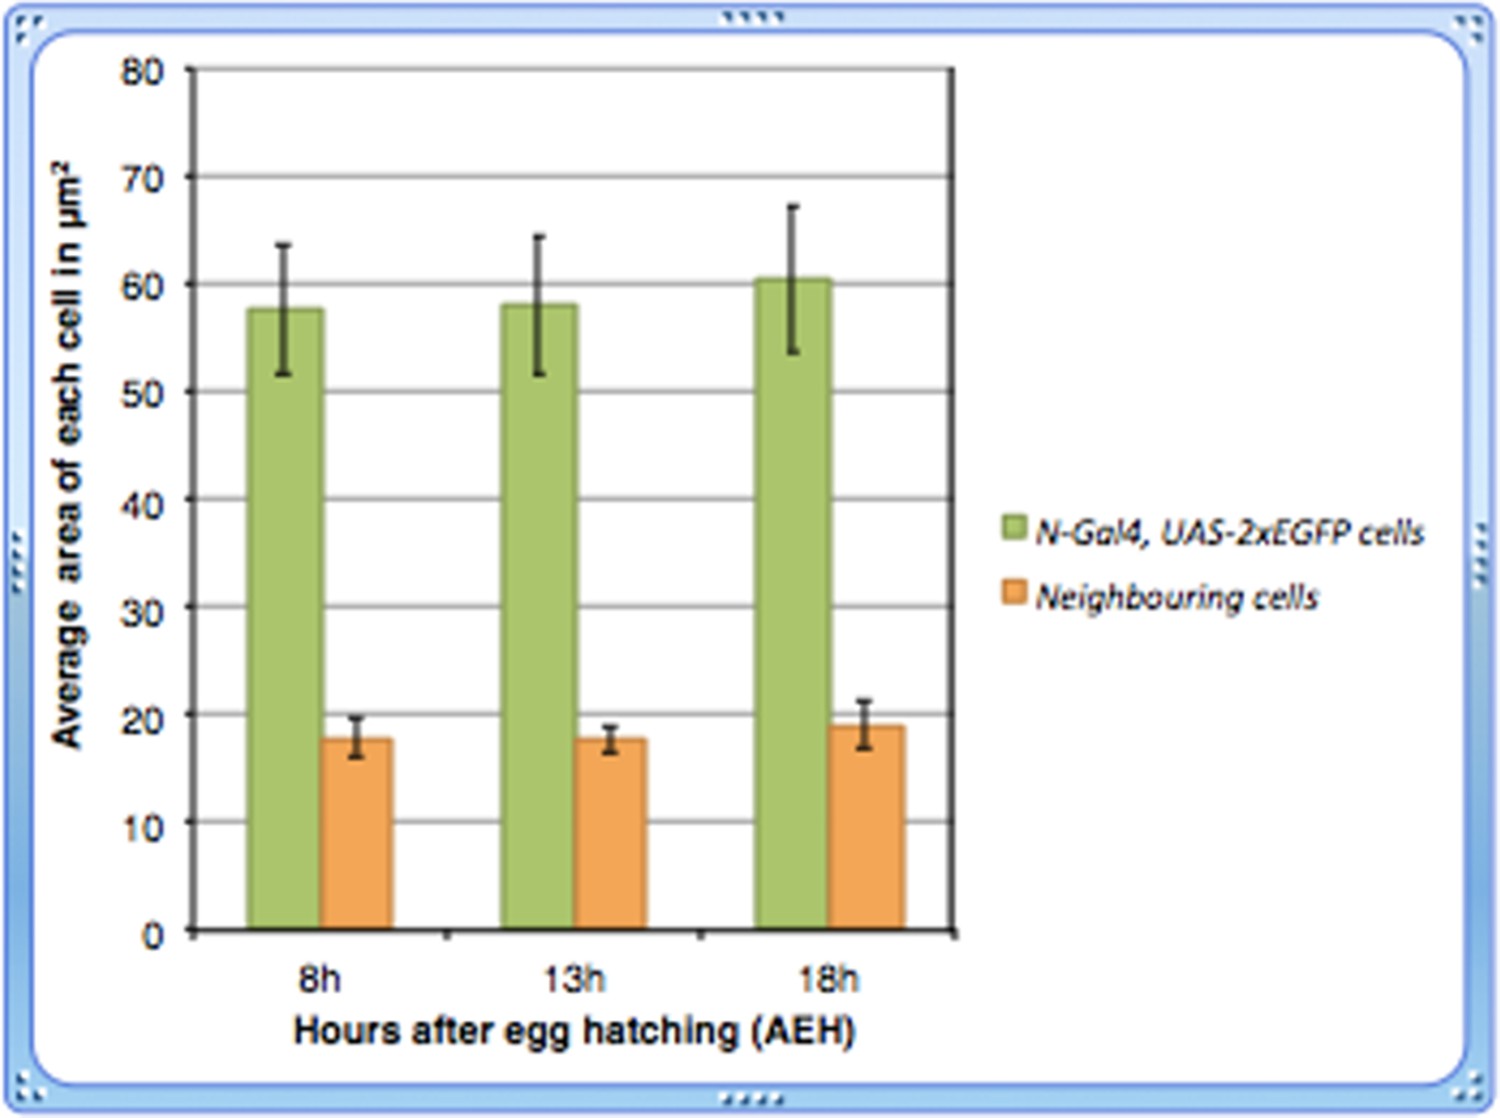
(A) A schematic representation of lymph gland development throughout larval life. Red: progenitors; Magenta: niche cells; Blue: dorsal vessel (DV); orange: pericardial cells; light blue: plasmatocytes; purple with black crystals: Crystal cells. (B–B”) shows few Serpent (Srp; green) expressing cells (arrows) that lack domeless-MESO-LacZ (dome; red) expression in a first instar lymph gland. dome negative cells shown in white arrows are outlined by yellow dotted lines. Asterisk marks the niche. (C) dorothy-GFP (dot; green) expression is higher in the PSC compared to the cells that align near the dorsal vessel, but are negative for dome (red) expression in (D). Also see Figure 1—figure supplement 1E. (E–G) Expression of Notch alone (N; green; [E]), co-staining with domeless expressing progenitors (magenta, E') and its pathway components: Suppressor of hairless (Su(H); Green; F) and Enhancer of Split (E(spl); red; [G]) in the cells near the DV. (H) STAT92EGFP also expresses in these cells in addition to the PSC (red, Antp indicated by an asterisk). (I) A subset of N expressing cells (green) are positive for Homothorax, (hth; red) expression. (J) Overlap of E(spl) (red) and N (green; n = 10) expression. (K–L) indicate Trio (red) expression in the PSC (asterisks) and in cells near the dorsal vessel, which overlaps with dot-Gal4, UAS-GFP as evident in (L). (M–P) shows expression of N (green) in cells close to the DV during early first instars. Also see E and Figure 1—figure supplement 1I. This expression is hardly detectable beyond 22 hr AEH (O–P) (Q) Quantitative analysis of the number of N expressing cells with respect to time. Based on the fluorescence intensity estimation in (Figure 1—source data 1), number of N expressing cells and their daughter cells are 4.8 at 8 hr, 4.8 (p=0.635406062, two tailed unpaired Student’s t-test) and 10 (p=2.14882E-10, two tailed unpaired Student’s t-test) at 13 hr and 9.6 (p=1.01648E-11, two tailed unpaired Student’s t-test) and 3.3 (p=0.000754707, two tailed unpaired Student’s t-test) at 18 hr AEH respectively. (R) Quantitative estimation of the nuclear and total area of the N expressing cells with respect to neighboring cells. The total area of N expressing cells is 2.5 times (n = 45; p=8.50672E-29, two tailed unpaired Student’s t-test) and nuclear area is about 1.4 times (n = 45; p=1.68523E-11, two tailed unpaired Student’s t-test) greater than surrounding cells. Scale bar = 5 μm. Error bars=SD. Genotypes are shown on top of corresponding panels. DAPI marks the nucleus. Hours after larval hatching are as indicated in each panel. Also see Figure 1—figure supplement 1–2.
-
Figure 1—source data 1
Contains numerical data plotted in Figure 1Q and R and Total Fluorescence Intensity analyses for Q and R.
- https://doi.org/10.7554/eLife.18295.004
Figure 1—figure supplement 1
Notch expressing cells lack the earliest progenitor marker at first instar stage.
(A) dome-MESO-LacZ expression pattern at 3rd instar stage (n = 4) (-B–B") dome-MESO-LacZ (red; [B-B']) marks more number of progenitor cells in comparison to dome-Gal4, UAS-GFP (n = 8; green; [B–B"]). (B") shows that dome expression by GFP at this stage is still getting stabilized. (C) Low levels of dot (grey) can be detected through out the lymph gland with moderate levels near the DV (grey; yellow dotted line; n = 40). (D) The highest level of dot (green) expresses in the niche (yellow; asterisk; Antp; n = 13) compared to the moderate levels in cells near the DV (green). (E) Another example, demonstrating cells that express dorothy (dot; green; arrowheads) lack dome (red). The dome negative cells are outlined by yellow dotted lines and the white arrowheads indicate them. (F–F") show overlap of dot (green) and E(spl) expressing cells (red; n = 6) (G) N (green) is not expressed in the PSC (red; Antp; n = 5) at 13 hr AEH. (H–H") Co-expression of N-Gal4, UAS-2XEGFP (green; [H–H']) and Su(H)LacZ; (red; [H–H"]; n = 8), a downstream component of the same pathway. (I) Scheme summarizing our observation of the dynamicity of N expressing cells in the first instar lymph gland over different time points using N-GFP. Scale bar for -A is 20 μm, rest are 5 μm. Genotypes are shown on top of corresponding panels. DAPI marks the nucleus. Hours after larval hatching are as indicated in each panel.
Figure 1—figure supplement 2
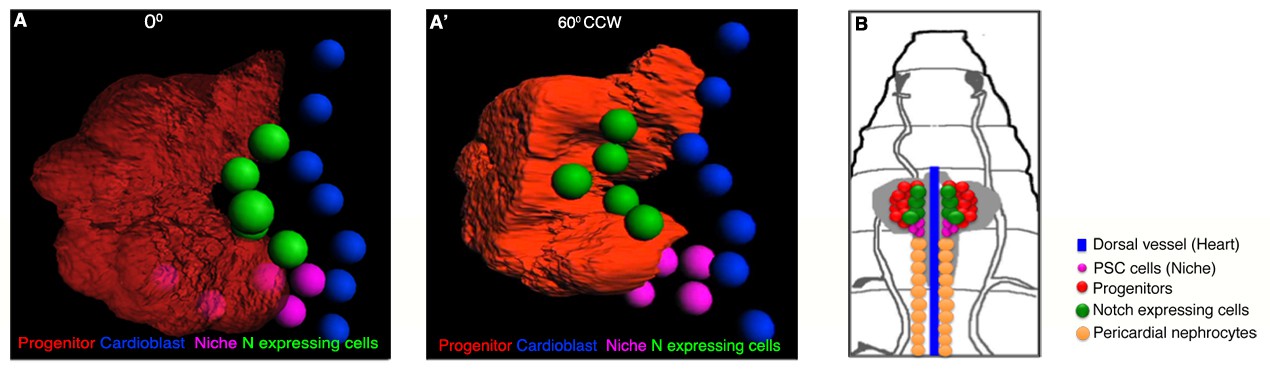
Arrangement of Notch expressing cells with respect to rest of the cells in a first instar lymph gland.
(A–A') Anterior and lateral views of a 3D reconstruction image of a first instar lymph gland (lg) showing the position of N expressing cells (green) with respect to progenitor (red), niche (magenta) and DV (cardioblasts; blue). Horizontal rotation angles are as mentioned (CCW: counter clockwise). (B) Scheme based on our finding, illustrating N expression in first instar lymph gland that re-defines the homogeneous progenitor population into N positive (green) and dome positive (red) domains.
Figure 2 with 2 supplements
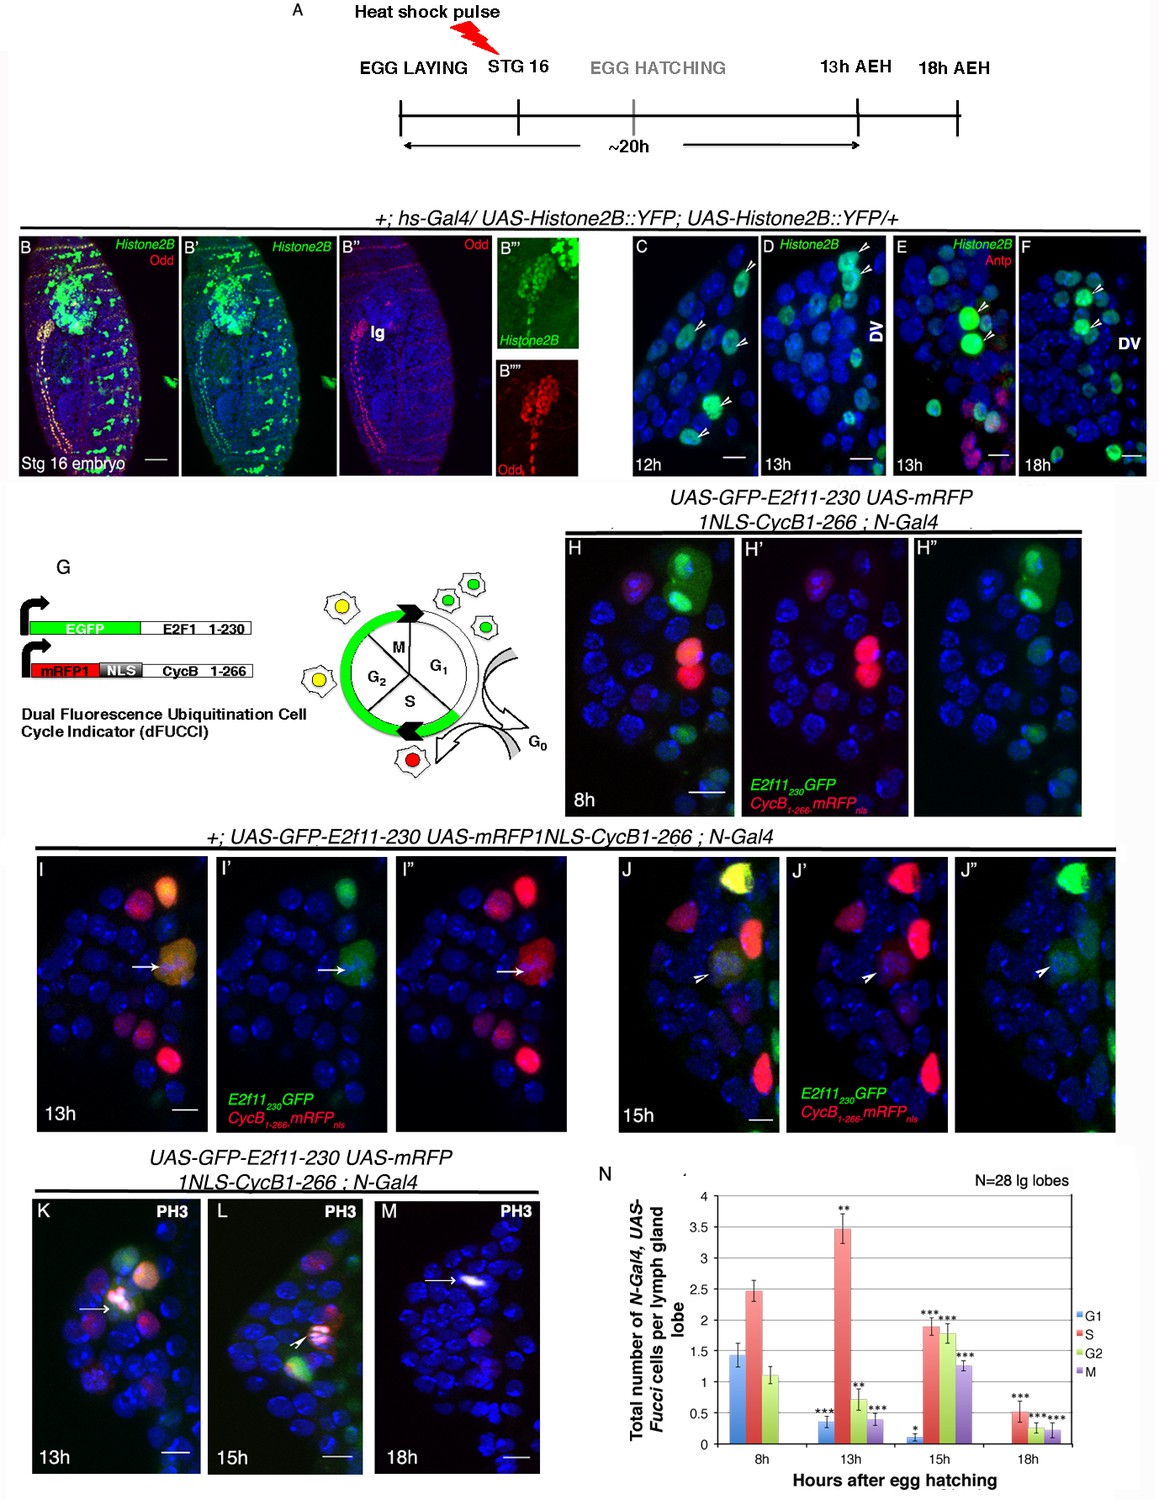
Cell cycle analysis of label retaining Notch expressing cells in first instar lymph gland of Drosophila.
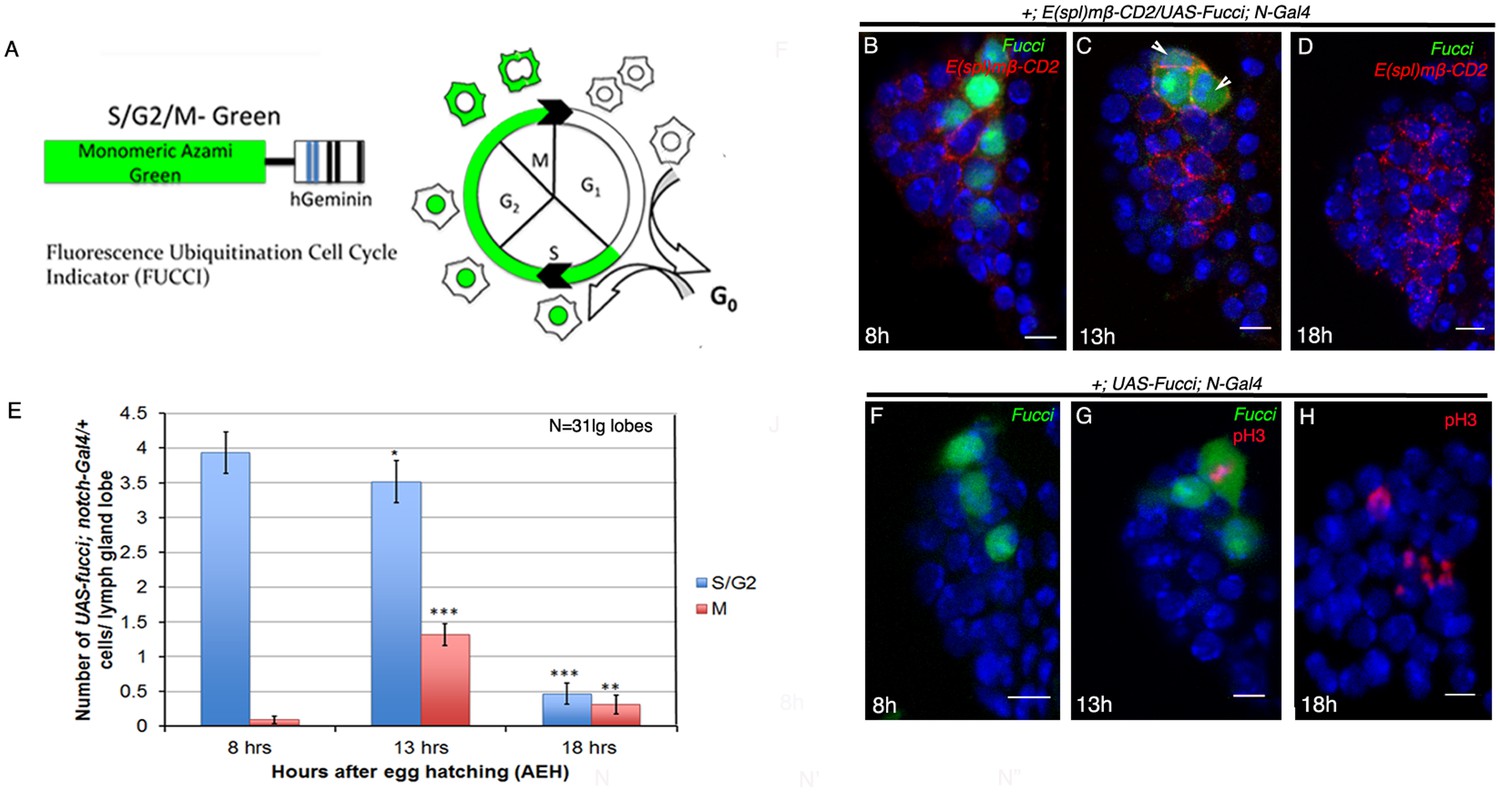
(A–F) Transient activation of UAS-Histone2B::YFP by hs-Gal4 following scheme in (A) shows labeling of all cells of the embryonic lg at 2 hr post hs ([B–B""]; red; odd; n = 10). (C–F) Subsequent analyses of the rest of the embryos at 12 hr ([C]; n = 18), 13 hr ([D–E]; n = 20) and 18 hr (F; n = 10) AEH, reveals few high YFP cells near DV retaining label (shown by arrow-heads). (G) The dual Fucci system in fly. Cells fluoresce green in G1, red in S and yellow in G2-M phases of cell cycle. (H–H") At 8 hr AEH, N expressing cells are predominantly in G1 (only green) and S (only red) phases of cell cycle, whereas by 13 hr (I–I"), majority of these cells can be seen piling up in S phase (p=0.00121289, n = 28, two tailed unpaired Student’s t-test). Mitosis (cytoplasmic yellow, arrow, I) in these cells can also be detected from 13 hr onwards (p=0.00027463, n = 28, two tailed unpaired Student’s t-test). (J–J") show cell cycle status of N expressing cells at 15 hr, where they can now progress into G2 (yellow (J), p=1.79435E-05, n = 28, two tailed unpaired Student’s t-test) and M phases of mitosis (yellow, arrow head, p=8.49479E-09, two tailed unpaired Student’s t-test). (K–M) PH3 labeling in the lymph gland 13 hr and 15 hr AEH (M) No Fucci signal can be detected at 18 hr AEH (S phase, p=4.17476E-08; G2 phase, p=1.26203E-10; M phase, 2.30293E-07; n = 28; two tailed unpaired Student’s t-test). (N) Quantitative analysis of results from H–M. Average number of cells in each phase of cell cycle was counted and plotted. DV= Dorsal Vessel. Scale bar = 5 μm. Error bars=SE. Genotypes are shown on top of corresponding panels. DAPI marks the nucleus. Hours after larval hatching are as indicated in each panel.
-
Figure 2—source data 1
Contains numerical data plotted in Figure 2N and Figure 2—figure supplement 1E.
- https://doi.org/10.7554/eLife.18295.009
Figure 2—figure supplement 1
Cell cycle analyses of Notch expressing cells.
(A) Fluorescent ubiquitination based cell cycle indicator (Fucci), a fluorescent probe that labels cells in the S/G2/M phases (redrawn from Nakajima et al., 2011). Accumulation of GFP in the nucleus indicates that the cell is in the S/G2 phase while its distribution into the cytoplasm corresponds to the initiation of M phase. (B–D) At 8 hr AEH, Fucci (green) accumulates in nucleus of N expressing cells ([B]; red; E(spl); n = 31) indicating S/G2 phase of cell cycle (also see Figure 2H–H"). N expressing cells (red, E(spl)) undergo asynchronous division from around 13 hr AEH indicated by cytoplasmic GFP ([C]; Fucci, arrowhead, n = 31, p=8.18287E-09, two tailed unpaired Student’s t-test; also see Figure 2I–I"). (D) No Fucci signal is detectable at 18 hr AEH ([H]; n = 31; p=4.63838E-13, two tailed unpaired Student’s t-test; (also see Figure 2M). (E) Quantitative analyses of the data shown above. The numbers of N expressing cell at different cell cycle stages with respect to cytoplasmic and nuclear GFP (Fucci) are counted for each hour. Error bars=SE. (F–H) N expressing cells undergo mitotic division from 13 hr AEH. (F) shows no PH3 incorporation at 8 hr. (G) Cytoplasmic distribution of Fucci corresponding to PH3 positive cells, is detected at 13 hr AEH. (H) Although there is PH3 incorporation in the lymph gland but no Fucci signal can be detected at 18 hr AEH (anti-phospho-histone H3, red). Scale Bar is μm . Genotypes are shown on top of corresponding panels. DAPI marks the nucleus. Hours after larval hatching are as indicated in each panel.
Figure 2—figure supplement 2
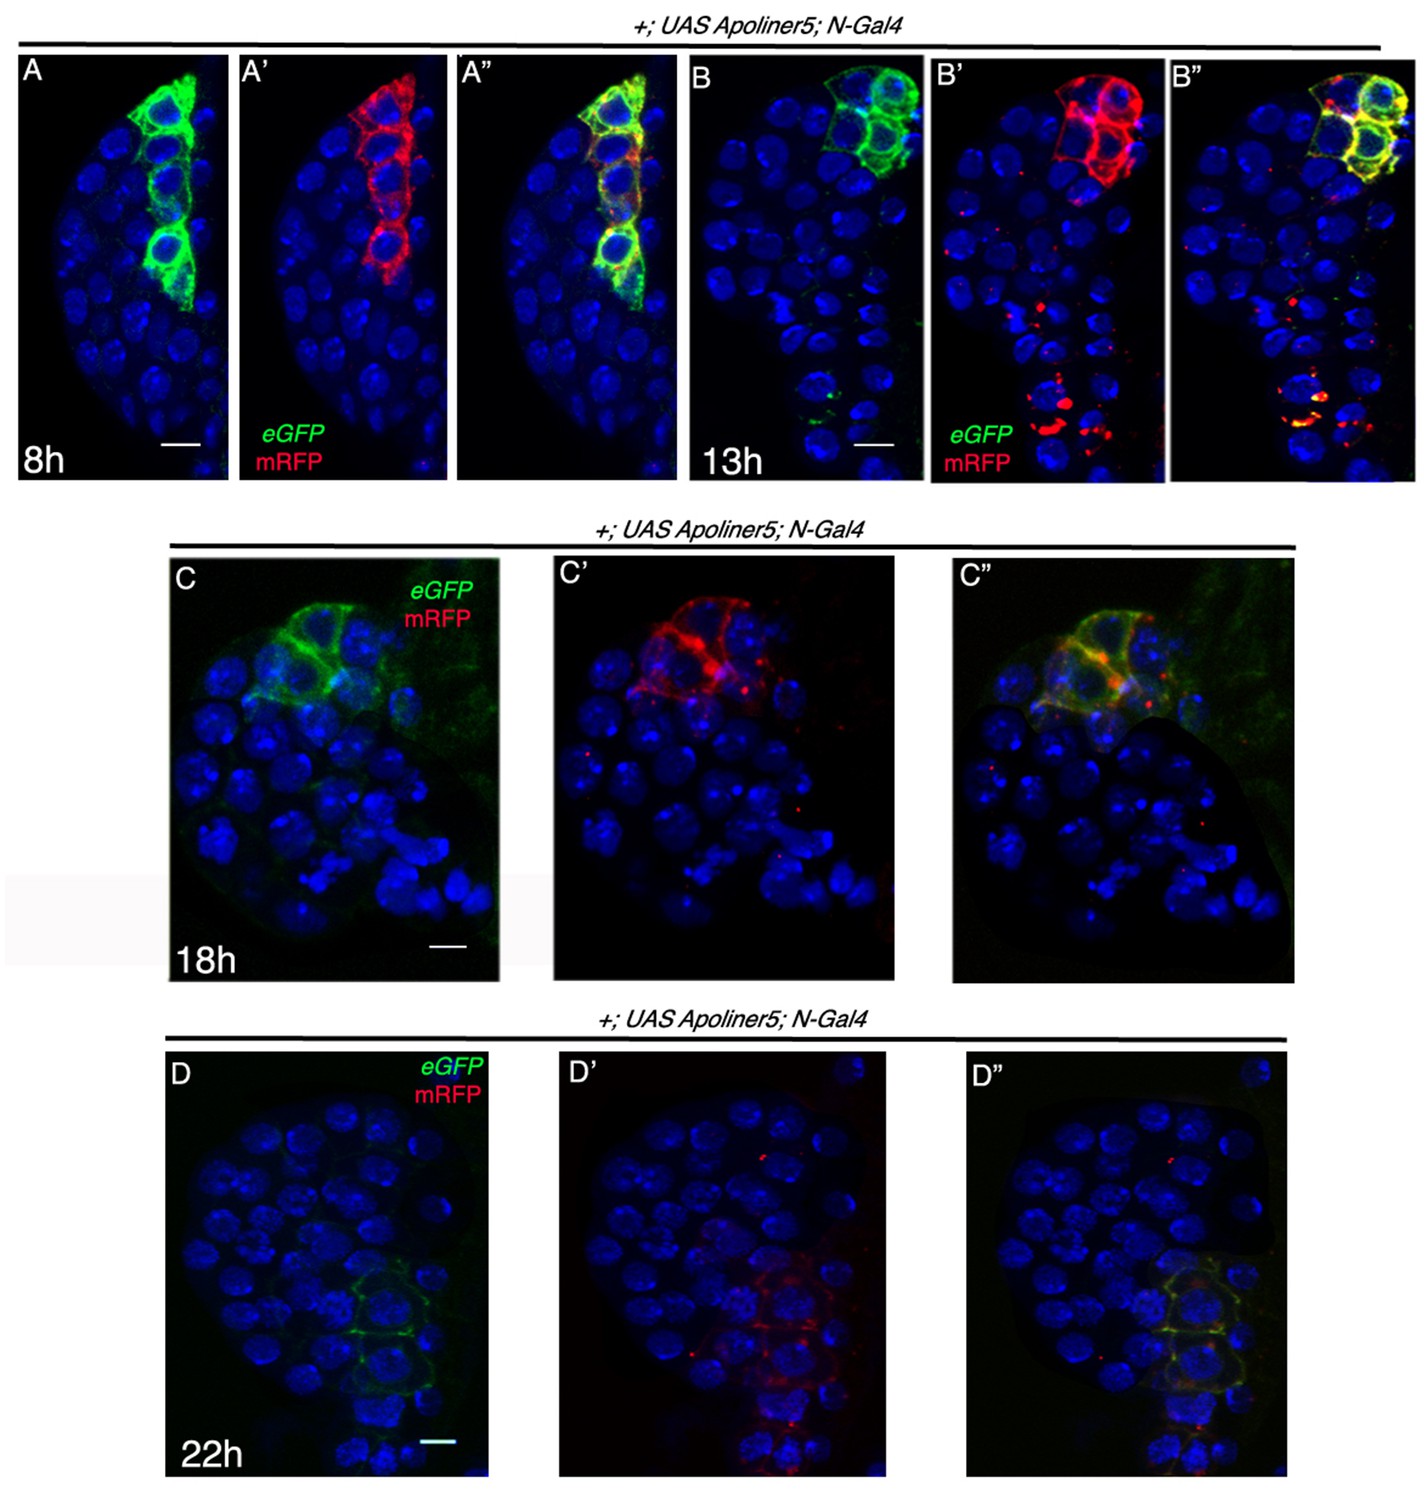
Absence of apoptosis in Notch expressing cells in first instar lymph gland of Drosophila.
(A–D") Time kinetics of N-Gal4, UAS-Apoliner show no apoptosis in N expressing cells at 8 hr (A–A"; n = 10), 13 hr (B–B"; n = 10), 18 hr (C–C"; n = 10) and 22 hr (D–D"; n = 10) AEH. Scale bar = 5 μm. Genotypes are shown on top of corresponding panels. DAPI marks the nucleus. Hours after larval hatching are as indicated in each panel.
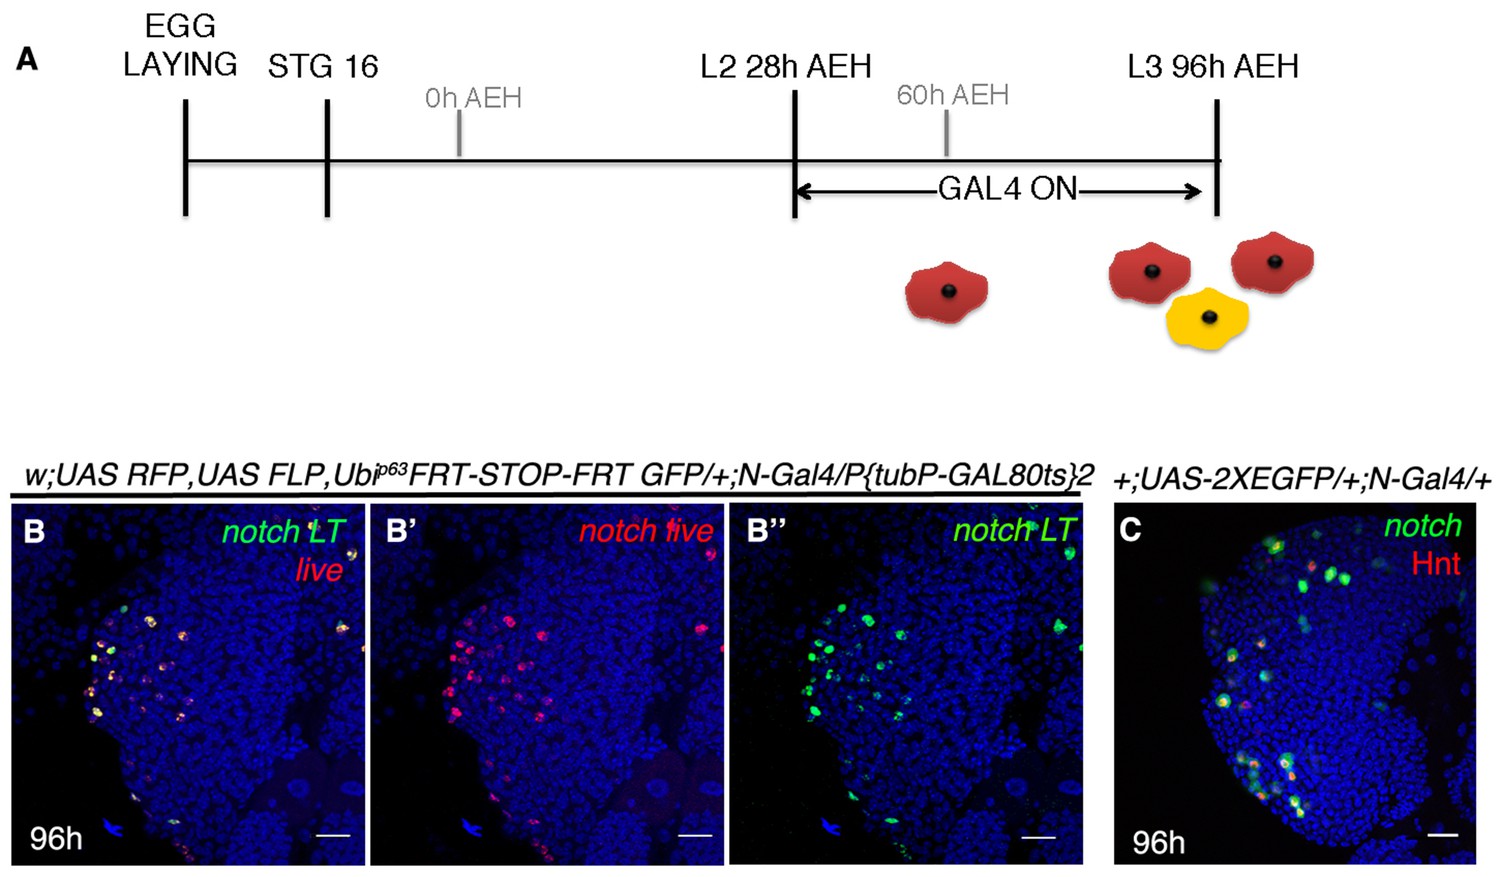
Figure 3 with 2 supplements
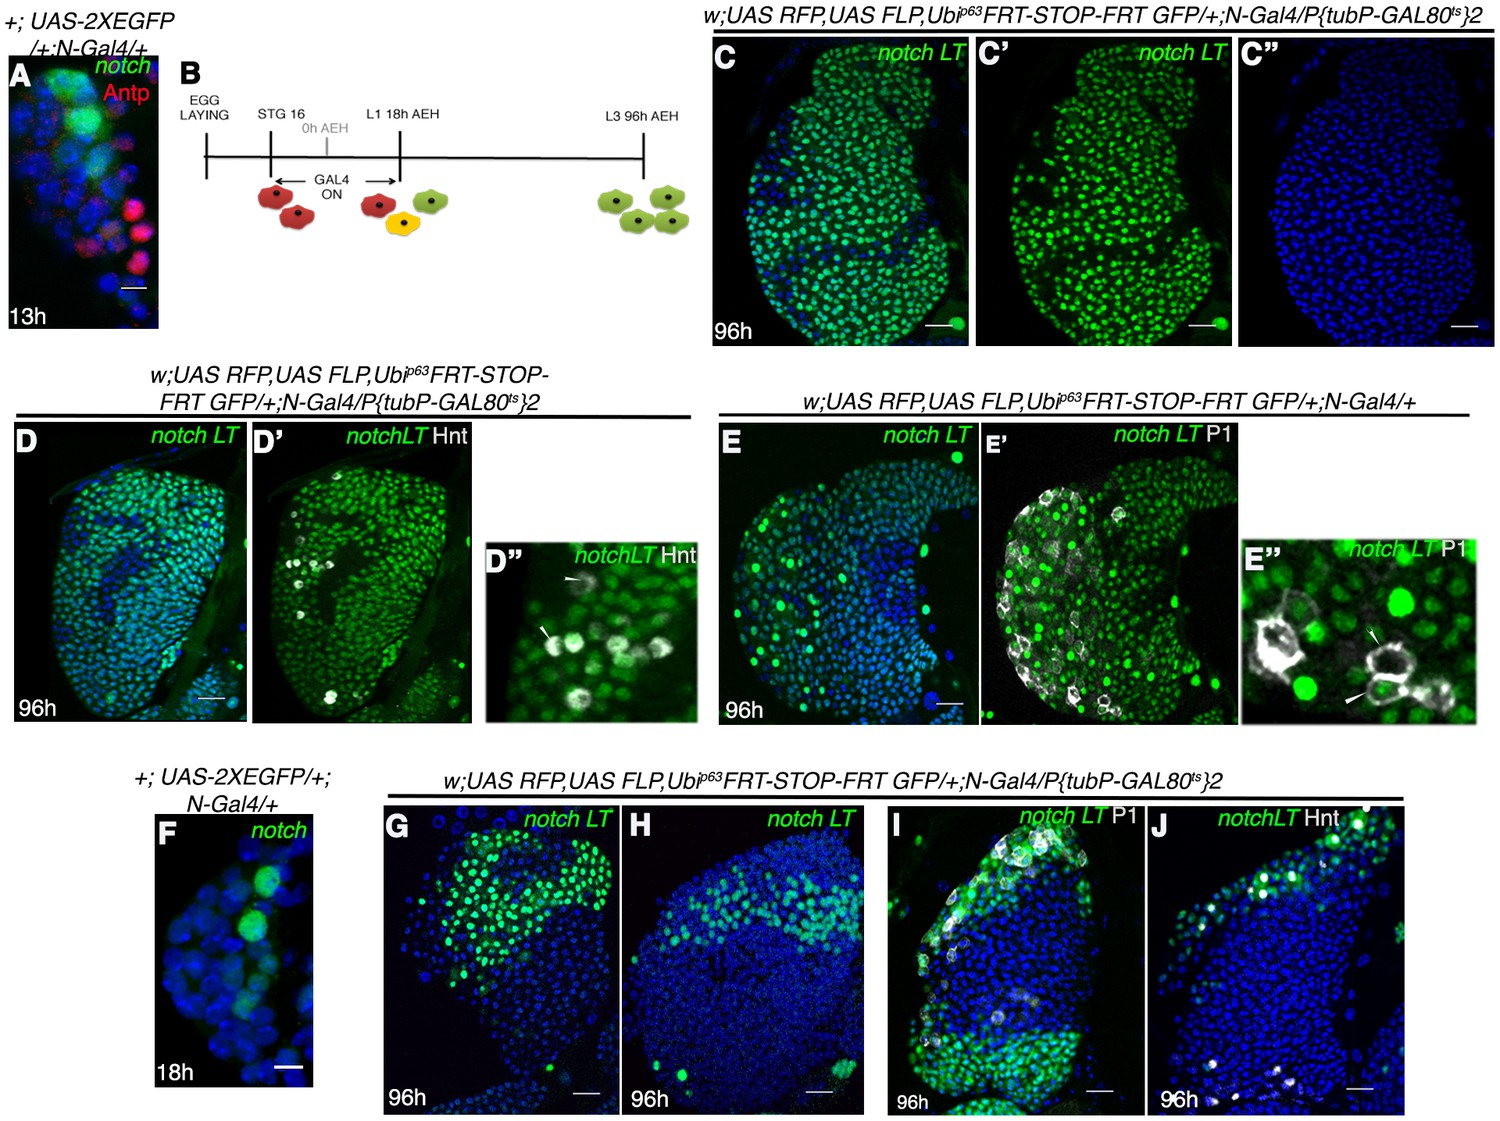
Notch expressing cells in first instar lymph gland of Drosophila are multipotent.
(A) N-GFP expression in a first instar lymph gland. N expression is detectable only till late first instar (also see Figure 1[E, M–O]). (B–E") shows that activation of G-TRACE with N Gal4, in a short window (following scheme in B) results in labeling of majority of the cells of third instar lymph gland. N lineage traced cells (green; [C–E"]; n = 15) include both crystal cells ([D'-D"], hnt, grey; n = 10) and plasmatocytes ([E'–E"], P1, grey; n = 10). (F) N expression is reduced to 2 cells by about 18 hr AEH (n = 7). (G–H) show that restrictive lineage tracing of one (H; n = 6) or two (G; n = 8) HSCs result in a clonal propagation, which spans through the entire horizontal length of the gland. (I–J) Each of these cells is equipotent in giving rise to both plasmatocytes ([I], P1, grey, n = 9) and crystal cells ([J], hnt, grey; n = 9). Scale bar = 5 μm for Figure 3A and F, for rest is 20 μm Genotypes are shown on top of corresponding panels. DAPI marks the nucleus. Hours after larval hatching are as indicated in each panel. Also see Figure 3—figure supplement 1–2.
Figure 3—figure supplement 1
Fate map of the progenitors arising from Notch expressing HSCs.
(A) shows dome-GFP expression in progenitors of a late third instar lymph gland (n = 10). (B–C") show that dome expressing progenitors upon lineage tracing (C–C', green) from 18 hr AEH using the scheme in (B) give rise to all the cells of the lymph gland. Red indicates current expression of dome whereas green shows lineage of the same (C–C"; n = 10). (D–E"') show that dome lineage comprises of both crystal cells (D'–D"', Hnt, grey; n = 13) and plasmatocytes (E–E"', P1, grey; n = 15). Genotypes are shown on top of corresponding panels. Scale bar = 20 μm. DAPI marks the nucleus. Hours after larval hatching are as indicated in each panel.
Figure 3—figure supplement 2
Notch requirement in crystal cell maintenance at a later stage in a third instar lymph gland.
(A–B") shows that, upon lineage tracing beyond HSC lifeline (following scheme in A), Notch lineage (green, [B, B"]) comprises of only crystal cells (red, live expression, [B, B'], n = 10). (C) Notch expression (green) in a wild-type late third instar lg overlaps with crystal cells (Red, Hnt, n = 10). Scale bar is 20 μm. Genotypes are shown on top of corresponding panels. DAPI marks the nucleus. Hours after larval hatching are as indicated in each panel.
Figure 4
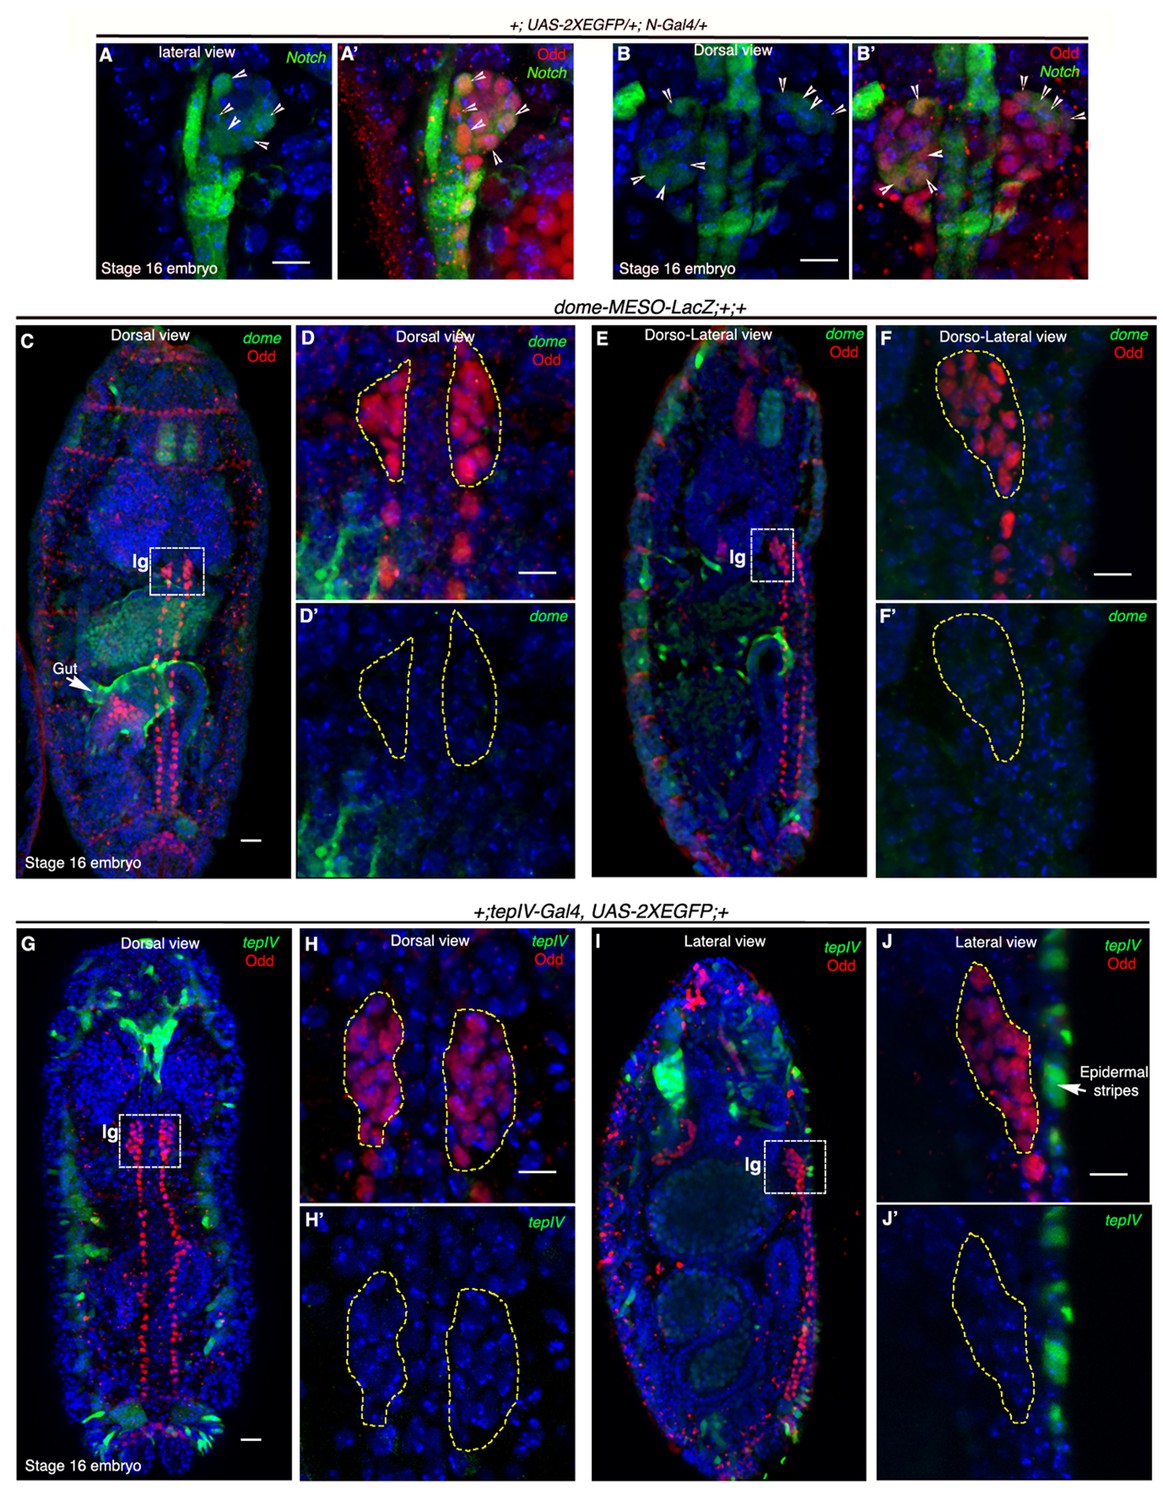
Notch is expressed earlier than Domeless in the embryonic lymph gland.
(A–B') Restriction of N-Gal4, UAS-2XEGFP expression in 4–5 cells (arrow heads) of late 16-stage embryonic lymph gland (Odd, red). A–A' shows lateral and B–B' depict dorsal views (n = 15). (C–F') Mesodermal specific domeless expression (domeless-MESO-LacZ; green) is absent in embryonic lymph gland (lg, dotted white box; Odd; red) but present in the gut (arrow; n = 8). -C–D'- show dorsal while E–F' show dorso-lateral view of embryonic lymph gland. -D–D'- are insets into the dorsal view of the embryonic lymph gland in C- whereas F–F' are insets into the dorso-lateral view in E. (G–J') TepIV, a downstream responder of JAK/STAT pathway (tepIV-Gal4, UAS-2xEGFP; green) is also absent in the embryonic lymph gland (dotted white box; Odd; red) but present in epidermal stripes (arrows in J; n = 13). G–H' show dorsal while I–J' show lateral view of embryonic lymph gland. H–H' are insets into the dorsal view of the embryonic lymph gland in (G; dotted white box) whereas J–J' are insets into the lateral view in (I; dotted white box). Scale bar 5 μm. lg= lymph gland Genotypes are shown on top of corresponding panels. DAPI marks the nucleus.
Figure 5 with 1 supplement
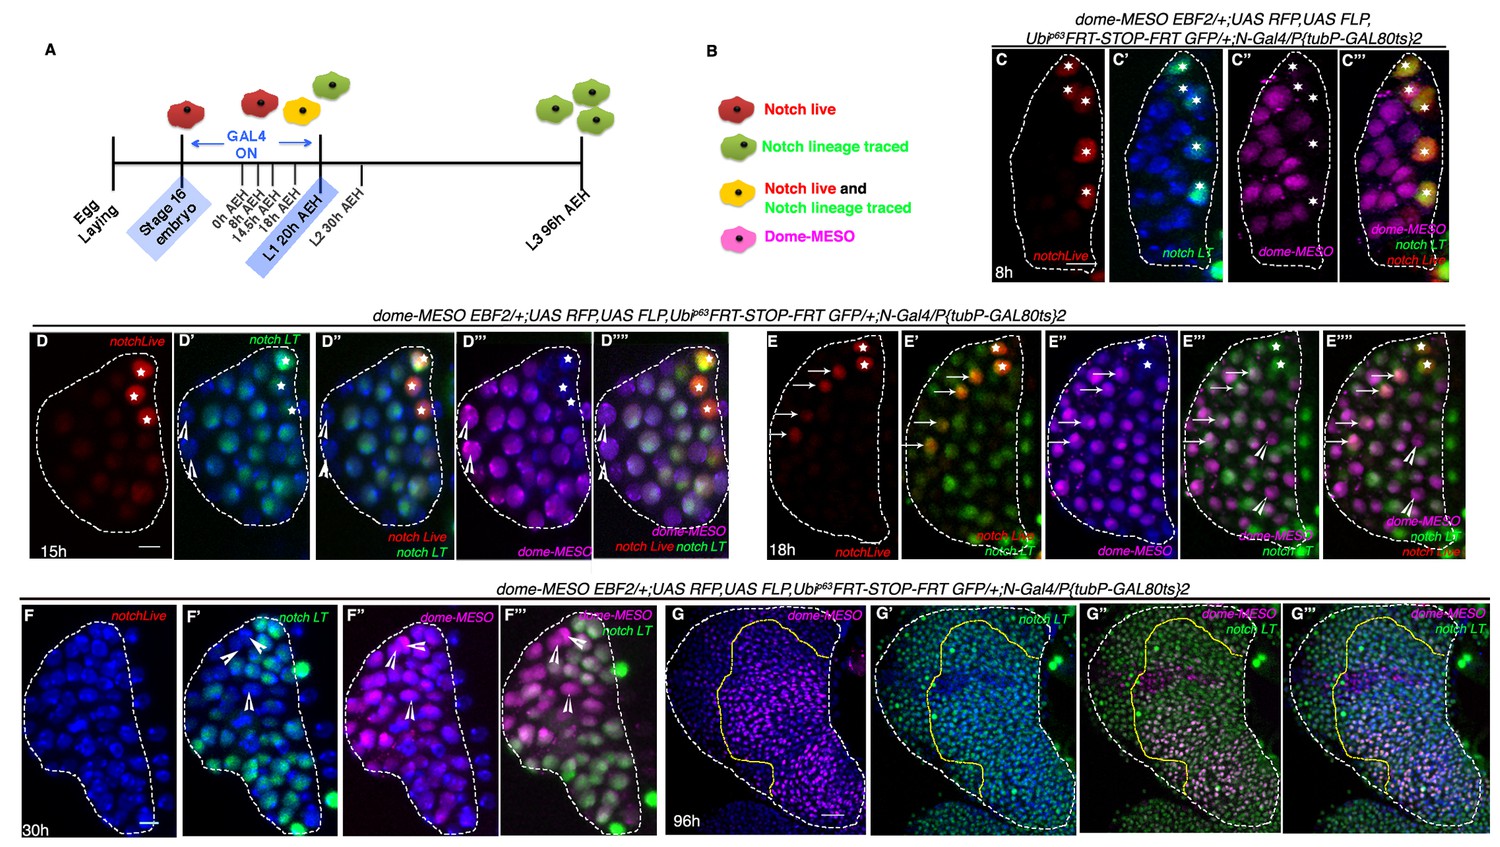
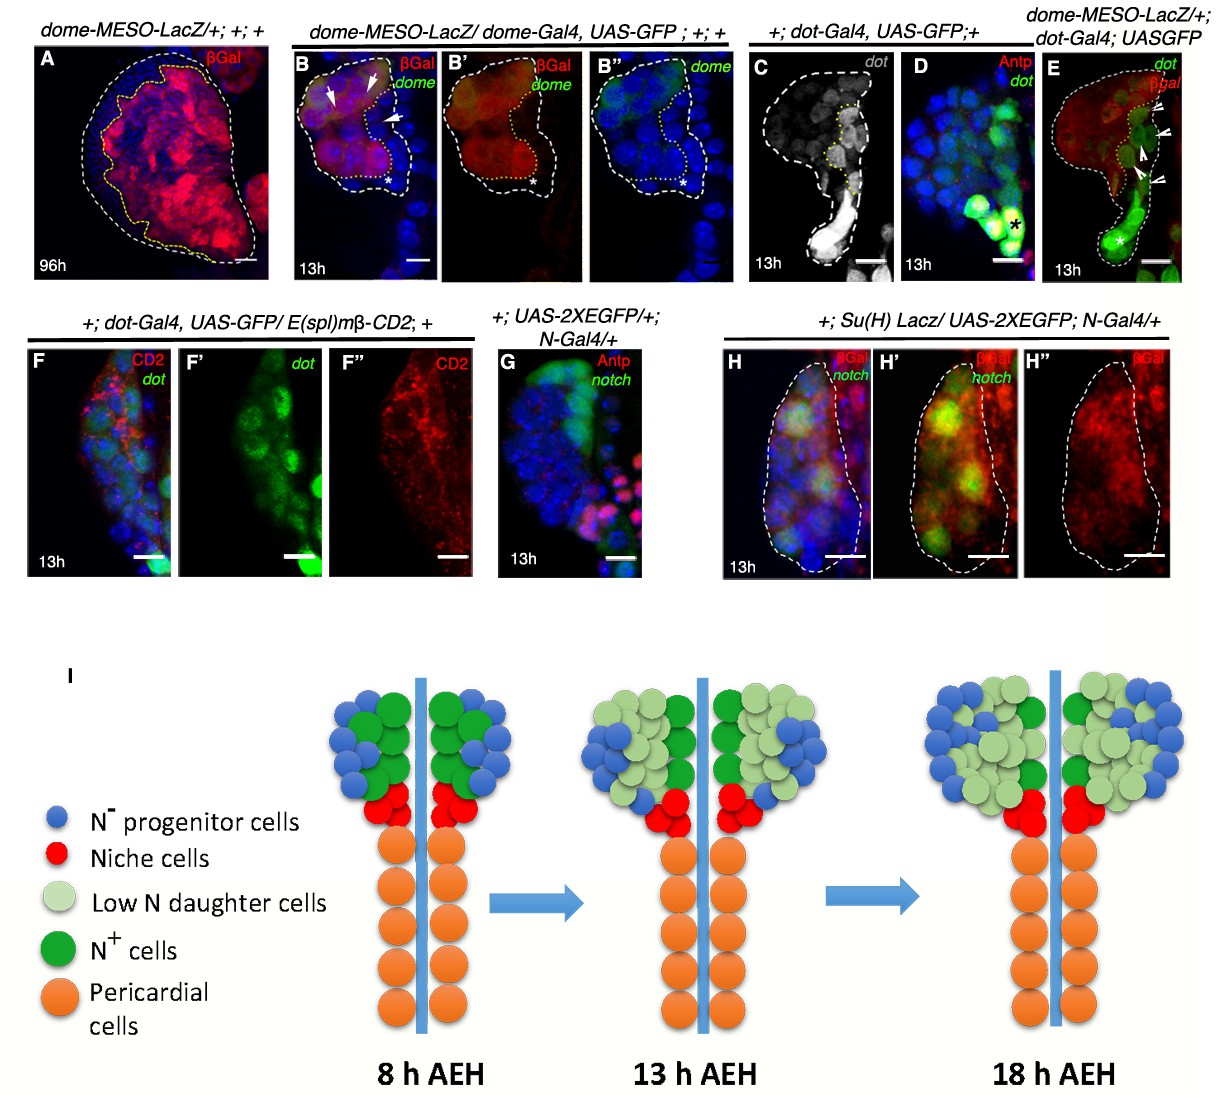
Hierarchical relationship between dome and Notch expressing cells in the first instar lymph gland.
(A) Show the scheme of N lineage tracing followed throughout this panel. (B) Schematic representation of predicted cell types arising from N lineage tracing in A. A red cell indicates live expression of N. A green cell indicates that N was active in this or its precursor cell but is not active now. A yellow cell indicates continuous activation of N>GTRACE indicating that this cell expressed N earlier and is still expressing. A magenta cell indicates dome-MESO expression. (C–C'") First instar lymph gland showing mutually exclusive yellow (both N live and lineage traced expression; stars) and magenta (dome-MESO-EBF2) cells at 8 hr (n = 6). (D–D''") also shows few N expressing cells (yellow; stars in D–D''") that do not express dome-MESO-EBF2 (magenta; D'"–D''"; n = 7) at 15 hr. (E–E''") At 18 hr, some N expressing cells (arrows; E–E''"; n = 6) also express dome (arrows; E"–E''"), while some do not (stars; E–E''"), indicating a possible differentiation at this time point. (F–F'") Second instar early (30 hr AEH) lymph gland does not actively express N (absence of red live expression in F) but contains N lineage traced cells (green; F', F"'; n = 5), which are now also expressing dome-MESO (magenta; F"–F'"). Also noteworthy are few cells (arrowheads) that are not lineage traced for N (not green) but still express dome (arrowheads, D–F'"). (G–G'") dome-MESO-EBF2 (magenta; G, G"–G'") expression in restricted N lineage (green; G'–G'") traced lymph gland following scheme in A. Scale bar is 20 μm for G–G"' for rest it is 5 μm. Genotypes are shown on top of corresponding panels. TOPRO marks the nucleus.
Figure 5—figure supplement 1
Lineage tracing in an identical window reveals the hierarchical relationship between dome and Notch expressing cells.
(A–B) Expression of Ci (Cubitus interruptus, red: B–B"), a marker of progenitors in transient N lineage traced (green) lymph gland following the scheme in A (n = 10). (C) is a cartoon showing overlap of dome and Ci (yellow), both validated markers of progenitors (D–D") Following restricted lineage tracing scheme in A, dome lineage tracing (green) marks much less number of progenitors (Ci; red; n = 5) in comparison of similarly lineage traced N. Compare D–D" to B–B". (E–E') Overlap of dome-MESO and tepIV, a downstream responder of same JAK/STAT pathway in a third instar lymph gland. (F–H) show three examples of restricted labeling of tepIV, following lineage tracing scheme in A (green; n = 8), marking much less number of cells in comparison of similarly lineage traced N (compare F–H with B). Scale bar 20 μm. Genotypes are shown on top of corresponding panels. TOPRO marks nucleus in E–E', while DAPI marks nucleus for rest.
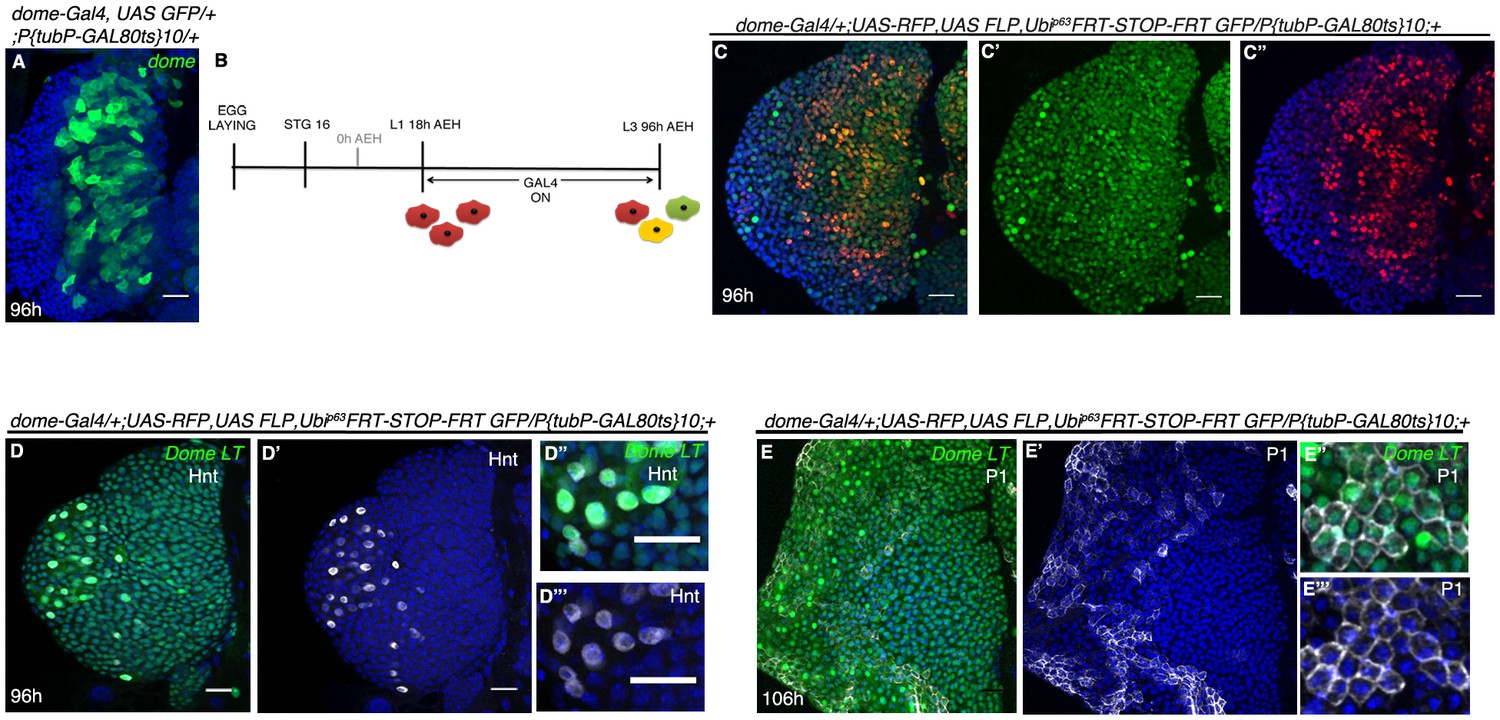
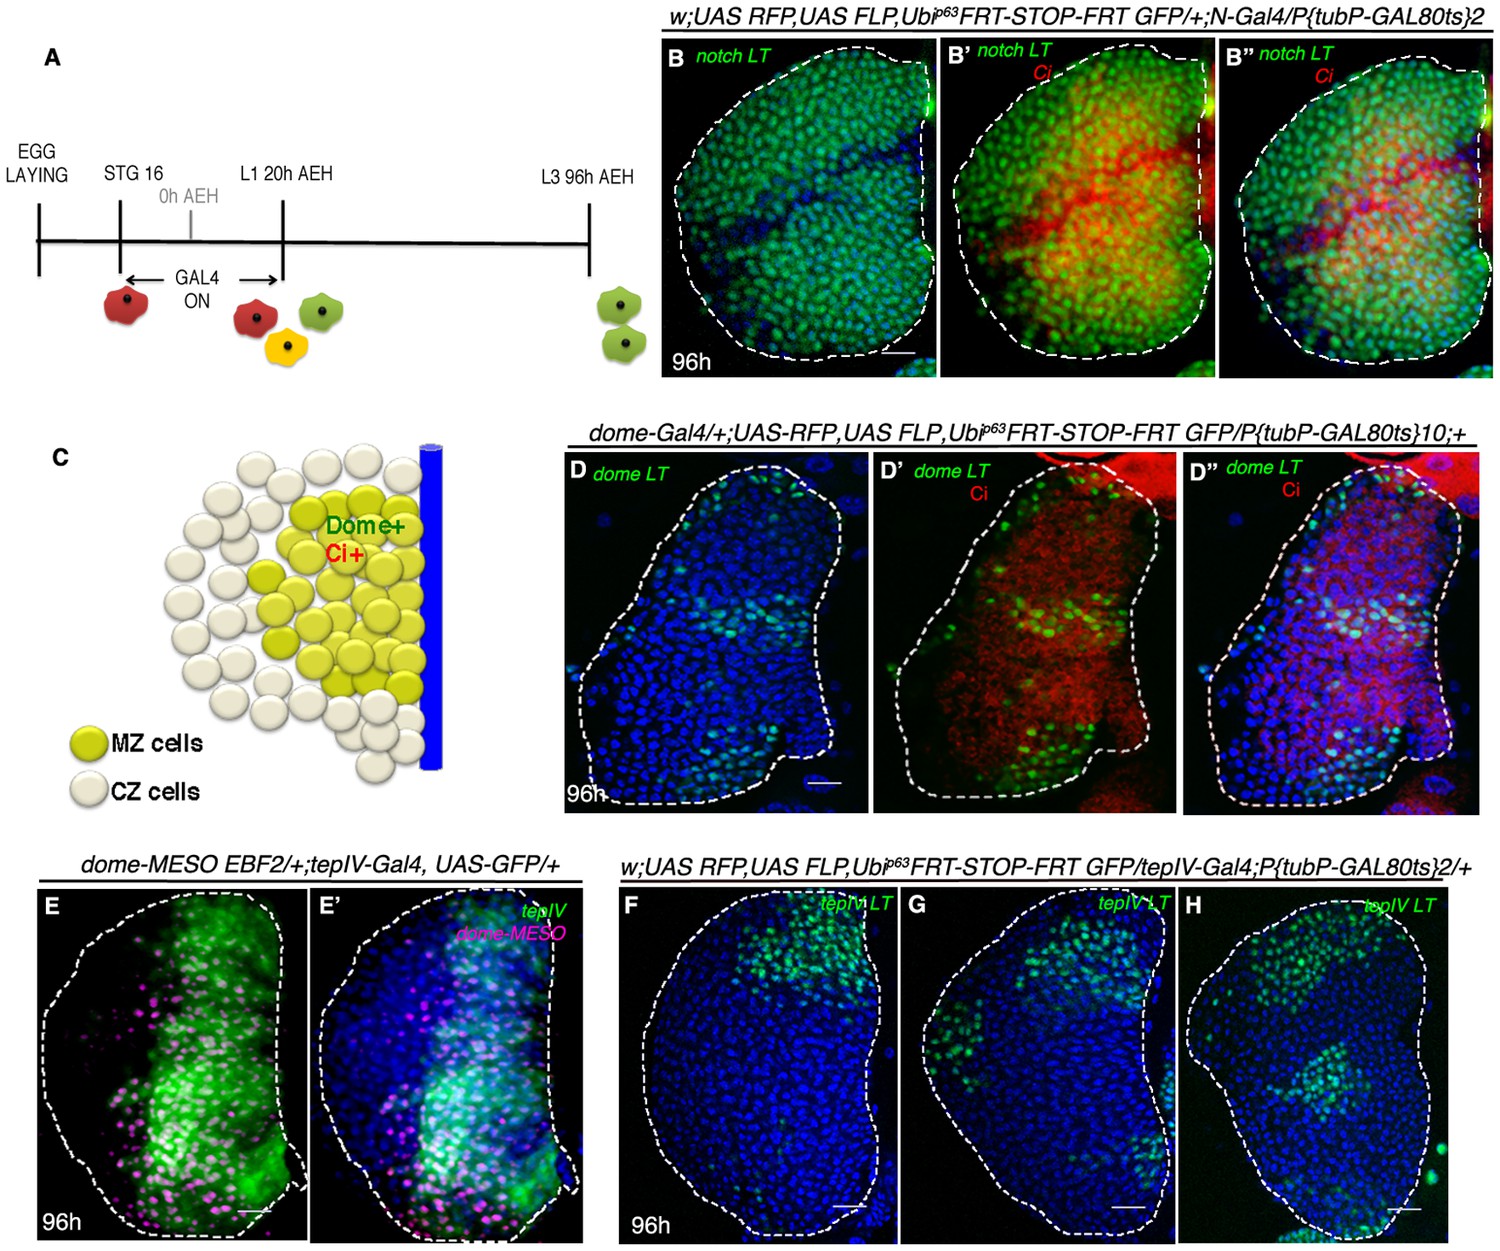
Figure 6 with 1 supplement
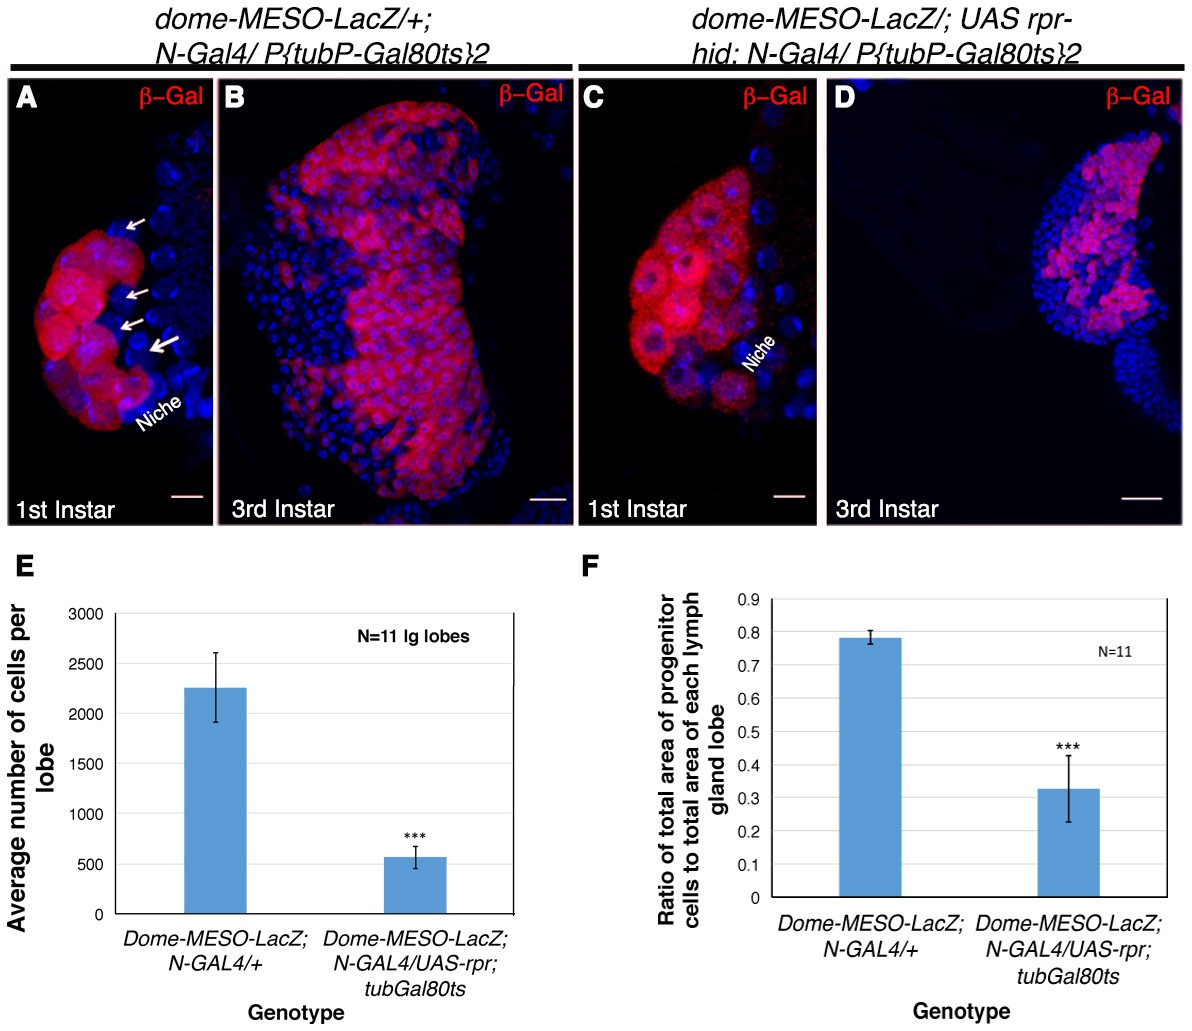
Genetic ablation of Notch expressing cells affects the size of the lymph gland.
(A) Expression of dome-MESO-LacZ in the lymph gland 16 hr after hatching. Four cells (arrow) lacking dome-MESO-LacZ expression are seen. (B) dome- MESO-LacZ expression in third instar larval lymph gland. (C) Activation of Reaper (rpr) by N- Gal4 in a short window of 4 hr resulted in elimination of the Notch positive HSCs. (D) Rearing the larvae of above genotype to third instar stages revealed a dramatic reduction in size of the lymph gland. (E–F) Quantitative analysis of average number of cells in the lymph glands of UAS-rpr/ MESO-LacZ; tubGal80ts; N-Gal4 revealed a 5 fold reduction in comparison to wild-type (E, 2.94016E-10; n = 11, two tailed unpaired Student’s t-test). Similarly we also observed a 2.4 fold reduction in progenitor cell index (measured as the ratio of average area of Dome expressing cells with respect to total area of the lymph gland lobe) in comparison to the sibling control (F, p=1.2172E-08, two tailed unpaired Student’s t-test, n = 11). Scale bar is 20 μm in B and D and 5 μm in A and C. Genotypes are shown on top of corresponding panels. DAPI marks the nucleus. Hours after larval hatching are as indicated in each panel. Error Bars=S.D.
-
Figure 6—source data 1
Contains numerical data plotted in Figure 6E,F.
- https://doi.org/10.7554/eLife.18295.019
Figure 6—figure supplement 1
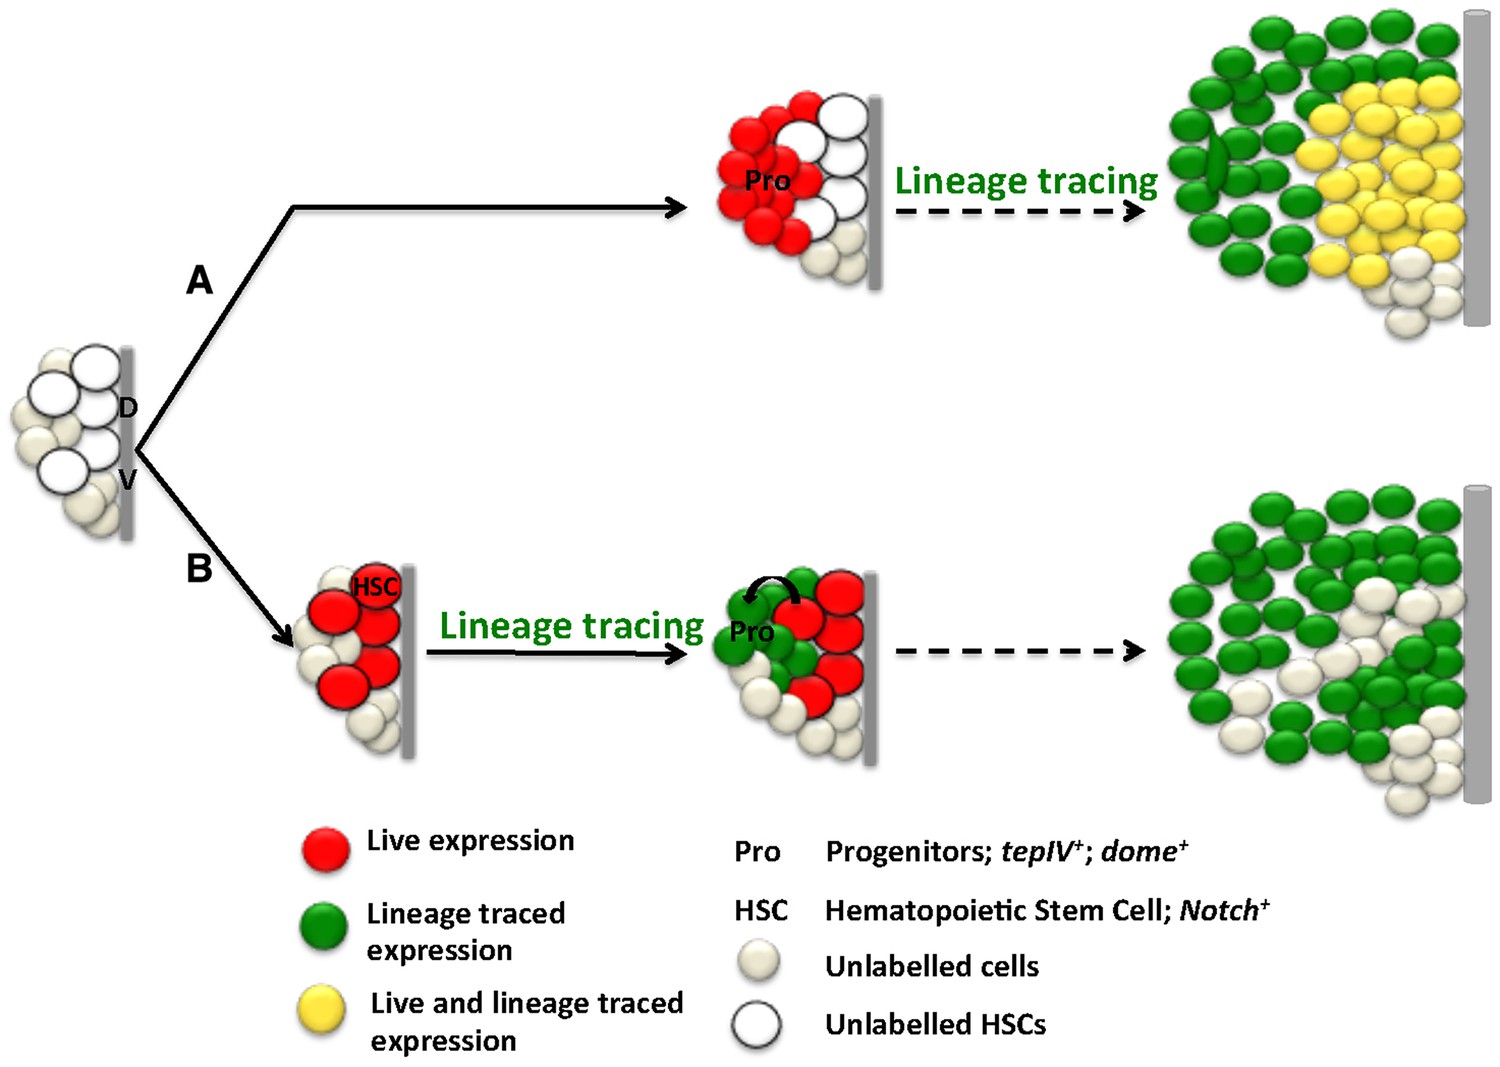
HSCs and progenitor lineages in the lymph gland.
A scheme showing fate maps of progenitor and N expressing HSCs. (A) Progenitor cells give rise to all cells of the lymph gland. (B) N expressing cells are founder cells of progenitors, thus can also give rise to majority of the cells of the lymph gland through an intermediate step of progenitor generation. N expressing HSCs are higher in order to dome expressing progenitors. All cells are color coded according to G-TRACE construct (red: live; green: lineage traced; yellow: live and lineage traced). DV: dorsal vessel; Pro: progenitors; HSC: N expressing cells.
Figure 7 with 1 supplement
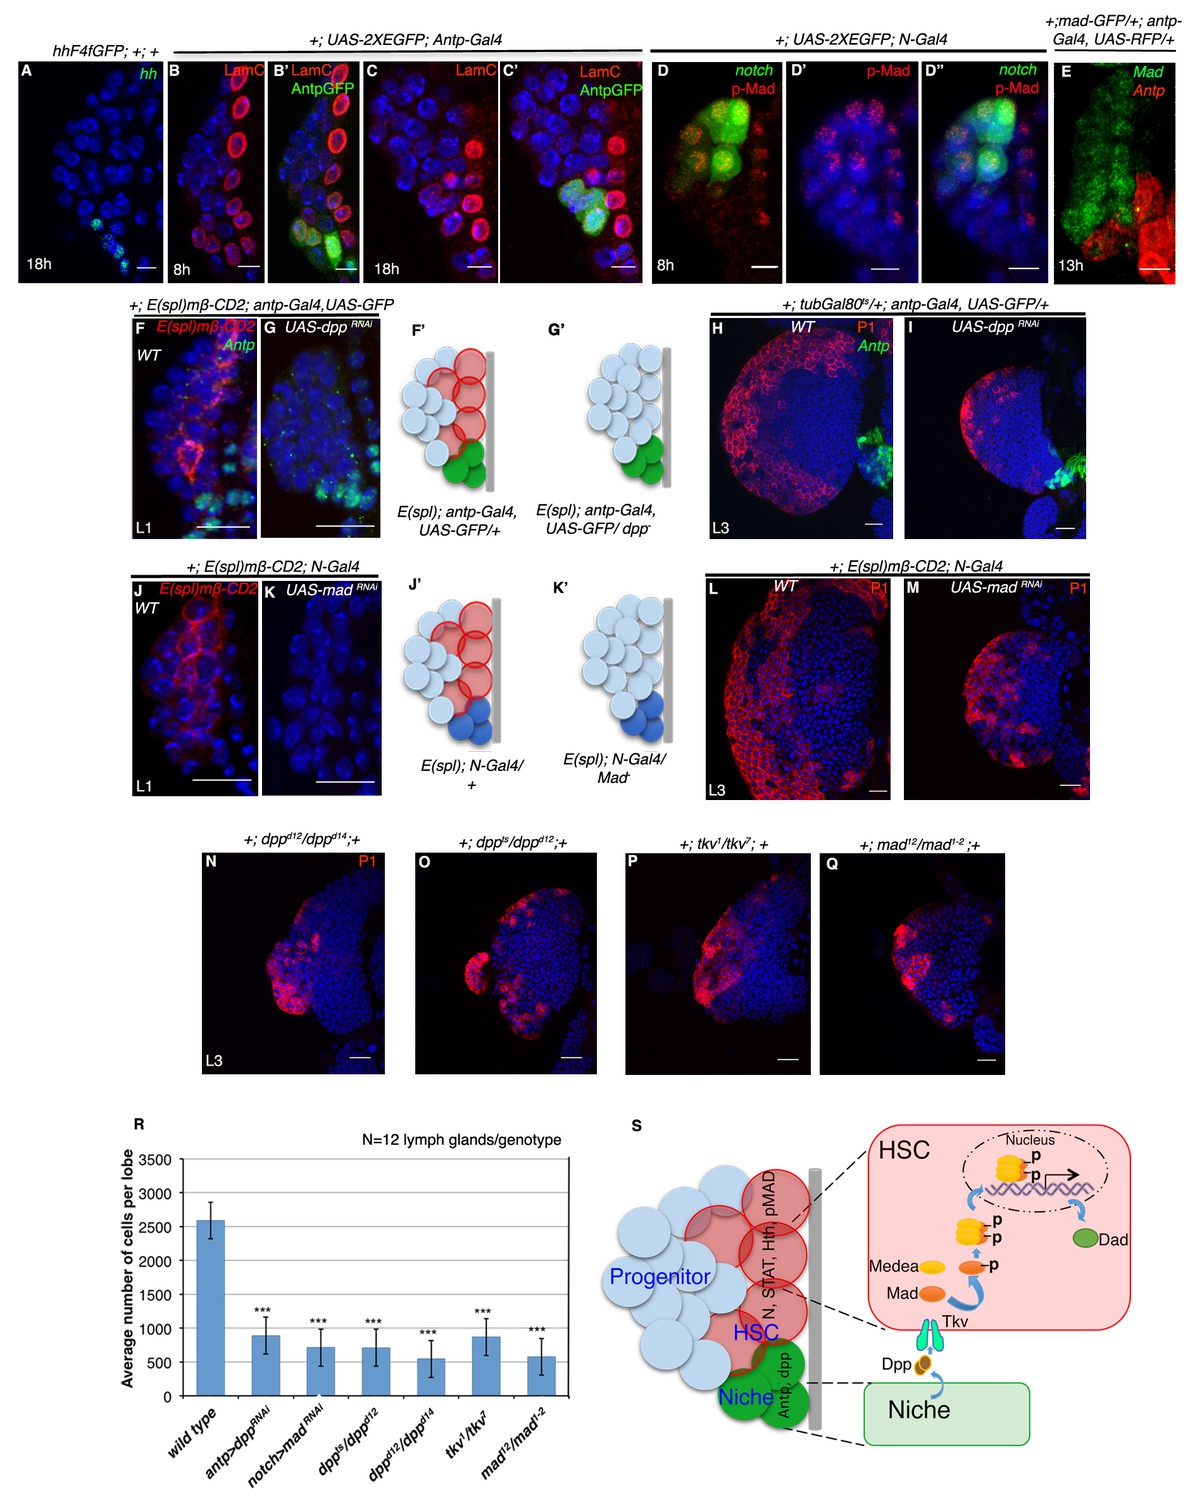
Requirement of Decapentapelagic (Dpp) from the PSC for hematopoietic stem cell maintenance in Drosophila.
(A) The maintenance signal for progenitors: Hedgehog (green; n = 7) starts to express in lg at about 18 hr AEH. (B–C') Lamin C (red) is expression in the niche/PSC (green) in 8 hr and 18 hr lg. (D–D") pMad (red) labeling at 8 hr AEH is enriched in HSCs (N-GFP; n = 6). Also see Figure 7—figure supplement 1C–C". (E) shows that MadGFP expression is predominantly absent from the PSC (F–G’) In first instar lymph gland, HSCs can be visualized by E(spl)mβ -CD2 (red, [F]). Downregulation of Dpp function in the niche causes precocious loss of this HSC marker (E(spl), red, [G]). F'–G' represent scheme of results from (F–G). Also see Figure 7—figure supplement 1D. (H–I) shows that in a late third instar, above genotype causes a 3-fold reduction in the size of the lymph gland (P1, red, n = 15, p=3.98092E-10, two tailed unpaired Student’s t-test) in comparison to the control in H. However, CZ cells (P1 positive: plasmatocytes, red, [H–I]) are present in above genotype. (J–K') Attenuation of Mad expression by MadRNAiin the HSCs (K) also causes premature loss of HSCs (E(spl)mβ-CD2, red, N = 15; 18 hr). J'–K' represent scheme of results from (J–K). Also see Figure 7—figure supplement 1D. (L–M) depicts that this genotype in a third instar stage also results in 3.6 fold reduction in the lymph gland size in comparison to the control in (L), although P1 positive cells are still detectable (red, n = 15, p=7.27E-10, two tailed unpaired Student’s t-test; [M]). Also see Figure 7—figure supplement 1E and G and Figure 7—figure supplement 1K–L. (N–Q) The hetero-allelic mutant combination dppd12/dppd14 (n = 12; p=4.75E-11, two tailed unpaired Student’s t-test; [N]) or temperature sensitive mutant combination (dppts/dppd12; n = 12; p=3.76329E-10, two tailed unpaired Student’s t-test; [O]) causes a 3.6 and a 4.7 fold decrease in the size of the lymph gland respectively. Dpp receptor Thickveins (Tkv) mutant animals (tkv1/tkv7; n = 12; p=7.78E-11, two tailed unpaired Student’s t-test; [P]) as well as Mad deficiency (mad12/mad1-2; n = 12; p=3.81811E-11, two tailed unpaired Student’s t-test; [Q]) exhibit a similar decrease in the size. Like RNAi genotypes, in all classical loss of function, an analogous phenotype is seen. (P1, red; [N–Q]; compare with [L]). Also see Figure 7—figure supplement 1H–J (R) Quantification of the results from H–I and L–Q. Average numbers of cells per lobe are indicated. (S) Schematic representation of Dpp function in HSC maintenance. Dpp from the Antp expressing PSC is transported to pMad expressing HSCs (also expressing STAT, N, Hth), near the dorsal vessel to activate its receptor Tkv, leading to the nuclear translocation of Mad that maintains HSCs. Thus, loss of either Dpp from the PSC (G) or Mad (K) or loss of Tkv (P) from the N expressing cells results in precocious loss of HSCs. Scale bar = 5 μm for A-E and 20 μm for rest. Error bars=S.D. Figure 7 has one figure supplement.
-
Figure 7—source data 1
Contains numerical data plotted in Figure 7R and Figure 7—figure supplement 1D,M.
- https://doi.org/10.7554/eLife.18295.022
Figure 7—figure supplement 1
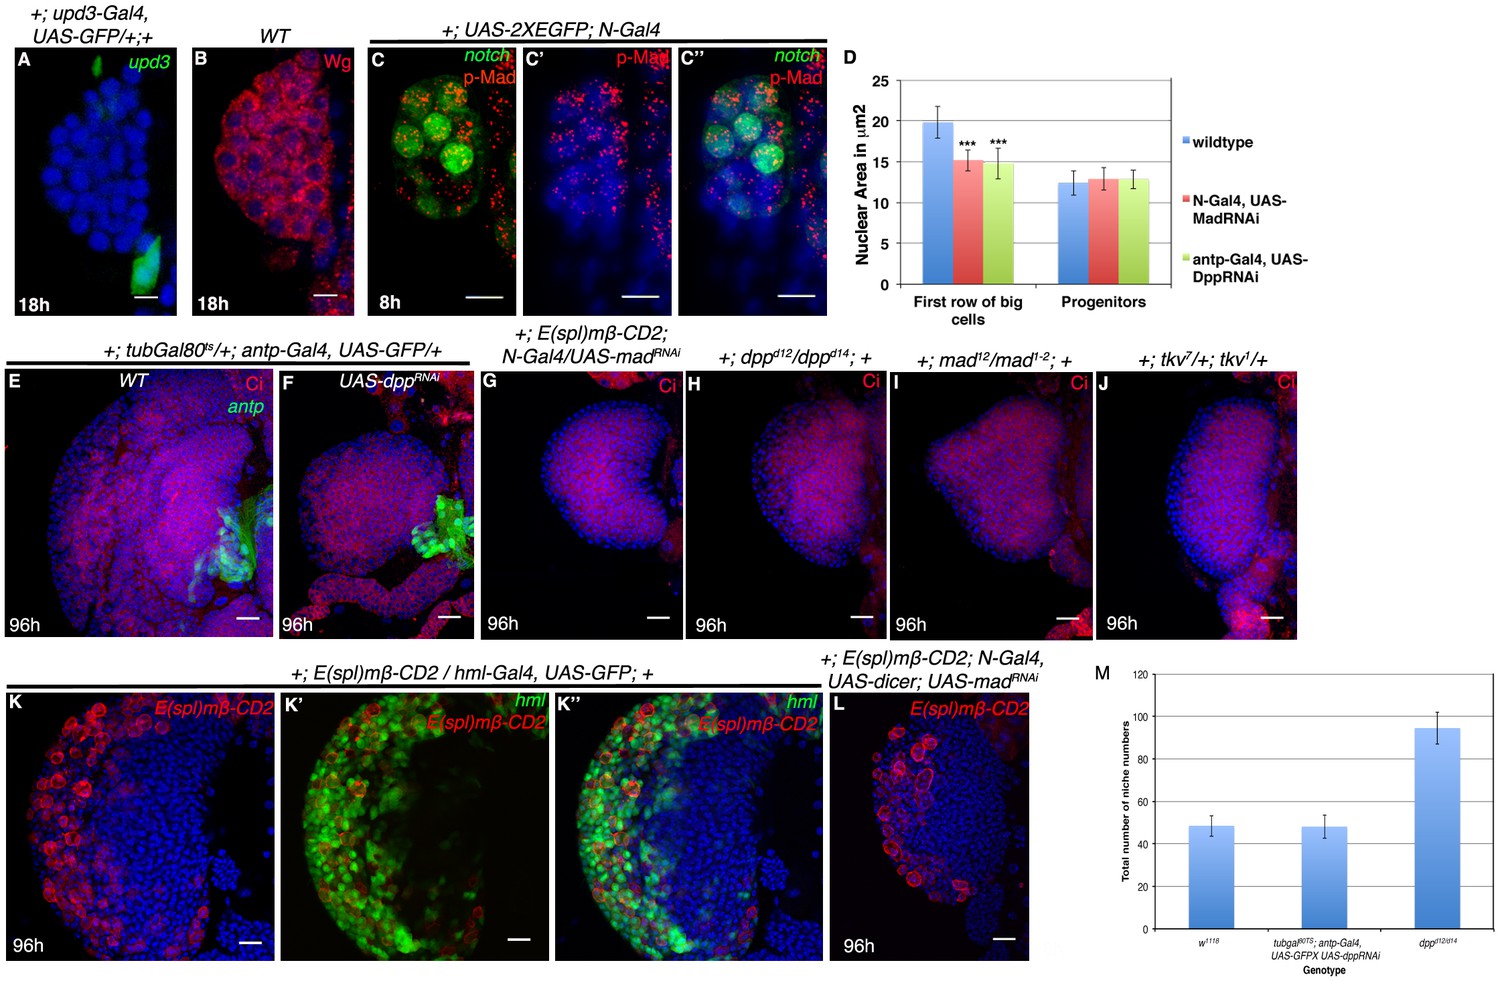
Involvement of Dpp signaling in HSC maintenance.
(A–B) show Upd3 expression ([A], green, n = 12) in a subset of PSC cells not earlier than 18 hr AEH, while (B) shows Wingless (Wg, red, n = 16) expression throughout first instar lymph gland. (C–C") shows another representative example of pMad enrichment in HSCs (N-GFP) (red, n = 6) (D) Quantitative analysis of effect of Dpp or Mad loss on HSCs, as seen by change in nuclear size. Nuclear size of first row of big cells near the DV decreases from 19.8 mm2 to 15.19 mm2 (n = 40 cells, p=5.46748E-19, two tailed unpaired Student’s t-test) in Mad loss and 14.78 mm2 (n = 40 cells, p=9.66379E-19, two tailed unpaired Student’s t-test) in Dpp loss from the HSC and PSC respectively. (E–G) Expressing dpp RNAi ([F], n = 12) in the niche or MadRNAi ([G], n = 15) in the HSC, during the critical window of late 16 of embryogenesis to 18 hr AEH, causes a drastic reduction in the size of the lymph gland but does not affect medullary-cortical zonation as seen by Cubitus Interruptus (Ci, Red) labeling, in comparison to the control in [E]. (H–I) show presence of medullary zone (Ci, Red, compare with [E])in hetero-allelic mutant combination of dpp (dppd12/dppd14 (n = 10; [H]) as well as Mad deficiency (mad12/mad1-2; n = 9; I]), although the size of the lymph gland is drastically reduced. (J) Analogous results are obtained in tkv7/tkv1 (Ci, Red, compare with [E]; n = 12). (K) shows wild type E(spl)mβ-CD2 expression as visualized by CD2 (red) staining in a third instar lg. (K'–K") shows that E(spl)mβ-CD2 expression overlaps with differentiating blood cell marker- Hemolectin (Hml; green).(L) shows that down-regulation of Mad from HSC during late embryo to 18 hr AEH has no effect on the E(spl)mβ-CD2 expression in the differentiated hemocytes of a late third instar lg (n = 6, compare with [K]). (M) Quantitative analysis of niche number in dpp loss (a short window of stage 16 of embryogenesis to 18 hr AEH) from the niche in 1st instar is comparable to control (p=0.856283596, n = 10, two tailed unpaired Student’s t-test) In contrast, classical loss of function genotype of dpp (dppd12/d14) revealed a significant increment in niche cell count when compared to wild-type (p=7.49838E-07, n = 10, two tailed unpaired Student’s t-test). Scale bar 5 μm (A–C") and 20 μm (E–L). Error Bars= S.D. Genotypes are shown on top of corresponding panels. DAPI marks the nucleus.
Figure 8
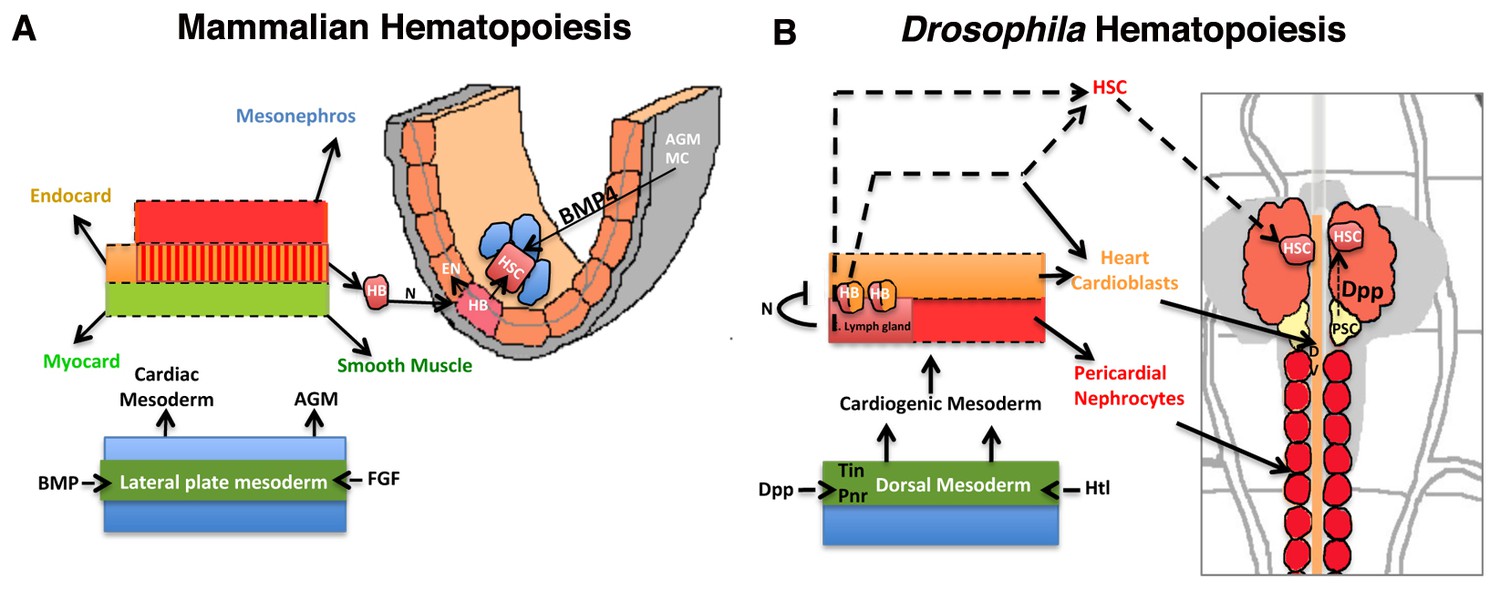
Significant parallels in HSC development in Mammalian and Drosophila hematopoiesis.
Models depicting similarities in the development of HSCs from the mammalian AGM (A) and D. melanogaster’s cardiogenic mesoderm (B; redrawn from (Mandal et al., 2004). The cardiogenic mesoderm in Drosophila is analogous to the developing AGM of vertebrate and is nourished by identical signals. In vertebrates, a subset of AGM-derived cells has been proposed to constitute hemangioblasts (HB), which produce HSCs and endothelial cells. These HSCs also require BMP4 signaling from the AGM mesenchyme (AGM MC) for its maintenance. Likewise in flies, a seeding HB has been proposed to give rise to a subpopulation of cardioblasts and lymph gland primordia. Lymph gland progenitors are thus derived from few HSCs that also require niche-derived Dpp signaling for their maintenance. AGM: Aorta-Gonad-Mesonephros; EN: Endothelium; HSC: hematopoietic stem cell; FGF: Fibroblast Growth Factor; Heartless: FGF fly homolog Htl; AGM MC: AGM mesenchyme; FGF: fibroblast growth factor; BMP: Bone morphogen protein; Dpp: Decapentapelagic (BMP fly homolog); HB: Hemangioblast; PSC: Posterior Signaling Centre (Niche); DV: Dorsal vessel, heart.
Author response image 1
Videos
Video 1
Position of Notch expressing cells in the first instar lymph gland with respect to progenitors (Red), PSC (Magenta) and the dorsal vessel (Blue).
Also see Figure 1—figure supplement 2.
Download links
A two-part list of links to download the article, or parts of the article, in various formats.
Downloads (link to download the article as PDF)
Open citations (links to open the citations from this article in various online reference manager services)
Cite this article (links to download the citations from this article in formats compatible with various reference manager tools)
Dpp dependent Hematopoietic stem cells give rise to Hh dependent blood progenitors in larval lymph gland of Drosophila
eLife 5:e18295.
https://doi.org/10.7554/eLife.18295


