PDZD7-MYO7A complex identified in enriched stereocilia membranes
- Oregon Health and Science University, United States
- University of Miami, United States
- The Scripps Research Institute, United States
- Kyung Hee University, Korea
Figures
Figure 1 with 1 supplement

D10 chick stereocilia-membrane enrichment procedure.
(A) Flow chart for stereocilia membrane enrichment. Bold red lettering highlights the principal steps of the procedure. (B) Imaging of M3 fraction of D10 beads; samples were labeled with phalloidin (magenta, for actin), DAPI (green, for nuclei), and anti-mouse IgG (white, for D10 antibody on beads). Aggregation of beads and binding of nuclei (and other contaminants) limits the enrichment gained with this step. (C) SDS-PAGE analysis of enrichment fractions; gel stained with silver. Note that fraction S7 was loaded in a second lane with 4x more material. (D) Immunoblot analysis of purification fractions. For actin (ACT), lanes 1–10 had 0.01 ear-equivalents loaded and lane 11 had 0.2 ears. For all other immunoblots, lanes 1–10 had 0.05 ear-equivalents loaded and lane 11 had 0.2 ears. Other than actin, all proteins are referred to by their official gene symbols.
Figure 1—figure supplement 1
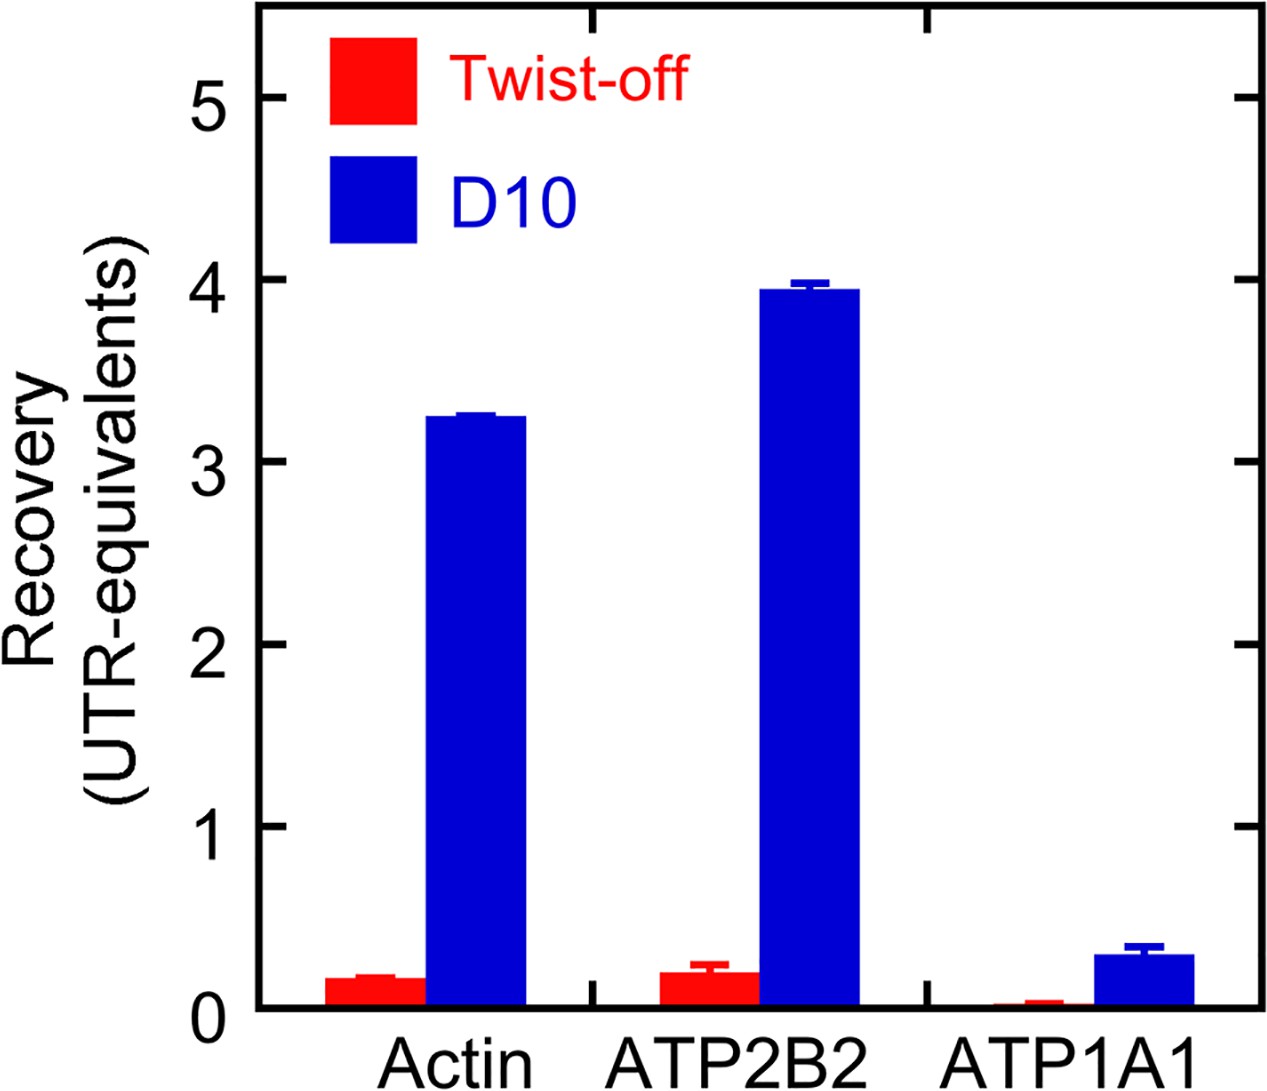
Protein recovery with D10 and twist-off methods.
Samples (0.3 and 1.0 ear-equivalents) of hair bundles purified by twist-off and stereocilia membranes purified by the D10 purification were subjected to immunoblotting with antibodies against actin, ATP2B2, and ATP1A1. Aliquots of whole utricle (0.05–1.2 utricles) were run on the same gel for calibration. Fiji was used to measure the immunoblot intensity for each protein in each lane, and the calibration curve was used to determine the amount of each protein recovered in twist-offs or D10 preps relative to the amount in whole utricle. Linear regression was used to determine the recovery (in utricle-equivalents) per ear of starting material. Because seven sensory epithelia were sampled, actin and ATP2B2 were present in the D10 prep at levels considerably higher per ear than was seen in the whole utricles. ATP1A1 was not detected in twist-offs, and while substantial amounts were detected in the D10 prep, they were relatively low compared to the amount present in a whole utricle. Mean ± standard error for the regression fit are plotted.
Figure 2
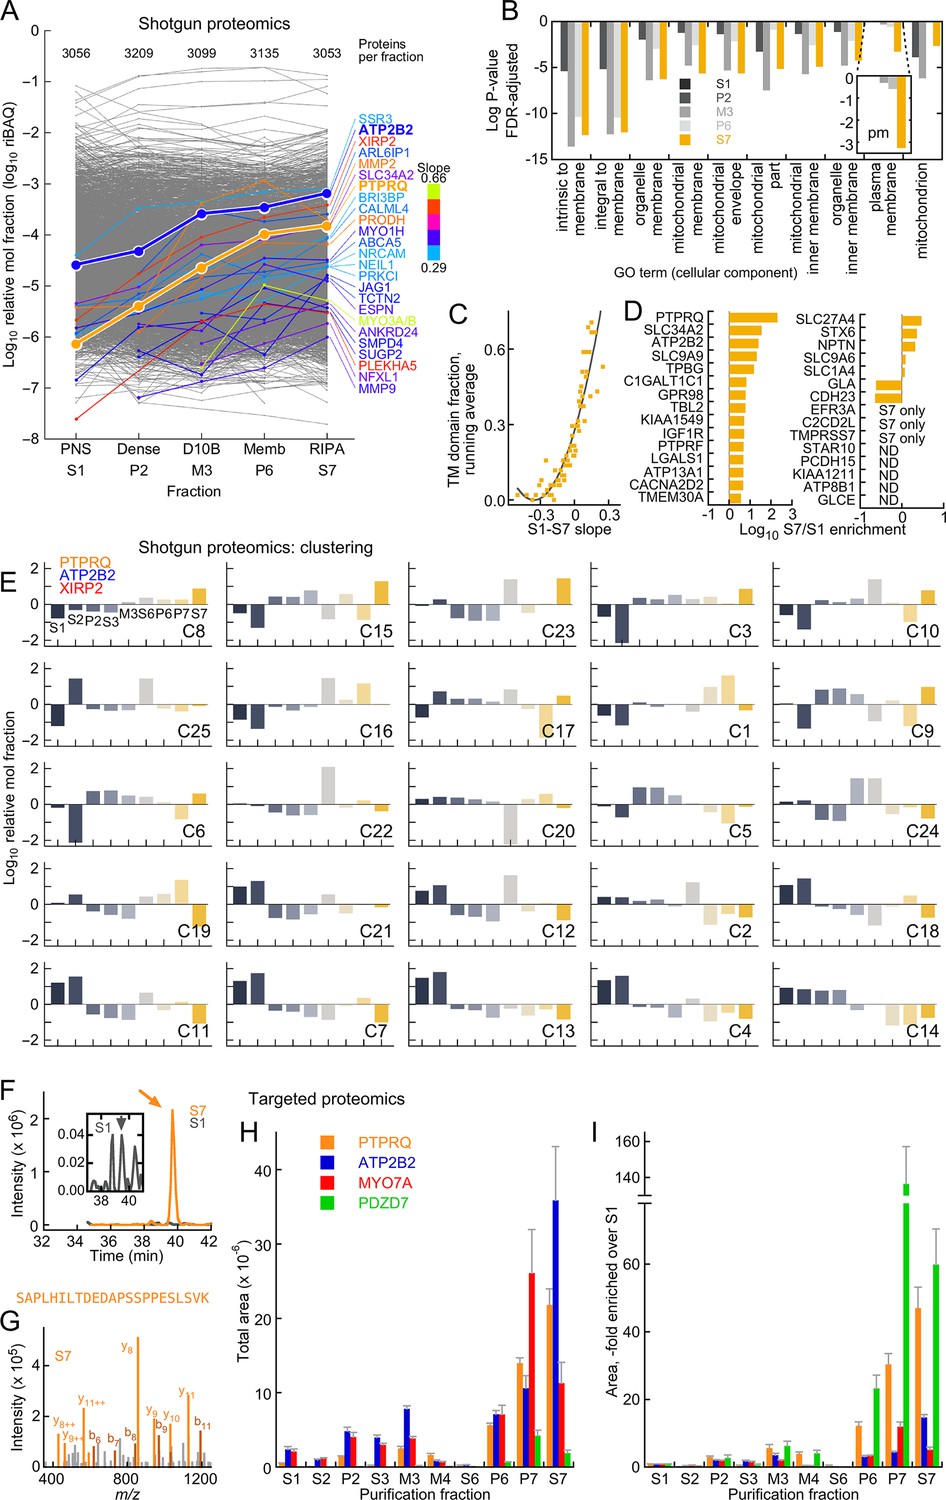
Mass spectrometry analysis of D10 stereocilia-membrane enrichment.
(A) Shotgun mass-spectrometry quantitation of 3313 proteins detected in at least three of five purification fractions where enrichment of stereocilia membranes was expected. The slope of the purification fraction (assuming an interval of 1) vs. log riBAQ was calculated for each protein, and the top 25 proteins with the steepest positive slopes ('enrichment slope') were highlighted. Color indicates the slope steepness. For this analysis, ATP2B2 was split out of the group also containing ATP2B1 and ATP2B4 group; data corresponding both ATP2B2 and PTPRQ were emphasized to illustrate the effectiveness of the stereocilia-membrane enrichment. The number of proteins detected in each fraction was also indicated. (B) Gene ontology analysis with DAVID of the S7 (RIPA-soluble) fraction using S1 (PNS) as background. The top ten cellular component terms enriched are indicated; the log of the P-value (adjusted for false-discovery rate, FDR) is plotted. The inset shows a magnification of the 'plasma membrane' term, which had a substantial increase in significance in the S7 fraction. (C) Relationship between enrichment slope and frequency of Ensembl-annotated transmembrane helicies. Each protein identified was assigned 1 if they were annotated as having a transmembrane helix, and 0 if not. All proteins were sorted according to enrichment slope, and an average was calculated every 50 proteins. (D) Stereocilia membrane protein enrichment. Displayed are bundle-enriched (>three-fold) proteins from Wilmarth et al. (2014) that were annotated as containing transmembrane domains, plus SLC34A2, SLC9A9, and SLC9A6. ND, not detected. (E) Clustering analysis of shotgun mass-spectrometry data using mclust. After data were log-transformed, they were normalized within a row, subtracting the row mean and dividing by the row standard deviation (thus the resulting mean was 0 and the standard deviation was 1). The best solution returned 25 clusters, which were ordered here by the enrichment slope (only the five fractions used in A were used to calculate the slope). PTPRQ, ATP2B2, and XIRP2 were all in the cluster with the steepest enrichment slope. (F–I) Targeted proteomics analysis of enrichment fractions. (F) Chromatograms of SAPLHILTDEDAPSSPPESLSVK peptide from PTPRQ detected in S1 (dark gray) and S7 (orange) fractions; inset shows magnified S1 chromatogram. Sum of 12 daughter ions. Arrows indicate where multiple MS2 spectra matched to PTPRQ were acquired. (G) Example MS2 spectrum from S7 sample; multiple peaks matched to predicted PTPRQ peptide fragment ions. (H) Targeted proteomics analysis of enrichment fractions. The mean of the total intensity area of 4–8 peptides per protein is indicated. (I) Same data as G, except area relative to S1 is indicated.
-
Figure 2—source data 1
Analysis of the shotgun proteomics experiments characterizing the protein composition of the D10 stereocilia-membrane purification from the chick inner ear.
- https://doi.org/10.7554/eLife.18312.007
-
Figure 2—source data 2
Output of the mclust analysis of the D10 purification fractions.
- https://doi.org/10.7554/eLife.18312.008
Figure 3 with 1 supplement
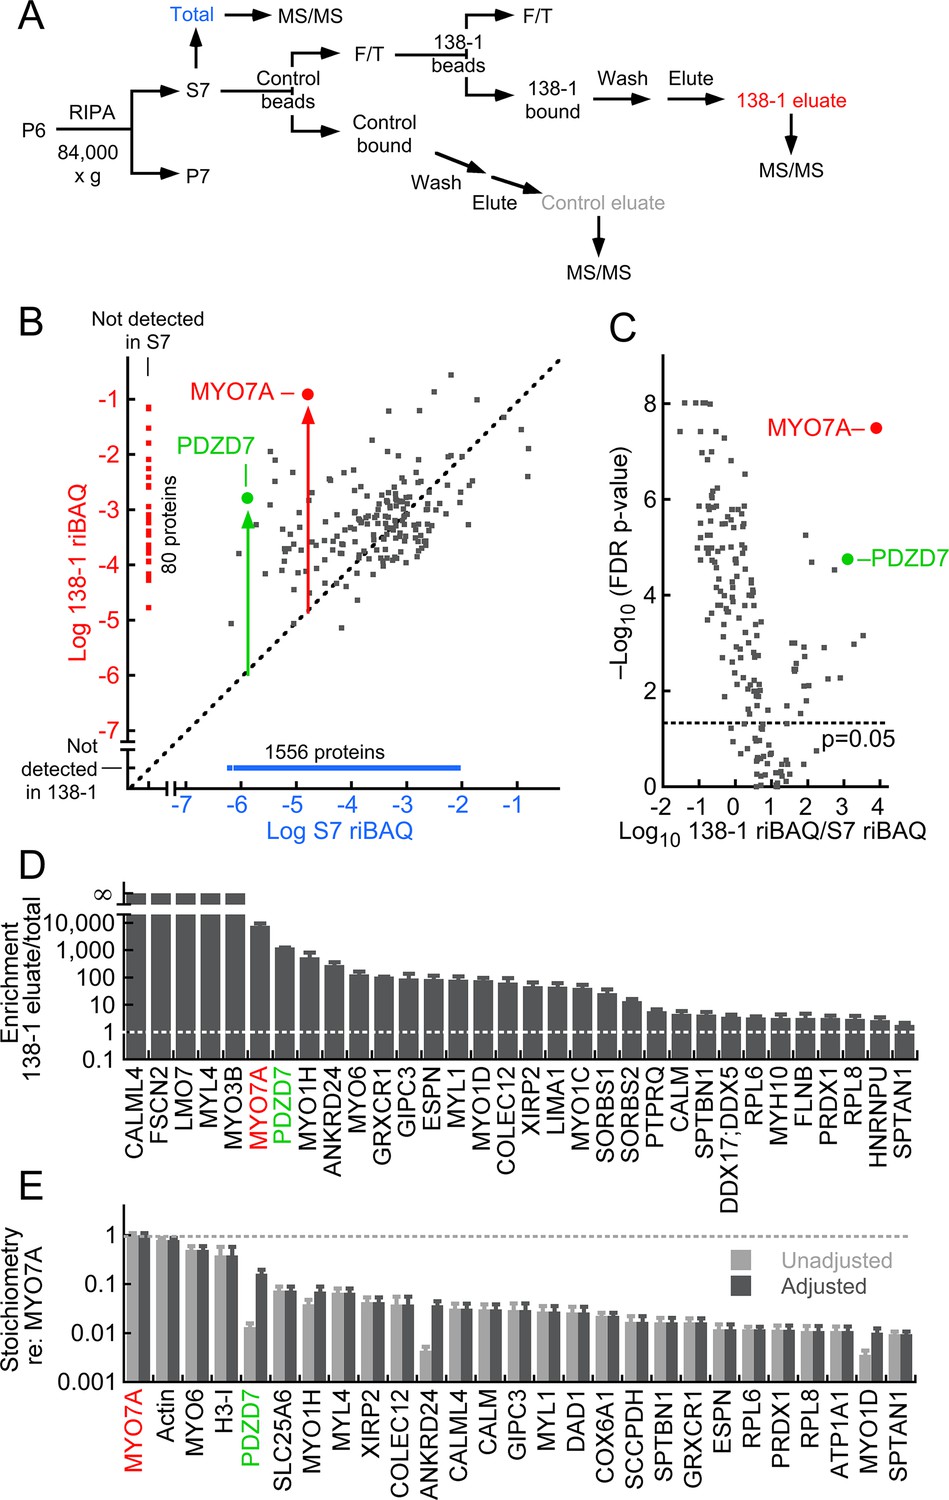
MYO7A immunoaffinity purification from D10 enriched membranes.
(A) Flow chart describing immunoaffinity purification strategy using the 138-1 monoclonal antibody, which recognizes chicken MYO7A. Mass spectrometry was carried out on the total (S7; RIPA-soluble fraction), 138-1 eluate, and control eluate. F/T, unbound material; MS/MS, tandem mass spectrometry analysis. (B–E) Shotgun proteomics analysis of 138-1 immunoaffinity purification. (B) Relative protein levels of 1719 proteins detected in at least one run of total or 138-1 eluate. Distance from the diagonal unity line (gray dashed) indicates enrichment by 138-1; note that MYO7A (red symbol) and PDZD7 (green) are highly enriched. (C) Volcano plot illustrating enrichment and statistical significance. The x-axis displays the log10 of each protein’s enrichment by 138-1 immunoprecipitation relative to the S7 starting material, while the y-axis indicates the log10 value of the FDR (false discovery rate) adjusted p-value for that enrichment value. Dashed line indicates significance at p=0.05. (D) Top 32 proteins in 138-1 eluates by enrichment. Only proteins not detected in control runs and detected in at least four of six 138-1 runs are displayed. (E) Top 27 proteins in 138-1 eluates by stoichiometry relative to MYO7A. Only proteins detected in at least four of six 138-1 runs are displayed; proteins detected in control eluates (e.g., actin) were also included. Unadjusted stoichiometry: (138-1 riBAQ for protein of interest)/(138-1 riBAQ for MYO7A). Adjusted stoichiometry: (unadjusted stoichiometry) × (total riBAQ for MYO7A)/(total riBAQ for protein of interest). Figure 3—figure supplement 1 displays an immunoblot analysis of the 138-1 immunoprecipitation, examining MYO7A and its Usher syndrome partners USH1C and CDH23.
-
Figure 3—source data 1
Analysis of the shotgun proteomics experiments characterizing the protein composition of the 138-1 anti-MYO7A immunoaffinity purification from the chick inner ear.
- https://doi.org/10.7554/eLife.18312.012
Figure 3—figure supplement 1
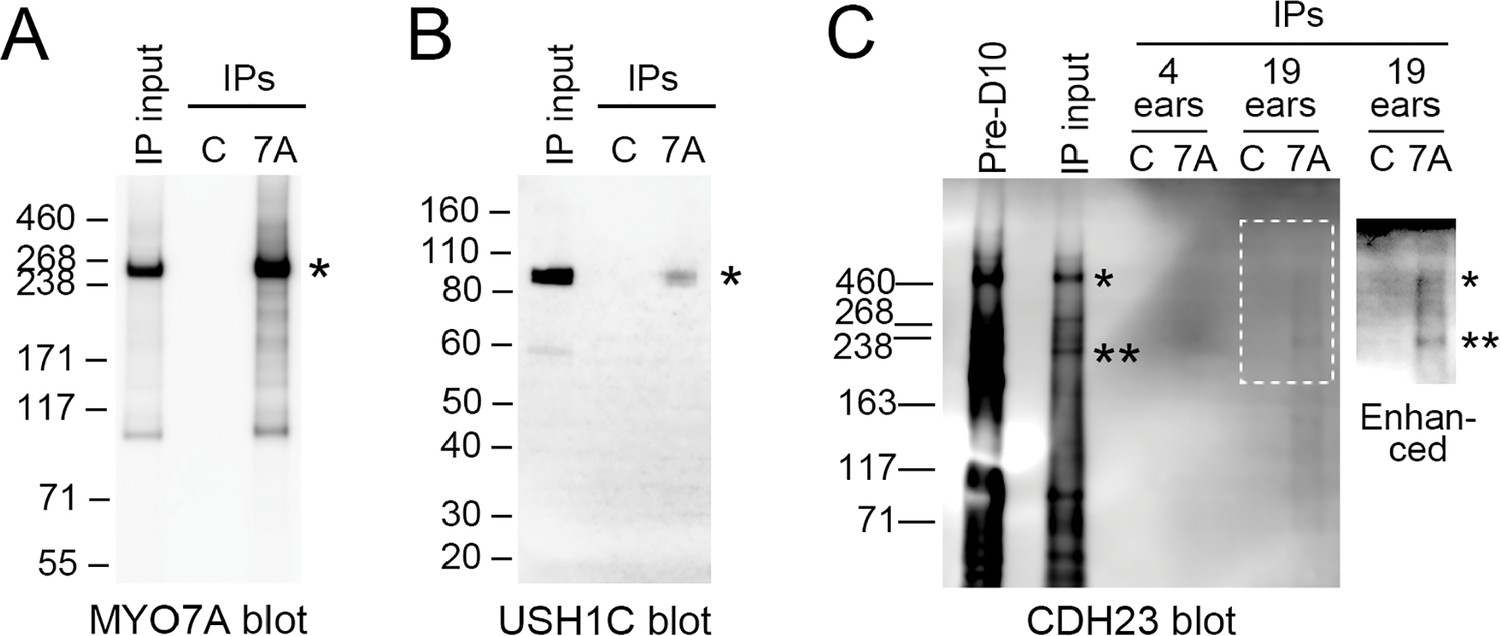
Immunoprecipitation of upper tip-link density components from D10-enriched stereocilia membranes.
(A) MYO7A (asterisk). IP input was 100%. Key: IP input, ears starting total extract (S7); C, control immunoprecipitates; 7A, 138-1 immunoprecipitates; IPs, immunoprecipitates. (B) USH1C (asterisk). IP input was 100%. (C) CDH23. IP input was 4 ear-equivalents, which corresponds to 100% (4 ears) and 20% (19 ears). With image enhancements to the blot, CDH23 bands were apparent in 138-1 eluates but not in control eluates. Key: Pre-D10, dense membranes (P2); ears, ear-equivalents loaded; Enhanced, blot adjusted by changes to dark level and gamma. Asterisks indicate positions of high (*) and lower (**) mass bands immunoreactive for CDH23.
Figure 4
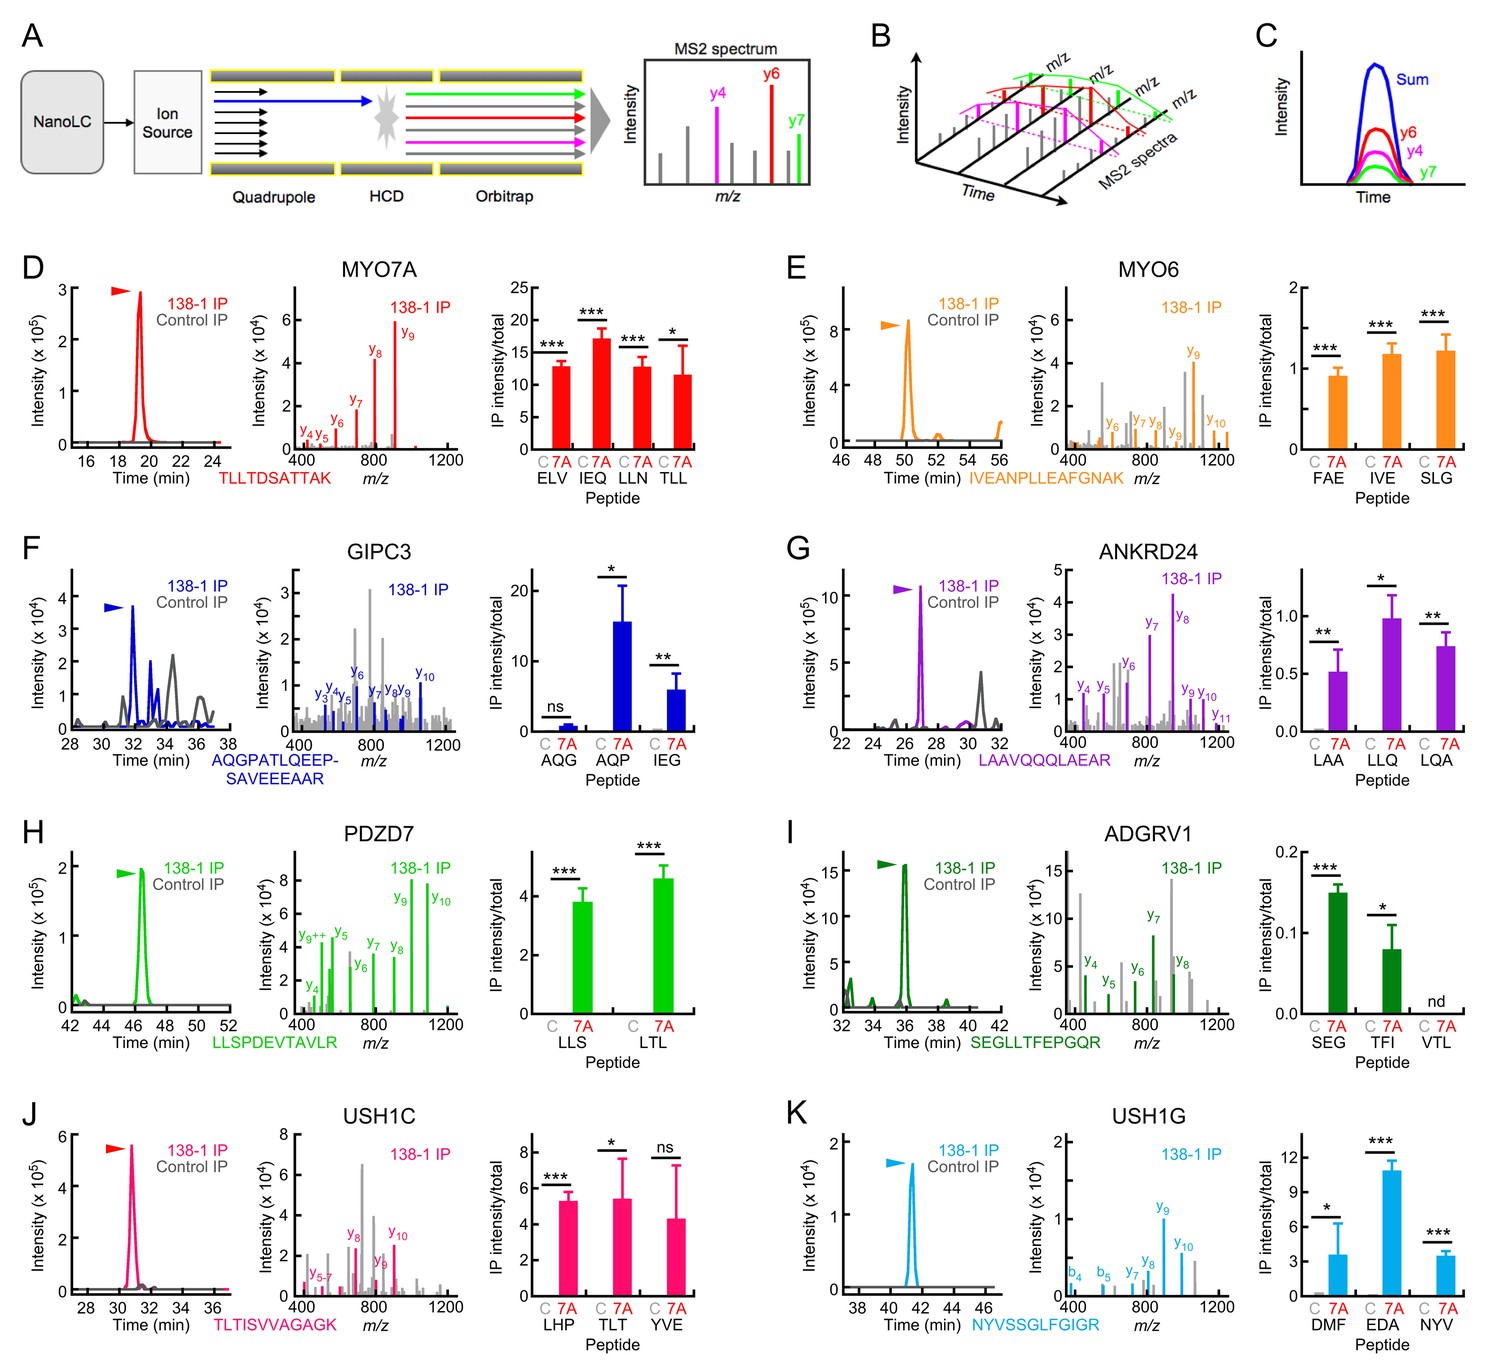
Targeted mass spectrometry analysis of MYO7A immunoaffinity purification from chick stereocilia.
(A–C) Diagrams illustrating targeted analysis. (A) Peptides eluting from the nano-scale liquid chromatography (NanoLC) system are introduced into a Tribrid Fusion mass spectrometer by electrospray (Ion source). Monitored peptides (blue) are selected within the quadrupole mass analyzer, then are fragmented using higher-energy collisional dissociation (HCD). Fragment mass spectra (MS2) acquired from the Orbitrap analyzer are searched against a protein database to confirm the identity of the monitored peptide. (B) Robustly detected daughter ions (here y4, y6, and y7) can be monitored over time. (C) Each daughter ion is monitored over time; signal from all monitored daughter ions is summed and the time-summed intensity plot is integrated to determine the signal for the peptide of interest. (D–K) Targeted mass-spectrometry analysis of indicated proteins. Panels are: left, time-intensity plot summed over all daughter ions of indicated peptide (138-1 and control eluates); center, database-matched MS2 spectrum (138-1 eluate); right, integrated intensities for indicated peptides (mean ± SEM). (D) MYO7A. (E) MYO6. (F) GIPC3. (G) ANKRD24. (H) PDZD7. (I) ADGRV1. (J) USH1C. (K) USH1G. Key: C, control eluates; 7A, 138-1 eluates. Arrowhead indicates elution position for heavy-labeled peptide and region where MS2 spectra match to the indicated protein. Statistical tests used two-tailed Student’s t-test, with significance indicated in the figure as follows: *p<0.05; **p<0.01; ***p<0.001. Exact p-values and 95% confidence intervals are tabulated in Figure 4—source data 1.
-
Figure 4—source data 1
Analysis of the targeted proteomics experiments characterizing the protein composition of the 138-1 anti-MYO7A immunoaffinity purification from the chick inner ear.
- https://doi.org/10.7554/eLife.18312.015
Figure 5
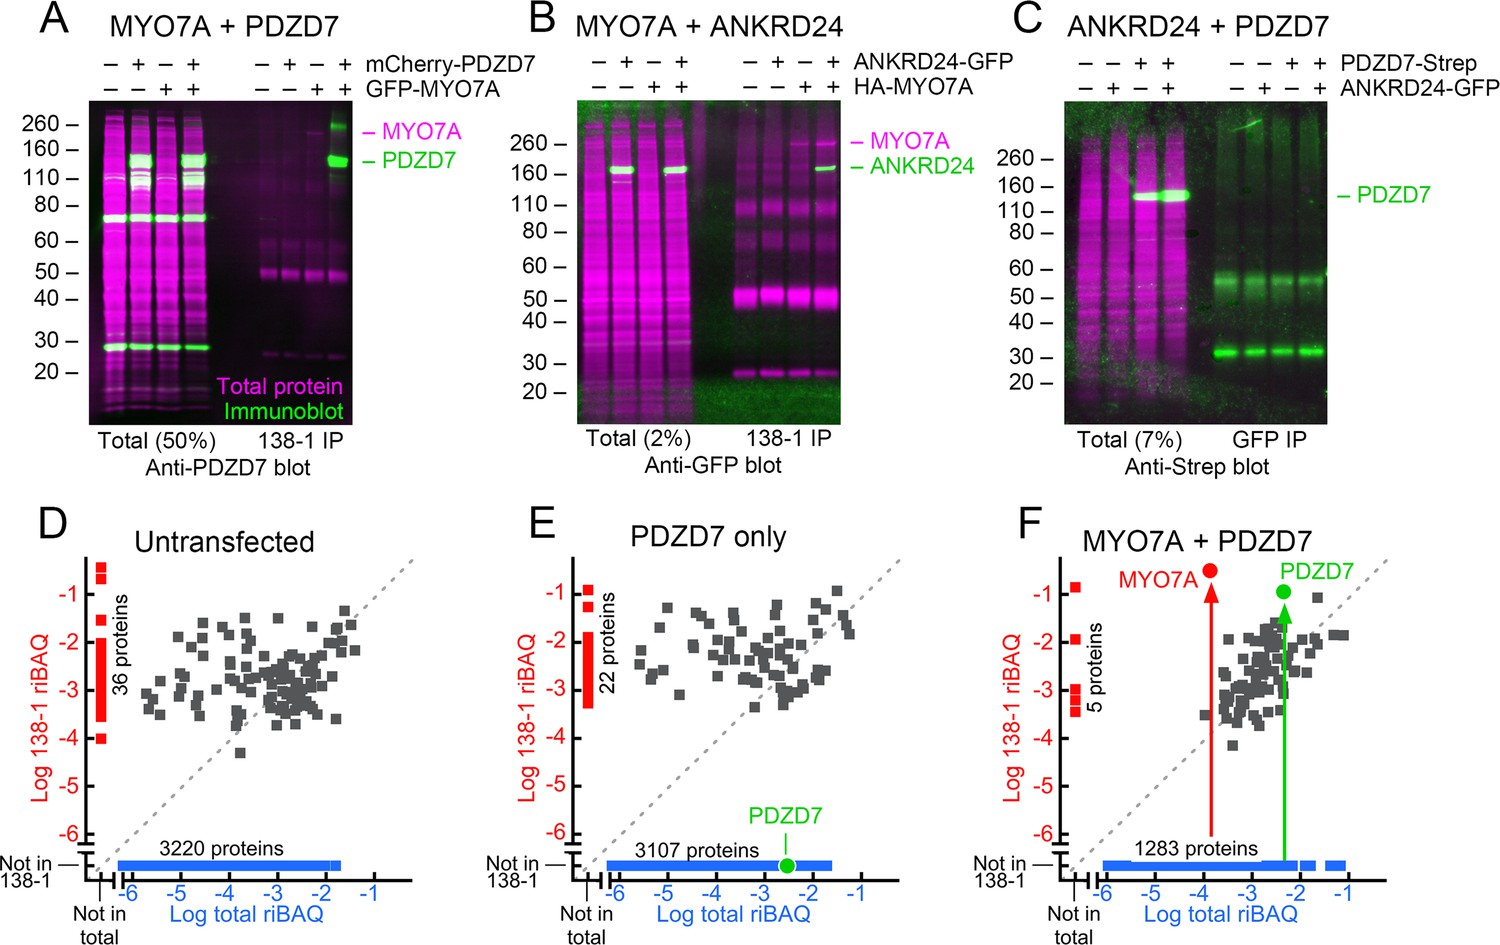
Interaction of mouse MYO7A and partners in HEK293 cells.
PDZD7, ANKRD24, and GFP-MYO7A proteins are mouse; HA-MYO7A is human. (A–C) Immunoprecipitation and protein immunoblotting. Each panel has the immunoblot detection (green) superimposed on the ink stain for total protein (magenta). Note that MYO7A, immunoprecipitated in each case, is usually visible on the ink stain. Molecular mass markers (in kD) are indicated on the left. Left side, starting material for immunoprecipitation (total), with the fraction loaded relative to the immunoprecipitate indicated. Right side, immunoprecipitates. (A) PDZD7 and MYO7A. Immunoprecipitation with 138-1 antibody; immunoblot with anti-PDZD7. (B) ANKRD24 and MYO7A. Immunoprecipitation with 138-1 antibody; immunoblot with anti-GFP. (C) PDZD7 and ANKRD24. Immunoprecipitation with anti-GFP antibody; detection with anti-Strep. (D–F) Immunoprecipitation and mass spectrometry. (D) Untransfected HEK293 cells. (E) HEK293 cells transfected with mCherry-Pdzd7 plasmid alone. No PDZD7 was immunoprecipitated with the 138-1 antibody. (F) HEK293 cells co-transfected with Gfp-Myo7a and mCherry-Pdzd7 plasmids. MYO7A and PDZD7 were highly enriched in the 138-1 immunoprecipitates. Note that no PDZD7 was detected in HEK293 cells transfected with Gfp-Myo7a alone.
-
Figure 5—source data 1
Analysis of the shotgun proteomics experiments characterizing the protein composition of the 138-1 anti-MYO7A immunoaffinity purification from transfected HEK cells.
- https://doi.org/10.7554/eLife.18312.017
Figure 6
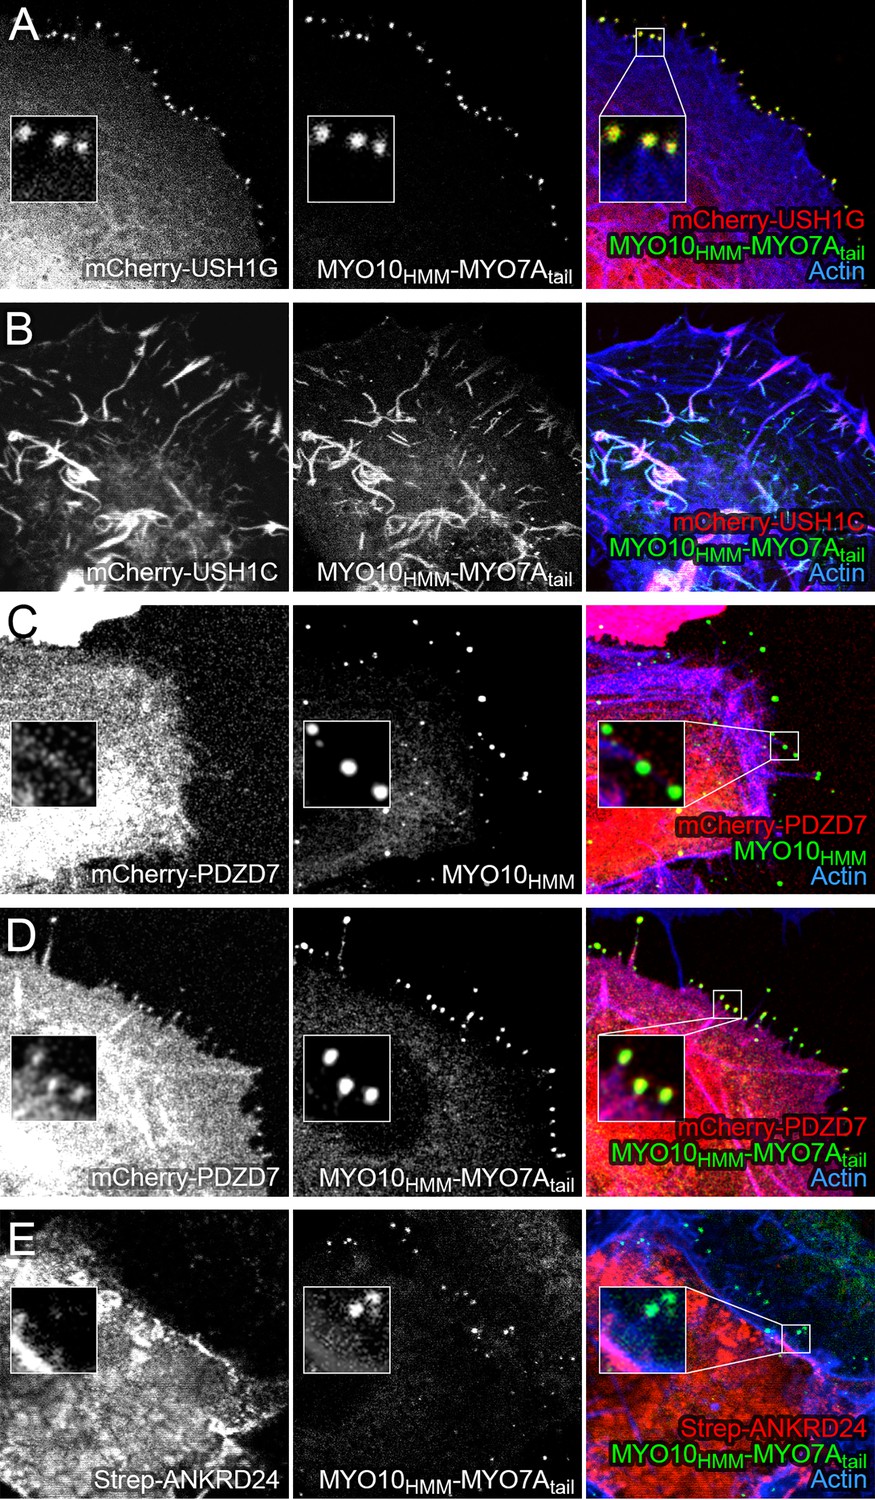
Co-localization of PDZD7 with MYO10-MYO7A fusion.
COS7 cells were transfected with the indicated constructs and stained with phalloidin to detect actin. MYO10HMM and MYO10HMM-MYO7Atail constructs (derived from bovine MYO10 and human MYO7A) were fused to GFP, which was imaged directly, as was mCherry fused to the indicated molecules. (A) mCherry-USH1G robustly localizes to filopodia tips when expressed with MYO10HMM-MYO7Atail. (B) mCherry-USH1C generates actin cables, to which MYO10HMM-MYO7Atail targets. (C) mCherry-PDZD7 does not concentrate at filopodia tips when the control MYO10HMM construct is expressed. Occasional exceptions are seen (yellow asterisk). (D) mCherry-PDZD7 does concentrate at filopodia tips when the MYO10HMM-MYO7Atail construct is expressed. (E) Very little Strep-ANKRD24 co-localizes with MYO10HMM-MYO7Atail at filopodia tips. Main panels are 40 × 40 µm; inset panels are 4 × 4 µm.
Figure 7
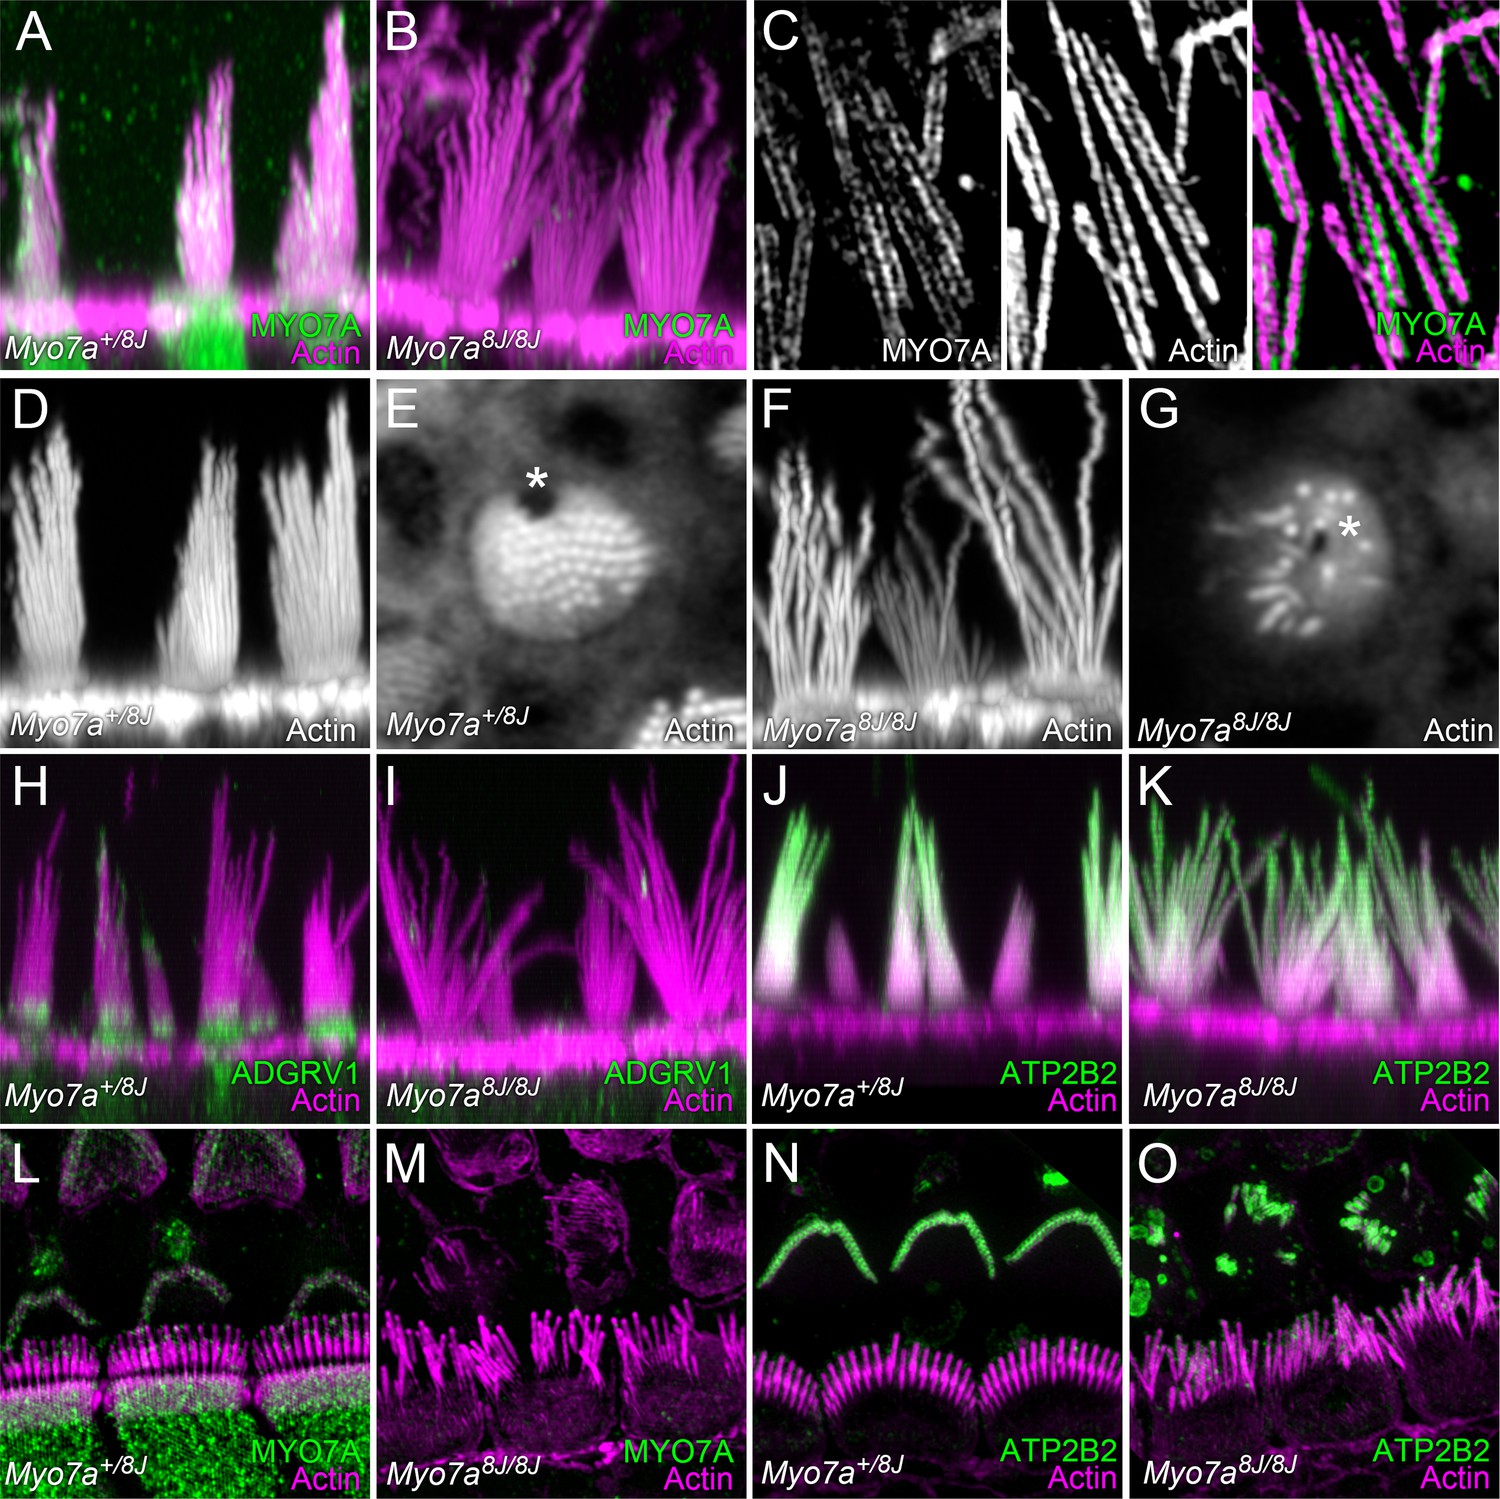
MYO7A localization in P8 mouse hair cells.
(A) MYO7A immunoreactivity in +/8J heterozygote utricle. (B) MYO7A immunoreactivity in a 8J/8J homozygote utricle. Antibody signal is gone. (C) MYO7A immunoreactivity in utricle stereocilia isolated on poly-lysine-coated glass; structured-illumination microscopy. Note punctate labeling outside of the actin core. (D) Phalloidin staining of +/8J heterozygote utricle. (E) Cross-section of +/8J heterozygote utricle immediately above the cuticular plate. The cytoplasmic channel where the kinocilium inserts, the fonticulus, is located asymmetrically (*). (F) Phalloidin staining of 8J/8J homozygote utricle. Many stereocilia are abnormally long; bundle cohesion is absent. (G) Cross-section of 8J/8J homozygote utricle immediately above the cuticular plate. Note the fonticulus is centrally located (*). (H) ADGRV1 immunoreactivity in +/8J heterozygote utricle; note band at ankle links region. (I) ADGRV1 immunoreactivity in a 8J/8J homozygote utricle. Antibody signal is gone. (J) ATP2B2 immunoreactivity in +/8J heterozygote utricle. (K) ATP2B2 immunoreactivity in a 8J/8J homozygote utricle. Antibody signal is unchanged. (L) MYO7A immunoreactivity in +/8J heterozygote cochlea; structured-illumination image. MYO7A labeling is punctate; it is sparse in the hair bundle, and strong in the cytoplasm. Inner hair cell stereocilia are bent backwards against the coverslip, causing them to overlap the outer hair cell area. (M) MYO7A immunoreactivity in a 8J/8J homozygote cochlea. Antibody signal is absent. (N) ATP2B2 immunoreactivity in +/8J heterozygote cochlea. Note weak staining in inner hair cells, but extremely strong staining in outer hair cells. (O) ATP2B2 immunoreactivity in a 8J/8J homozygote cochlea. Although the morphology of bundles from inner and outer hair cells has changed dramatically, ATP2B2 is still targeted to each in approximately the same density. Scales: panels A, B, D, and F are 20 × 20 µm; panels in C are 6.7 × 10 µm; panels E and G are 10 × 10 µm; panels H–K are 25 × 25 µm; panels L–O are 20 × 20 µm.
Figure 8 with 1 supplement

PDZD7 localization at ankle links depends on MYO7A in P8 mice.
(A) PDZD7 immunoreactivity in wild-type utricle. Note PDZD7 in band near the stereocilia ankles (arrows), consistent with previous localization at ankle links. (B) Deconvolution analysis of utricle hair bundle at the level of the cuticular plate. PDZD7 immunoreactivity appears as a ring around the cytoplasmic channel in the cuticular plate. PDZD7 is also present in the pericuticular necklace surrounding the cuticular plate (arrows); image gamma was adjusted to 1.5 to allow visualization of pericuticular labeling without saturating cytoplasmic-channel labeling. (C) PDZD7 immunoreactivity in utricle hair bundle isolated on poly-lysine-coated glass; structured-illumination microscopy (SIM). Immunoreactivity near the stereocilia tapers is apparent (arrows). (D) Co-labeling of MYO7A and PDZD7 in utricle stereocilia isolated on glass using SIM. PDZD7 labeling above tapers is indicated (arrows). Insert, magnification of box in right-hand merged image. M, MYO7A; P, PDZD7; A, actin. Note that MYO7A and PDZD7 punctae occasionally overlap (yellow). (E) Quantitation of PDZD7 and MYO7A along utricle stereocilia length. Left panel, quantified stereocilia are indicated. Note that the three stereocilia from panel D are included. Right panel, average fluorescence signals from each channel from stereocilia aligned at the taper. Note the decreased stereocilia diameter near 0 µm, which corresponds to the peak of PDZD7 labeling (at ~0.5 µm). (F) MYO7A and PDZD7 punctae partially overlap in utricle stereocilia shafts. Individual channels and the merge of the PDZD and MYO7A channels are shown. Arrows indicate punctate that are present both in PDZD7 and MYO7A channels; arrowheads indicate PDZD7 at ankle-links region. (G) Single utricle hair cell after in utero electroporation with mCherry-PDZD7 at E12 and analysis at P2. mCherry-PDZD7 is located in the ankle-link region (arrows). (H) Single cochlear outer hair cell labeled after injectoporation with mCherry-PDZD7 at P3 and imaged after 2 days in culture. Labeling is associated with stereocilia base, although the top view obscures that localization. Airyscan processing. Additional transfected cells are displayed in Figure 8—figure supplement 1. (I) Another mCherry-PDZD7 cell, viewed in profile using x-z reslice. Note signal is concentrated near stereocilia bases (arrows). Airyscan processing. (J) PDZD7 immunoreactivity in utricle hair cells of Myo7a+/8J heterozygote mice. Labeling at ankle-link region is clear (arrows). (K) PDZD7 at the ankle region of heterozygote utricle. (L) PDZD7 in utricle hair cells of Myo7a8J/8J null mice. While PDZD7 is still in the cytoplasm, it is no longer also located near ankle links. Labeling in the cytoplasmic channel and kinocilium base remains. (M) PDZD7 at ankle region in homozygous utricles. Little or no PDZD7 is detected at ankle links. (N) PDZD7 in cochlea hair cells of Myo7a+/8J heterozygote mice using SIM. Labeling at ankle-link region is clear (arrows). (O) PDZD7 in cochlea hair cells of Myo7a8J/8J null mice using SIM. There is no PDZD7 immunoreactivity in bundles. Scales: panel A is 20 × 40.4 µm; panel B is 7.5 × 7.5 µm; panel C is 10 × 10 µm; panels in D are 6.4 × 13 µm; panels in F are 17.5 × 17.5 µm; panel G is 20 × 40.4 µm; panel H is 12 × 12 µm; panel I is 5 × 5 µm; panels J and L are 30 × 30 µm; panels K and M are 15 × 15 µm; panels N and O are 10 × 20.2 µm.
Figure 8—figure supplement 1
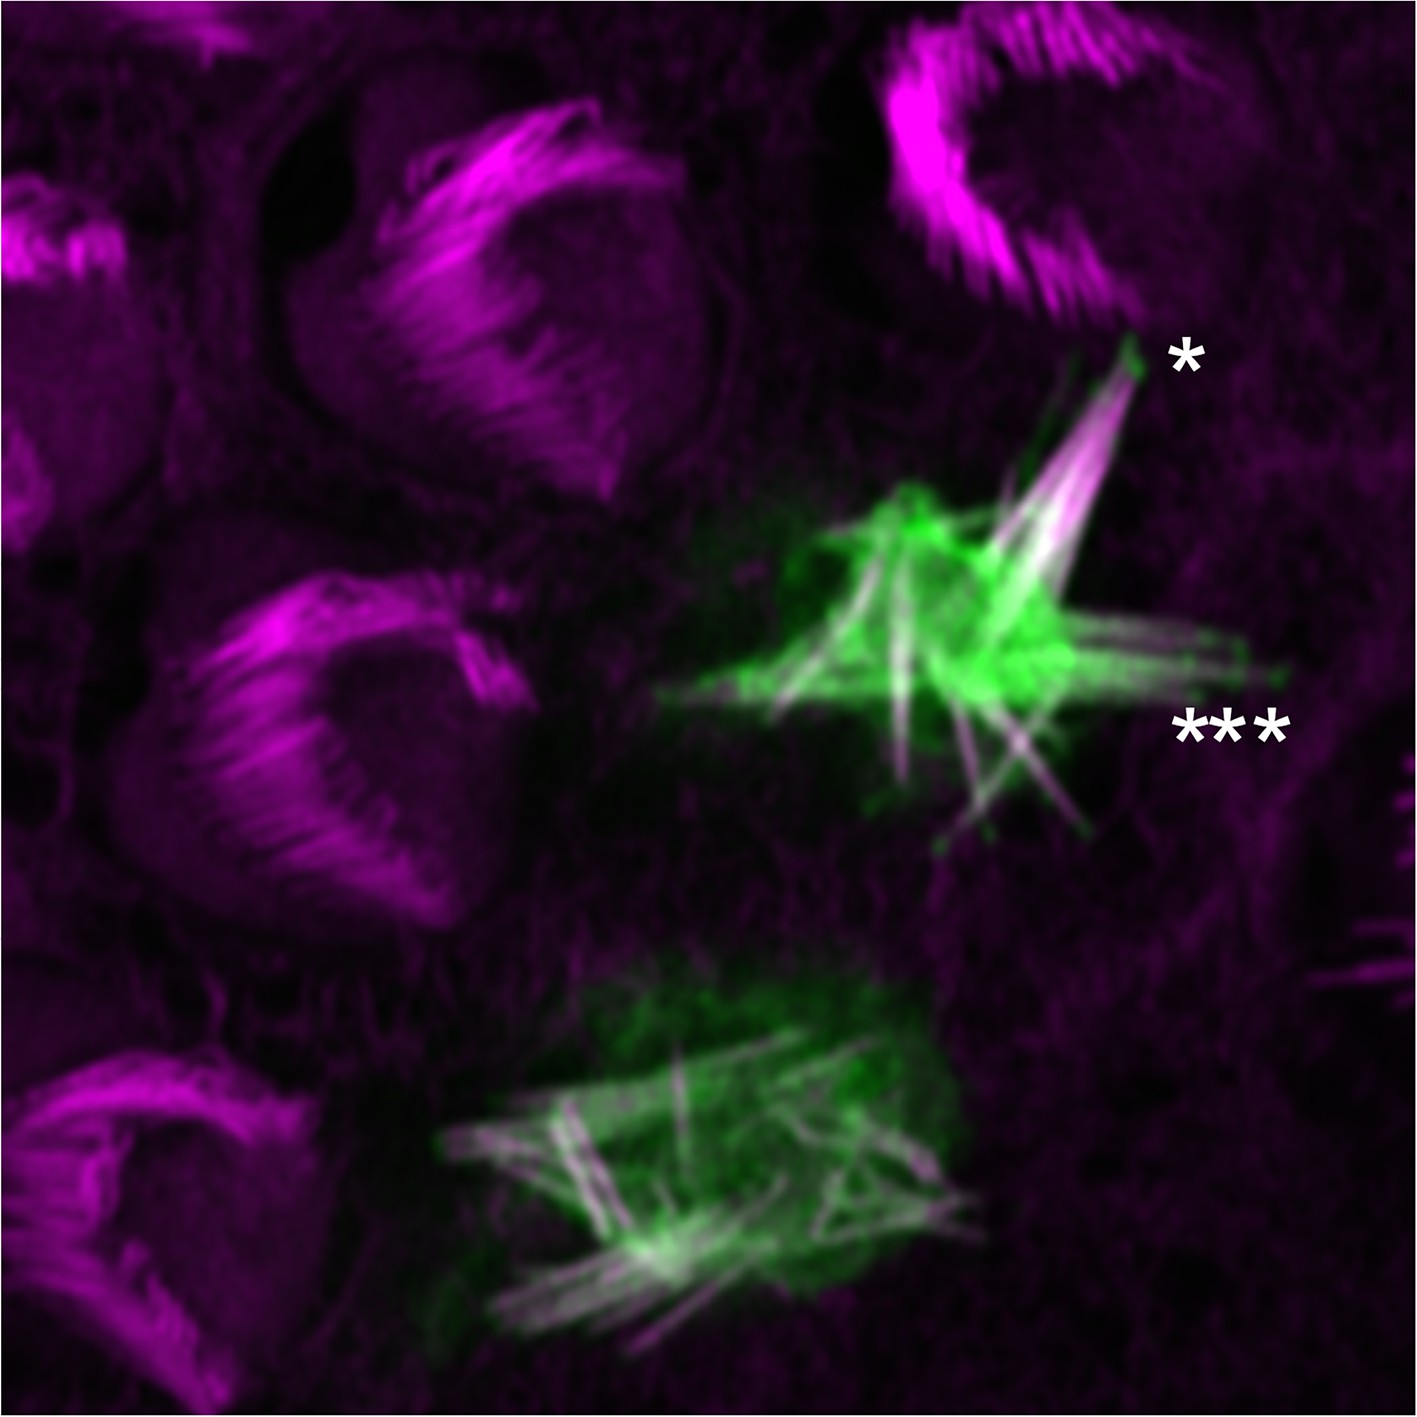
Localization of mCherry-PDZD7 at tips of stereocilia.
This hair cell expressed PDZD7 at a relatively high level, and the hair bundle was severely disrupted. mCherry-PDZD7 was clearly seen at stereocilia tips, however (asterisks). Green, mCherry-PDZD7; magenta, phalloidin stain for actin. Panel is 20 × 20 µm.
Tables
Table 1
Comparison of stereocilia purification methods. The D10 preparation enriches stereocilia membranes, and therefore is not directly comparable to the twist-off method, which isolates the entire hair bundle.
| Parameter | Twist-off | D10 |
|---|---|---|
| Throughput | <40 ears/person/day | >200 ears/person/day |
| Stereocilia purity | >90% | - |
| Recovery | ~1/3 | >1/2 |
| Organs sampled | 1 | 7 |
| Stereocilia protein recovered | 1x | 10x |
| Stereocilia protein per day | 1x | 50x |
| Subsequent purification | Challenging | Easy |
Table 2
D10 purification. Protein assays and PTPRQ targeted proteomics assays were carried out on two preparations, each of ~1000 chick inner ears. Total PTPRQ PRM intensity was determined by multiplying the PTPRQ intensity from PRM targeted-proteomics experiments (per µg protein) by the total amount of protein (in µg) in each sample.
| Fraction | Description | Total protein (µg), ± range | PTPRQ PRM intensity, total | PTPRQ PRM intensity, fraction of PNS |
|---|---|---|---|---|
| S1 | Post nuclear supernatant | 109,000 ± 4,000 | 2.63 ± 0.40 × 10¹⁰ | 100 ± 15% |
| S2 | 7000 rpm supernatant | 100,000 ± 4,000 | 0.35 ± 0.05 | 13 ± 3% |
| P2 | Dense membranes | 36,400 ± 700 | 2.56 ± 0.17 | 97 ± 16% |
| M3 | D10 bound | 2680 ± 90 | 0.34 ± 0.04 | 13 ± 2% |
| S6 | Cytoplasm | 29,200 ± 100 | 0.32 ± 0.07 | 12 ± 2% |
| P6 | Membranes | 984 ± 1 | 0.28 ± 0.01 | 11 ± 2% |
| S7 | RIPA-soluble | 1037 ± 0 | 1.13 ± 0.11 | 43 ± 8% |
Table 3
Identification of MYO7A-binding proteins in twist-off-purified hair bundles. The presented data, as well as technical aspects of the chick and mouse hair-bundle purification and shotgun mass spectrometry protein detection and quantitation, have been described previously (Krey et al., 2015; Shin et al., 2013; Wilmarth et al., 2015). BUN only, only found in hair bundle samples. UTR only, only found in whole utricle samples. ND, not detected.
| Protein | Chick molecules per stereocilium | Chick enrichment | Mouse (P23) molecules per stereocilium | Mouse (P23) enrichment |
|---|---|---|---|---|
| MYO7A | 796 | 1.6x | 229 | 28x |
| MYO6 | 9300 | 2.2x | 1305 | 2.6x |
| GIPC3 | 494 | 3.5x | 55 | 12x |
| MYO1C | 126 | 17x | ND | UTR only |
| MYO1H | 91 | 29x | 128 | 406x |
| ANKRD24 | 56 | 122x | 1 | BUN only |
| PDZD7 | 50 | 10x | ND | ND |
| SORBS1 | 16 | 2.0x | ND | UTR only |
| LMO7 | 10 | 3.4x | ND | ND |
Additional files
-
Reporting standards 1
Minimum Information About a Proteomics Experiment guidlines and parameters (GIL160, GIL167).
- https://doi.org/10.7554/eLife.18312.022
-
Reporting standards 2
Minimum Information About a Proteomics Experiment guidlines and parameters (GIL1467, GIL1649, GIL1651).
- https://doi.org/10.7554/eLife.18312.023
-
Reporting standards 3
Minimum Information About a Proteomics Experiment guidlines and parameters (GILL-85, GILL-98, GILL-102).
- https://doi.org/10.7554/eLife.18312.024
Download links
A two-part list of links to download the article, or parts of the article, in various formats.
Downloads (link to download the article as PDF)
Open citations (links to open the citations from this article in various online reference manager services)
Cite this article (links to download the citations from this article in formats compatible with various reference manager tools)
PDZD7-MYO7A complex identified in enriched stereocilia membranes
eLife 5:e18312.
https://doi.org/10.7554/eLife.18312


