Targeting mutant RAS in patient-derived colorectal cancer organoids by combinatorial drug screening
- Center for Molecular Medicine, University Medical Center Utrecht, Netherlands
- Cancer Genomics Netherlands, Netherlands
- University Medical Center Utrecht, The Netherlands
- Netherlands Cancer Institute, The Netherlands
Figures
Figure 1 with 1 supplement

Drug responses of patient-derived CRC organoids with and without mutant KRAS.
(A) Dose-response curves of patient-derived CRC organoids P8T (KRASWT; APC and TP53 mutant) and P26T (KRASG12V; APC and TP53 mutant) treated with the dual EGFR/HER2 inhibitor afatinib, MEK inhibitor selumetinib or a combination thereof. Cell viability was measured by an ATP-based assay after 72 hr of drug treatment. (B) Stills from representative time-lapse imaging (three days) of CRC organoids P8T and P26T treated with vehicle (DMSO) or a combination of targeted inhibitors afatinib and selumetinib (both 1 µM) (see also Video 1). In every panel, upper images show color-coded depth of maximum-projected z-stacks of H2B-mNeonGreen fluorescent organoids. Lower panels: corresponding transmitted light images. Time interval: 15 min. Scale bars: 20 µm. Representative time-lapse of two experiments is shown (total six organoids/condition).
-
Figure 1—source data 1
ImageJ/Fiji macro script: ‘Organoid movie macro’.
Converts XYZT confocal data sets into analyzable 2D-movies, consisting four quadrants: depth coding, maximum projection in ‘glow’, transmitted light image and a merge between transmitted light and fluorescence. All supplementary movies were generated using this method (Figures 1 and 3 show 2 of 4 quadrants only).
- https://doi.org/10.7554/eLife.18489.004
Figure 1—figure supplement 1
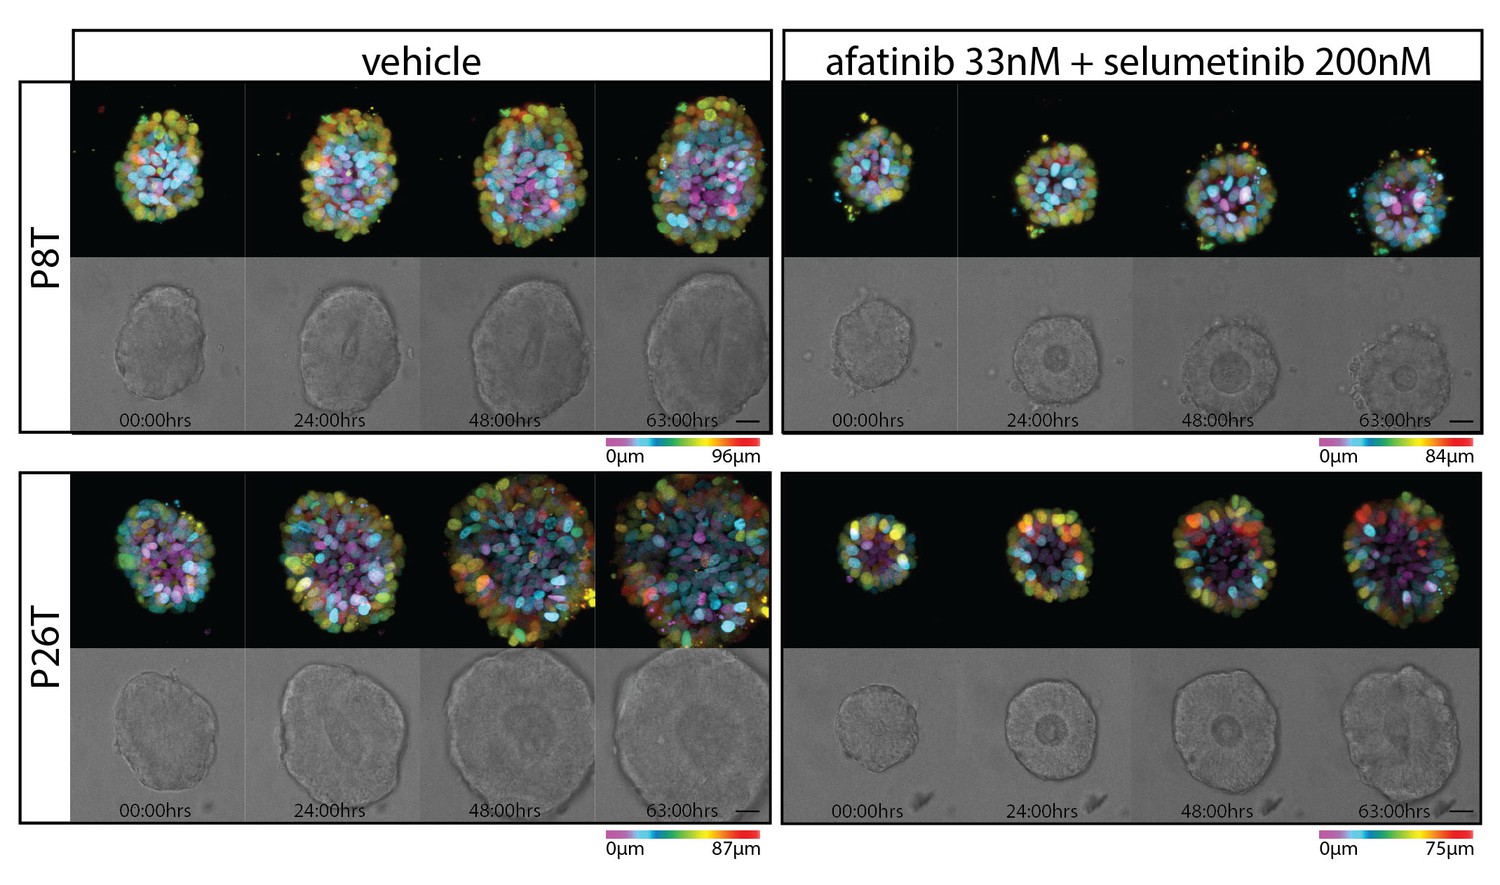
Stills from representative time-lapse imaging (three days) of CRC organoids P8T and P26T treated with vehicle (DMSO) or a combination of targeted inhibitors afatinib (33 nM) and selumetinib (200 nM) (see also Video 2).
In every panel, upper images show color-coded depth of maximum-projected z-stacks of H2B-mNeonGreen fluorescent organoids. Lower images: corresponding transmitted light images. Time interval: 15 min. Scale bars, 20 µm. Representative time-lapse of five organoids per condition.
Figure 2 with 1 supplement

In vivo drug response of xenotransplanted CRC organoids.
(A) P26T CRC organoids were subcutaneously transplanted in immunodeficient mice. Once tumors have grown to a volume of 300 mm3, animals were treated for 28 days with vehicle, afatinib (12,5 mg/kg; five days on, two days off), selumetinib (20 mg/kg; five days on, two days off) or both drugs in combination. The mean percentage change in tumor volume relative to initial tumor volume is shown. Error bars represent standard deviation. n.s., not significant. (B) Same experimental setup as in A, but with increased drug concentrations for afatinib (20 mg/kg; five days on, two days off) and selumetinib (25 mg/kg; five days on, two days off); as well as in combined treatment. Error bars represent standard deviation. *p<0,05; **p<0,01; ***p<0001.
Figure 2—figure supplement 1
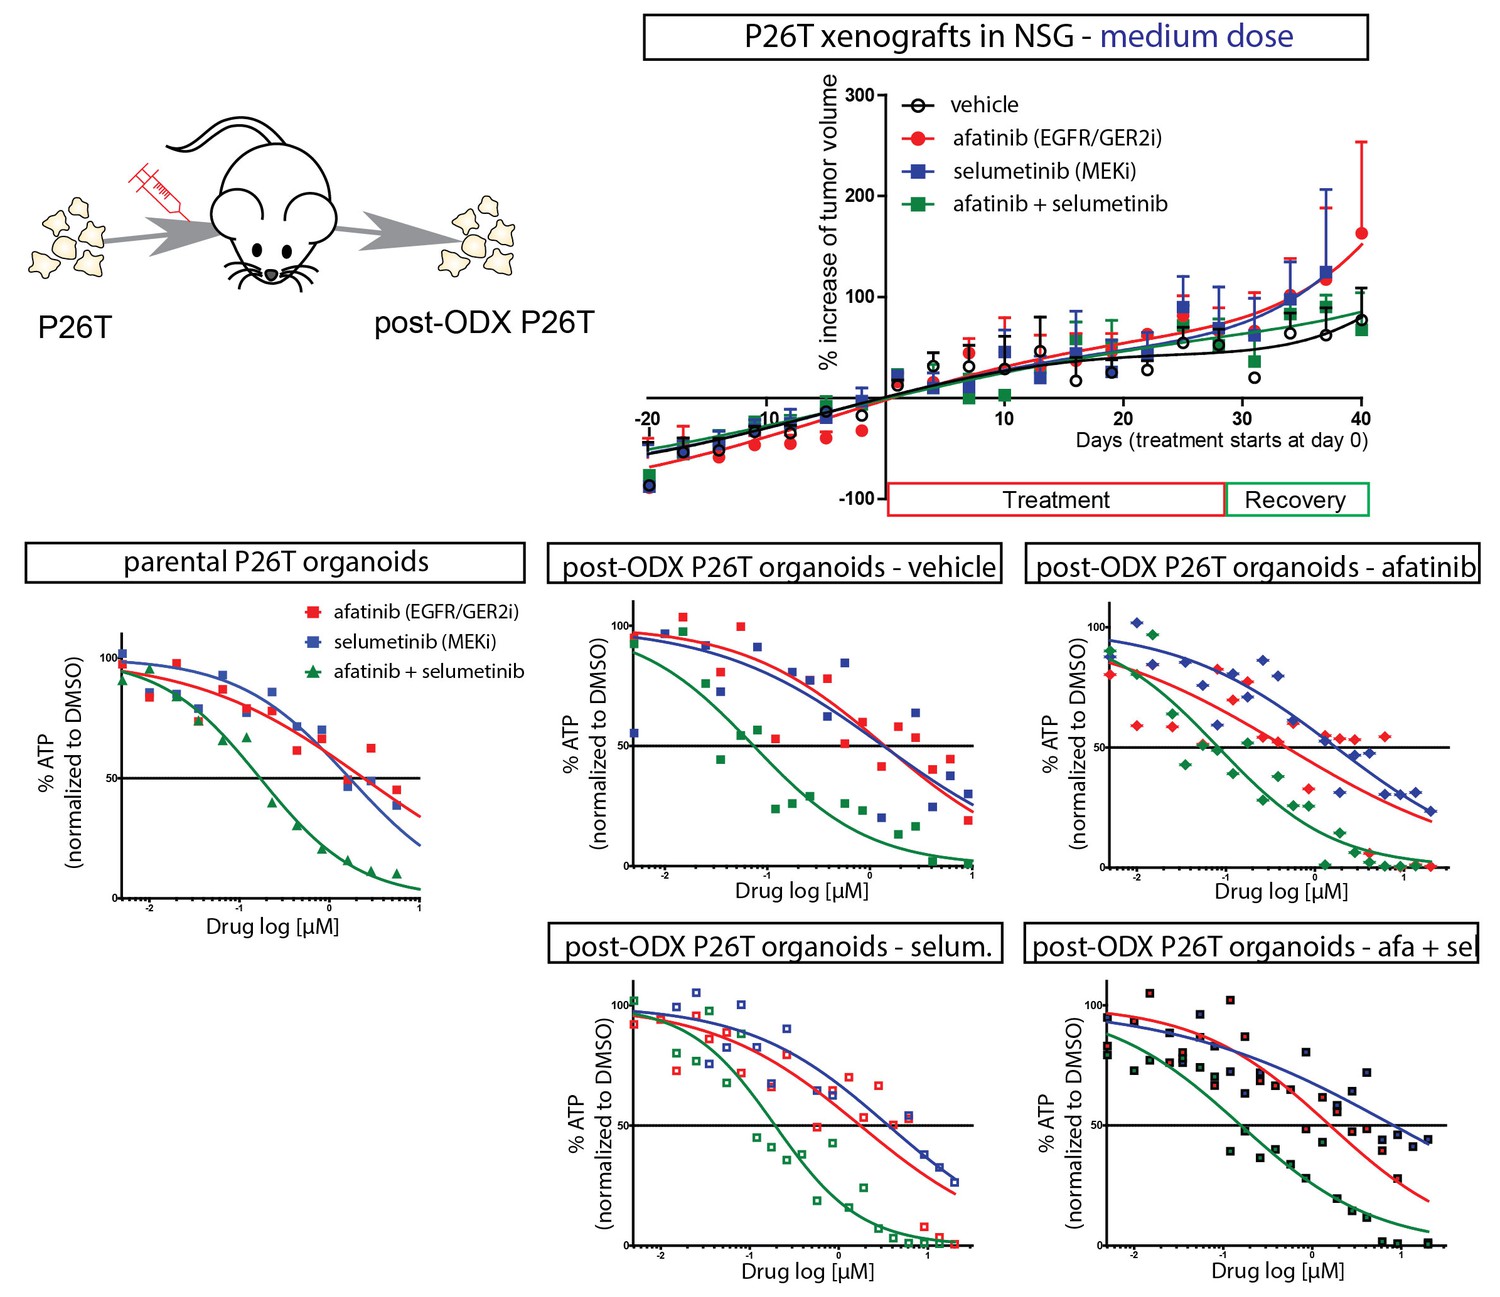
Secondary organoid cultures were derived from xenografted P26T tumors (organoid-derived xenograft, ODX) of mice that have been treated with vehicle, afatinib (12,5 mg/kg; five days on, two days off), selumetinib (20 mg/kg; five days on, two days off) or both.
Dose response curves were determined from these secondary post-xenograft cultures, as well as from the parental P26T organoid culture. Regardless of the in vivo applied drug treatment, the drug sensitivity phenotype of the organoids remained unaltered.
Figure 3 with 4 supplements

CRISPR genome editing in CRC organoids reveals effect of KRASG12D on drug response .
(A) Schematic representation of the CRISPR/Cas9-induced homologous recombination strategy to introduce the KRASG12D mutation in the KRASWT patient-derived CRC organoid P18T. Green bar: start codon. Red bar: G12D mutation. Parental and mutant sequences are shown on the right. (B) Extensive dual-inhibitor dose-response assay of patient-derived CRC organoids P18T and P18T-KRASG12D treated for 72 hr. 14×14 drug concentrations of afatinib and selumetinib were chosen with logarithmic intervals covering a 5 nM–5 μM range. The results of the full matrix screen are represented as a heat map (left), where red represents 0% ATP levels (no viability) and green represents 100% ATP levels (max viability). The dose-response curves to the right represent the horizontal (afatinib monotherapy), vertical (selumetinib monotherapy) and diagonal (afatinib/selumetinib combination therapy) lines in the heat maps. Dashed lines are P18T; solid lines are P18T-KRASG12D. (C) Stills from representative time-lapse imaging (three days) of CRC organoids P18T and P18T-KRASG12D treated with vehicle (DMSO) or afatinib + selumetinib (both 1 µM) (see also Video 1). In every panel, upper images show color-coded depth of maximum-projected z-stacks of H2B-mNeonGreen fluorescent organoids. Lower panels: corresponding transmitted light images. Time interval: 15 min. Scale bars: 20 µm. Representative time-lapse of 2 (total eight organoids/condition) and four experiments (total 20 organoids/condition) for P18T and P18T-KRASG12D resp. (D) Mitotic and apoptotic events in the organoid drug response movies (C and Video 1) were manually marked and quantified (see Materials and methods and Figure 3—figure supplement 3). In comparison with vehicle (-), drug treatment of p18T with afatinib and selumetinib (a+s) results in both proliferation block and apoptosis induction, while p18T-KRASG12D only shows reduced proliferation but unchanged apoptosis rates. Error bars represent standard deviation. *p<0,05; ***p<0,001; n.s. = not significant (p=0,4)
Figure 3—figure supplement 1
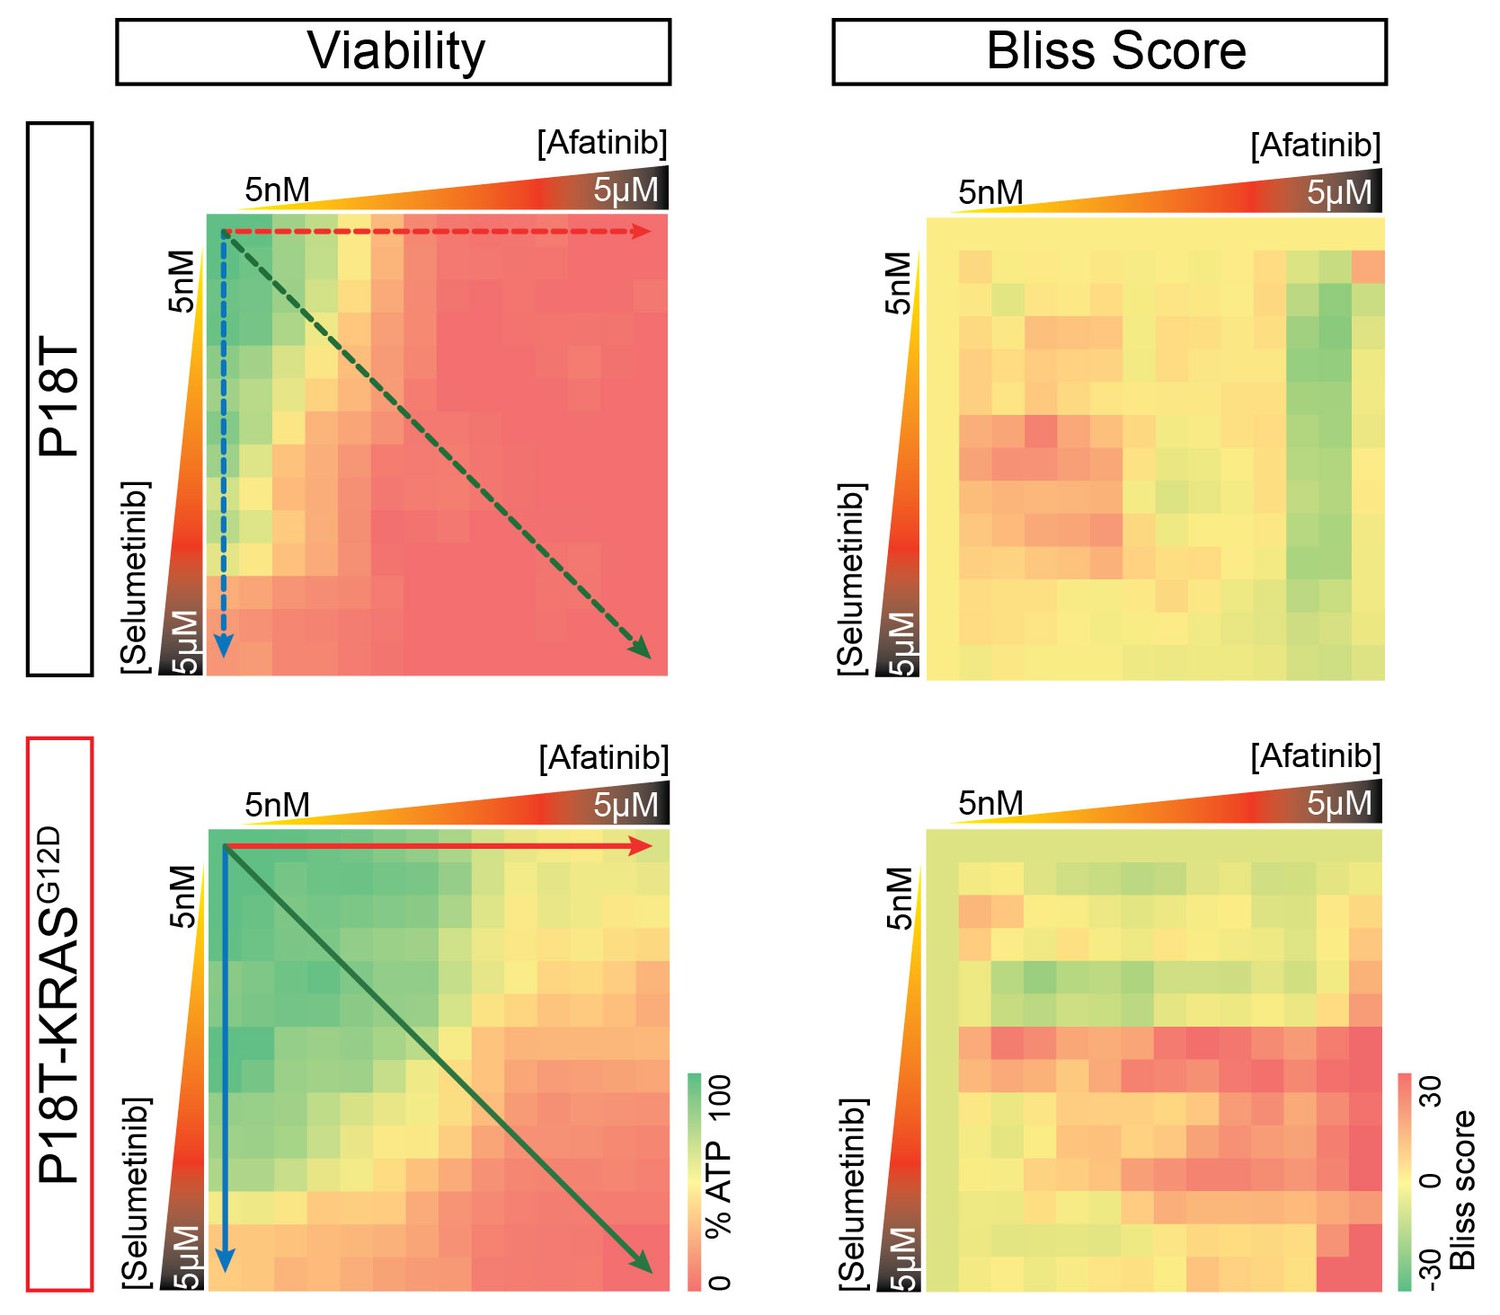
Original heat map of viability and heat map of calculated scores for p18T and p18T-KRASG12D.
Positive Bliss scores (red hues) indicate combinations where the effect is greater than expected based on additive effects.
Figure 3—figure supplement 2
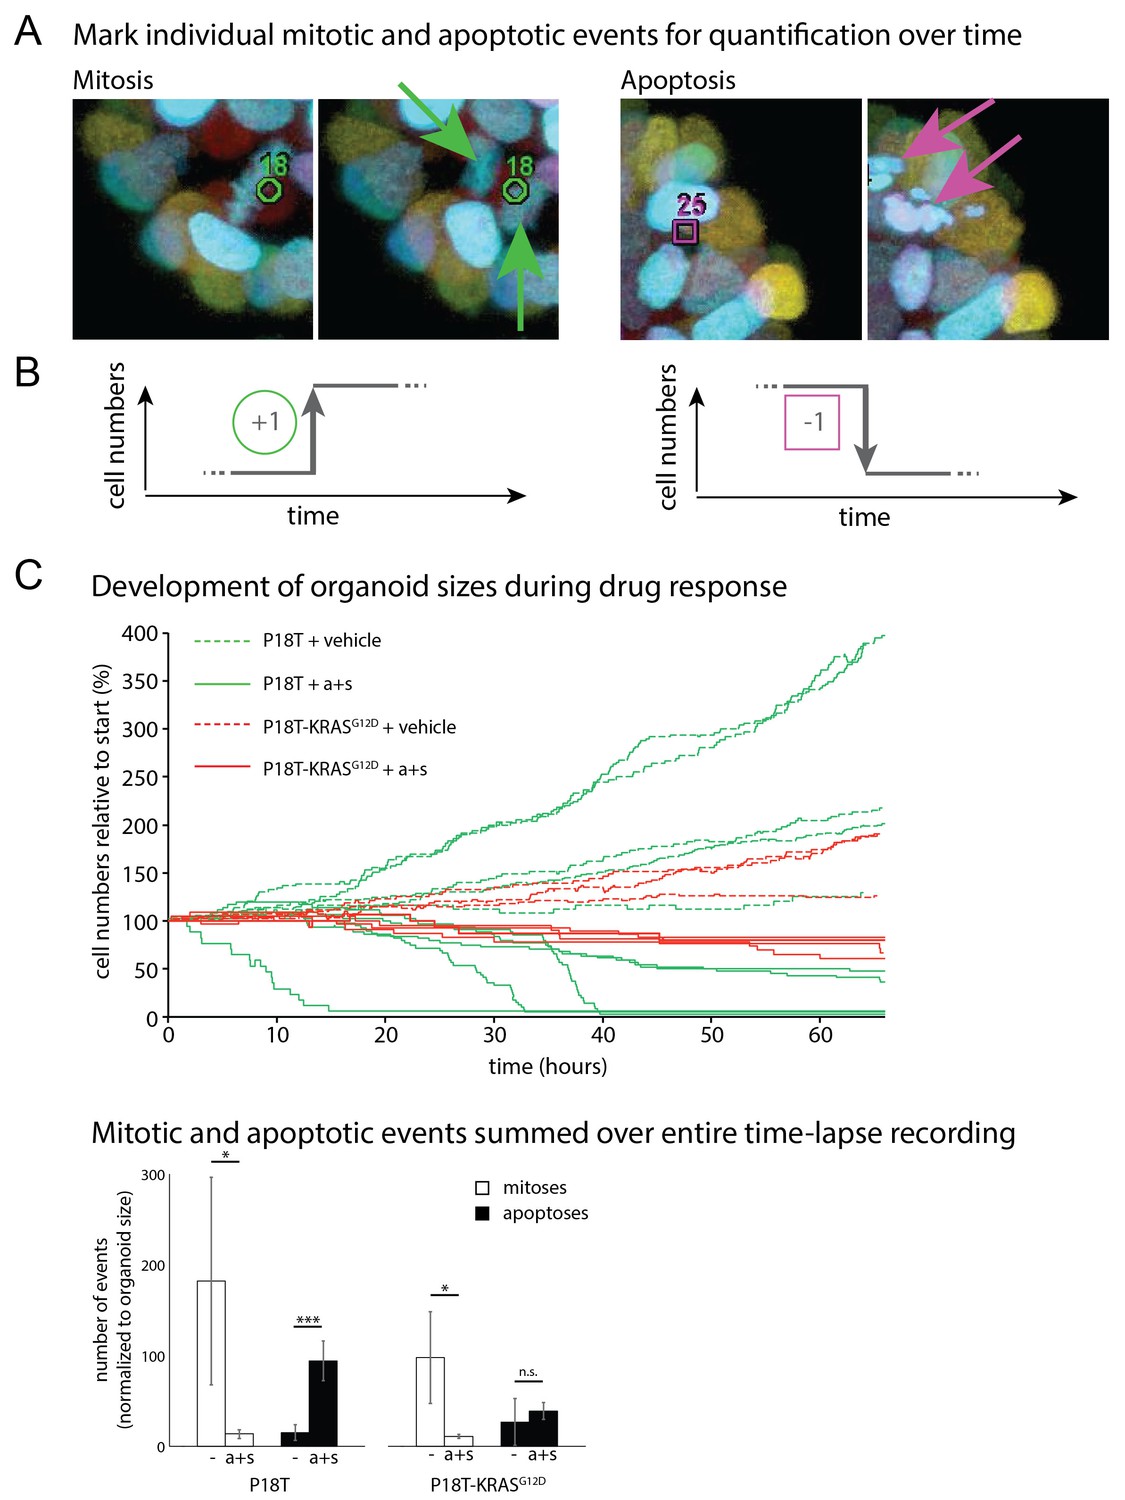
Quantifying life and death during real-time imaging of drug response.
(A) Time-lapse XYZT acquisitions were visualized using color-coded depth projections and mitotic and apoptotic analysis were manually marked. (B) Increases (mitoses) and decreases (apoptosis) in cell numbers were chronologically ranked, thus reconstructing organoid size evolution in time. (C) Separate contributions of mitoses and apoptosis to development of P18T and P18T-KRASG12D while incubated with vehicle (−) or afatinib + selumetinib (a+s). Whereas in P18T drug treatment (a+s) results in both proliferation block and apoptosis induction, P18T-KRASG12D only show reduced proliferation but unchanged apoptosis rates. *p<0,05; ***p<0,001; n.s. = not significant (p=0,4)
Figure 3—figure supplement 3
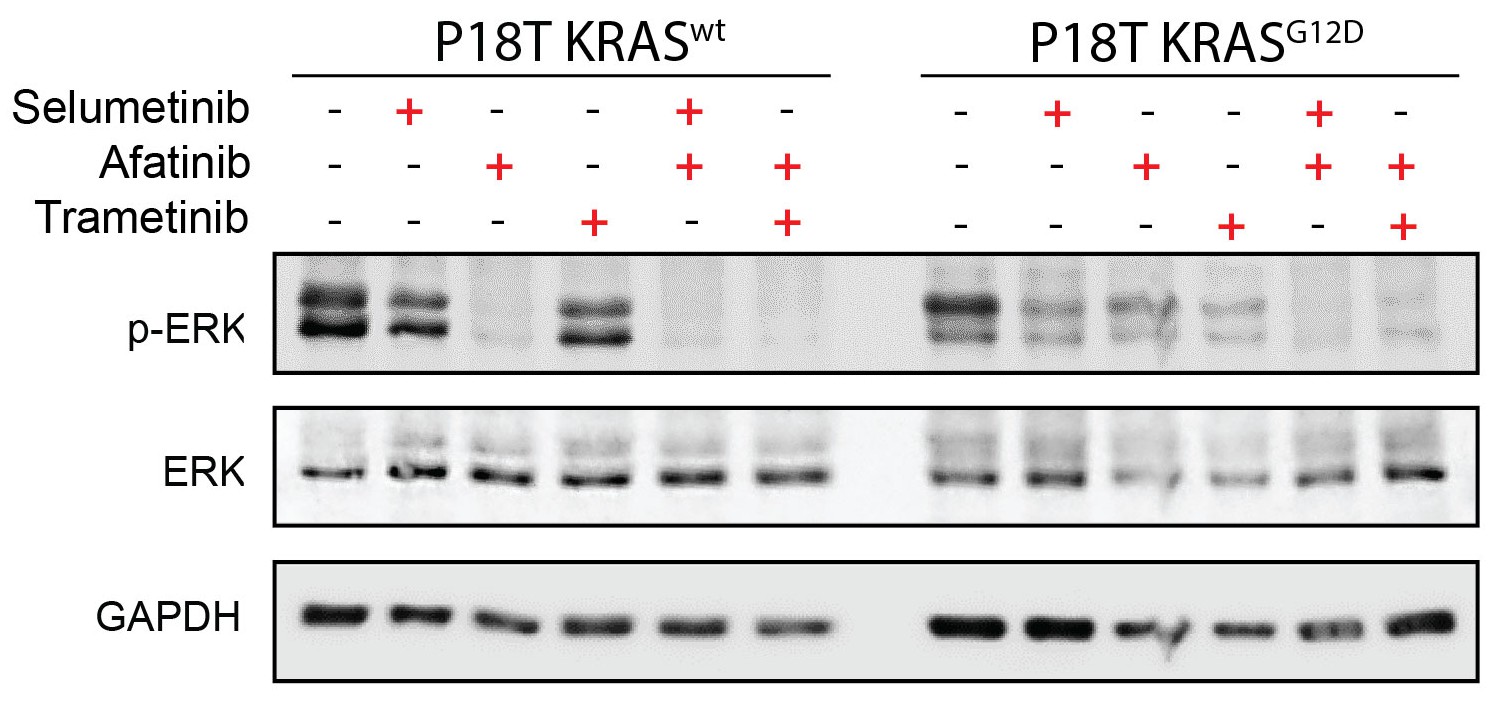
Drug response of CRC organoids as examined by Western blot.
Combined Pan-HER/ MEK inhibition results in reduction of ERK phosphorylation in KRASWT and KRASG12D CRC organoids. Organoids were treated for 24 hr with MEK inhibitors selumetinib (1 μM), trametinib (10 nM), and the pan-HER inhibitor afatinib (1 μM) as indicated. WB is representative of four independent experiments.
Figure 3—figure supplement 4
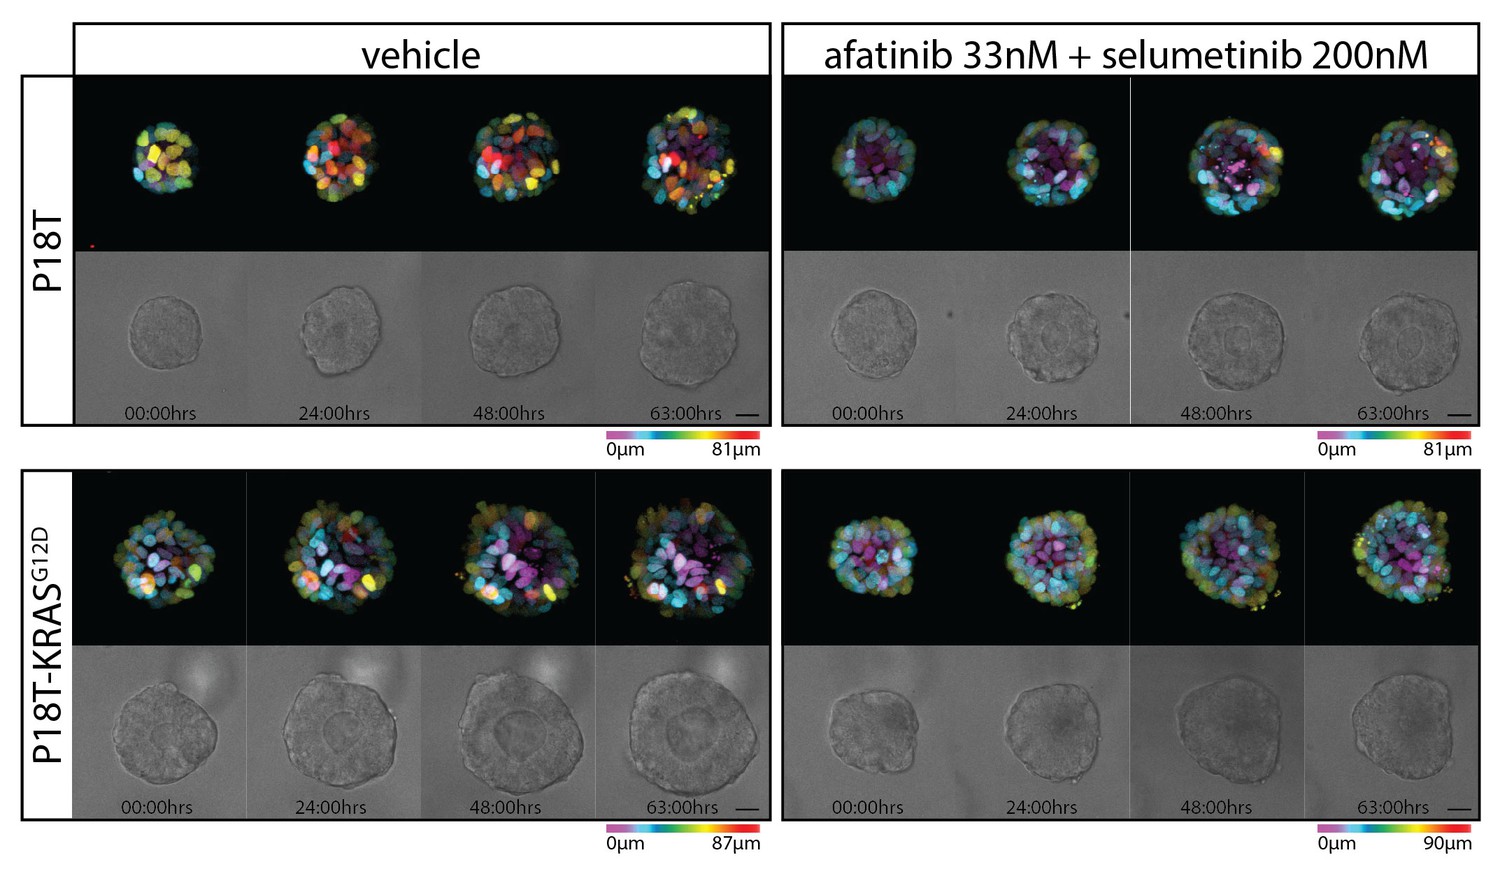
Stills from representative time-lapse imaging (three days) of CRC organoids P18T and P18T-KRASG12D treated with vehicle (DMSO) or a combination of targeted inhibitors afatinib (33 nM) and selumetinib (200 nM) (see also Video 2).
In every panel, upper images show color-coded depth of maximum-projected z-stacks of H2B-mNeonGreen fluorescent organoids. Lower images: corresponding transmitted light images. Time interval: 15 min. Scale bars, 20 µm. Representative time-lapse of five organoids per condition.
Figure 4 with 2 supplements
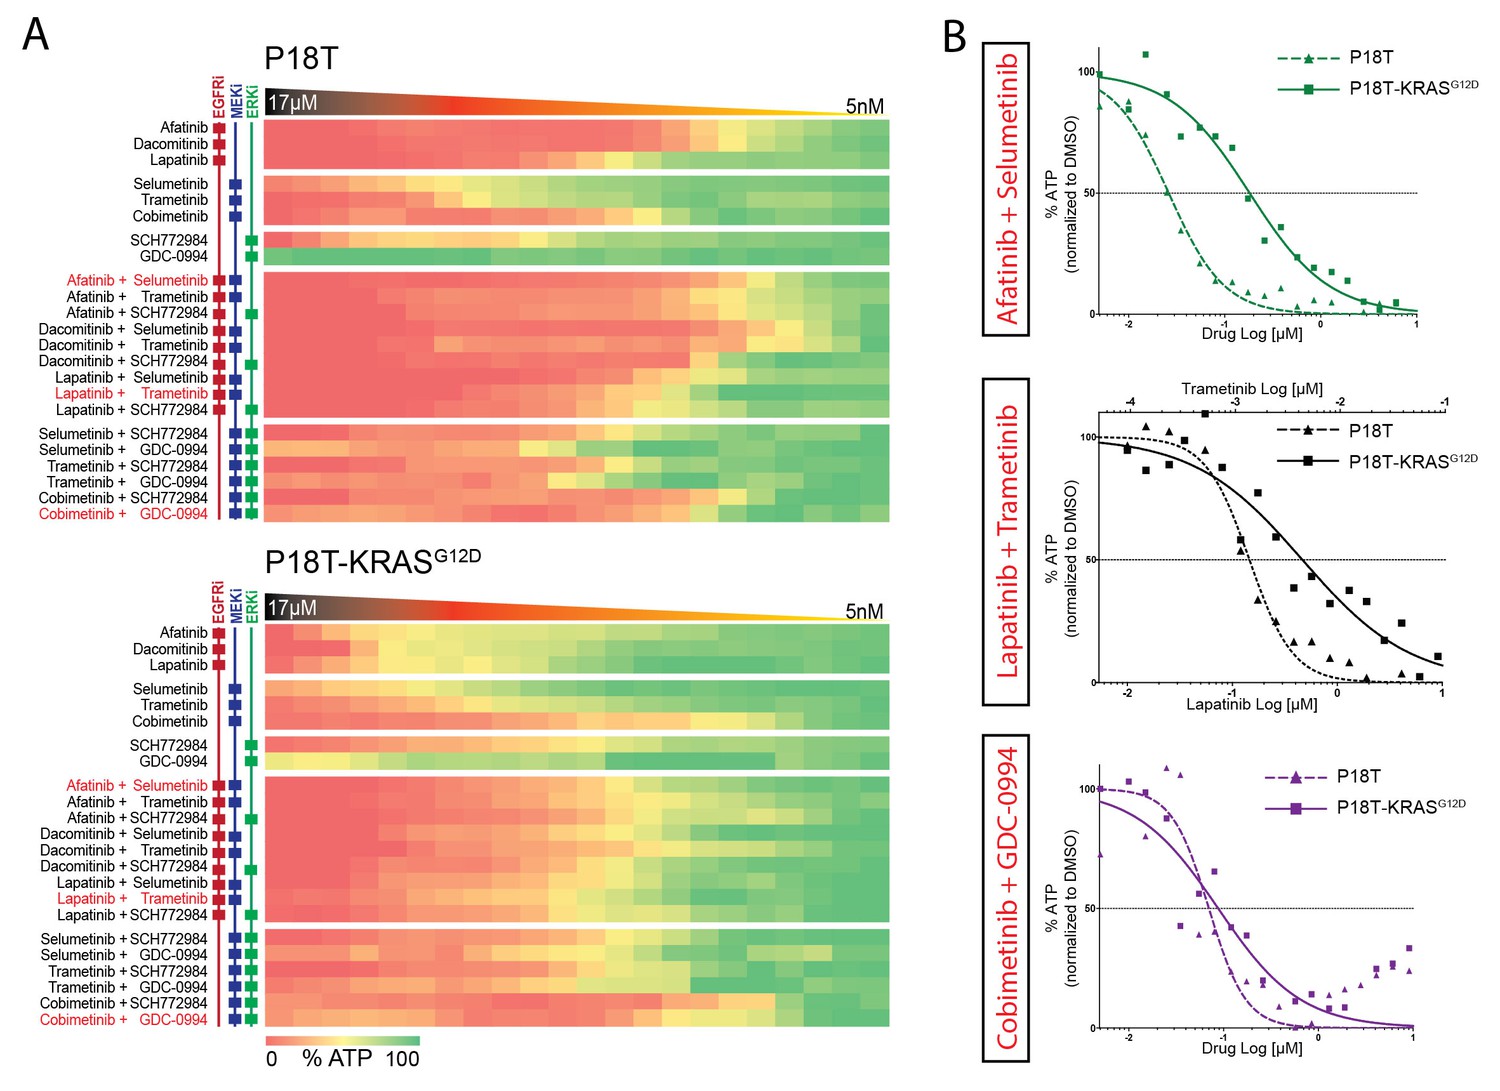
Differential drug sensitivities upon combination therapies including EGFR inhibition.
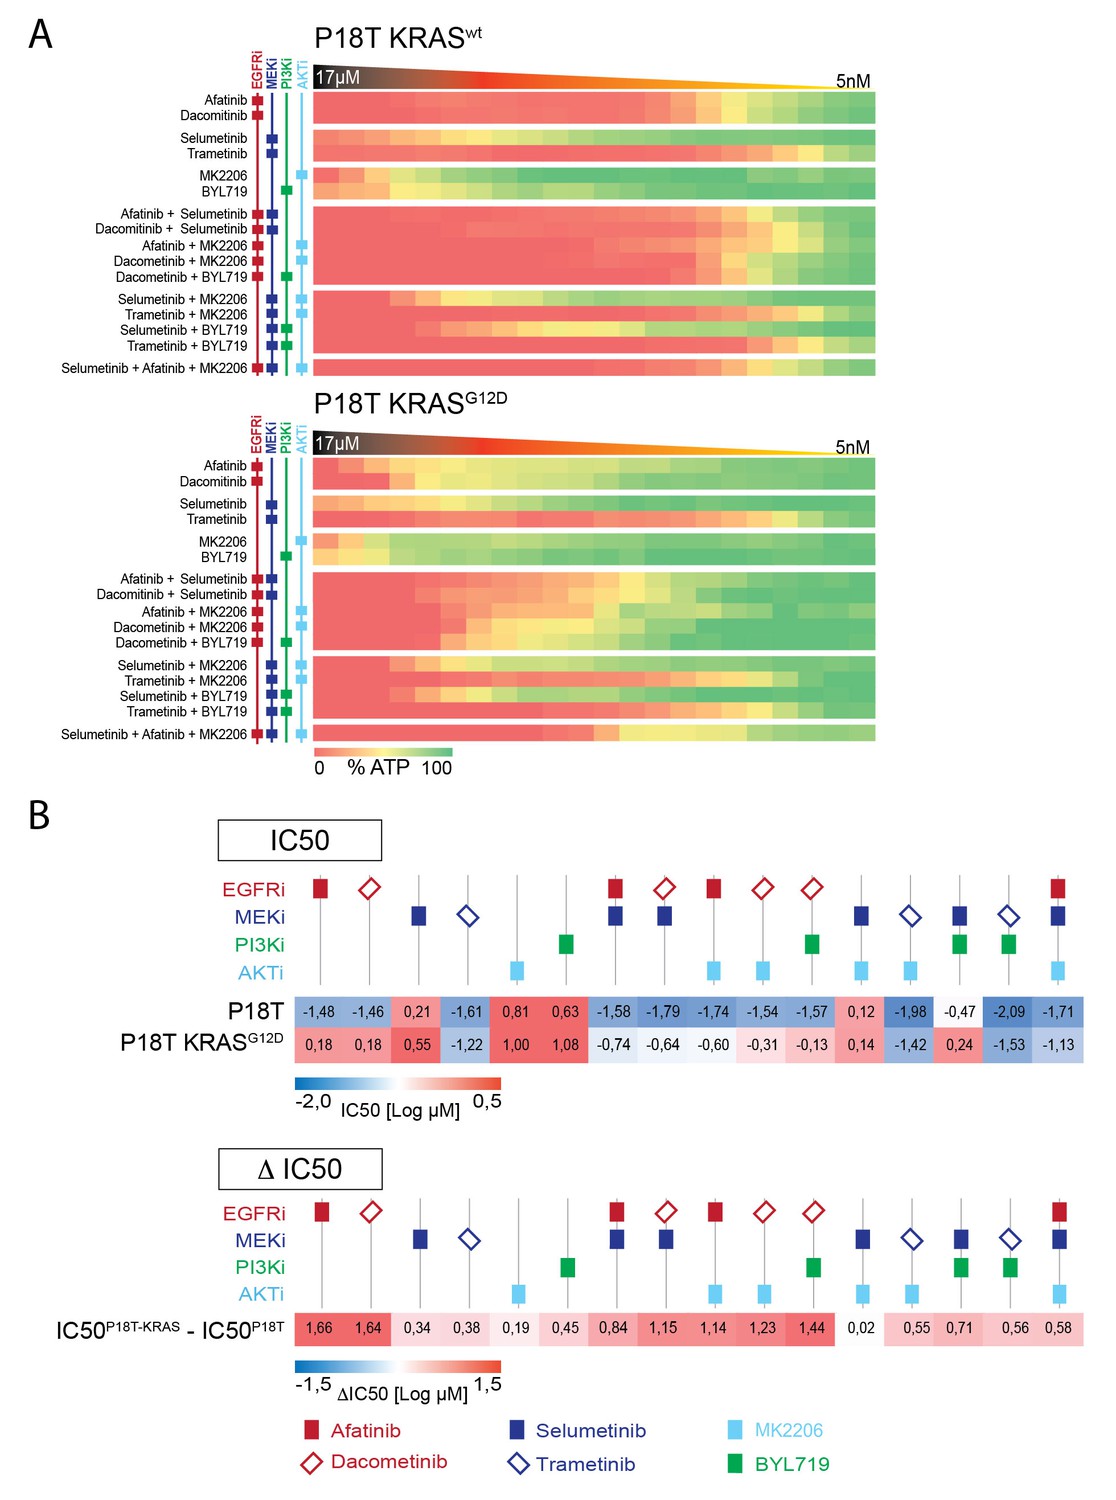
(A) Heat map of dose-response measurements (cell viability) in CRC organoids P18T (top panel) and P18T-KRASG12D (bottom panel). Organoids were treated (72 hr) with vehicle (DMSO) or inhibitors targeting the EGFR-RAS-ERK pathway (5 nM – 20 μM range, in 22 logarithmic intervals). Red represents 0% ATP levels (max cell death) and green represents 100% ATP levels (max viability). Drug names and their nominal targets are indicated in the left panel. Combination therapies that are currently in clinical trial for patients with RAS mutant CRCs are indicated in red font. See Figure 4—source data 1 and Supplementary file 1 for all dose-response curves. (B) Dose-response curves of CRC organoids P18T (dashed lines) and P18T-KRASG12D (solid lines) treated with combination therapies that are currently in clinical trial for patients with RAS mutant CRCs.
-
Figure 4—source data 1
Dose-response curves for patient-derived tumor organoids P18T and P18T KRASG12D as indicated.
A number of biological replicates for each dose-response curve are indicated between parenthesis (first monotherapy/ second monotherapy/ combination therapy).
- https://doi.org/10.7554/eLife.18489.016
-
Figure 4—source data 2
Dose-response curves for patient-derived tumor organoids P18T and P18T KRASG12D as indicated.
A number of biological replicates for each dose-response curve are indicated between parenthesis (first monotherapy/ second monotherapy/ combination therapy).
- https://doi.org/10.7554/eLife.18489.017
Figure 4—figure supplement 1
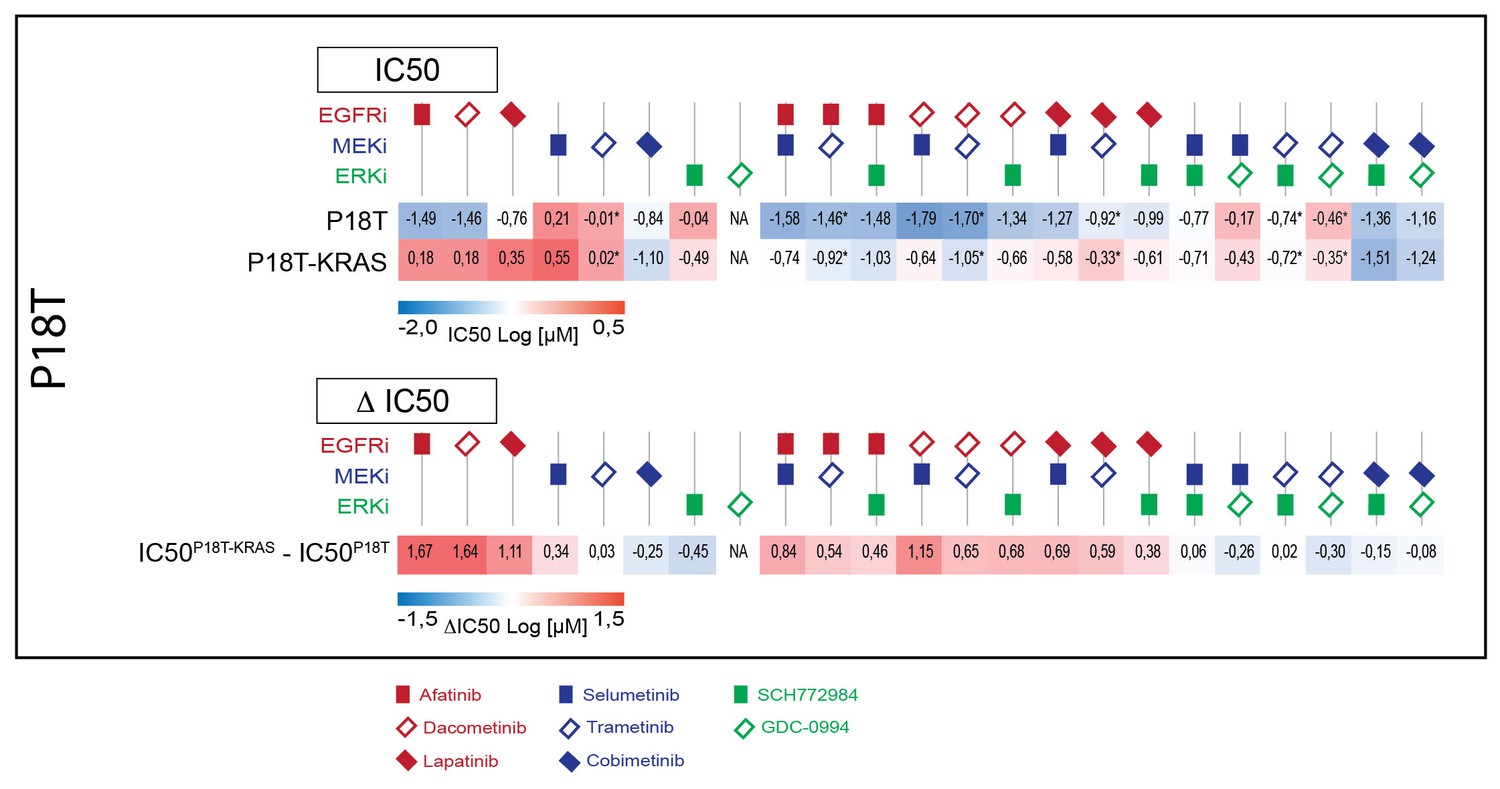
Upper panel: Heat map of all IC50 values (Log10-scale) for P18T and P18T-KRASG12D, determined from dataset shown in Figure 4A (and Figure 4—source data 1 and Supplementary file 1).
IC50 values are color-coded: blue for highest and red for lowest efficacies (see scale bar below). IC50 values account for both drugs when added in combination, except combinations that include trametinib (IC50 values marked with *; here trametinib concentrations are two log decades lower as indicated). Lower panel: Differential IC50’s comparing CRC organoids P18T-KRASG12D and P18T (ΔIC50 = IC50(P18T-KRAS) – IC50(P18T). ΔIC50 values are color-coded, where higher efficacies in P18T are coded red and higher efficacies in P18T-KRASG12D are coded blue (see scale bar). This data representation clearly illustrates that P18T organoids are much more sensitive to targeted therapies that include EGFR inhibition than KRAS mutant P18T.
Figure 4—figure supplement 2
Drug combinations on P18T and P18T-KRASG12D organoids targeting EGFR-RAS-ERK and PI3K-AKT pathways.
(A) Heat map of dose-response measurements (cell viability) in CRC organoids P18T (top panel) and P18T-KRAS (bottom panel). Organoids were treated (72 hr) with vehicle (DMSO) or targeted inhibitors over a 5 nM – 20 μM range (in 22 logarithmic intervals). Red represents 0% ATP levels (max cell death) and green represents 100% ATP levels (max viability). Drug names and their nominal targets are indicated in the left panel. (B) Heat map of all IC50 values (Log10-scale) for P18T and P18T-KRAS, determined from dataset shown in A (and Figure 4—source data 2 and Supplementary file 1). IC50 values are color-coded: blue for highest and red for lowest efficacies (see scale bar below). IC50 values account for both drugs when added in combination. Differential IC50’s comparing CRC organoids P18T-KRAS and P18T (ΔIC50 = IC50(P18T-KRAS) – IC50(P18T). ΔIC50 values are color-coded, where higher efficacies in P18T are coded red and higher efficacies in P18T-KRAS are coded blue (see scale bar).
Figure 5 with 2 supplements
Comparable drug response profiles in normal and tumorigenic background.
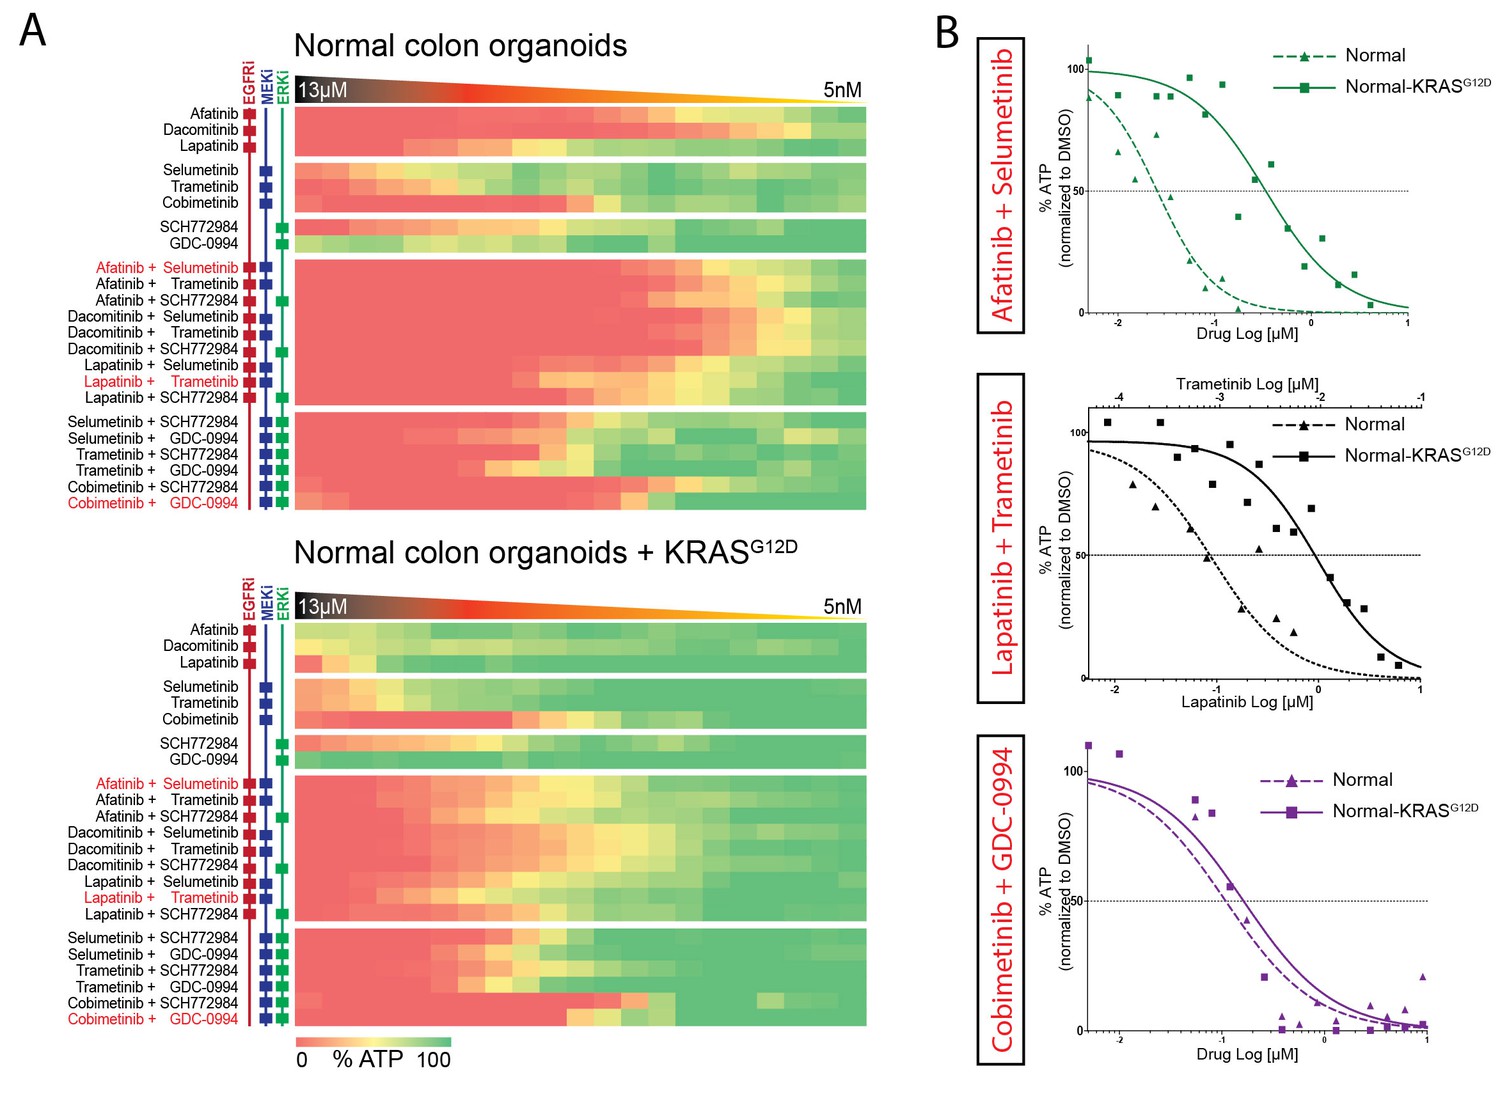
(A) Heat map of dose-response measurements of cell viability in normal colon organoids (top panel) and in normal colon organoids with an oncogenic KRAS mutation (bottom panel) after 72 hr drug treatment with inhibitors targeting the EGFR-RAS-ERK pathway. Same concentration range and color-coding as in Figure 4. Combination therapies that are currently in clinical trial for patients with RAS mutant CRCs are indicated in red. See Figure 5—source data 1 and Supplementary file 1 for all dose-response curves. (B) Dose-response curves of normal organoids (dashed lines) and normal organoids + KRAS (solid lines) treated with combination therapies that are currently in clinical trial for patients with RAS mutant CRCs.
-
Figure 5—source data 1
Dose-response curves for normal and normal KRASG12D organoids as indicated.
Number of biological replicates for each dose-response curve are indicated between parenthesis (first monotherapy/ second monotherapy/ combination therapy).
- https://doi.org/10.7554/eLife.18489.021
Figure 5—figure supplement 1
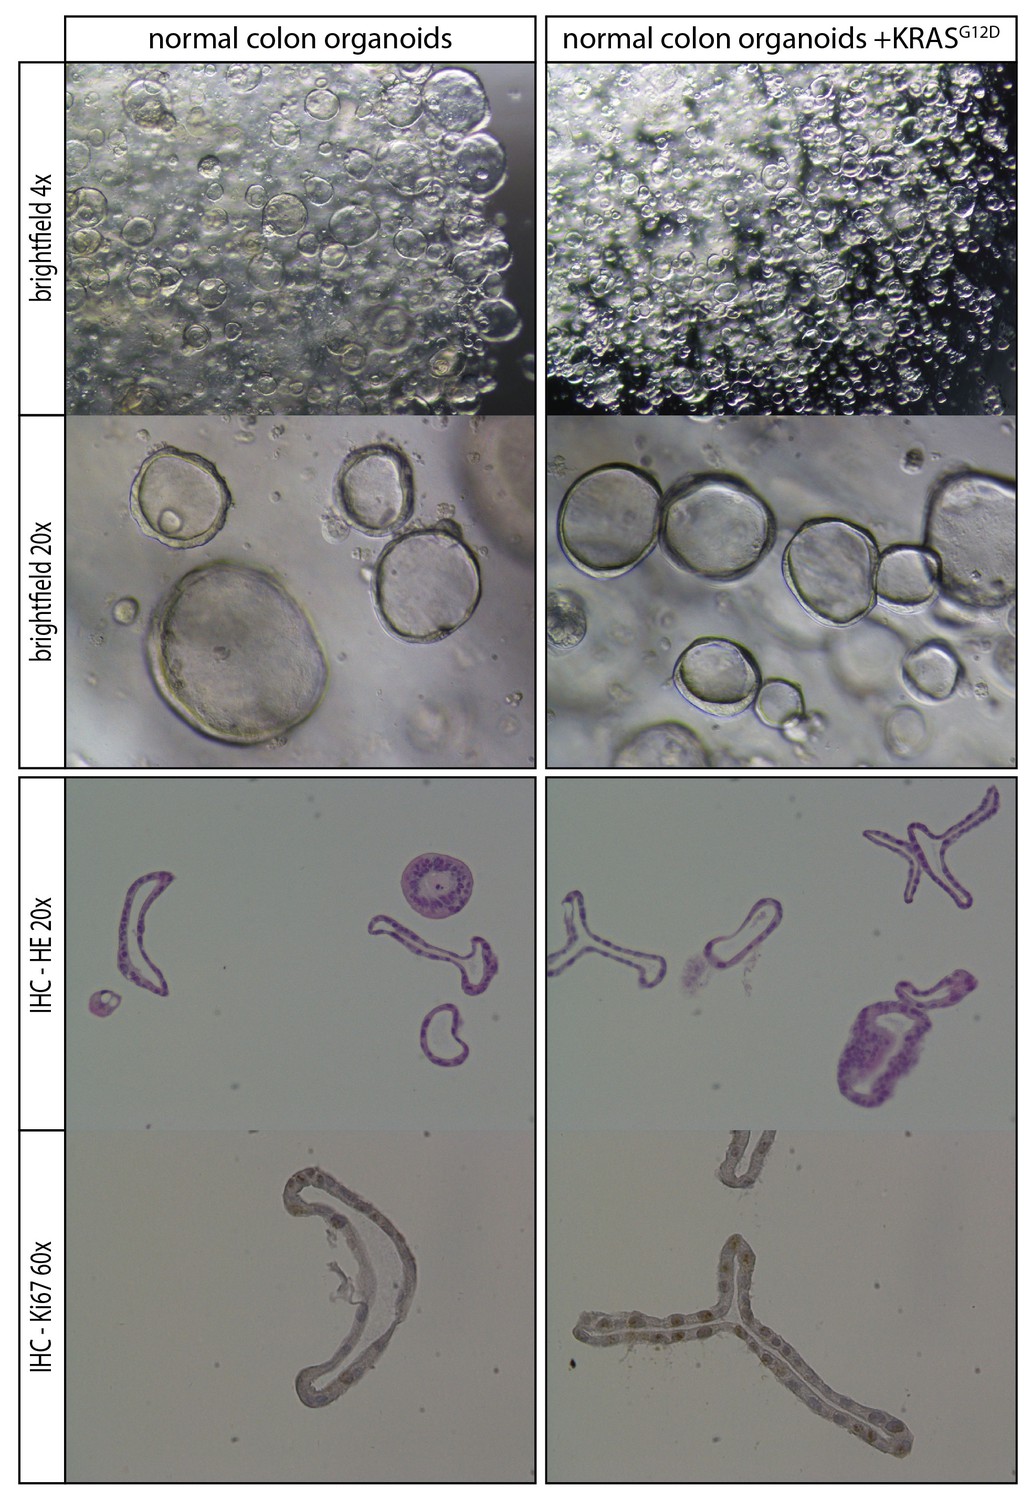
Comparison of normal organoids and normal organoids with an introduced oncogenic G12D mutation within the endogenous KRAS locus.
No overall phenotypic differences are observed based on morphology and proliferative activity.
Figure 5—figure supplement 2
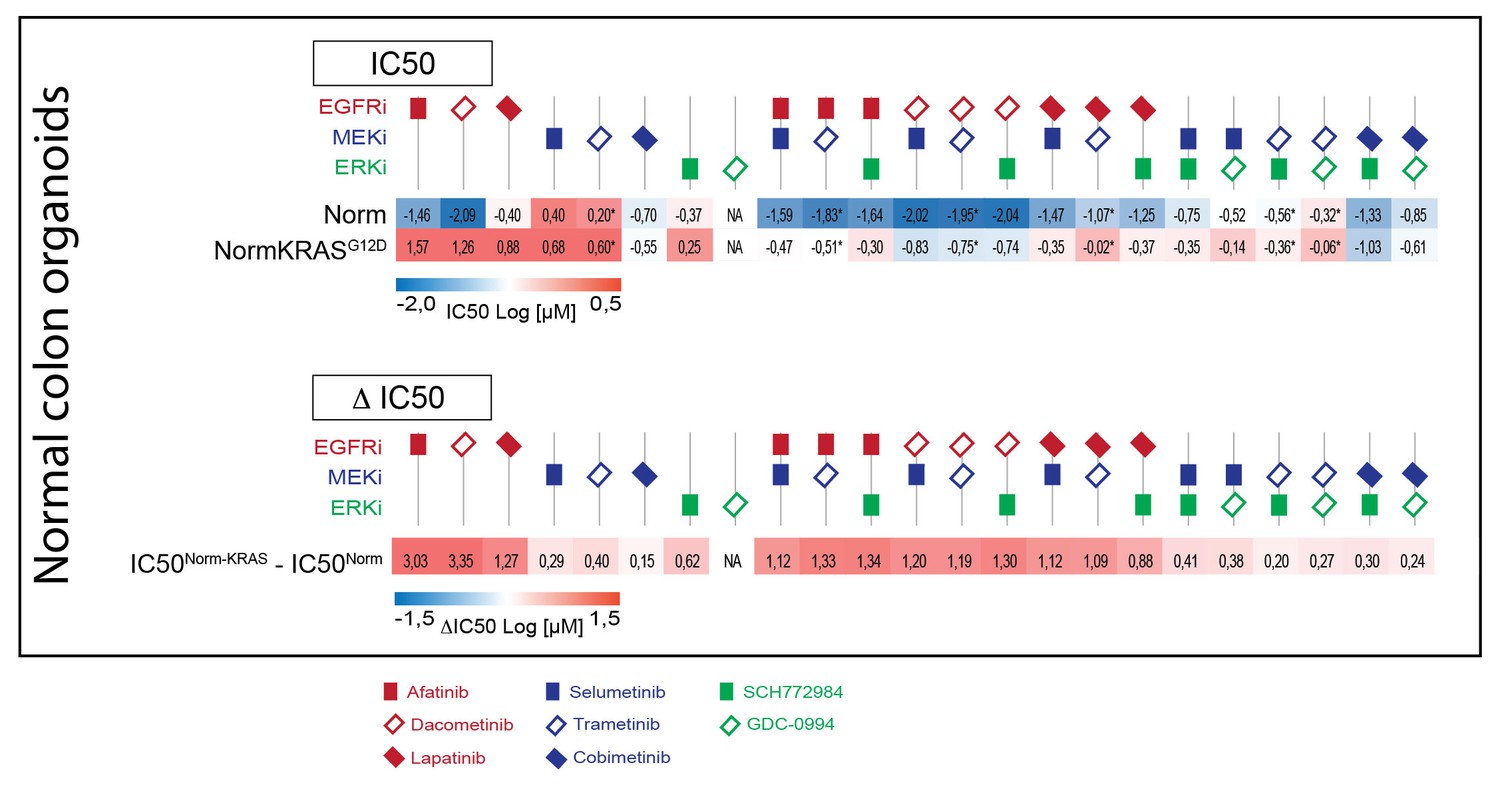
Upper panel: Heat map of all IC50 values (Log10-scale) for normal colon organoids with and without mutant KRAS, determined from dataset shown in Figure 5A (and Figure 5—source data 1 and Supplementary file 1).
IC50 values are color-coded: blue for highest and red for lowest efficacies (see scale bar below). IC50 values account for both drugs when added in combination, except combinations that include trametinib (IC50 values marked with *; here trametinib concentrations are two log decades lower as indicated). Lower panel: Differential IC50’s comparing normal colon organoids with and without mutant KRAS. ΔIC50 values are color-coded, where relative higher efficacies in normal colon organoids are coded red, while relative higher efficacies in normal colon organoids +KRASG12D are coded blue (see scale bar). The similarities between the ΔIC50 matrices in CRC and in normal organoids illustrate that the effect that KRAS imposes on drug response is independent of cellular background.
Figure 6 with 1 supplement
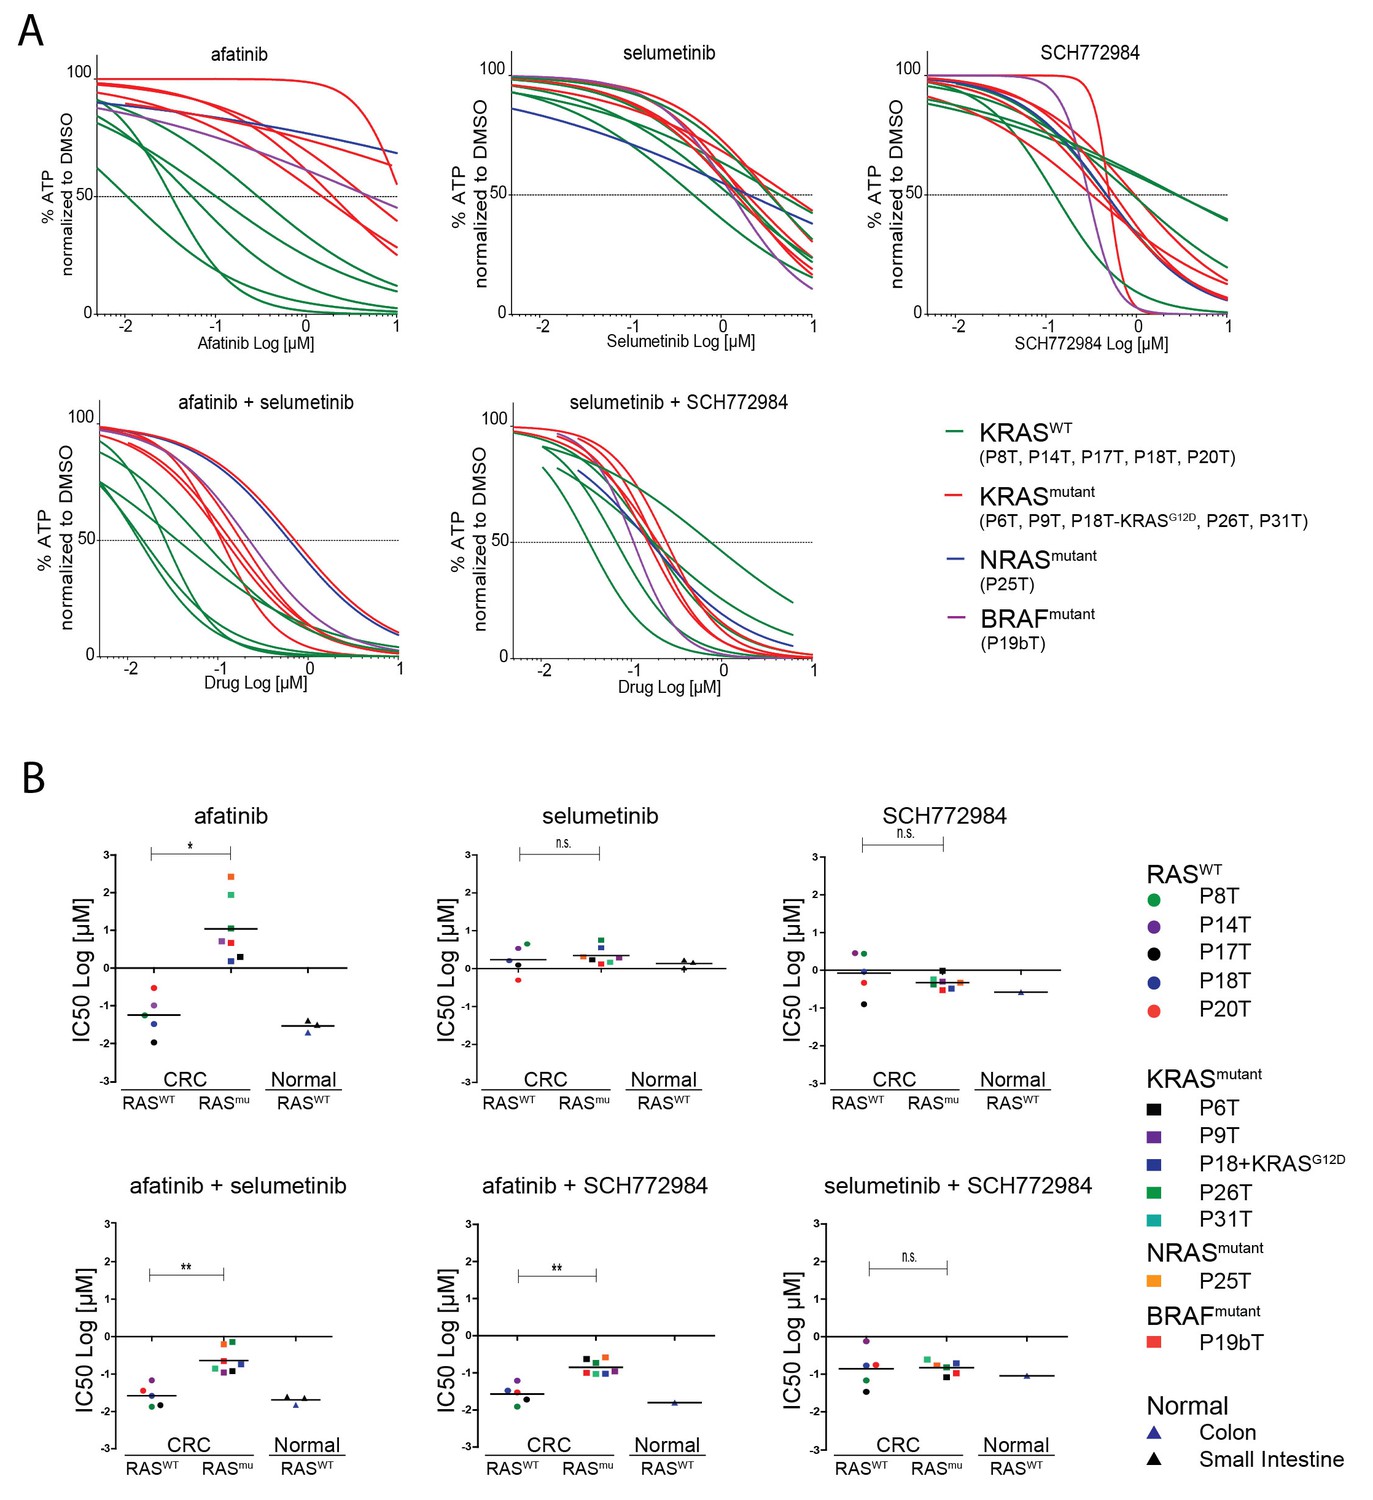
Screening multiple human CRC organoids confirm RAS mutational status for outcome EGFR inhibition.
(A) Dose-response curves of 11 different patient-derived CRC organoids and one engineered CRC organoid (P18T-KRASG12D) treated for 72 hr with single targeted inhibitors or combinations thereof, namely afatinib (dual EGFR/HER2 inhibitor), selumetinib (MEK inhibitor) and SCH772984 (ERK inhibitor). 5 CRC organoids contain WT KRAS (green lines), 5 CRC organoids contained annotated oncogenic KRAS mutations (red lines), P19bT contains an oncogenic version of BRAF and P25T contains an oncogenic mutation in NRAS (purple and blue lines, resp.). See Figure 6—source data 1 and Supplementary file 1 for all dose-response curves. (B) CRC and normal organoids classified based on the mutational status of the RAS-RAF-MEK-ERK signaling pathway. Responses to afatinib, selumetinib, SCH772984 and combinations thereof, are shown in scatter plots of IC50 values (μM; 10log scale). Each colored dot represents an individual organoid line. Note that the experiment included normal organoids from the colon as well as the small intestine (three individual persons). Color corresponds as indicated in the legend. Black bar is the geometric mean. n.s., not significant. *p<0,05. **p<0,01.
-
Figure 6—source data 1
Dose-response curves for panel of patient-derived tumor organoids as indicated.
A number of biological replicates for each dose-response curve are indicated between parenthesis (first monotherapy/ second monotherapy/ combination therapy).
- https://doi.org/10.7554/eLife.18489.025
Figure 6—figure supplement 1
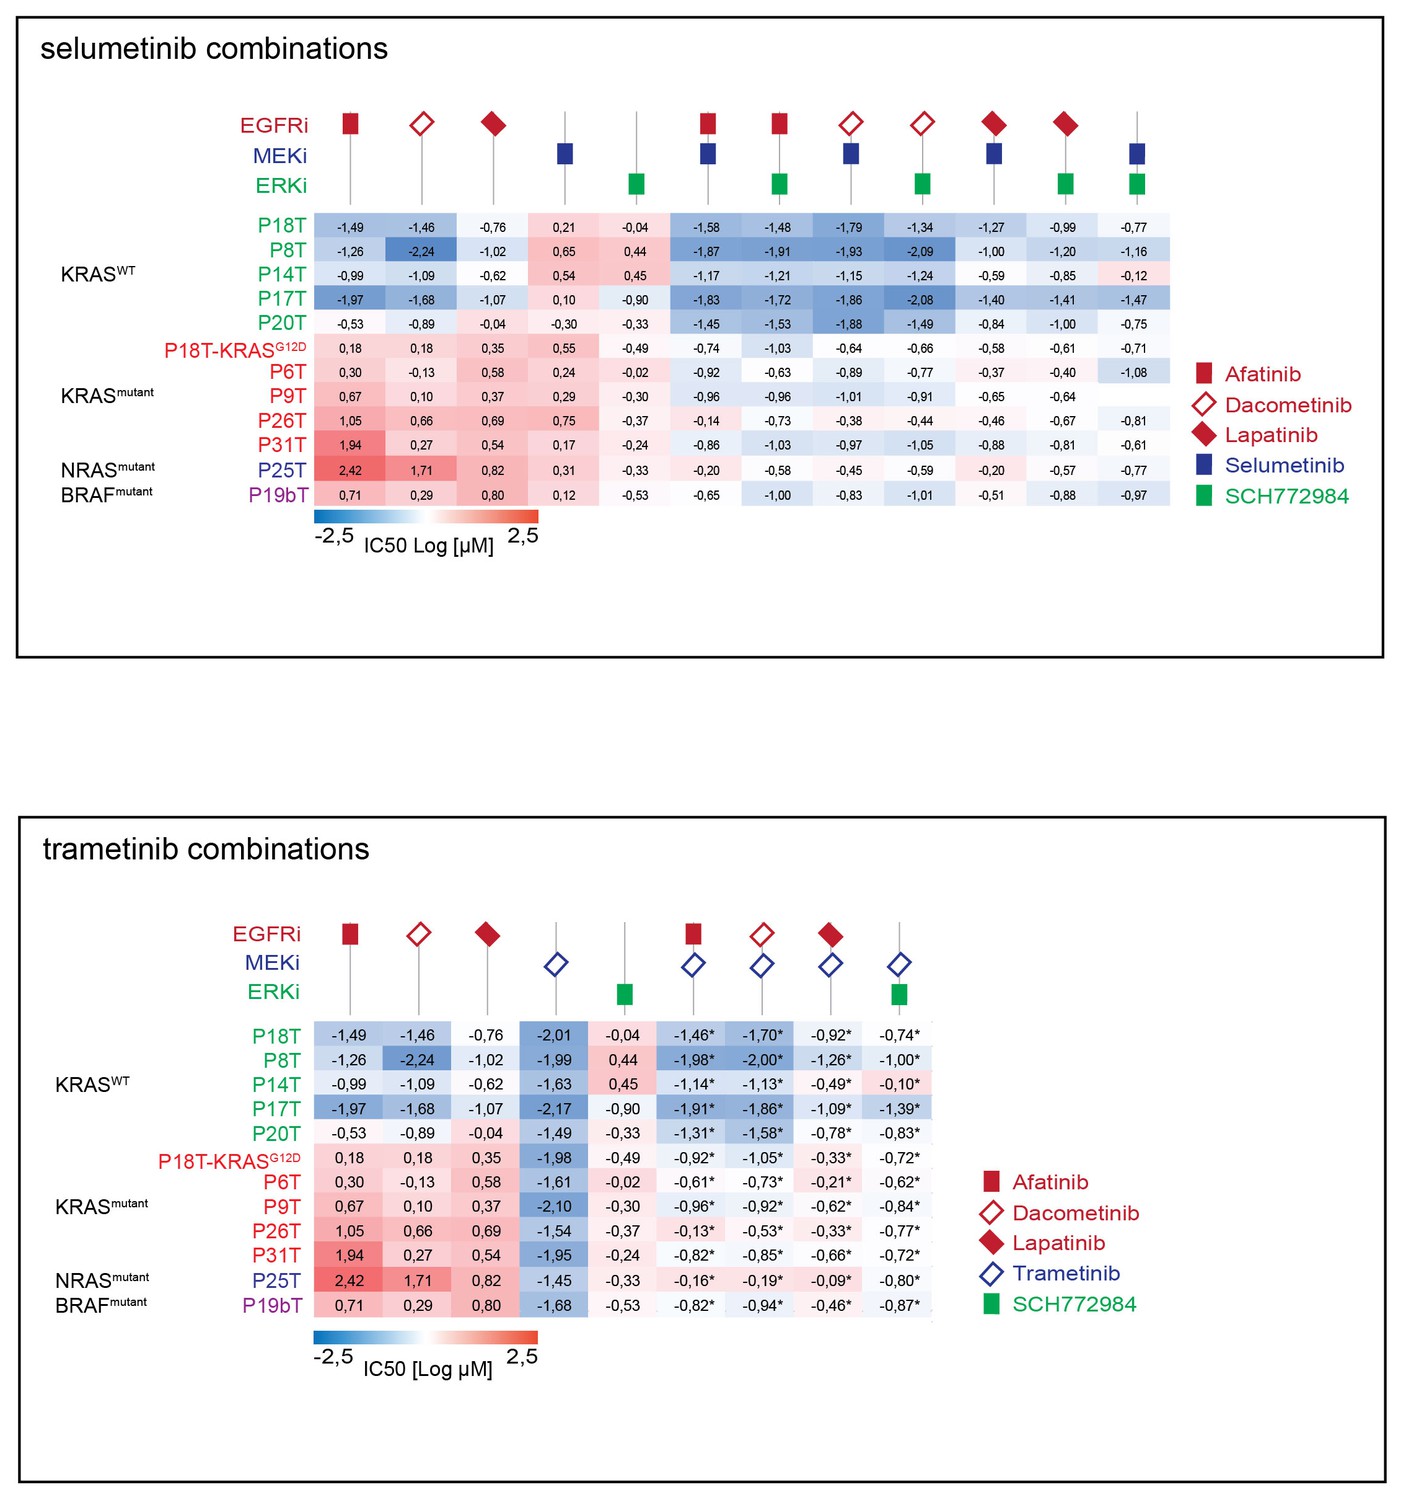
Top panel: Heat map of all IC50 values (Log10-scale) for multiple drug responses in CRC organoids with and without mutant RAS signaling, determined from datasets shown in Figure 6—source data 1 and Supplementary file 1.
IC50 values are color-coded: blue for highest and red for lowest efficacies (see scale bar below). IC50 values account for both drugs when added in combination. Bottom panel: Heat map of all IC50 values (Log10-scale) for multiple drug responses in CRC organoids with and without mutant RAS signaling, determined from datasets shown in Figure 6—source data 1 and Supplementary file 1. IC50 values are color-coded: blue for highest and red for lowest efficacies (see scale bar below). IC50 values account for both drugs when added in combination, except combinations that include trametinib (IC50 values marked with *; here trametinib concentrations are two fold (log) lower as indicated).
Figure 7 with 1 supplement

Therapy surviving cancer cells reignite proliferation after release of targeted inhibition.
(A) Scheme of image-processing workflow. Multiple z-stacks were acquired in a tile-scan mode. H2B-mNeonGreen and bright field images were recorded of >10 organoids (left panel) over multiple days. Lower half of the imaged z-planes were selected of 3D-organoids that were fully recorded on each day (second panel). Live nuclei and dead nuclear remnants were marked for each z-plane, as identified by nuclear size (third panel, see Materials and methods section), measured and integrated per lower half of the 3D scanned organoid as an absolute measure for the amount of viable cells, while summed dead nuclei represent the amount of dead cells (fourth panel). (B) Bar diagrams showing proliferation and/or death of organoid cells following drug treatment and during recovery after drug removal. 3D tile-scans were acquired at the beginning and end of the therapy (day −3 and 0), as well as 3 and 7 days after the end of the therapy (i.e. drug removal) (day 3 and 7). All bars report pixel count from H2B-NeonGreen in living (color) as well as dead (black) organoid cells. Color corresponds to targeted inhibitor (see legend). All values are means ± s.e.m. of 12–15 organoids, normalized to ‘alive H2B’ prior to treatment. One representative z-plane is provided of a P18T and P18T-KRASG12D CRC organoid during and after afatinib (dual EGFR/HER2 inhibitor) therapy. Green, alive nuclei. Red, marked nuclear remnants of dead cells. Color code legend is provided at the bottom of panel C. (C) Patient-derived CRC organoids P8T and P26T were treated and analyzed as described in B. In general, cancer cells that survived drug therapy rapidly reignited cell proliferation after drug release. veh, vehicle (DMSO); sel, selumetinib; afa, afatinib; afa+sel, afatinib+ selumetinib; SCH, SCH772984; SCH+sel, SCH772984+selumetinib.
-
Figure 7—source data 1
ImageJ/Fiji macro script: ‘Macro Drug&release experiment’.
Guides the user through XYZ stacks of organoids, acquired at various time points (days apart). Helps to find back individual organoids and, per z-slice, lets the user indicate dead H2B particles by manual drawing. All output data are summarized in excel output file. For more detail, see Materials and methods section.
- https://doi.org/10.7554/eLife.18489.028
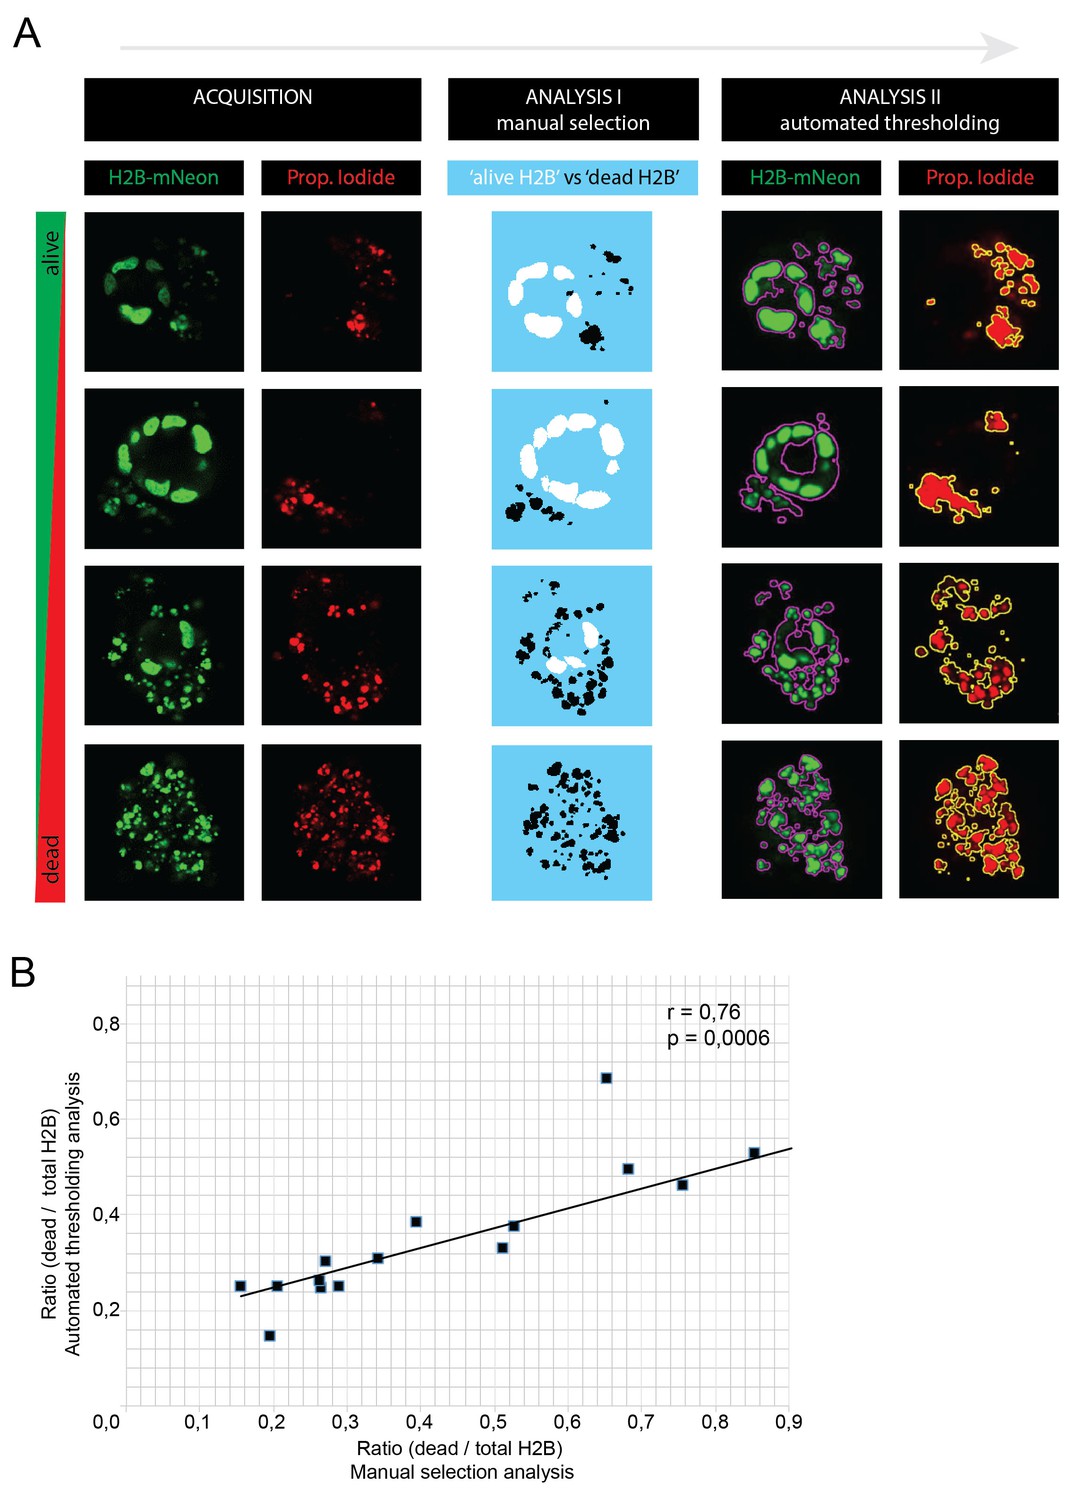
Figure 7—figure supplement 1
The custom-made image analysis software for quantifications in Figure 7 is extensively described in the Materials and methods Section.
In short: alive nuclei were discriminated from dead fragments by particle recognition and manual drawing based on their size and morphology. Due to long culture periods (>10 days), we decided to avoid potential toxic biases of non-permeable DNA staining dyes such as propidium iodide (PI). To validate this manual discrimination strategy, we acquired an additional (single time point) dataset of P18T organoids with variable degrees of apoptosis, this time including PI staining of dead nuclear fragments. (A) Four example organoids showing different degrees of apoptosis. From left to right: images were acquired in green (H2B-Neon) and red (PI) channel (XYZ, but XY slices are shown) and analyzed using two custom-made macros: (I) using manual selection, separating alive H2B from dead fragments as described above (used for Figure 7) and (II) using automated thresholding on H2B-Neon and PI channels (used for Figure 8). Both methods yield surface ratios of dead/total H2B (plotted in B). (B) 16 z-stacks were analyzed by the two analysis methods (see A) to yield surface ratios (dead/total H2B), that show a strong correlation (Pearsson coefficient of 0.76, p<0.001).
Figure 8 with 1 supplement
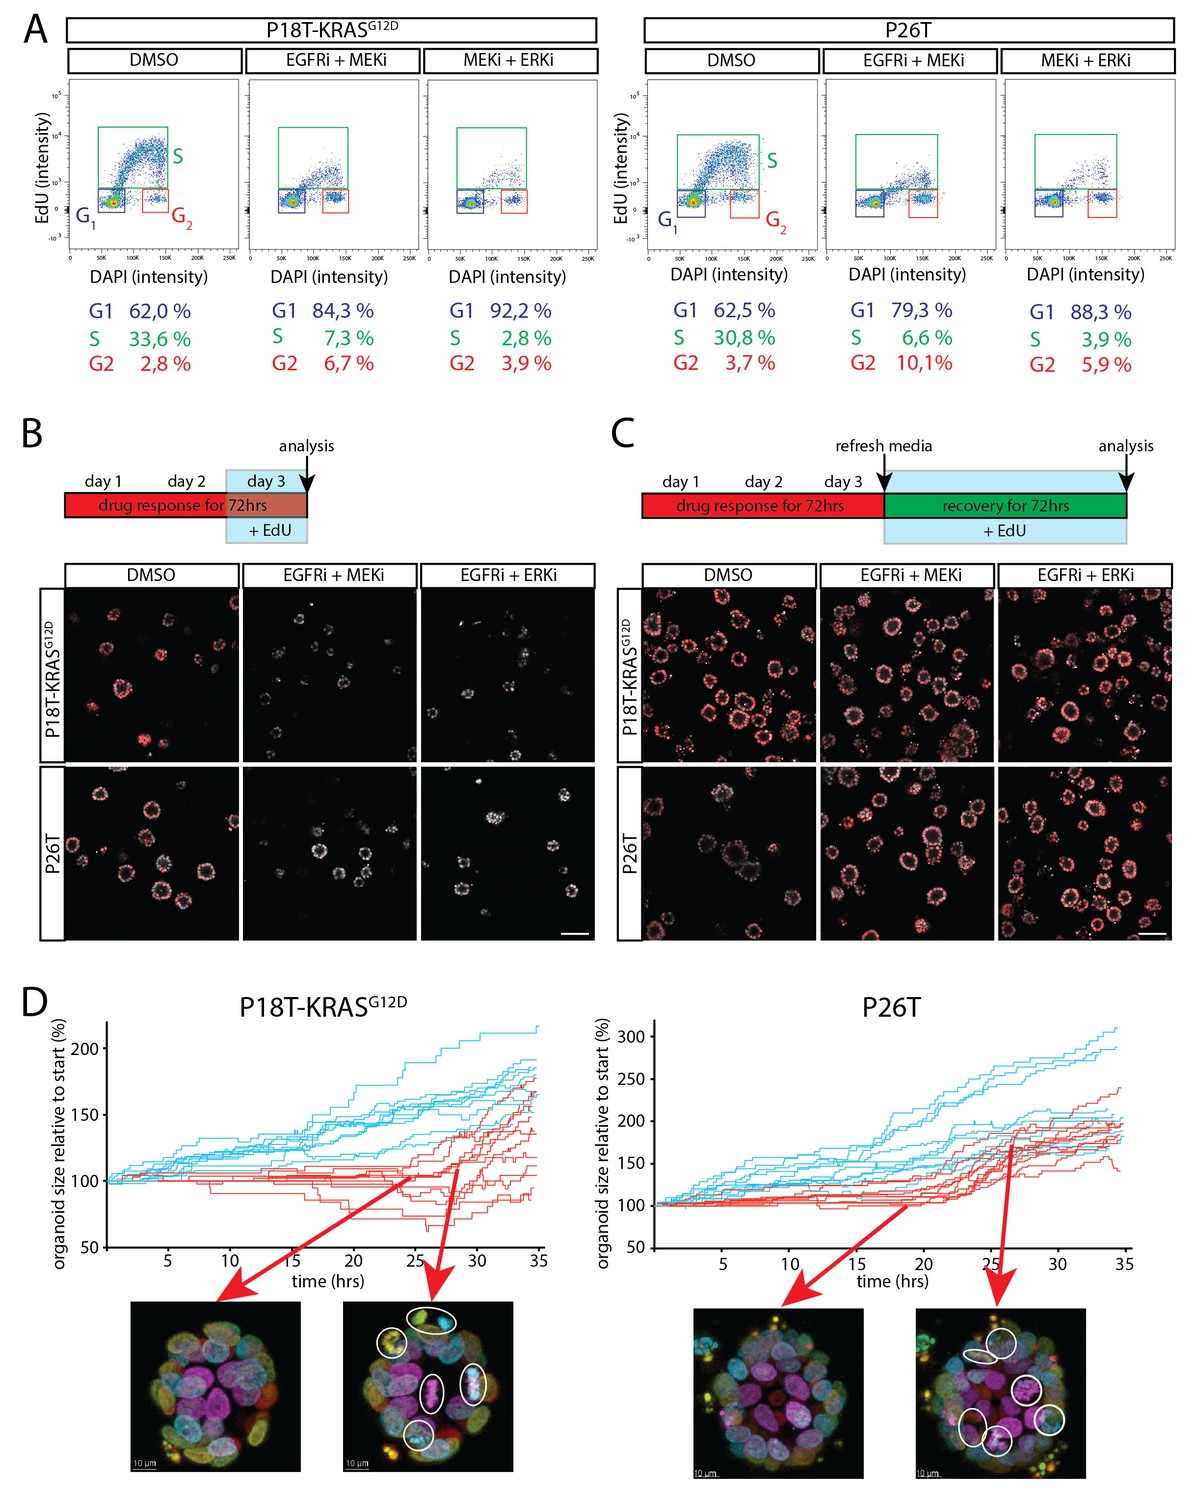
Cell cycle arrest upon dual inhibition of EGFR-MEK-ERK pathway.
(A) Representative cell cycle analysis of P18T-KRASG12D and P26T by flow cytometry (n = 2). DNA was stained with DAPI and DNA-synthesis was detected using a 3 hr EdU pulse to clearly discriminate between G1, S and G2 stages of the cell cycle. Dual inhibition of the EGFR-MEK-ERK pathway significantly changes the distribution of cells between stages of the cell cycle (Chi2: all p values<0,0001) with a predominant increase in G1 at the expense of cells in S-phase. EGFRi + MEKi = afatinib + selumetinib. MEKi + ERKi = selumetinib + SCH772984. (B) Almost no incorporation of EdU (red) is detected during the last 24 hr of drug treatment using dual inhibition of the EGFR-MEK-ERK signaling pathway, indicative of halted proliferative activity. Nuclei are counterstained with Hoechst (white). EGFRi + MEKi = afatinib + selumetinib. EGFRi + ERKi = afatinib + SCH772984. Scale bar is 100 µm. (C) Virtually all cancer cells incorporate EdU (red) when provided after release from targeted inhibition of the EGFR-MEK-ERK pathway. Nuclei are counterstained with Hoechst (white). EGFRi + MEKi = afatinib + selumetinib. EGFRi + ERKi = afatinib + SCH772984. Scale bar is 100 µm. (D) Chronological ranking of mitotic and apoptotic events extracted from live-cell imaging data of tumor recovery reconstructs the organoid size evolution over time. In contrast to vehicle treated organoids (blue lines), afatinib + selumetinib treated organoids (red lines) show first mitotic activity again from 20–24 hr onwards after drug withdrawal. Typical snapshots of live-cell imaging data are provided. White circles indicate mitotic events. Arrows indicate the organoid and moment of snapshot.
-
Figure 8—source data 1
ImageJ/Fiji macro script: ‘Score Events macro’.
Guides the user through the analysis of the event-rich organoid movies (e.g. as generated with the Organoid movie macro), by numbering and drawing indicated events (mitosis, apoptosis) in the movie and generating an overview excel file. Graphs in Figure 8D and Figure 3—figure supplement 2 were generated using this method.
- https://doi.org/10.7554/eLife.18489.031
Figure 8—figure supplement 1
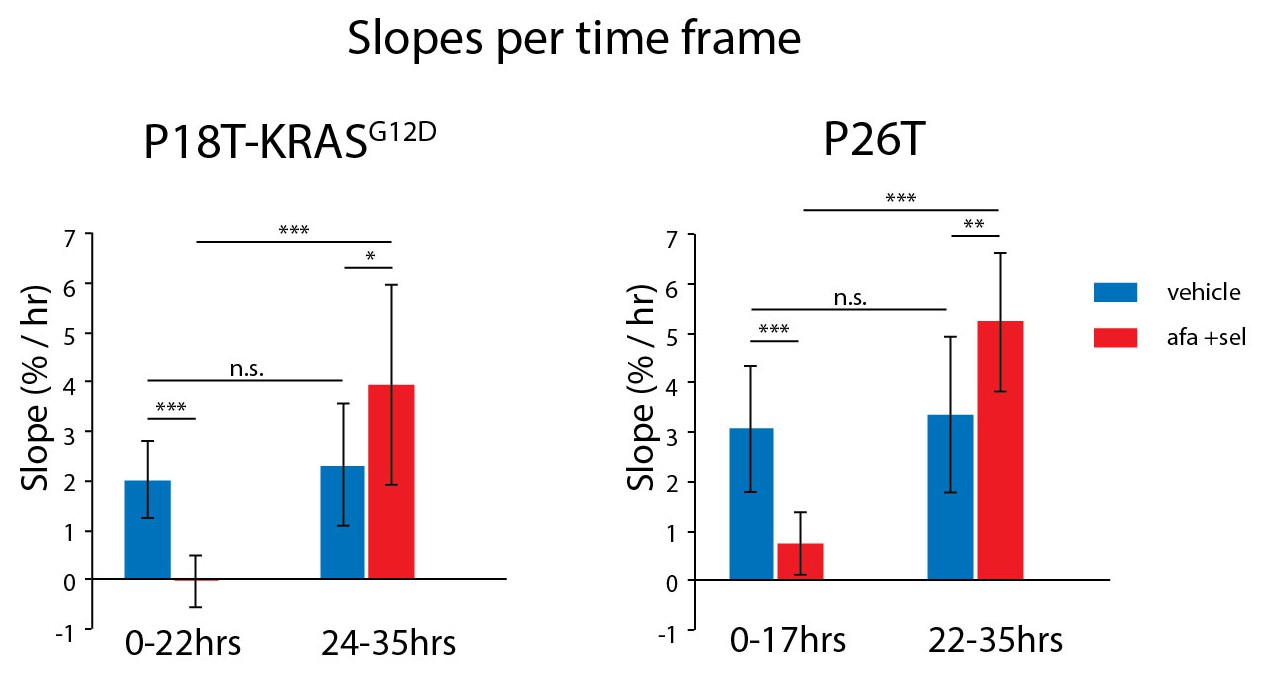
Average growth speeds of the organoids were determined by linear fitting of the traces shown in Figure 8D.
The two time frames roughly correspond to the first half and the second half of the experiment. Directly after drug removal, afatinib- and selumetinib-treated organoids show a significant reduction in growth speed as compared to vehicle-treated organoids. After 22–24 hr of recovery, growth rates return to the level of vehicle-treated organoids (possibly even slightly faster). *p<0,05; **p<0,01; ***p<0,001; n.s., not significant.
Figure 9 with 3 supplements
Robust inhibition of the EGFR-RAS-ERK pathway sensitizes for navitoclax-induced cell death.
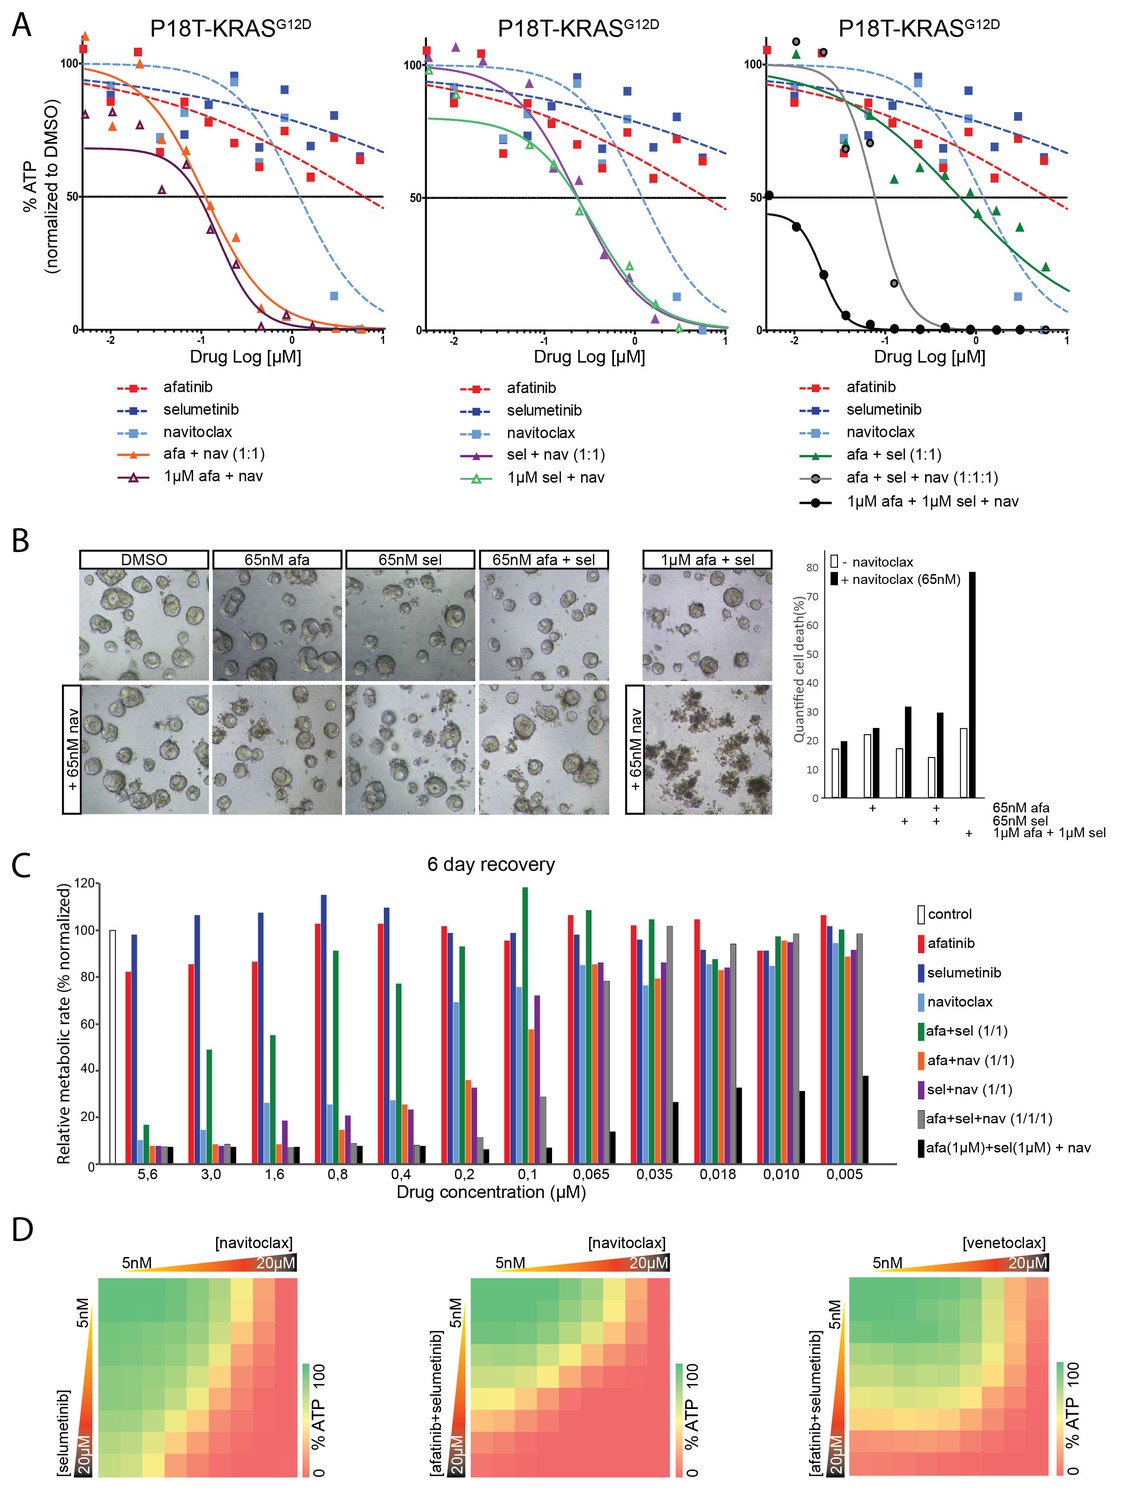
(A) Dose-response curves of patient-derived CRC organoids P18T-KRASG12D treated with the dual EGFR/HER2 inhibitor afatinib, MEK inhibitor selumetinib, BCL2/BCLXL inhibitor navitoclax or a combination thereof. Cell viability was measured by an ATP-based assay after 72 hr of drug treatment. Inhibition of the EGFR-RAS-ERK pathway using high concentrations of afatinib and selumetinib (1 µM) strongly sensitizes for navitoclax-induced reduction of cellular viability (right panel, black line). Such strong sensitization could not be achieved by afatinib (1 µM) alone (left panel, orange line) or selumetinib (1 µM) alone (middle panel, purple line). Dose-response curves are averages of n = 2. (B) Representative images taken from CRC organoids P18T-KRASG12D treated for 72 hr with above described drug combinations. Low amounts of navitoclax (65 nM) only induce cell death in combination with effective inhibition of the RAS pathway using a high concentrations of afatinib and selumetinib. Bar diagram at the right shows quantifications of cell death by scoring propidium-iodide stained nuclei (dead) over viable H2B-labeled nuclei (see Materials and methods section) of minimal 15 organoids per condition (signals pooled prior ratioing, hence no standard deviation calculated: see Materials and methods section). Representative experiment of n = 2. (C) Bar diagrams representing cellular viability (alamarBlue assay)of organoids that have been recovered for six days after 72 hr drug treatment at different concentrations ranging from 5 µM (left) to 5 nM (right). Color corresponds to targeted inhibitor as indicated in the legend. All values are normalized to control samples (DMSO). Targeting of the RAS pathway does not provide long-lasting effects after drug removal, even combination treatments at high concentrations (green bars). However, it does sensitize for cell death induction using low amounts of navitoclax (black bars). An average of two independent experiments is shown. Bar diagrams are averages of n = 2. (D) Extensive dual or triple-inhibitor dose-response assay of patient-derived CRC organoids P18T-KRASG12D treated for 72 hr. 9×9 drug concentrations of selumetinib (MEKi) or afatinib/selumetinib (1/1) versus navitoclax (BCL2/BCLXL) or venetoclax (BCL2) were chosen with logarithmic interval covering a 5 nM–20 µM range. The results of the full matrix screen are represented as heat maps, where red represents 0% ATP levels (no viability) and green represents 100% ATP levels (max viability). Exploring optimal drug concentrations reveal that the more effective inhibition of the RAS pathway is achieved (dual targeting and high concentrations), the less navitoclax is required. Venotoclax, a BCL2-specific inhibitor, is not able to copy the effects of navitoclax (BCL2/BCLXL).
-
Figure 9—source data 1
ImageJ/Fiji macro script: 'Macro PI versus H2B'.
Analyzes H2B-mNeon expressing organoids, that have been labelled with propidium iodide to mark dead cells/fragments. Measure for death induction is the ratio between PI-positive pixels (dead) and H2B-positive pixels (total). Thresholding values for both channels can be tweaked. Thresholded images (z-stacks) are stored and all readouts are summarized in excel data file. For more detail, see Materials and methods section.
- https://doi.org/10.7554/eLife.18489.035
Figure 9—figure supplement 1
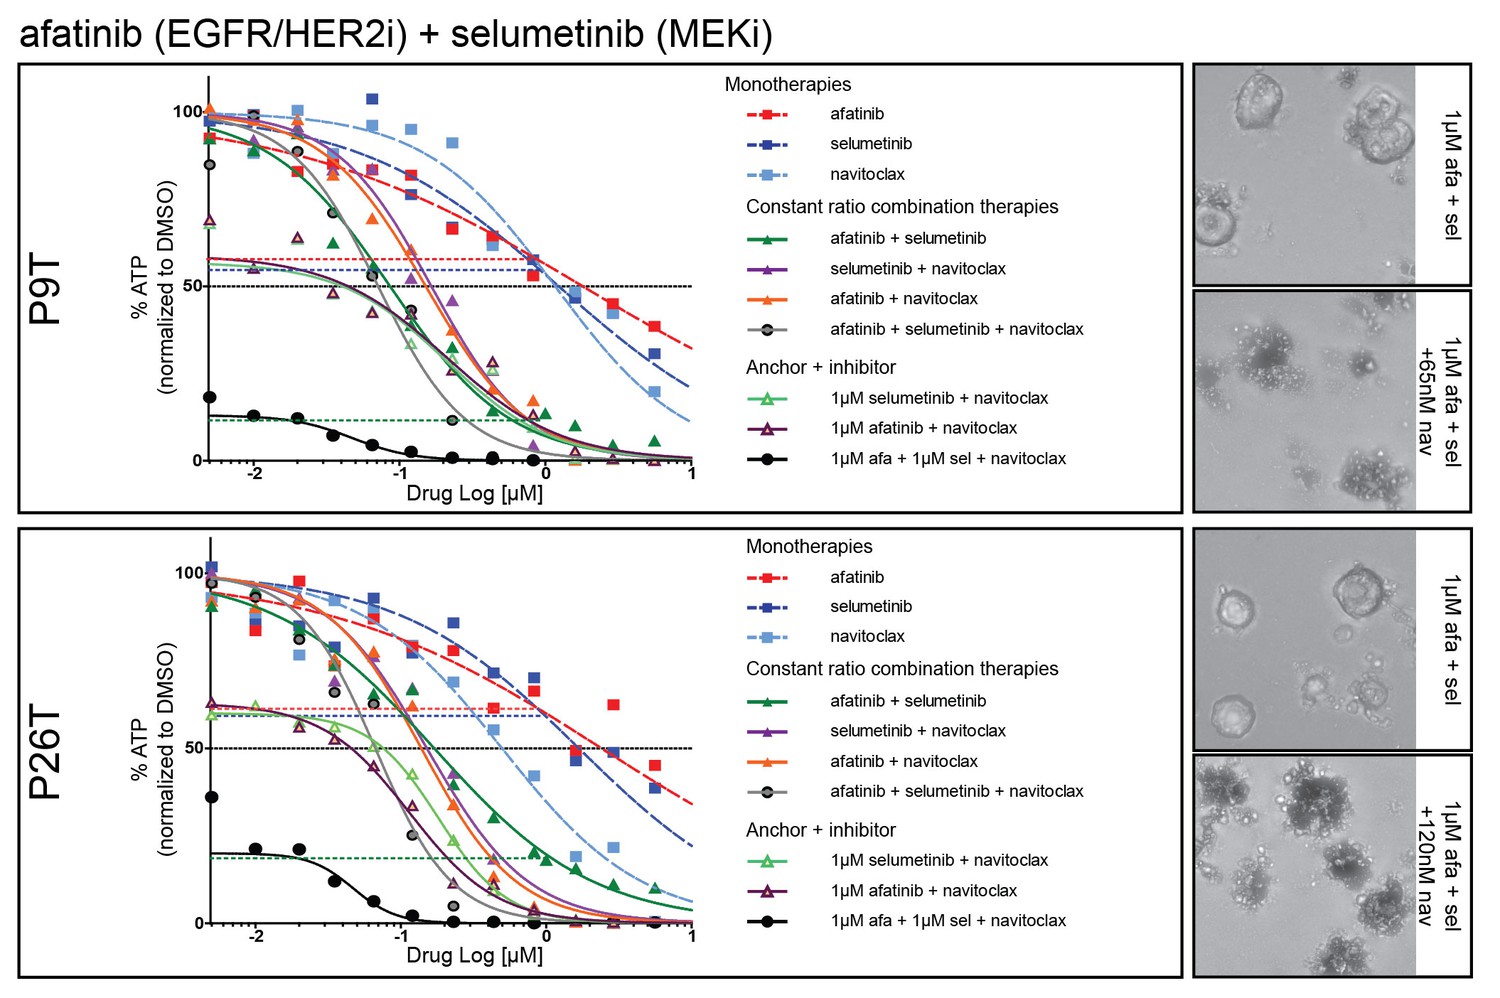
Dose-response curves of patient-derived KRAS mutant CRC organoids P9T and P26T treated with the dual EGFR/HER2 inhibitor afatinib, MEK inhibitor selumetinib, BCL2/BCLXL inhibitor navitoclax or a combination thereof.
Cell viability was measured by an ATP-based assay after 72 hr of drug treatment. Inhibition of the EGFR-RAS-ERK pathway using high concentrations for both afatinib and selumetinib (1 µM) strongly sensitizes for navitoclax-induced reduction of cellular viability (black line). Horizontal colored-dashed lines represent the level of cellular viability of the respective anchor treatments without navitoclax. Representative images of the combined anchor treatments with and without a low dose of navitoclax are depicted on the right. Note that organoids remain viable with only robust EGFR-RAS-ERK inhibition. Dose-response curves are averages of n = 2.
Figure 9—figure supplement 2
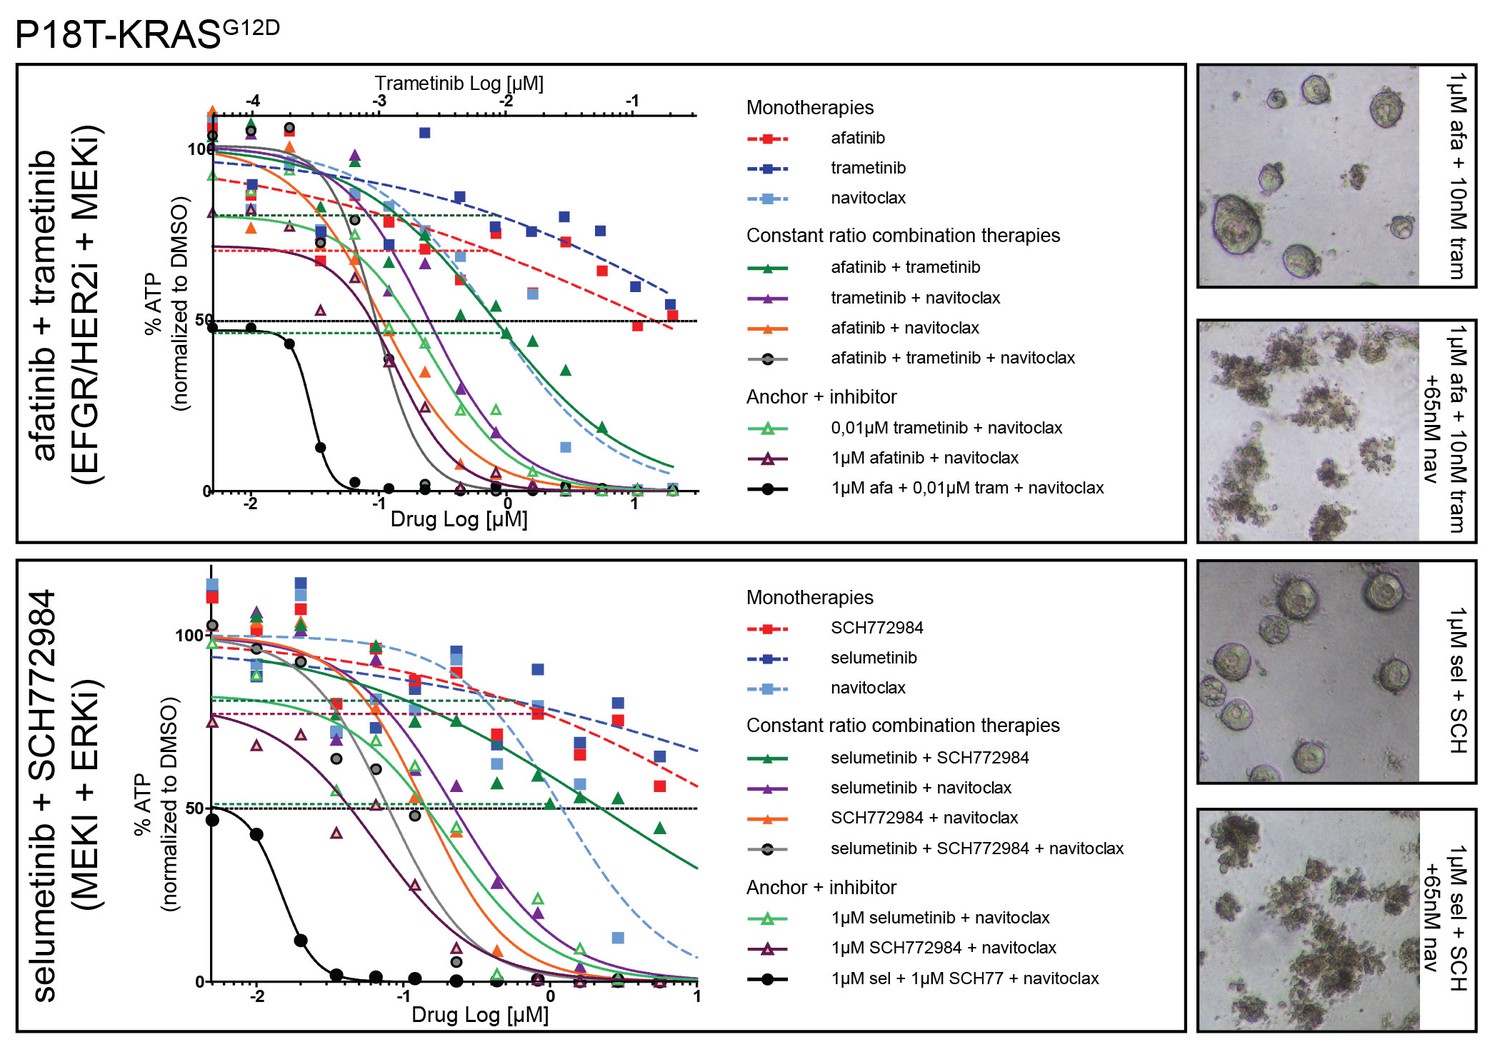
Dose-response curves of patient-derived CRC organoids P18T-KRAS treated with different combination therapies against the EGFR-RAS-ERK pathway with addition of BCL2/BCLXL inhibitor navitoclax and the corresponding mono and dual therapy controls.
Top panel: EGFR-RAS-ERK pathway inhibition with dual EGFR/HER2 inhibitor afatinib and MEK inhibitor trametinib. Lower panel: EGFR-RAS-ERK pathway inhibition with MEK inhibitor selumetinib and ERK inhibitor SCH772984. Cell viability was measured by an ATP-based assay after 72 hr of drug treatment. Inhibition of the EGFR-RAS-ERK pathway using fixed high concentrations of inhibitors against EGFR-RAS-MEK pathway effectors strongly sensitizes for navitoclax-induced reduction of cellular viability (black line). Horizontal colored-dashed lines represent the level of cellular viability of the respective anchor treatments without navitoclax. The representative images of the combined anchor treatments with and without a low dose of navitoclax are depicted on the right. Note that organoids remain viable with only robust EGFR-RAS-ERK inhibition. Dose-response curves are averages of n = 2.
Figure 9—figure supplement 3
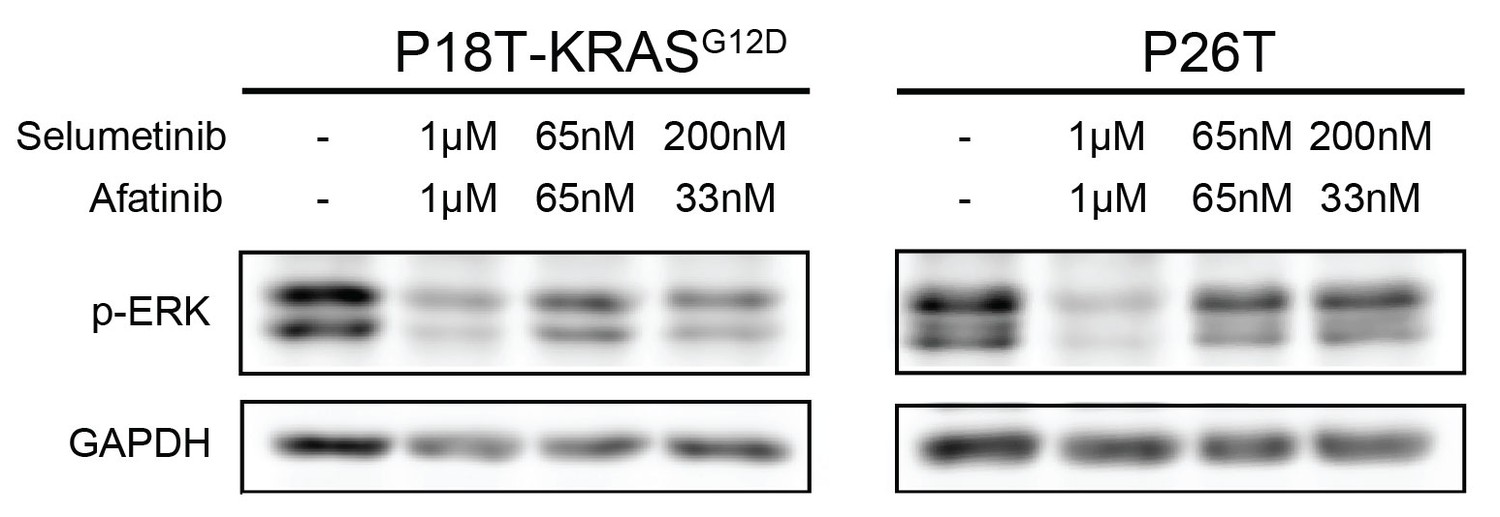
Drug response of P18T-KRASG12D and P26T CRC organoids examined by Western bot after 24 hr.
Most effective reduction of p-ERK is detected when the organoids were treated with high concentrations of inhibitors afatinib (1 μM) and selumetinib (1 μM) and not at lower concentrations (65 nM of both drugs or 33 nM afatinib + 200 nM of selumetinib).
Videos
Video 1
Real-time imaging of cellular drug responses in tumor organoids using high concentrations targeted inhibitors.
https://doi.org/10.7554/eLife.18489.006
Video 2
Real-time imaging of cellular drug responses in tumor organoids using low concentrations targeted inhibitors.
https://doi.org/10.7554/eLife.18489.007
Video 3
Real-time imaging of cellular behavior in tumor organoids surviving treatment with afatinib and selumetinib.
P18T-KRASG12D and P26T organoids were treated for 72 hr with afatinib (1 μM) and selumetinib (1 μM), similarly to Figures 1 and 3 and Video 1. After the subsequent washout of the drugs, organoids were imaged for ~40 hr to visualize cell behaviour in surviving organoids.
Additional files
-
Supplementary file 1
Dose-response data (%ATP normalized to DMSO) for all patient-derived tumor organoids as described in Figure 4—source data 1, Figure 4—source data 2, Figure 5—source data 1 and Figure 6—source data 1.
- https://doi.org/10.7554/eLife.18489.039
Download links
A two-part list of links to download the article, or parts of the article, in various formats.
Downloads (link to download the article as PDF)
Open citations (links to open the citations from this article in various online reference manager services)
Cite this article (links to download the citations from this article in formats compatible with various reference manager tools)
Targeting mutant RAS in patient-derived colorectal cancer organoids by combinatorial drug screening
eLife 5:e18489.
https://doi.org/10.7554/eLife.18489


