Structural determinants of adhesion by Protocadherin-19 and implications for its role in epilepsy
- The Ohio State University, United States
Figures
Figure 1 with 3 supplements
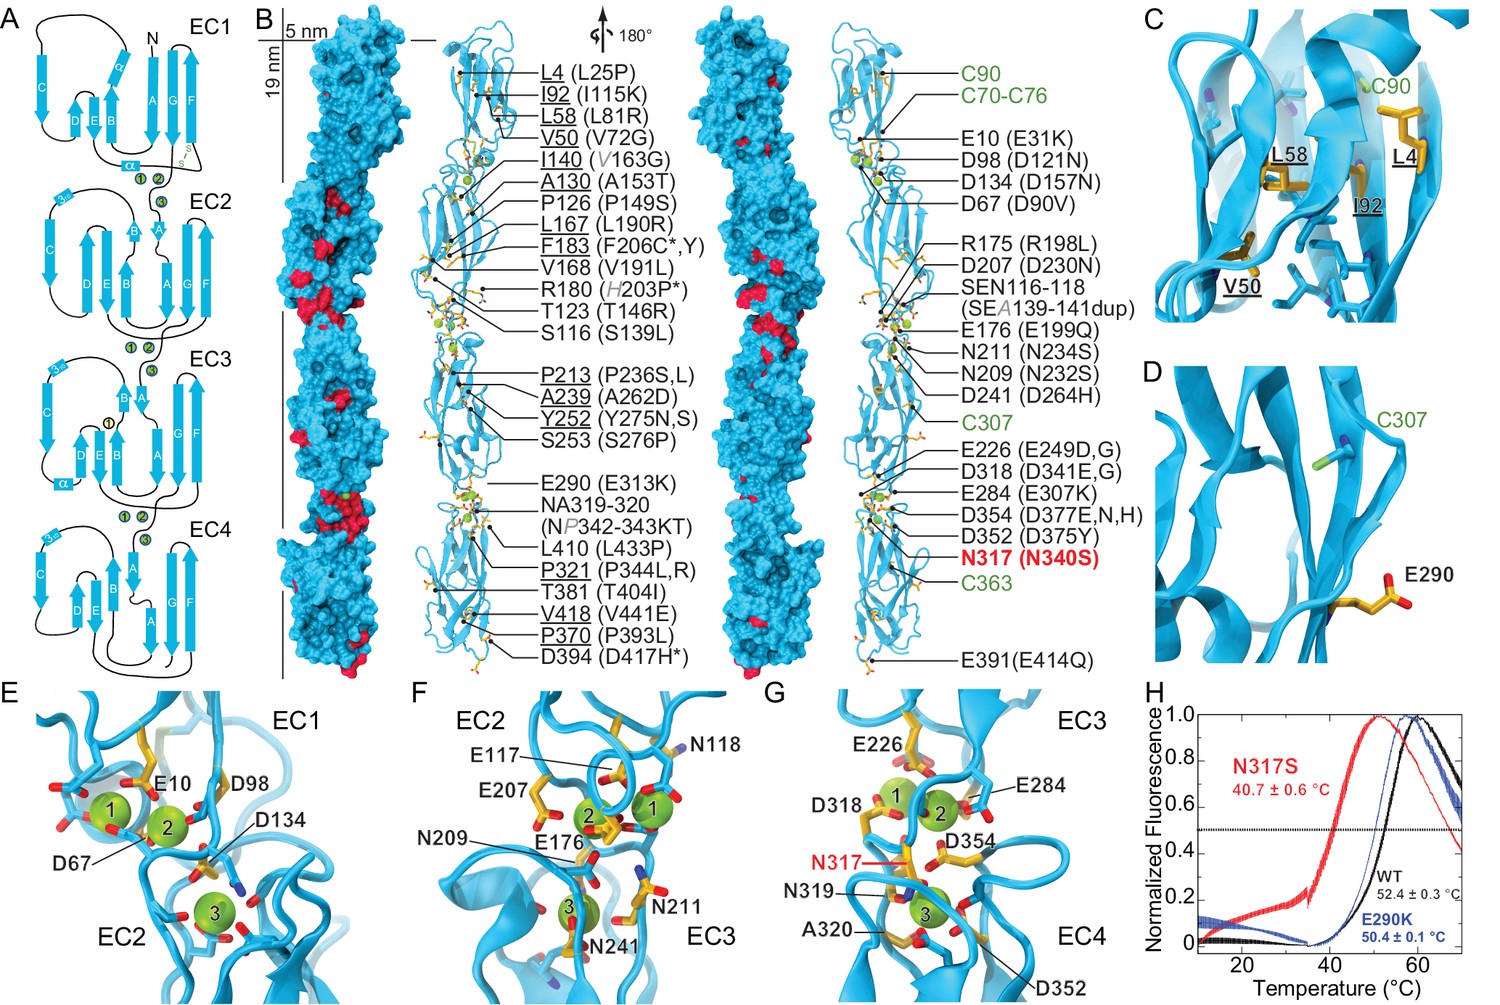
Pcdh19 EC1-4 structure reveals the location of PCDH19-FE missense mutations.
(A) Topology diagram of Pcdh19 EC1-4. A typical cadherin fold is observed for each EC repeat with seven β strands labeled A to G. Calcium and sodium ions are shown as green and yellow circles, respectively. (B) Molecular surface representation and ribbon diagram of Pcdh19 EC1-4 shown in two orientations. Forty-three sites mutated in PCDH19-FE are highlighted in dark red on the protein surface (when applicable), shown in stick representation on the ribbon diagram, and listed. Mutations are indicated in parenthesis using the human gene numbering, with three non-conserved sites listed in italic gray. Residues whose side chains point to the protein core are underlined. Sites at inter-repeat, calcium-binding linker regions are listed on the right panel. The N317 site, involved in > 20 PCDH19-FE cases (N340S), is in red. Cysteine amino-acids are in lime; none are exposed. Paired mutations in single PCDH19-FE patients are indicated with a star (*). See also Figure 1—source data 1. (C) Detail of EC1 highlighting mutation sites (yellow sticks) in which residue side chains are pointing to the protein core. Neighboring hydrophobic core residues are shown in cyan. (D) Detail of EC3 highlighting a mutation site in which the residue side chain is exposed and pointing away from the protein surface. (E-G) Detail of calcium-binding inter-repeat linkers EC1-2 (E), EC2-3 (F), and EC3-4. (G) Calcium ions are shown in green and calcium-coordinating side chains in stick representation. Mutation sites are labeled and shown in yellow. (H) Melting temperature for the Pcdh19 EC3-4 wild type (WT) fragment, the N317S (equivalent to human N340S) and E290K (E313K) mutants determined using differential scanning fluorimetry. A clear decrease in thermostability is observed for the N317S mutant fragment in 2 mM CaCl2, but not for the E290K mutant. The curves represent the average for each construct with vertical bars representing standard error of the mean. See also Figure 1—figure supplement 1–3.
-
Figure 1—source data 1
PCDH19-FE mutations.
- https://doi.org/10.7554/eLife.18529.005
Figure 1—figure supplement 1
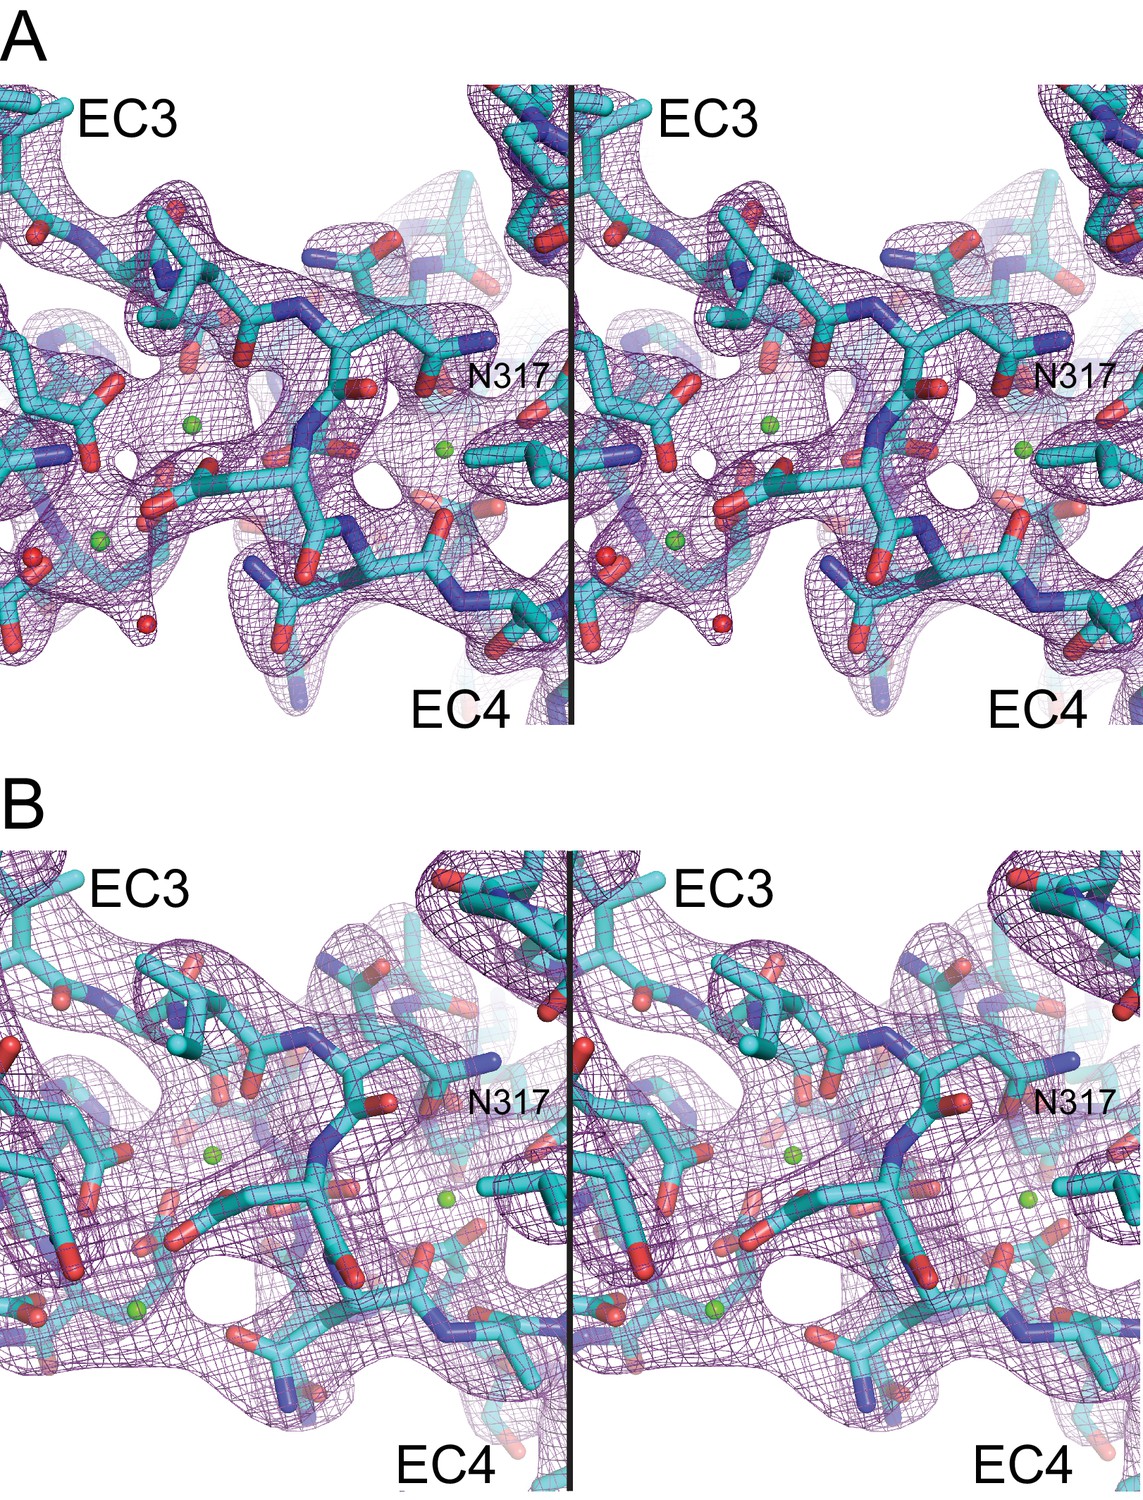
Electron density maps for the EC3-4 linker.
(A) Stereo view of the 2Fo-Fc electron density map (purple mesh) from the Pcdh19 EC3-4 structure (2.51 Å) contoured at 2.5 σ. (B) Electron density map from the Pcdh19 EC1-4 structure (3.59 Å) contoured at 1.8 σ.
Figure 1—figure supplement 2
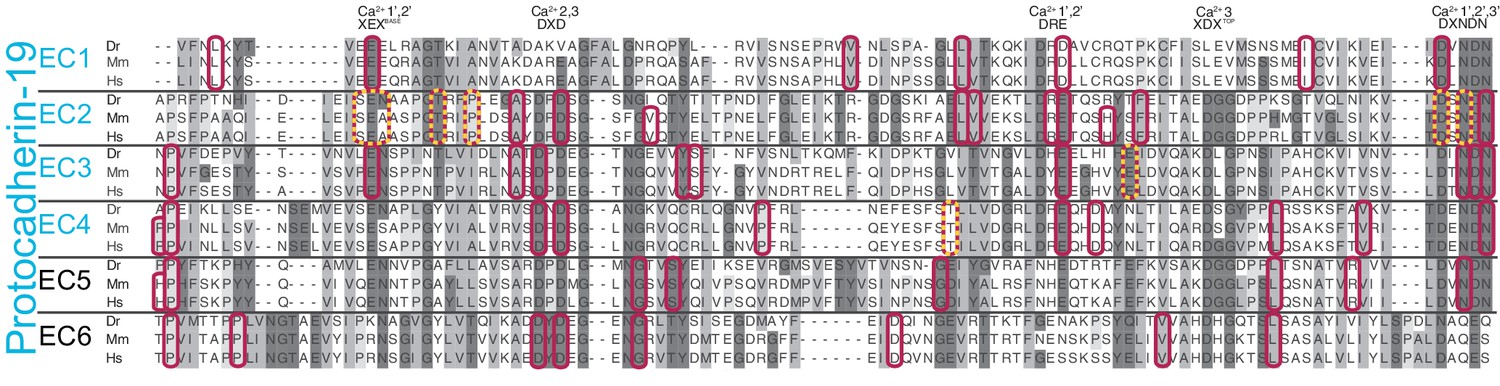
Sequence alignment of zebrafish, mouse, and human Pcdh19 EC repeats.
All 6 EC repeats for each species are aligned to each other (EC1 to EC6). Conserved calcium-binding motifs are labeled. Residues that are mutated in PCDH19-FE are highlighted with red boxes. Residues involved in PCDH19-FE and located at the Pcdh19 EC1-4 antiparallel interface are highlighted with red and yellow boxes.
Figure 1—figure supplement 3
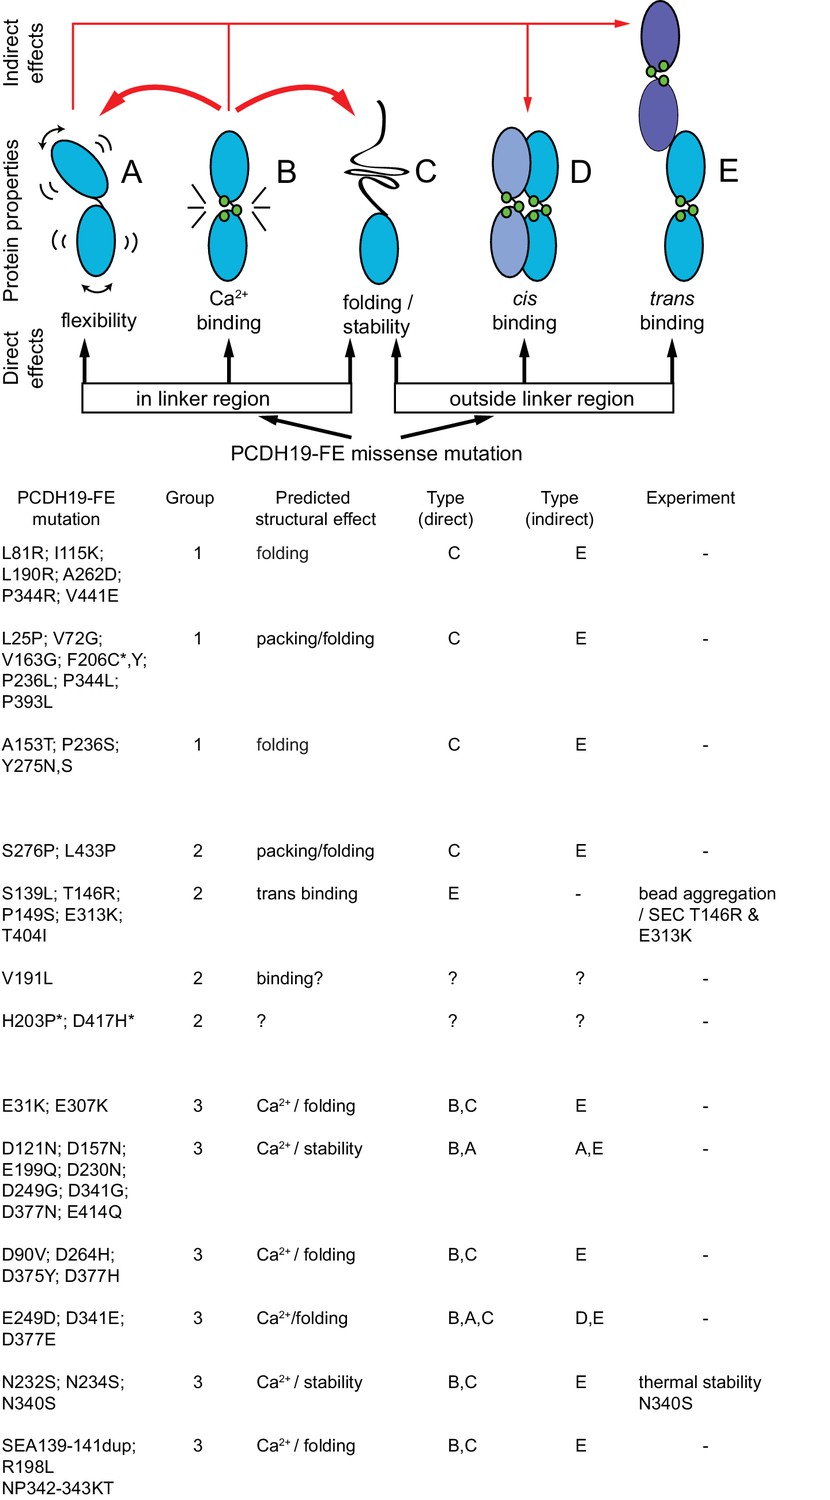
Predicted structural consequences of PCDH19-FE mutations.
Schematics illustrate how missense mutations can alter protein behavior (adapted from [Sotomayor et al., 2010]). Mutations of residues at the linker region may affect flexibility (A), calcium-binding affinity (B), or impair folding/stability (C). Mutations outside the linker may also impair folding, as well as cis or trans binding. PCH19-FE mutations seen within the Pcdh19 EC1-4 structure are listed and grouped according to predicted structural effects (from visual inspection and sequence analyses) as discussed in the text. Paired mutations in single PCDH19-FE patients are indicated with a star (*).
Figure 2 with 3 supplements
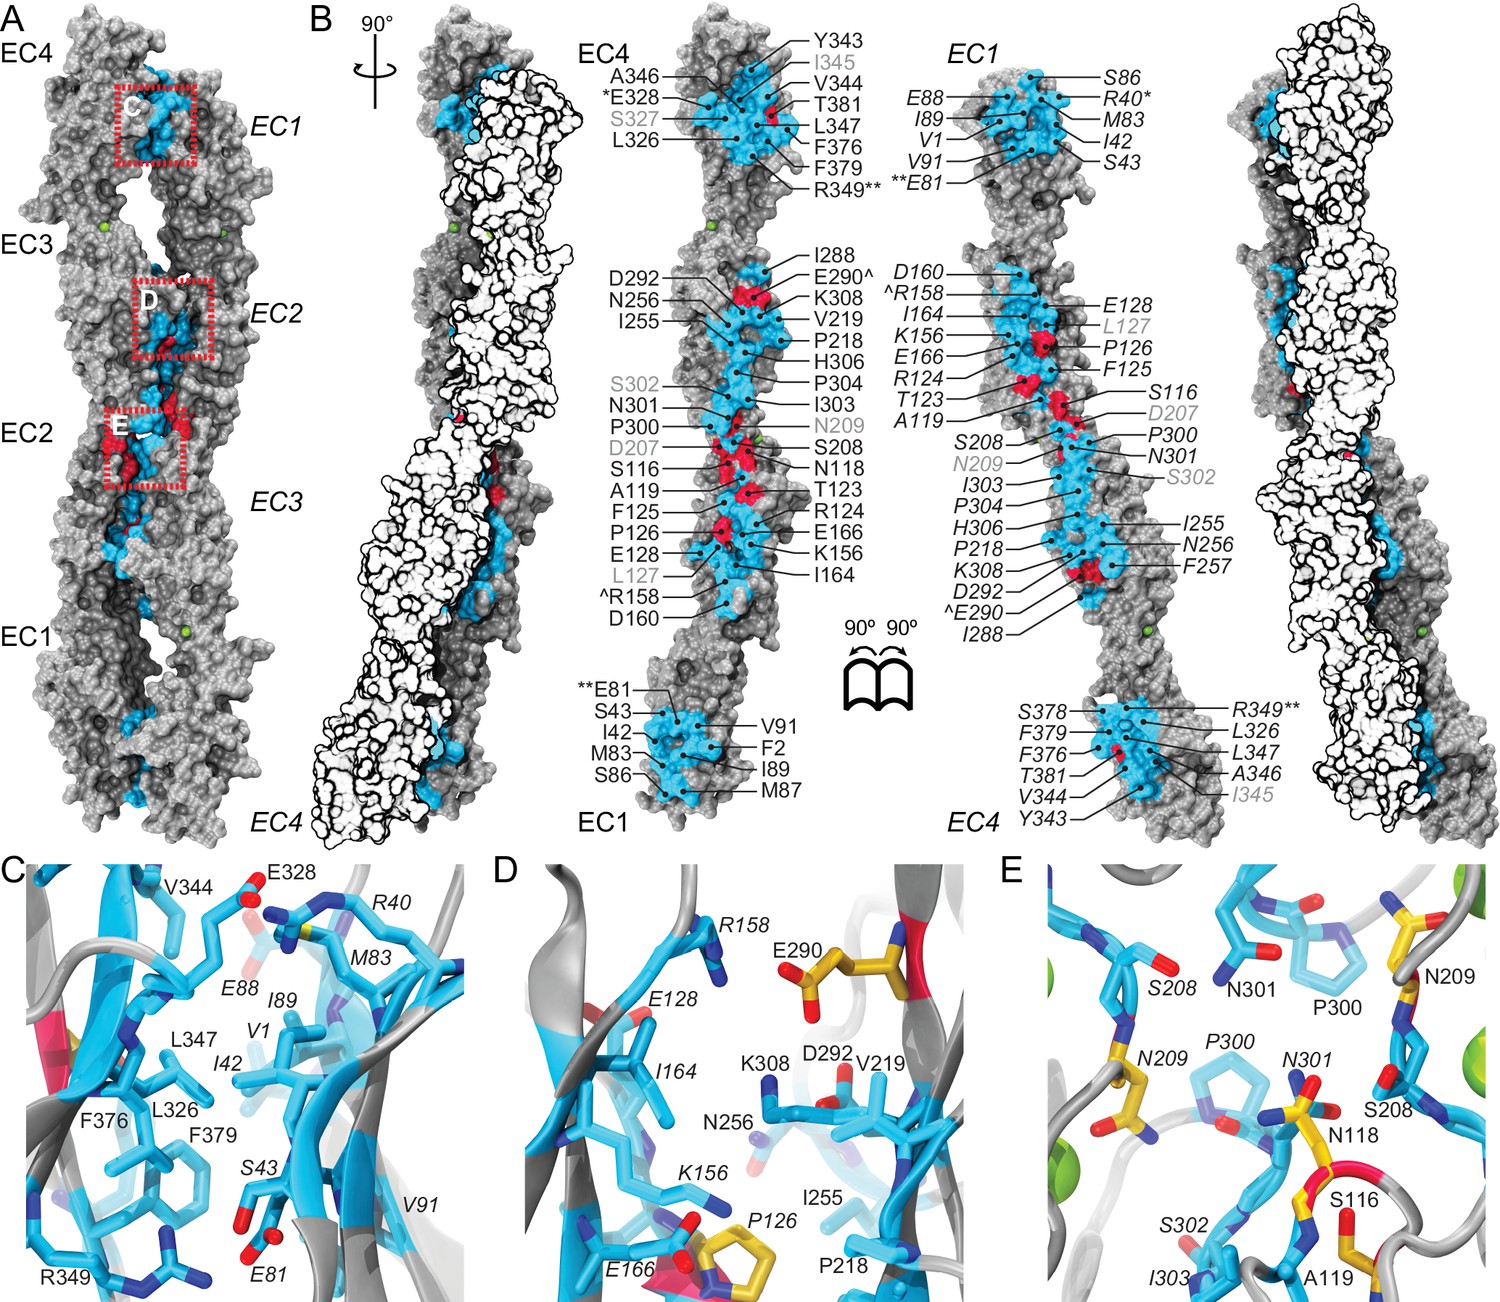
A crystallographic Pcdh19 antiparallel interface involves fully overlapped EC1-4 repeats.
(A) Molecular surface representation of two Pcdh19 EC1-4 molecules interacting in the crystallographic asymmetric unit. In this dimeric arrangement, an interaction interface is formed by fully overlapped and antiparallel EC1-4 protomers (Pcdh19-I1). Red, dashed boxes indicate three interaction sites highlighted in panels (C–E). (B) Side views of the Pcdh19 dimer and the interaction surface exposed with interfacing residues listed and shown in cyan. Sites mutated in PCDH19-FE located at the interface are shown in dark red. Sites with residue side chains pointing to the protein core are labeled in gray text. Three inter-molecular salt bridges are indicated (*: R40-E328; **: E81-R349; ^: R158-E290). (C–E) Detail of antiparallel interface (red dashed boxes in A). Interfacing residues are in cyan and yellow (PCDH-FE). Left panel is in the same orientation as A, middle and right panels are rotated around the dimer’s longest axis. Labels for one of the protomers are in italics. See also Figure 2—figure supplement 1–3.
Figure 2—figure supplement 1
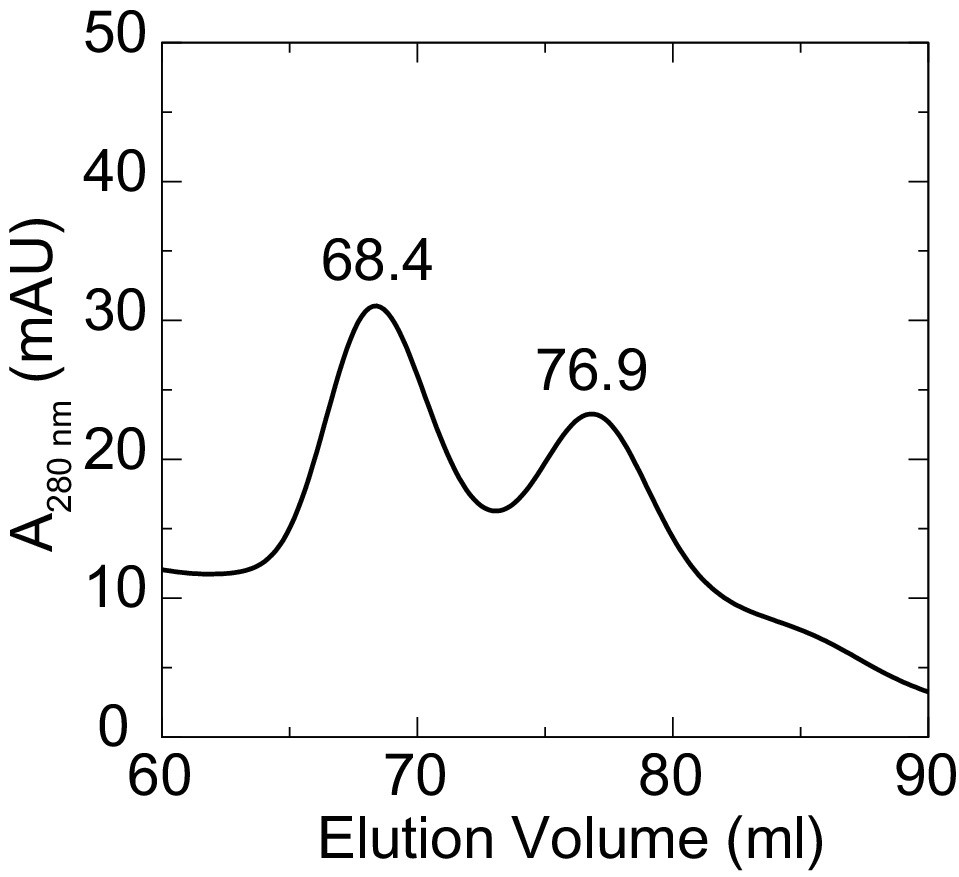
Two states for Pcdh19 EC1-4 in solution.
Elution profile from a size exclusion chromatography experiment showing two clear, separate peaks of distinct hydrodynamic size. Crystallization of the Pcdh19 EC1-4 fragment was carried out with fractions collected from the peak representing the largest species (68.4 ml).
Figure 2—figure supplement 2
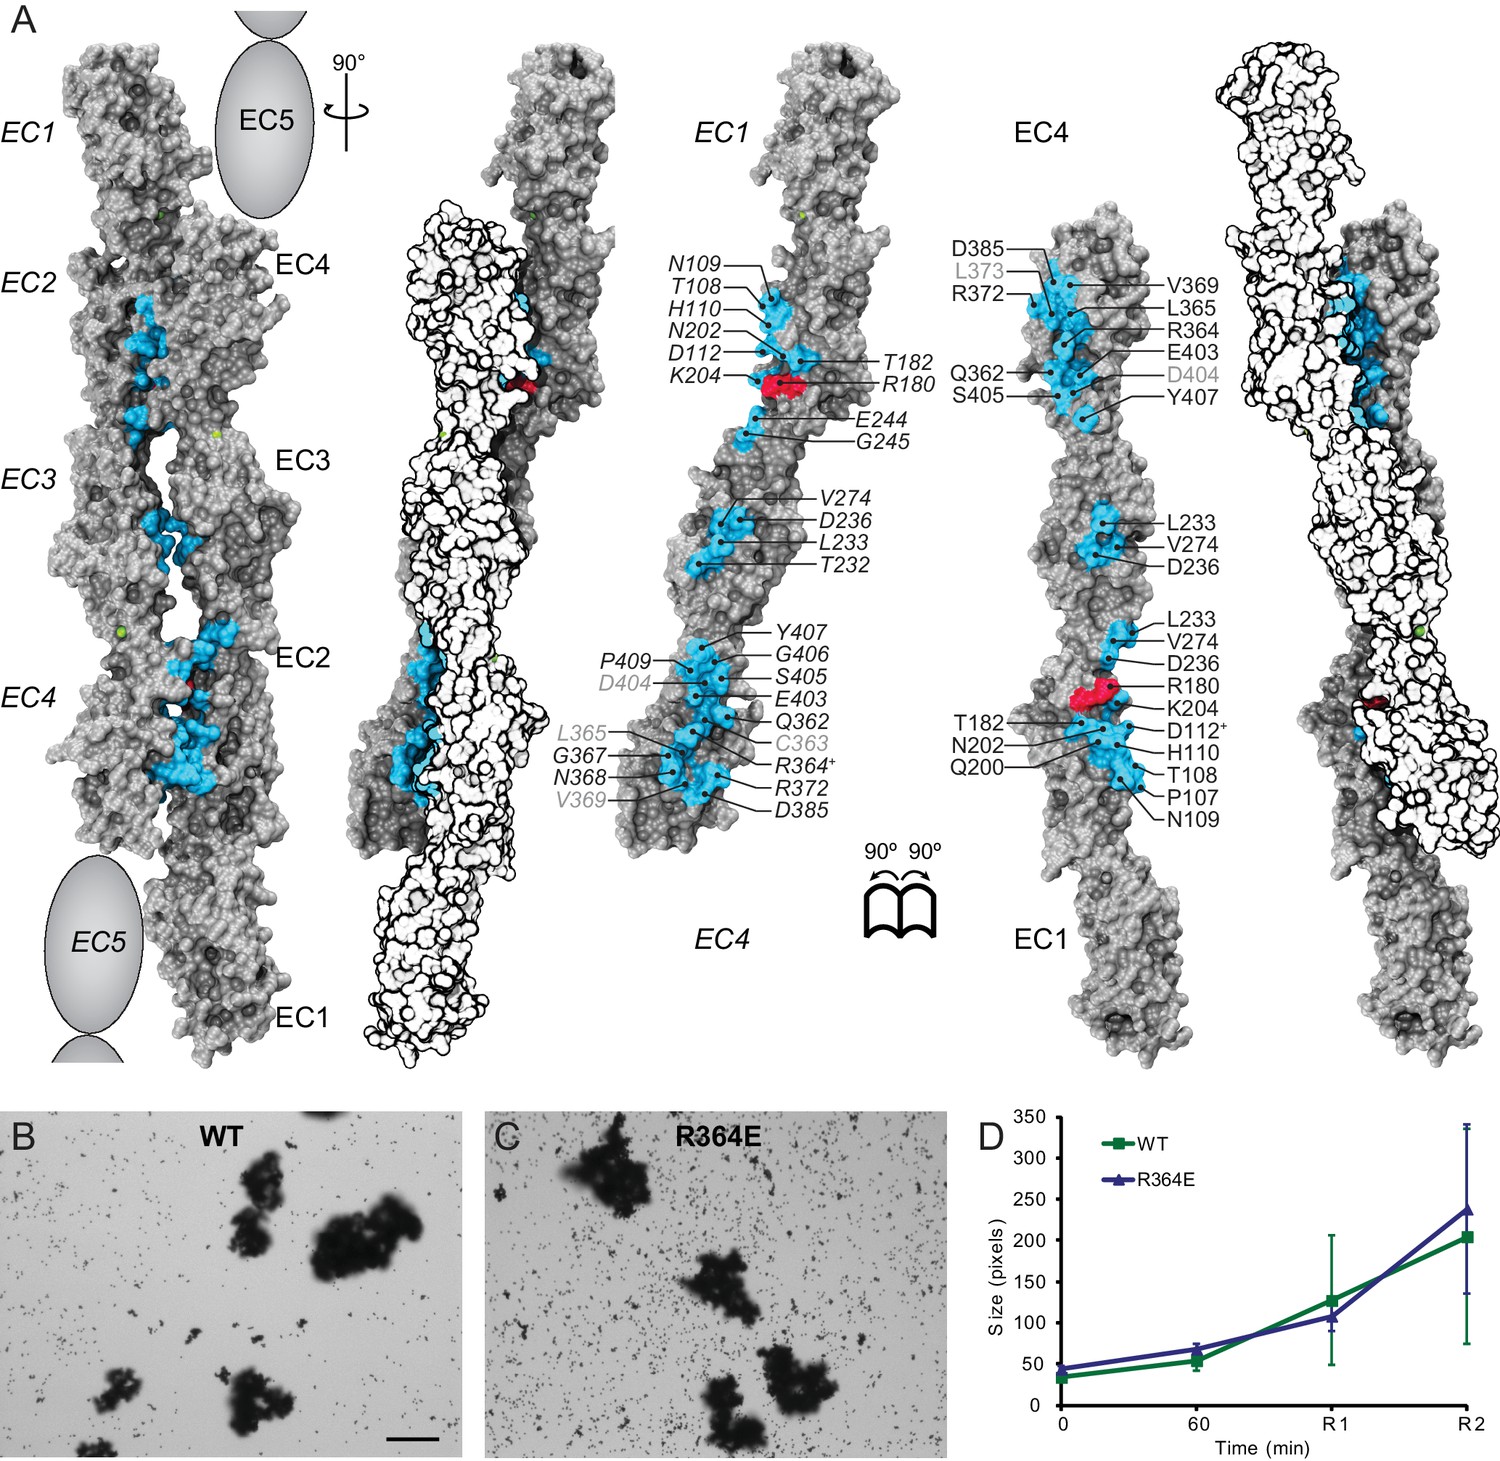
Alternate crystallographic antiparallel interface involves EC1 to EC5 repeats.
(A) Molecular surface representation of two Pcdh19 EC1-4 molecules forming an antiparallel dimer that would involve fully overlapped EC1-5 repeats (Pcdh19-I2 interface). Side views and interaction surface exposed with interfacing residues listed and shown in cyan. Sites mutated in PCDH19-FE located at the interface are shown in dark red. Sites with residue side chains pointing to the protein core are labeled in gray text. Labels for one of the protomers are in italics. Two residues involved in a Pcdh19-I2 interface salt-bridge are indicated with a plus sign (+). Buried surface area in this interface is 310 Å2 per interacting EC, compared to 413 Å2 per interacting EC for the Pcdh19-I1 interface (Figure 2). (B–C) Protein G beads coated with full-length extracellular wild-type (WT) Pcdh19ECFc (B) or an engineered mutation (C) imaged after incubation for 1 hr followed by rocking for 2 min in the presence of calcium. Bar – 100 µm. (D) Mean aggregate sizes for WT and R364E in the presence of calcium after 1 hr of incubation followed by rocking for 1 min (R1) and 2 min (R2). Error bars are standard error of the mean (n = 3 for each construct, Figure 3—source data 1). Aggregation of Pcdh19-I2 interface mutant R364E is within the variation of WT samples (see also Figure 3H).
Figure 2—figure supplement 3
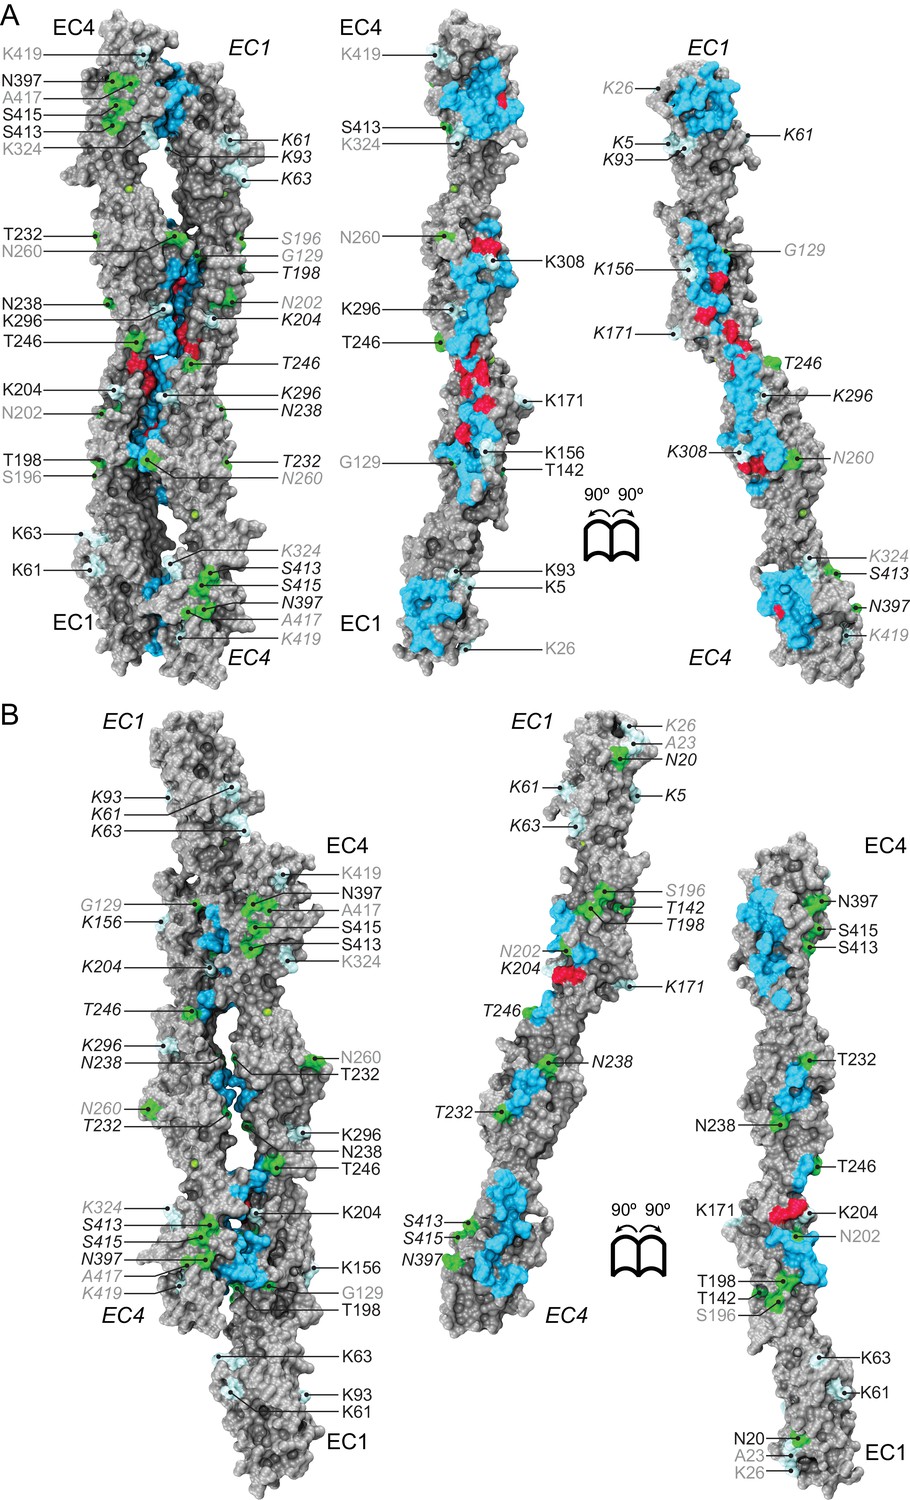
Pcdh19 dimer interfaces and predicted glycosylation and glycation sites.
(A) Molecular surface representation of the Pcdh19-I1 interface (left) with interaction surface exposed (right) and with all predicted glycosylation (green) and glycation (light cyan) sites listed. Interfacing residues are shown in cyan. Sites mutated in PCDH19-FE and at the interface are shown in dark red. None of the predicted glycosylation sites involve interfacial residues, but two glycation sites do (K156 and K308). To the best of our knowledge, glycation has never been reported for cadherins. (B) Molecular surface of the alternate Pcdh19-I2 interface shown as in (A). Glycosylation (T232) and glycation (K204) sites are predicted for interfacial residues. O-linked glycosylation is also predicted for human PCDH19 S204, equivalent to N202 in Pcdh19. Non-conserved sites are in gray text.
Figure 3 with 1 supplement

Minimal adhesive Pcdh19 fragment includes repeats EC1-4.
(A–F) Protein G beads coated with full-length (A) and truncated versions (B–F) of the Pcdh19 extracellular domain imaged after incubation for 1 hr followed by rocking for 2 min in the presence of calcium. Bar – 100 µm. (G) Western blot shows efficient production and secretion of full-length and truncated Pcdh19 extracellular domains. (H) Aggregate size for full-length and truncated versions of the Pcdh19 extracellular domain after 1 hr of incubation followed by rocking for 1 min (R1) and for 2 min (R2). Error bars are standard error of the mean (n = 3 for all aggregation assays and constructs). Inset: zoom-in showing pixel size from 15 to 85 (y axis). Bead aggregation was observed for constructs including EC1-6Fc, EC1-5Fc, and EC1-4Fc. Data for EC1-6 is also plotted in Figure 2—figure supplement 2D (WT), Figure 3—figure supplement 1C (Pcdh19ECFc (Ca2+)), and Figure 4H (WT (Ca2+)) for comparison to additional constructs. See also Figure 3—source data 1.
-
Figure 3—source data 1
Quantification of aggregation assays.
- https://doi.org/10.7554/eLife.18529.014
Figure 3—figure supplement 1
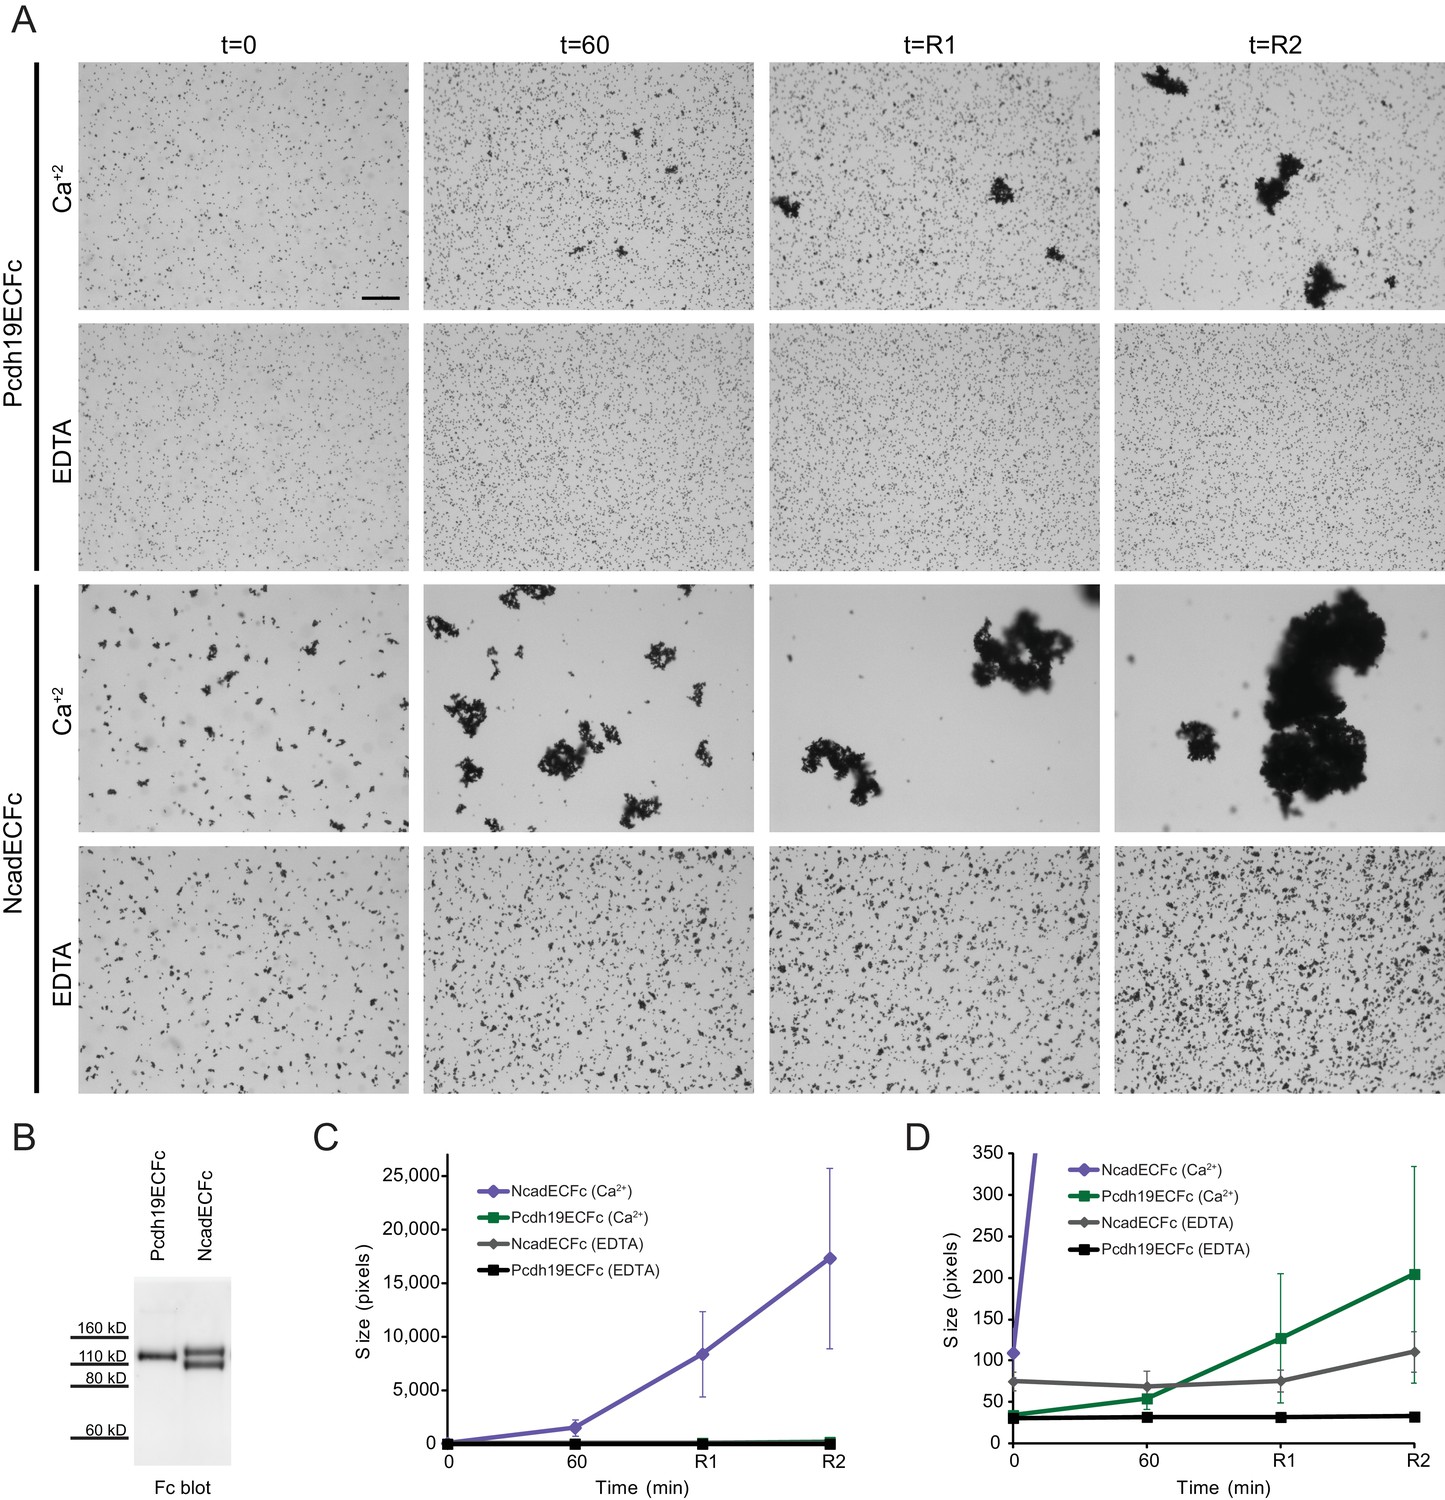
Modified bead aggregation assays can detect calcium-dependent homophilic Pcdh19 interactions.
(A) Protein G beads coated with full-length extracellular Pcdh19ECFc or NcadECFc imaged after incubation for 1 hr followed by rocking for 2 min in buffer with calcium. Representative images for parallel experiments in the absence of calcium are shown in panels labeled EDTA. Bar – 100 µm. (B) Western blot shows efficient production and secretion of Pcdh19ECFc (also shown in Figure 4G WT lane) and NcadECFc, the latter present with and without cleavage of its prodomain. (C) Aggregate size for Pcdh19ECFc and NcadECFc in the presence and absence of calcium after 1 hr of incubation followed by rocking for 1 min (R1) and for 2 min (R2; see also Figure 3H). (D) Detail of plot in (C). Aggregate size for Pcdh19ECFc in the presence of calcium (Ca2+, green) is larger than in the absence of it (black) after rocking. See also Figure 3—source data 1.
Figure 4 with 2 supplements
PCDH19-FE mutations at Pcdh19 I1 antiparallel interface impair Pcdh19-mediated bead aggregation.
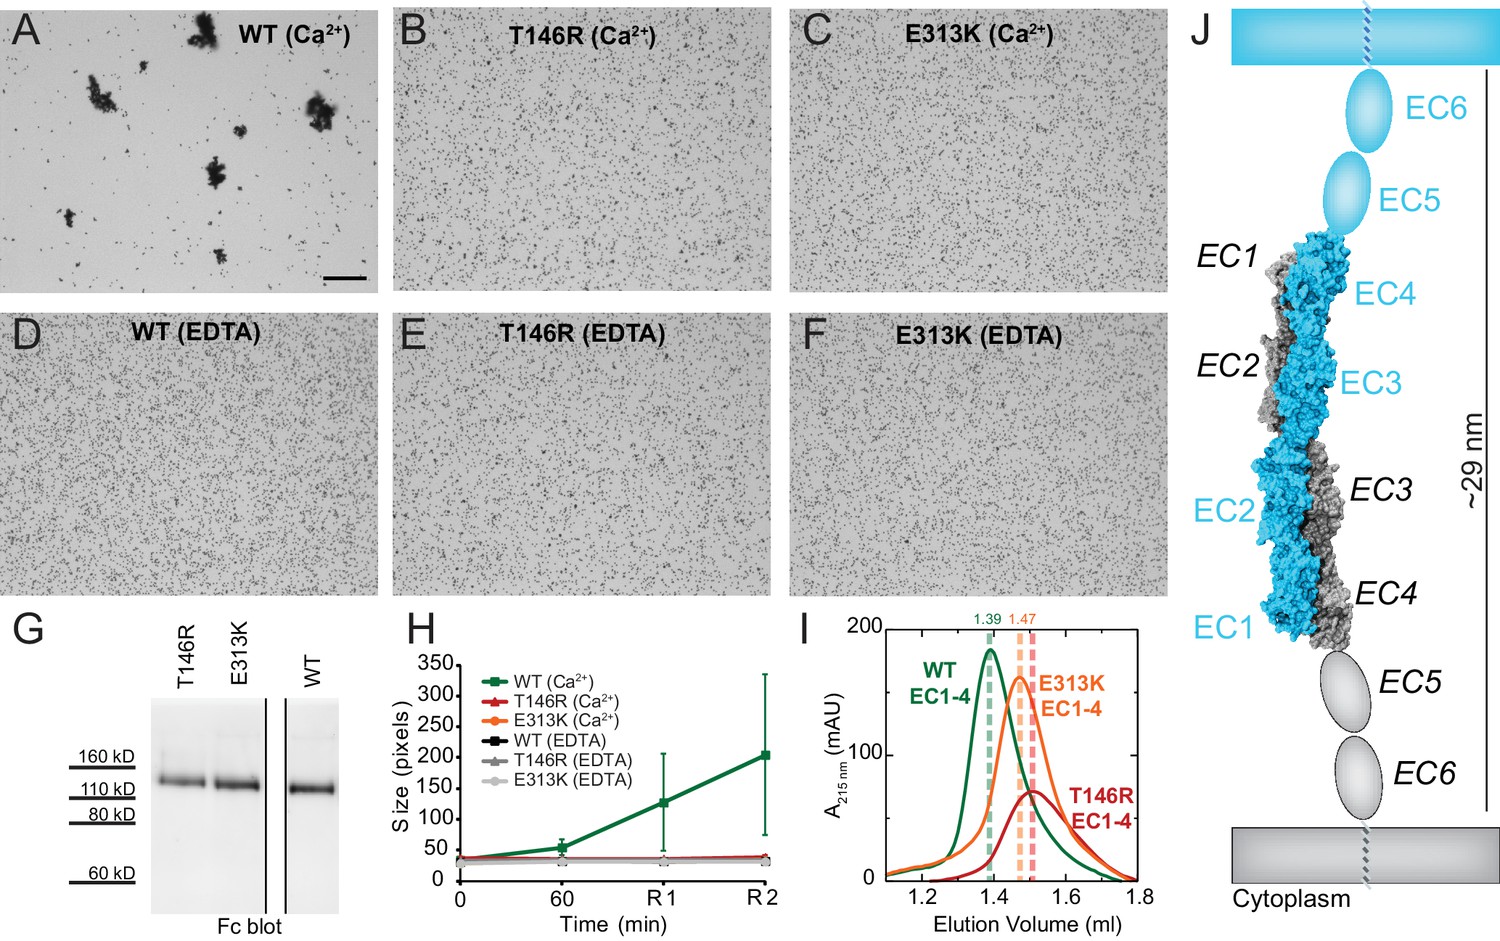
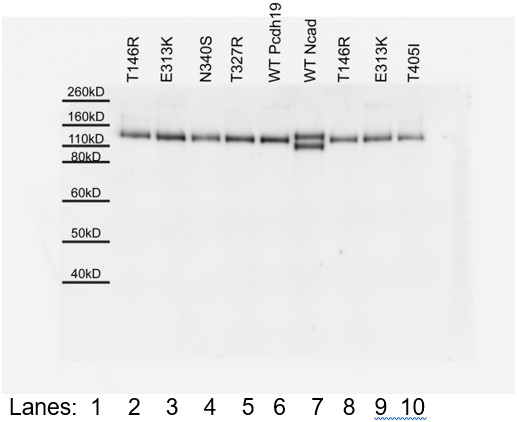
(A–F) Protein G beads coated with full-length extracellular wild-type (WT) Pcdh19ECFc (A) and two PCDH19-FE mutants (B,C) imaged after incubation for 1 hr followed by rocking for 2 min in the presence of calcium. Representative images for parallel experiments in the absence of calcium are shown in panels D to F (EDTA). All full-length extracellular domains were produced in HEK293 cells. Bar – 100 µm. (G) Western blot shows efficient production and secretion of both WT and mutant proteins used for bead aggregation assays. Parallel black lines indicate a two-lane gap between samples. (H) Aggregate size for WT and PCDH-FE mutants in the presence (Ca2+) and absence (EDTA) of calcium after 1 hr of incubation followed by rocking for 1 min (R1) and for 2 min (R2). Error bars are standard error of the mean (n = 3 for all aggregation assays and constructs, Figure 3—source data 1). Aggregation is only observed for Pcdh19 WT in the presence of calcium and after rocking (see also Figure 3H). (I) Analytical size exclusion chromatogram traces for WT (green) and mutant (orange and red) Pcdh19 EC1-4 fragments produced in E. coli. A shift in peak elution volumes indicates impaired homophilic interaction for mutants. (J) Schematics of proposed homophilic 'forearm handshake' for the Pcdh19 adhesion complex validated through binding assays with protein carrying PCDH19-FE mutations. See also Figure 4—figure supplement 1–2.
Figure 4—figure supplement 1
PCDH19-FE mutations at Pcdh19-I1 impair bead aggregation even in the presence of N-cadherin.
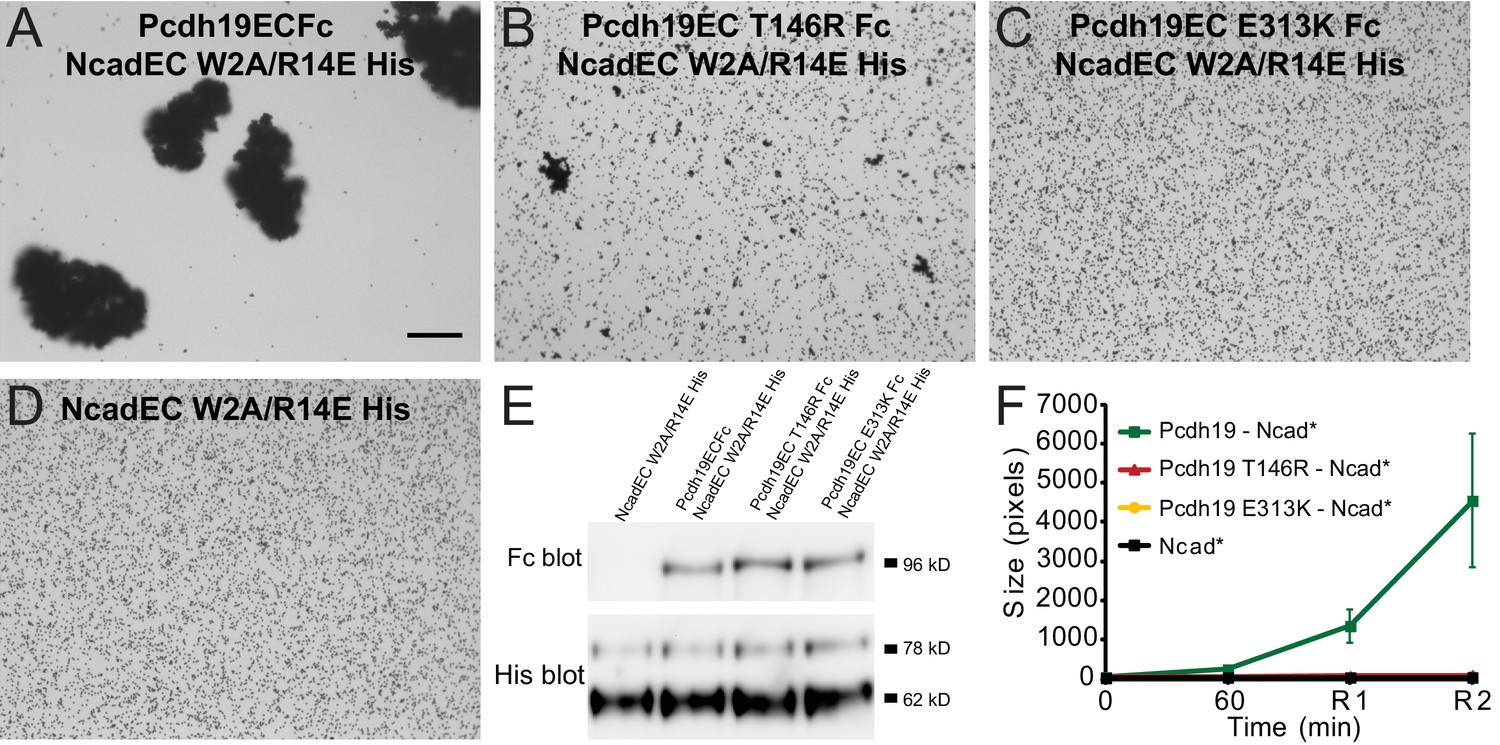
(A–D) Protein G beads allowed to bind protein from cellular media containing NcadEC W2A/R14E His by itself (D), with Pcdh19ECFc (A), or with a PCDH19-FE mutants (B–C) imaged after incubation for 1 hr followed by rocking for 2 min. To test trans interactions mediated by Pcdh19, we used the NcadEC W2A/R14E mutant, which abolishes Ncad-based homophilic adhesion (Harrison et al., 2010; Emond et al., 2011). (E) Western blots show the presence of both Pcdh19ECFc (wild-type and mutant forms) and NcadEC W2A/R14E His in the cellular media used for aggregation assays. (F) Aggregate sizes for NcadEC W2A/R14E His by itself, with Pcdh19ECFc WT, or Pcdh19ECFc mutants after 1 hr incubation followed by rocking for 1 min (R1) and for 2 min (R2). Error bars are standard error of the mean (n = 3 for all aggregation assays). Construct labels with a star (*) are shortened in graph legend.
Figure 4—figure supplement 2
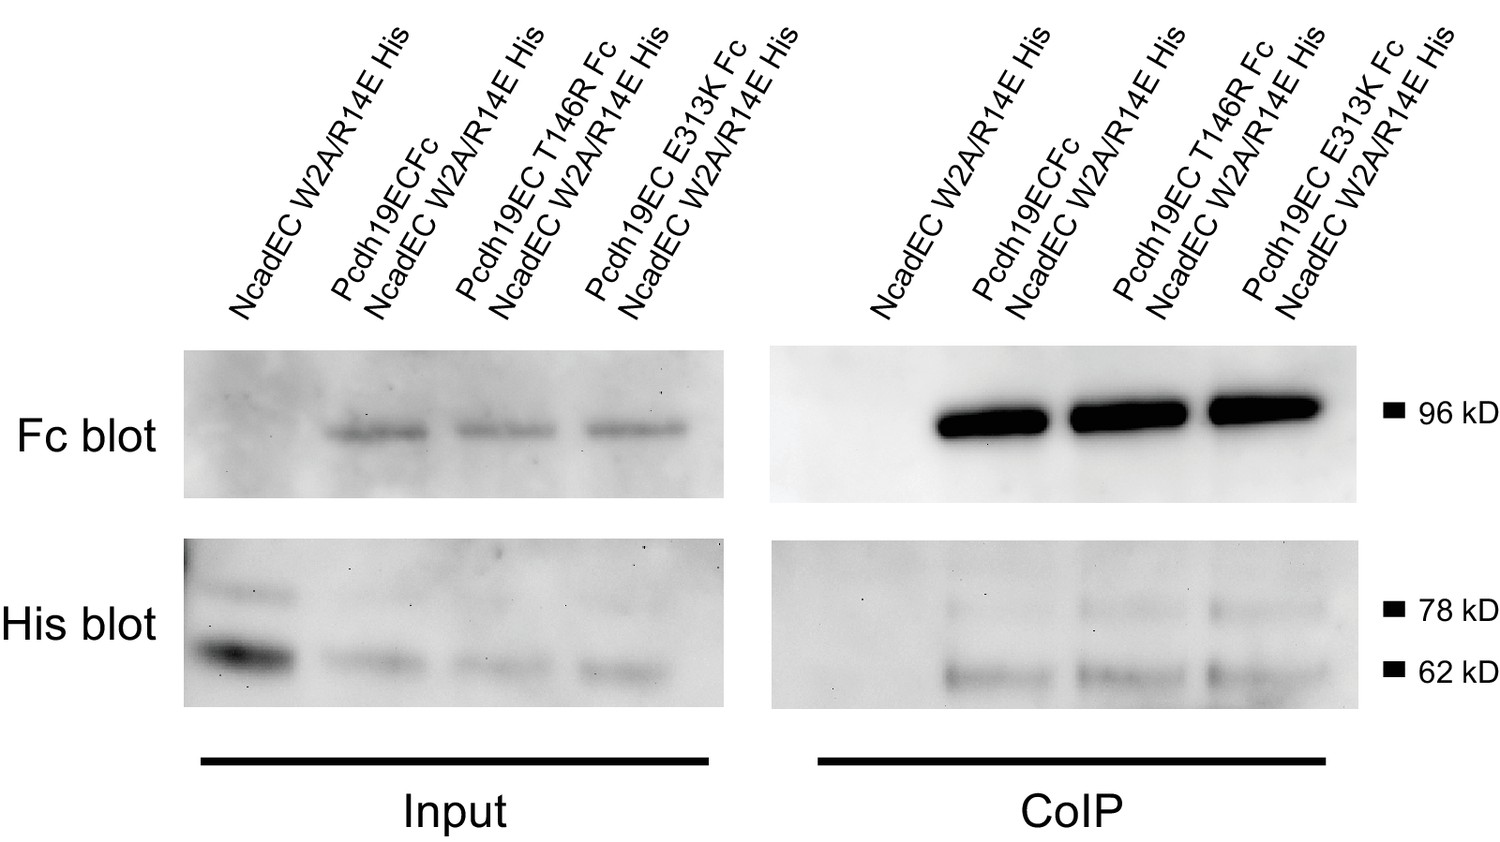
PCDH19-FE mutations at Pcdh19-I1 do not abolish the interaction between the extracellular domains of Pcdh19 and N-cadherin.
Co-immunoprecipitation of Pcdh19ECFc (WT or with PCDH19-FE mutations at Pcdh19-I1) pulls down NcadEC W2A/R14E His. Therefore, the PCDH19-FE mutations at the Pcdh19-I1 interface do not abolish the interaction between Pcdh19 and Ncad extracellular domains.
Figure 5 with 5 supplements
A common binding mechanism with sequence-diverse interfaces for δ and clustered protocadherins.
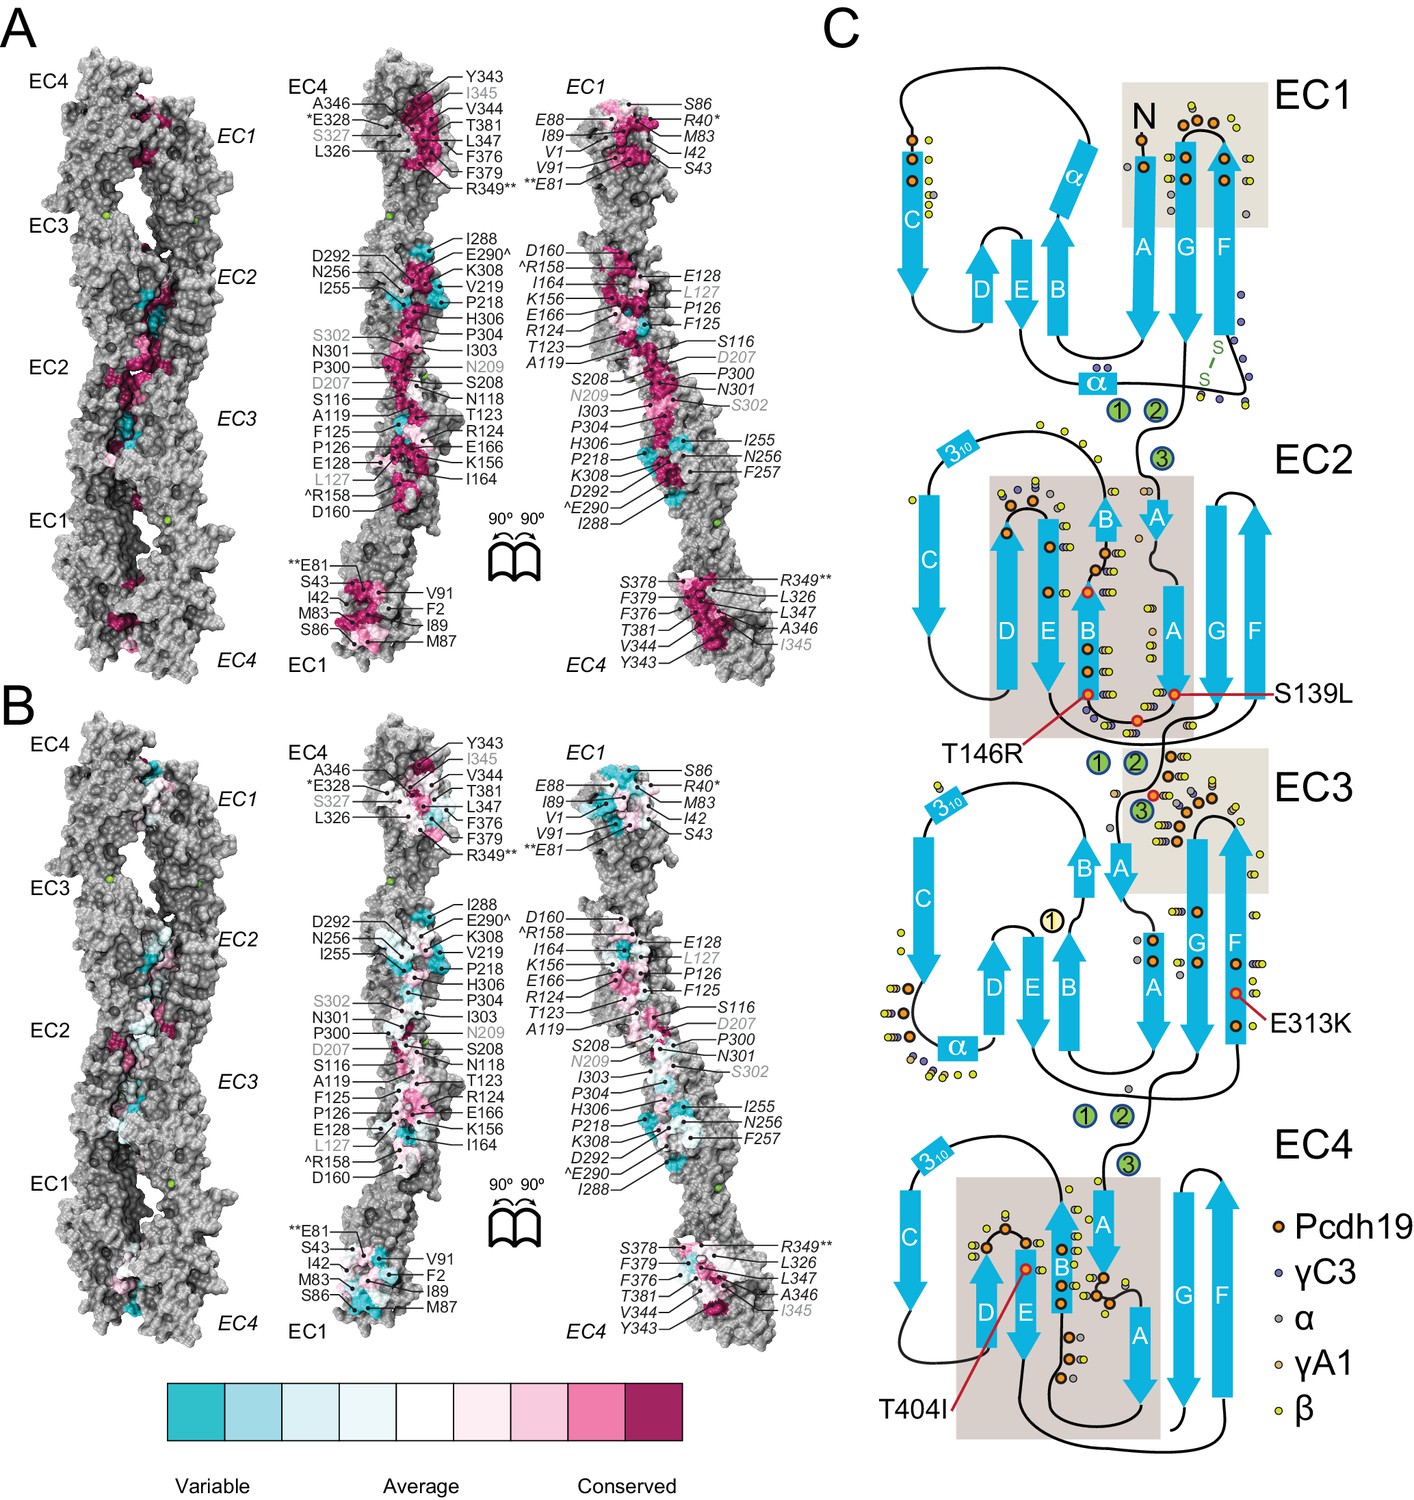
(A) Molecular surface representation of the closed (left) and exposed (right) Pcdh19-I1 antiparallel dimer. Interfacing residues are colored according to sequence conservation among 102 species (Figure 5—figure supplement 2 and Figure 5—source data 1). Most of them are highly conserved. Labels as in Figure 2B. (B) Antiparallel Pcdh19 EC1-4 dimer shown as in (A), with interfacing residues colored by sequence conservation among selected members of the non-clustered δ1- and δ2-protocadherins, as well as selected α, β, and γ clustered protocadherins (Figure 5—figure supplement 3 and Figure 5—source data 2). (C) Location of interfacing residues for Pcdh19, Mm pcdhγC3, Mm pcdhα4 and α7, Mm pcdhγA1, and Mm pcdhβ6 and β8, mapped onto the Pcdh19 topology diagram. Shared structural motifs involved in binding include: The F-G loop along with the beginning of β strands A, G and C in EC1; the A-B loop, most of β strand B, the D-E loop, and the beginning of β strand E in EC2; the EC2-3 linker; the C-D loop, parts of β strands F and G and the F-G loop in EC3; the loop within β strand A, β strand B, and the D-E loop in EC4. Red/orange circles indicate sites mutated in PCDH19-FE. Common contact zones in EC1 and EC3, as well as EC2 and EC4, are highlighted with a brown background. See also Figure 5—figure supplement 1–5.
-
Figure 5—source data 1
Protocadherin-19 sequences.
- https://doi.org/10.7554/eLife.18529.020
-
Figure 5—source data 2
Sequences for selected clustered and δ-protocadherins.
- https://doi.org/10.7554/eLife.18529.021
Figure 5—figure supplement 1
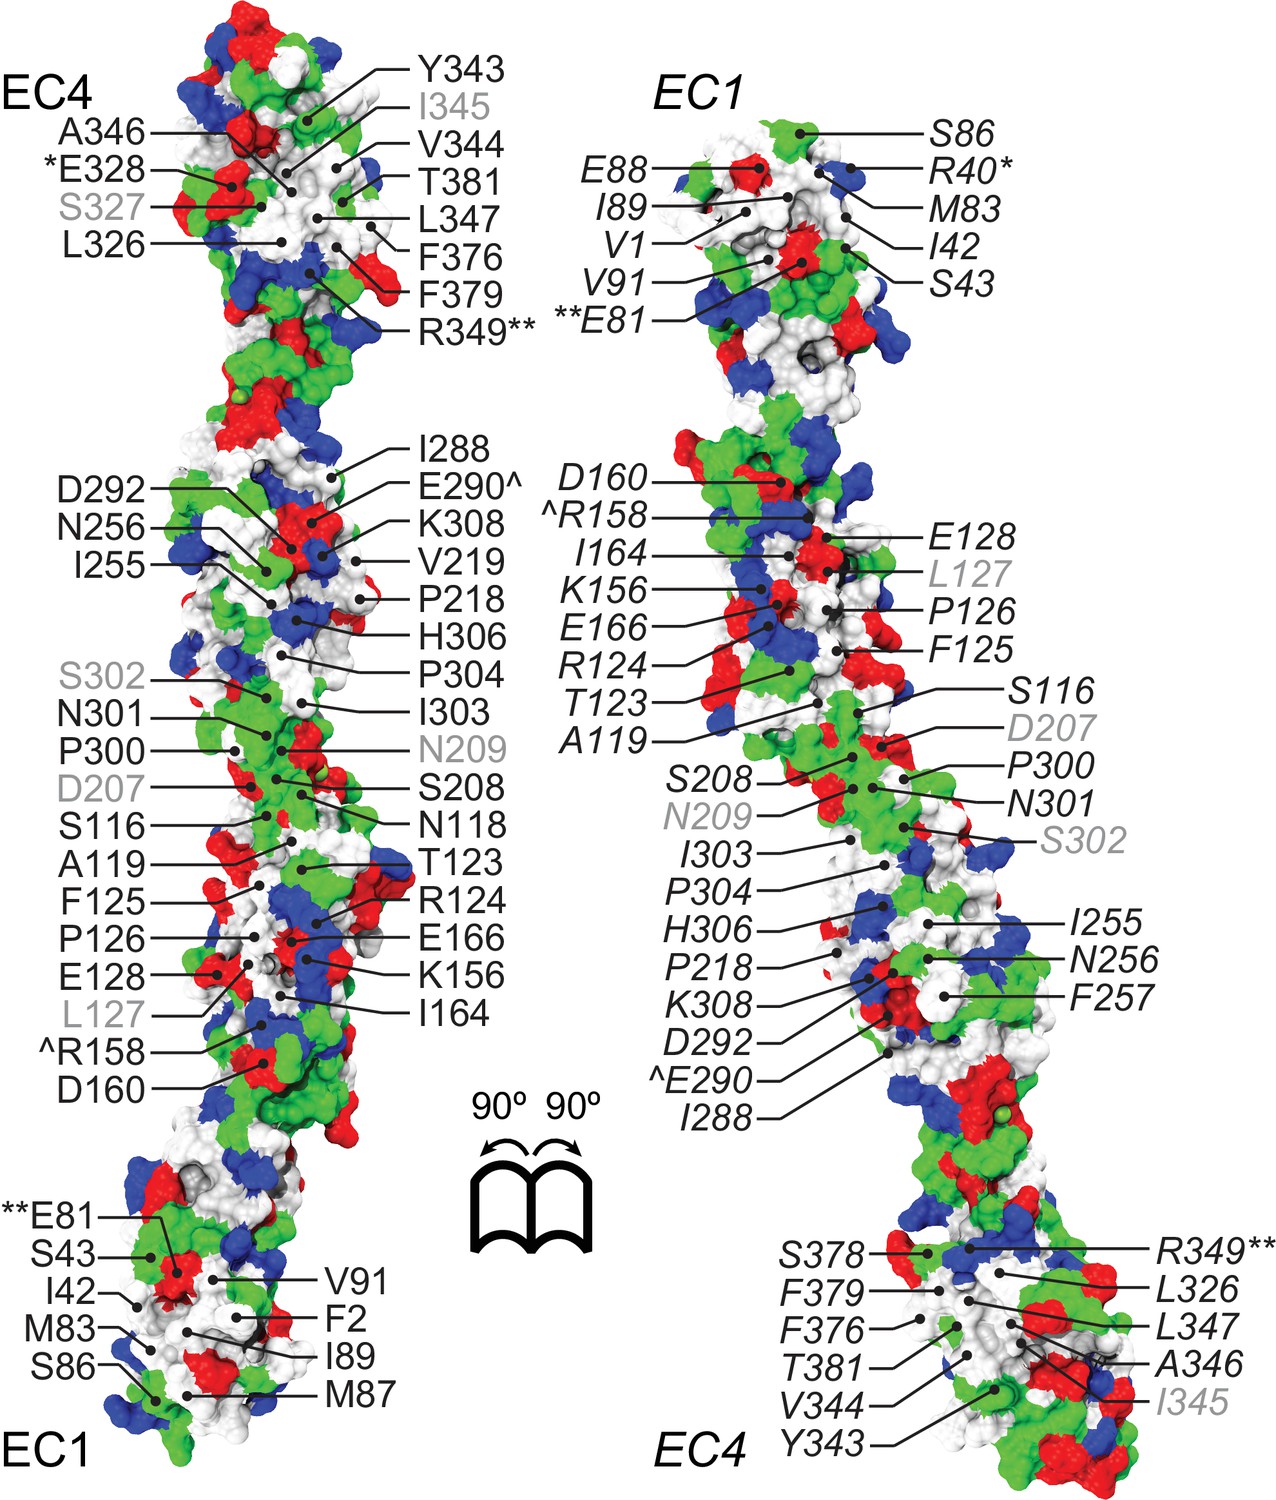
Pcdh19-I1 antiparallel EC1-4 dimer interface involves charged, hydrophilic, and hydrophobic residues.
Molecular surface representation of the Pcdh19-I1 antiparallel dimer with interfacial residues exposed and labeled. Surface is colored according to residue type (apolar: white; polar: green; negatively charged: red; positively charged and histidines: blue). Interfacing residues are labeled as in Figure 2.
Figure 5—figure supplement 2
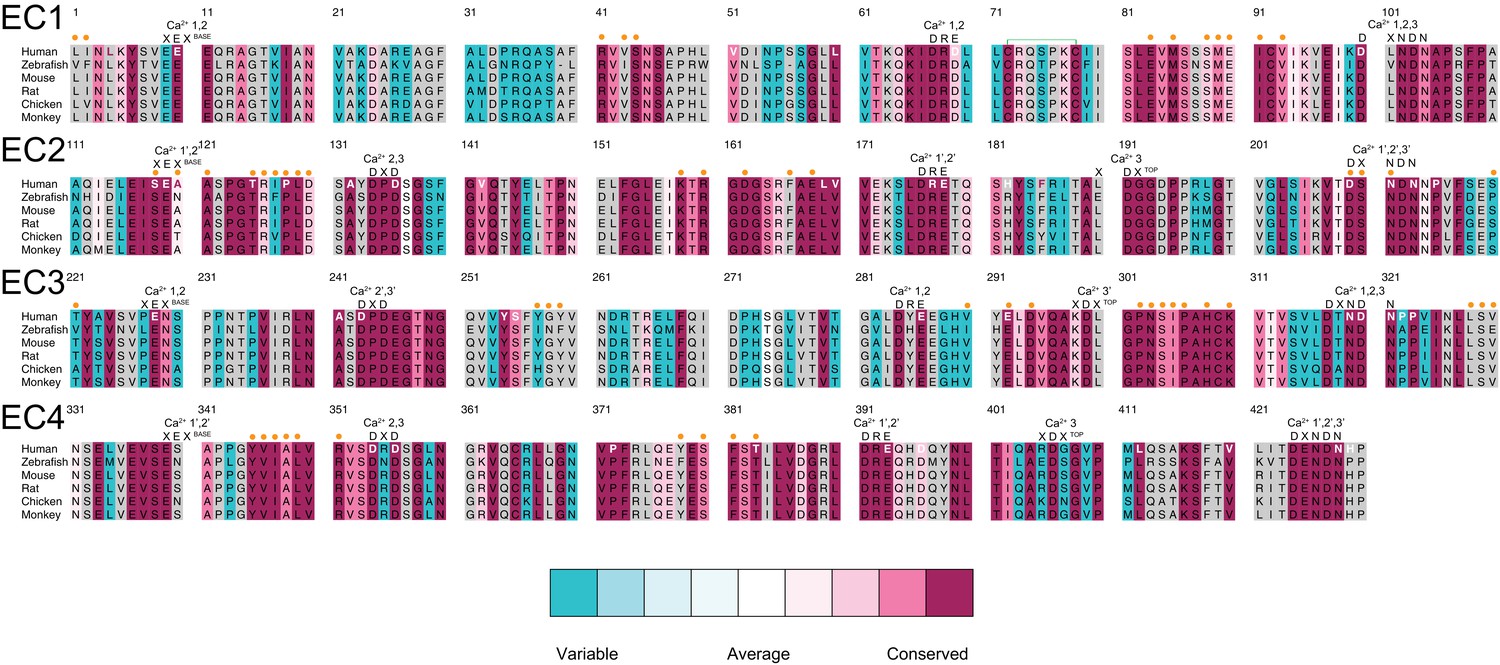
Sequence alignment of Pcdh19 EC1-4.
Alignment of Human, Zebrafish, Mouse, Rat, Chicken, and Monkey sequences for Pcdh19 EC1-4. Residues are colored according to conservation based on ConSurf (Ashkenazy et al., 2016) and an alignment of sequences from 102 species (Figure 5—source data 1; gray indicates insufficient data due to inadequate diversity). Conserved calcium-binding motifs are shown on top of the alignment and labeled. Residues at Pcdh19-I1 are labeled with an orange dot on top of the alignment. Human residues mutated in PCDH19-FE are in bold white or dark red font.
Figure 5—figure supplement 3
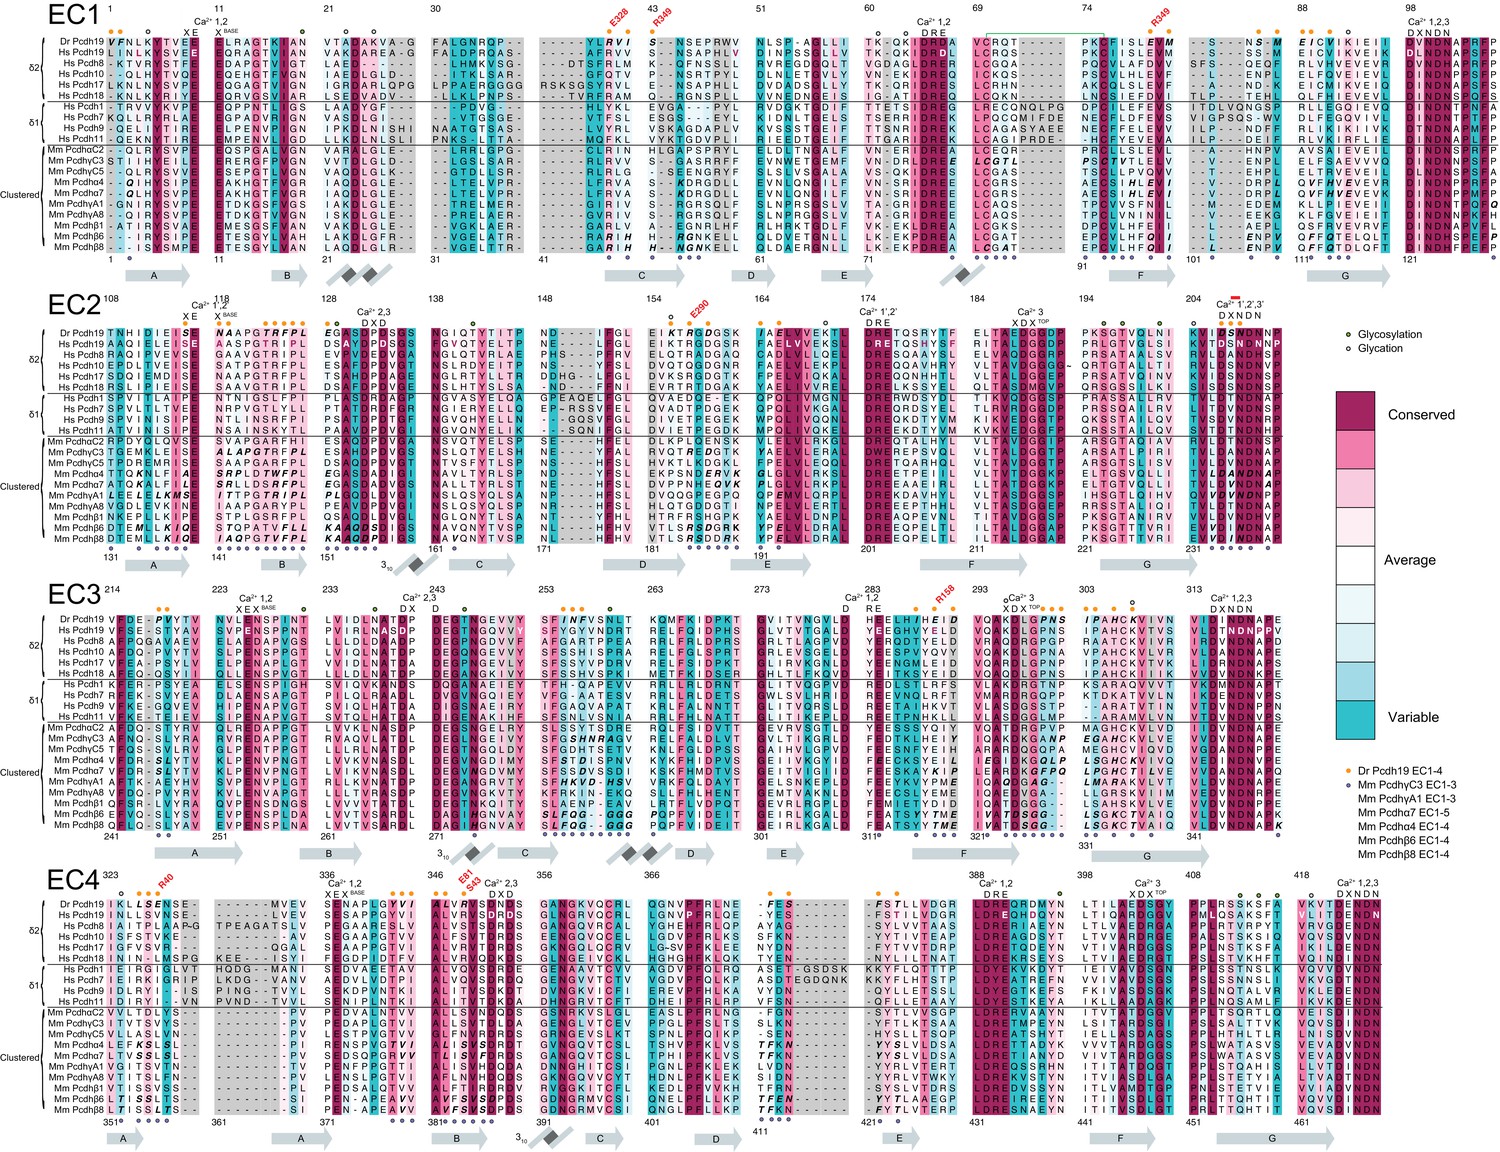
Sequence alignment of selected protocadherins.
Alignment of selected sequences for δ1 and δ2 protocadherins, as well as selected clustered α, β, and γ protocadherins of known structure (Figure 5—source data 2). Residues are colored according to conservation based on ConSurf as in Figure 5—figure supplement 2 Conserved Ca2+-binding motifs are shown on top of the alignment. Residues at Pcdh19-I1 are labeled with an orange dot. Predicted glycosylation and glycation sites are labeled with green and light cyan dots, respectively. Pairs of salt-bridges observed at Pcdh19-I1 are indicated in bold red above the alignment. Human residues mutated in PCDH19-FE are in bold white or dark red font. Residues involved in any of the clustered protocadherin interfaces are labeled with a light blue dot below the alignment, and shown in italic bold. Secondary structure of Pcdh19 EC1-4 is shown in gray below the alignment. Long residue insertions were omitted for clarity in the sequences of pcdh7 EC2 (QEP157 ~209RSS), pcdh8 EC4 (AAP334 ~361GTP), pcdh10 EC2 (GGG192 ~210QRT), and pcdh17 EC4 (VLG377 ~391SVP).
Figure 5—figure supplement 4
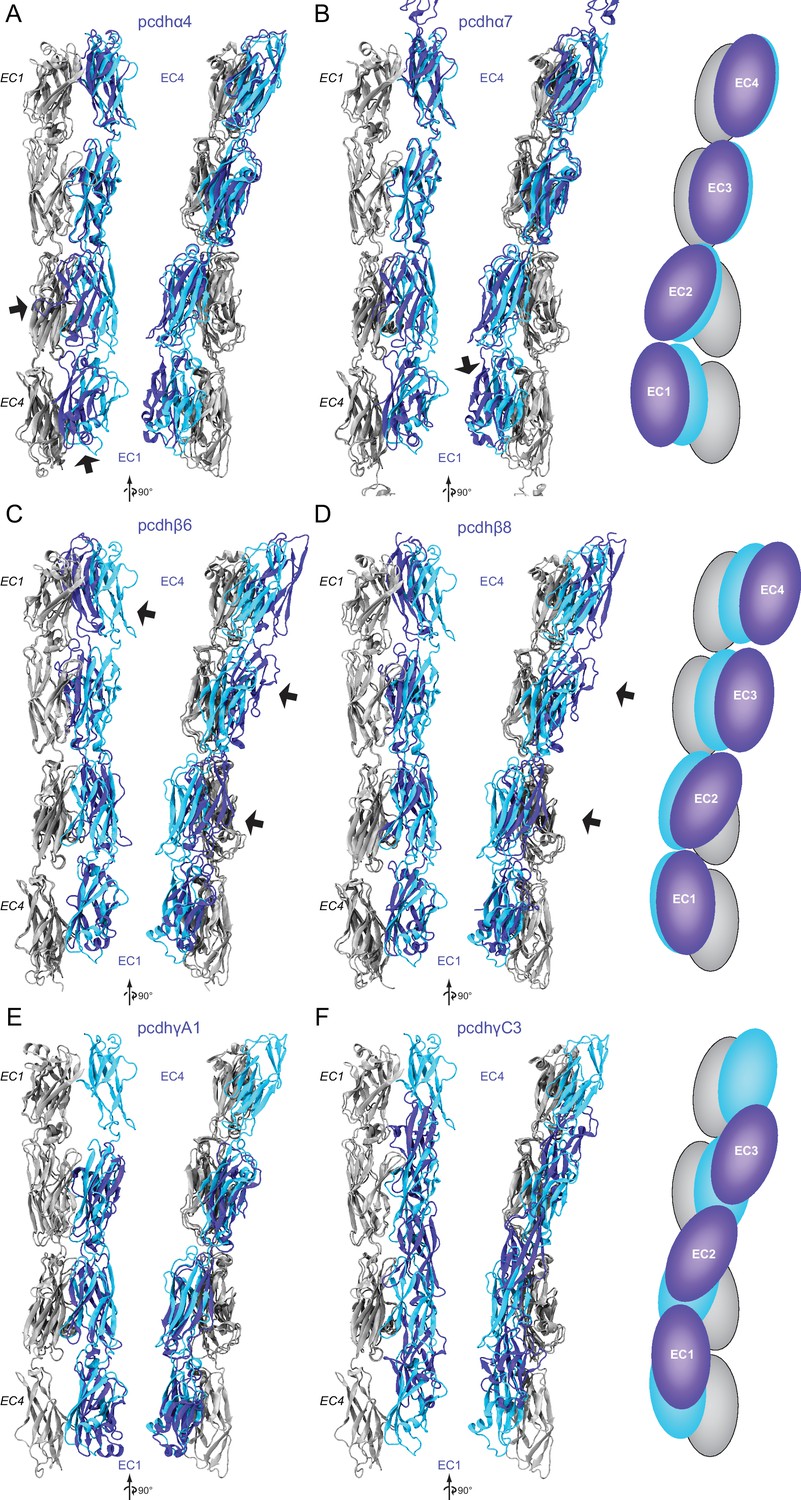
Structural comparison of Pcdh19-I1 EC1-4 dimer to clustered-protocadherin dimers.
(A) Two views of structurally aligned monomers (gray, EC1-EC4) and their partners for Pcdh19 (cyan) and pcdhα4 (blue, 5DZW [Goodman et al., 2016]). Arrows point to regions of significant structural differences. (B) Two views of Pcdh19 and pcdhα7 (5DZV [Goodman et al., 2016]) shown as in (A). The right panel shows schematics highlighting differences in dimer arrangement. (C–F) Structural alignments as in (A–B) for pcdhβ6 (C, 5DZY [Goodman et al., 2016]), pcdhβ8 (D, 5DZX [Goodman et al., 2016]), pcdhγA1 (E, 4ZI9 [Nicoludis et al., 2015]), and pcdhγC3 (F, 4ZI8 [Nicoludis et al., 2015]).
Figure 5—figure supplement 5
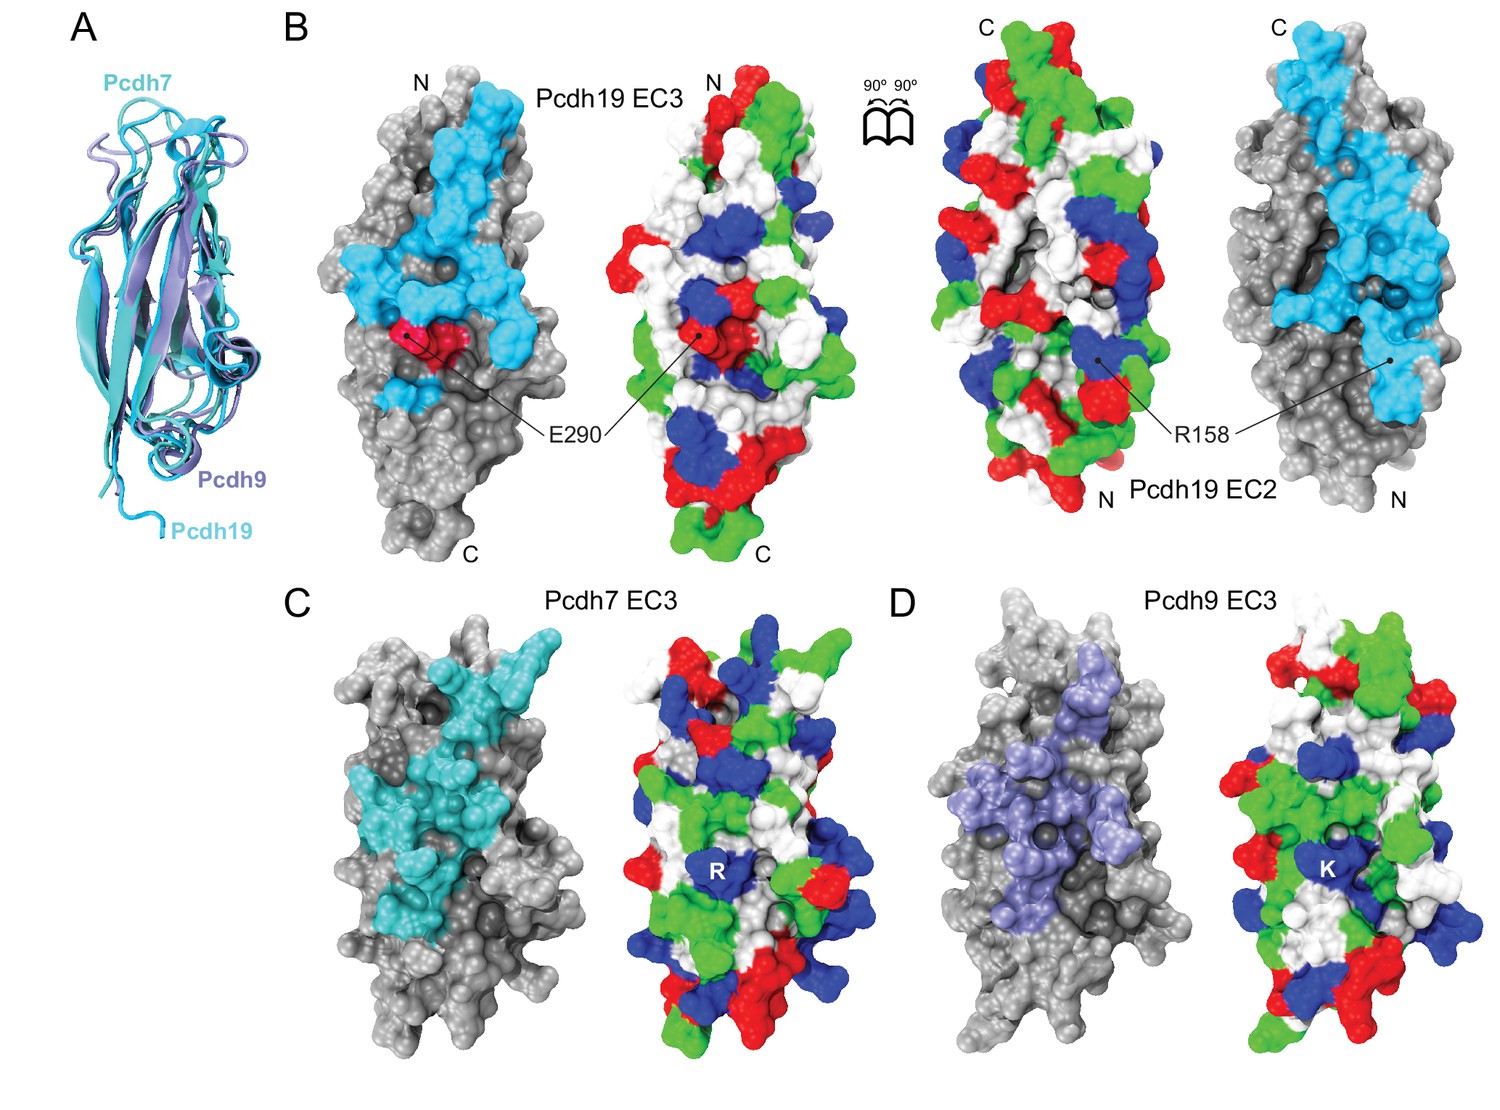
Structural comparison of protocadherin δ1 and δ2 EC3 repeats.
(A) Ribbon representation of EC3 repeats from Pcdh19 (δ2, cyan), pcdh7 (δ1, dark cyan, PDB 2YST), and pcdh9 (δ1, ice blue, PDB 2EE0) structurally aligned to each other. (B) Molecular representation of the Pcdh19 EC3 (left) and EC2 (right) repeats within the Pcdh19-I1 EC1-4 dimer. Interfacing residues are exposed and shown in cyan, with E290 shown in dark red to indicate its involvement in PCDH19-FE. Location of R158, which interacts with E290, is shown in EC2. The surface is also shown colored according to the residue type (apolar: white; polar: green; negatively charged: red; positively charged and histidines: blue). N and C-termini are indicated. (C and D) Molecular surface representations for Pcdh7 EC3 and Pcdh9 EC3, as in (B), with predicted interfacing residues shown in dark cyan and ice blue, respectively. Charges of the E290-R158 pair are predicted to be swapped in Pcdh7 (salt-bridge R-D) and Pcdh9 (salt-bridge K-E; Figure 5—figure supplement 3).
Author response image 1
Tables
Table 1
Statistics for Protocadherin-19 structures.
Data collection | DrPCDH19 EC1-4 | DrPCDH19 EC3-4 |
|---|---|---|
Space group | P21 | C2 |
Unit cell parameters | ||
a, b, c (Å) | 66.390, 59.776, 165.925 | 149.355, 86.631,132.583 |
α, β, γ (°) | 90, 94.39, 90 | 90, 122.13, 90 |
Molecules per asymmetric unit | 2 | 4 |
Beam source | MicroMax-003 | APS 24-ID-C |
Date of data collection | 12-DEC-14 | 31-OCT-14 |
Wavelength (Å) | 1.54187 | 0.97920 |
Resolution (Å) | 50.00–3.59 (3.66–3.59) | 50.00–2.51 (2.55–2.51) |
Unique reflections | 15416 | 47847 |
Completeness (%) | 94.8 (86.0) | 98.0 (88.1) |
Redundancy | 2.7 (2.4) | 4.4 (3.2) |
I / σ(I) | 4.90 (2.10) | 16.59 (2.21) |
Rmerge | 0.182 (0.386) | 0.072 (0.591) |
Rmeas | 0.224 (0.480) | 0.081 (0.690) |
Rpim | 0.129 (0.281) | 0.037 (0.348) |
CC1/2 | 0.833 (0.774) | 0.964 (0.792) |
CC* | 0.966 (0.934) | 0.991 (0.940) |
Refinement | ||
Resolution range (Å) | 50.00–3.59 (3.68–3.59) | 50.00–2.51 (2.58–2.51) |
Rwork (%) | 24.6 (41.3) | 18.8 (38.3) |
Rfree (%) | 30.5 (45.2) | 23.9 (41.6) |
Protein Residues | 839 | 827 |
Ligands/ions | 20 | 16 |
Water molecules | 15 | 49 |
Rms deviations | ||
Bond lengths (Å) | 0.0094 | 0.0112 |
Bond angles (°) | 1.4661 | 1.3915 |
B-factor average | ||
Protein | 90.75 | 77.93 |
Ligand/ion | 57.01 | 55.32 |
Water | 45.40 | 60.92 |
Ramachandran plot region (PROCHECK) | ||
Most favored (%) | 78.6 | 85.6 |
Additionally allowed (%) | 20.4 | 13.5 |
Generously allowed (%) | 1.1 | 1.0 |
Disallowed (%) | 0.0 | 0.0 |
PDB ID code | 5IU9 | 5CO1 |
Download links
A two-part list of links to download the article, or parts of the article, in various formats.
Downloads (link to download the article as PDF)
Open citations (links to open the citations from this article in various online reference manager services)
Cite this article (links to download the citations from this article in formats compatible with various reference manager tools)
Structural determinants of adhesion by Protocadherin-19 and implications for its role in epilepsy
eLife 5:e18529.
https://doi.org/10.7554/eLife.18529


