Interneuronal mechanisms of hippocampal theta oscillations in a full-scale model of the rodent CA1 circuit
- University of California, Irvine, United States
- Stanford University, United States
Figures
Figure 1 with 2 supplements
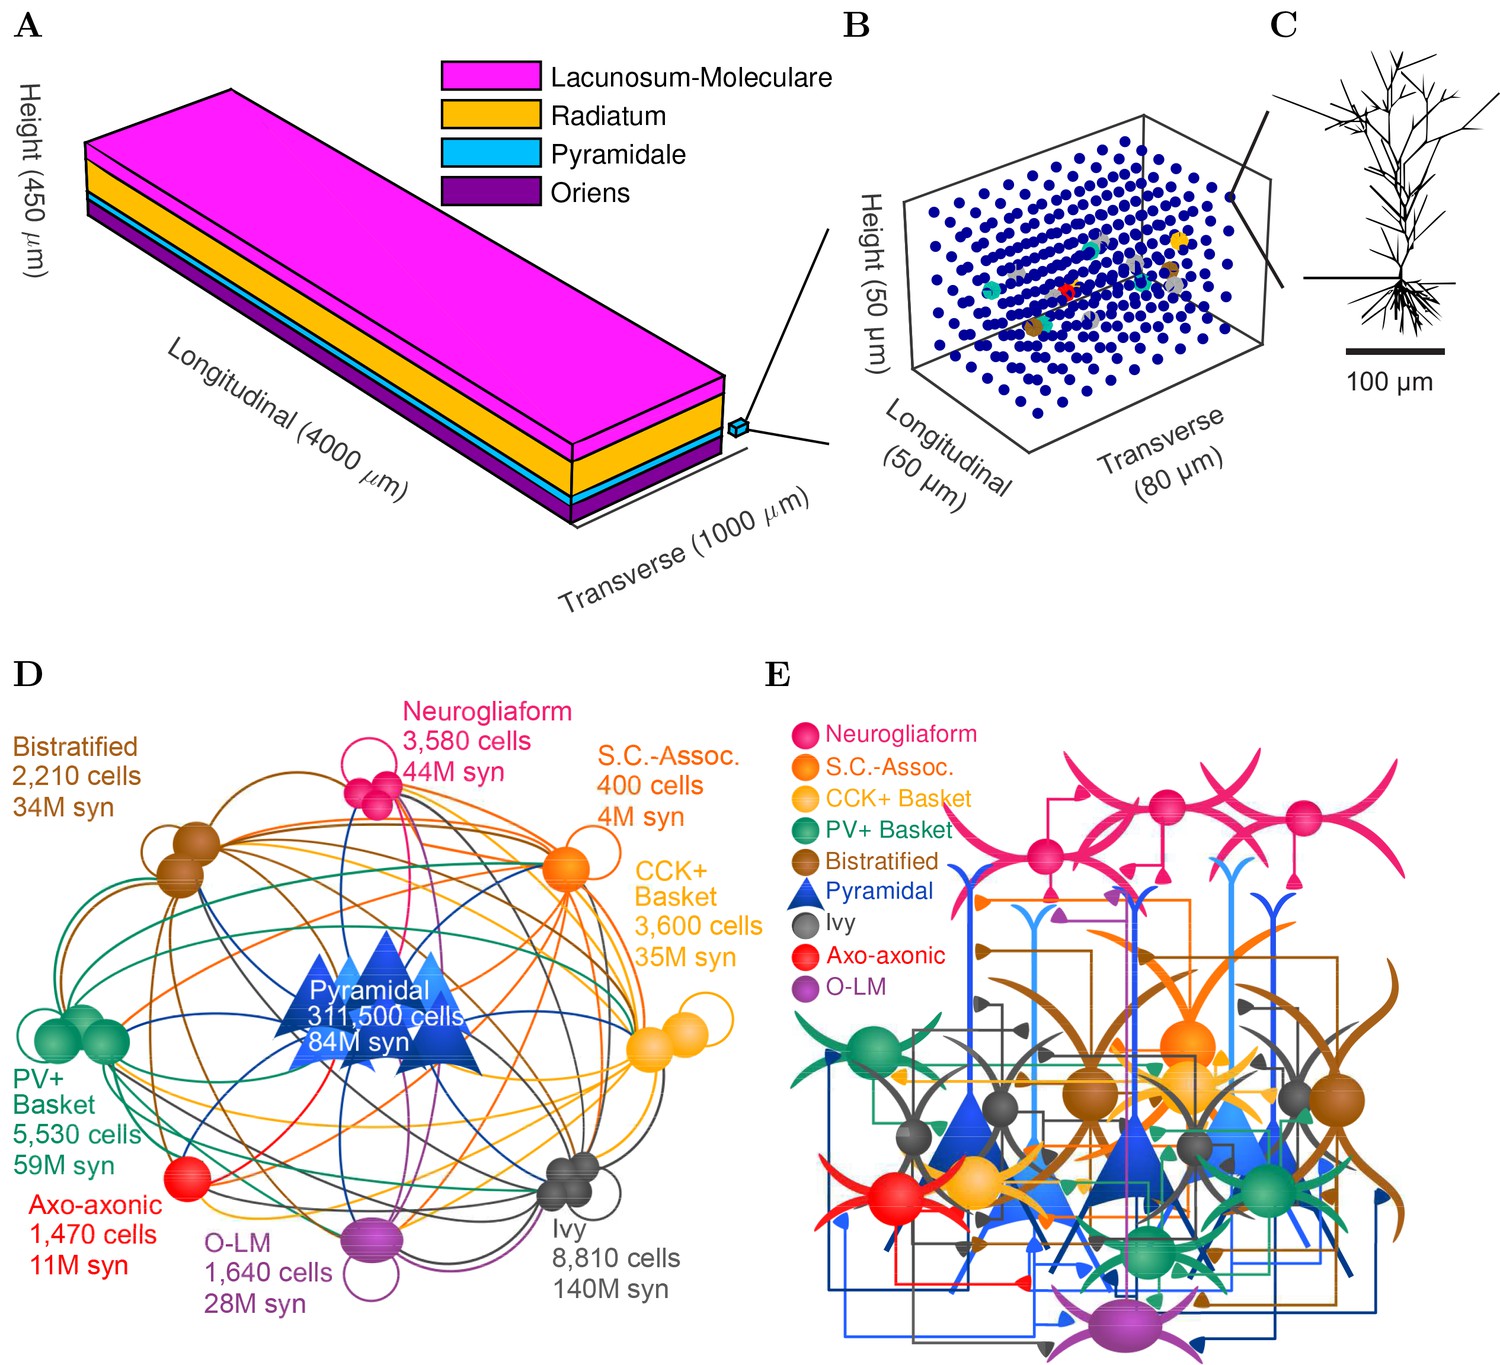
CA1 network connectivity.
(A) The model network is arranged in a layered prism with the lengths of each dimension similar to the actual dimensions of the CA1 region and its layers. (B) The model cell somata within a small chunk of stratum pyramidale (as depicted in A) are plotted to show the regular distribution of model cells throughout the layer in which they are found. (C) Each pyramidal cell in the network has detailed morphology with realistic incoming synapse placement along the dendrites and soma. (D,E) Diagrams illustrate connectivity between types of cells. (D) The network includes one principal cell type (pyramidal cells) and eight interneuron types. Cell types that may connect are linked by a line colored according to the presynaptic cell type. Most cell types can connect to most other cell types. Total number of cells of each type are displayed, as are the number of local output synapses (boutons) from all cells of each type. (E) The number, position, and cell types of each connection are biologically constrained, as are the numbers and positions of the cells. See Figure 1—figure supplement 1) for details about the convergence onto each cell type. Also see Table 1 and Figure 1—figure supplement 2 for information about the cell-type combinations of the 5 billion connections and the axonal distributions followed by each cell type, as well as detailed connectivity results at http://doi.org/10.6080/K05H7D60.
Figure 1—figure supplement 1
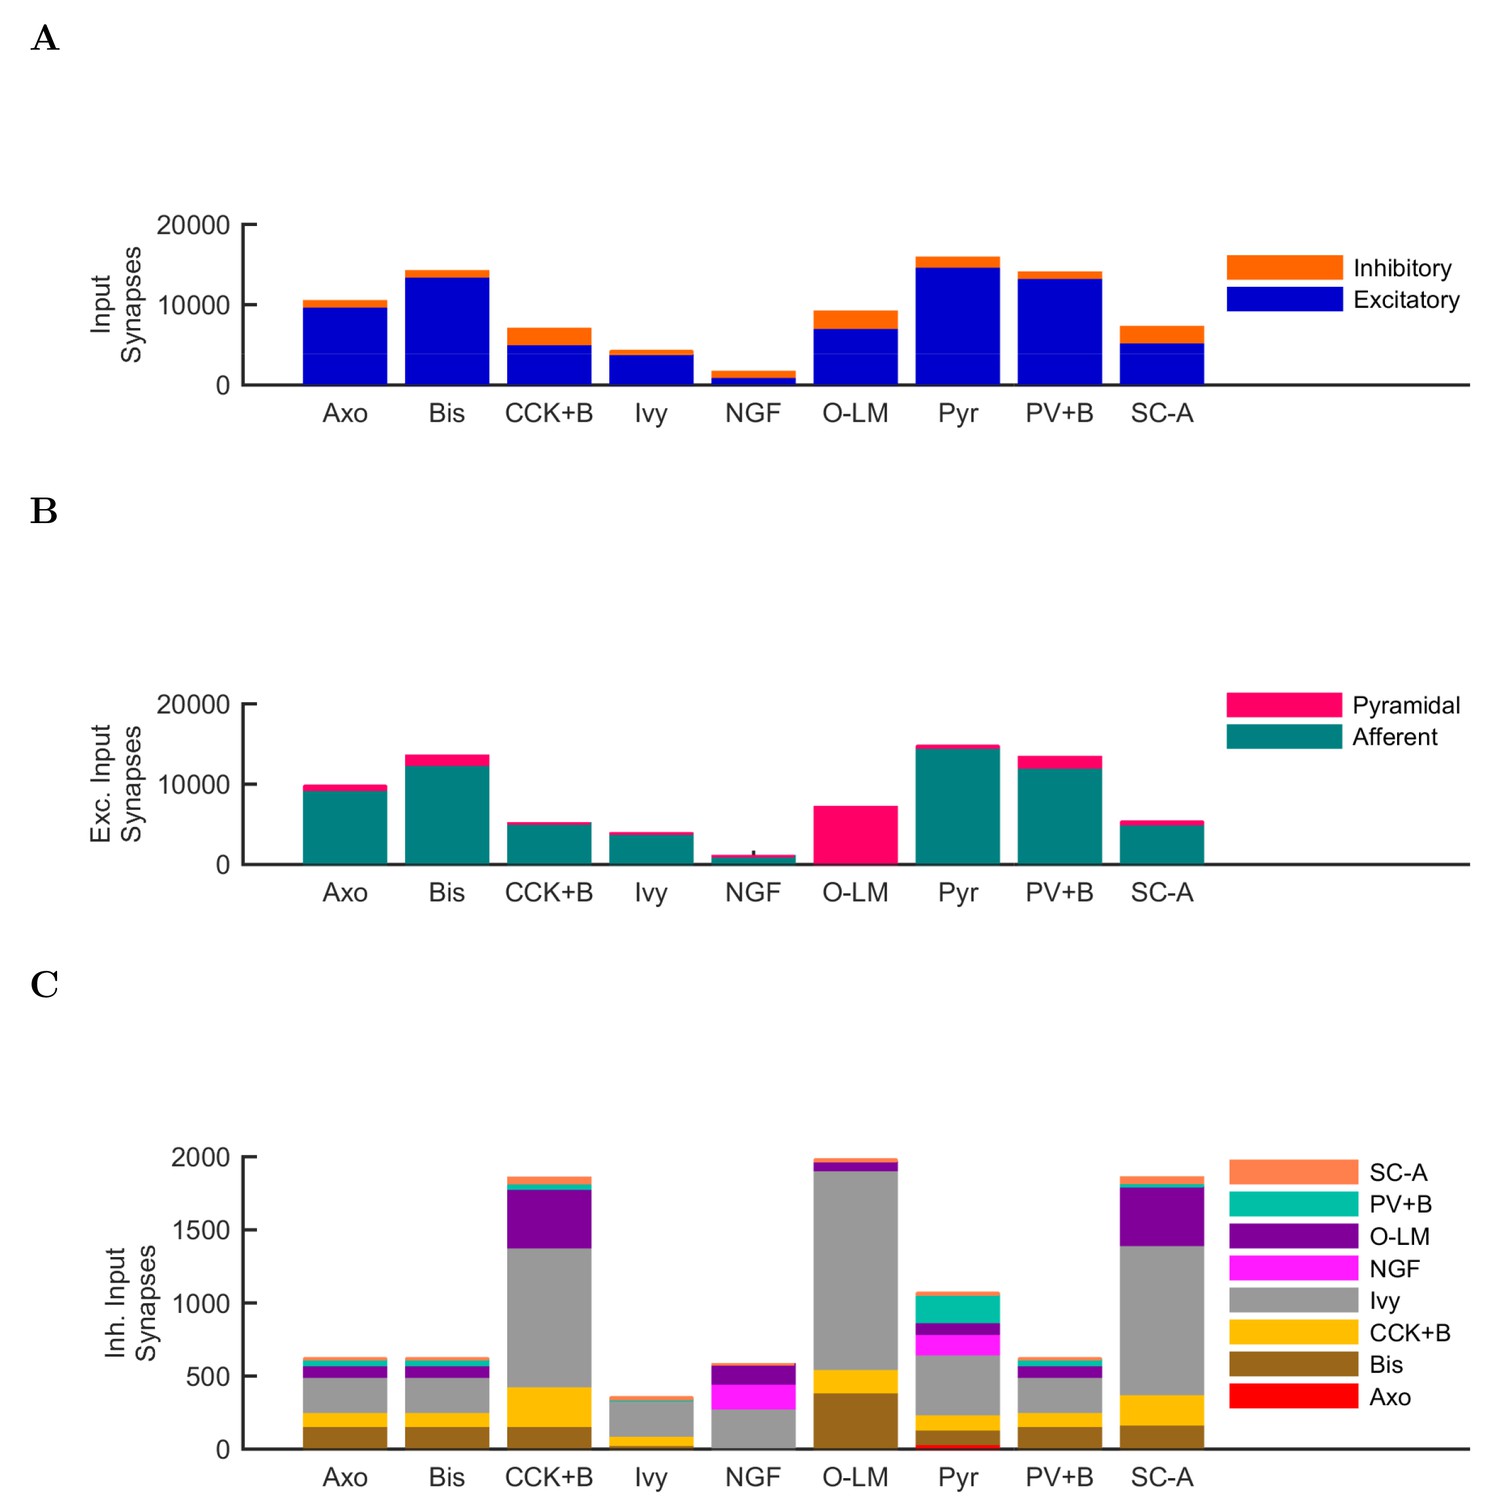
Quantitative network connectivity.
The average number of incoming synapses per postsynaptic cell of the given type are shown for (A) all inputs to the cells, (B) all excitatory inputs to the cells and (C) all inhibitory inputs to the cells.
Figure 1—figure supplement 2

Anatomically constrained connectivity.
The axonal distributions are shown per presynaptic cell type. The distribution of boutons is plotted as a function of distance from the presynaptic cell’s soma. Boutons connecting to all possible types of postsynaptic cells are included in the plot. The colors correspond to each presynaptic cell type using the same color code as previous figures.
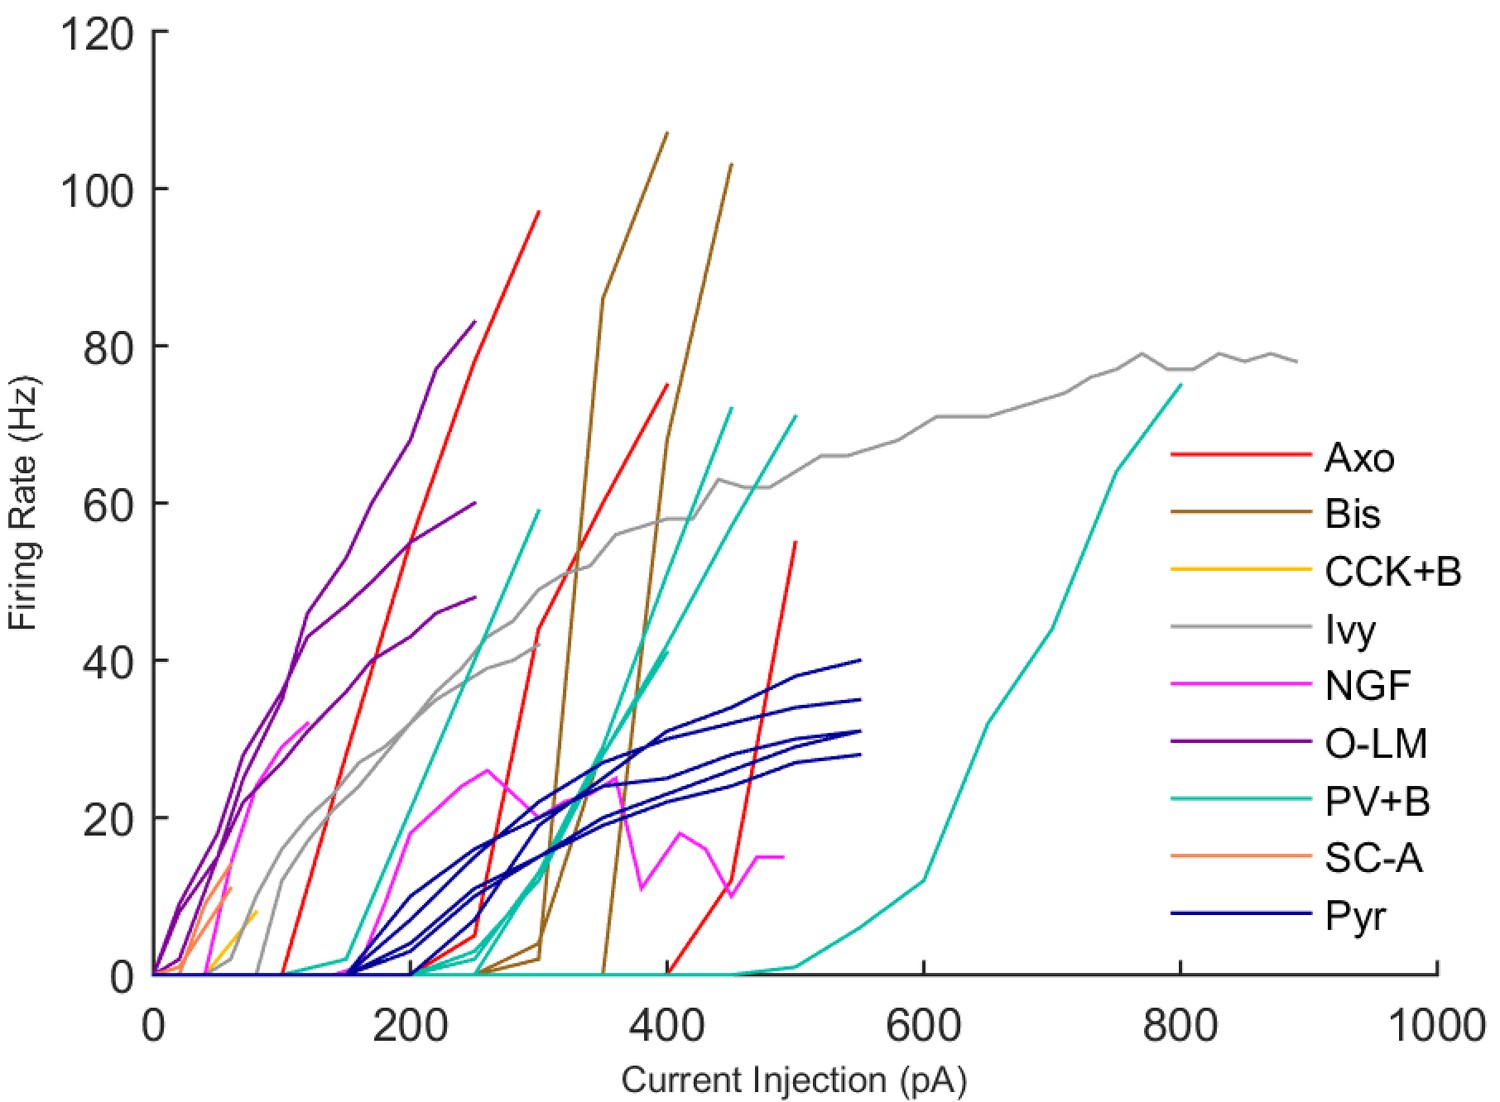
Figure 2
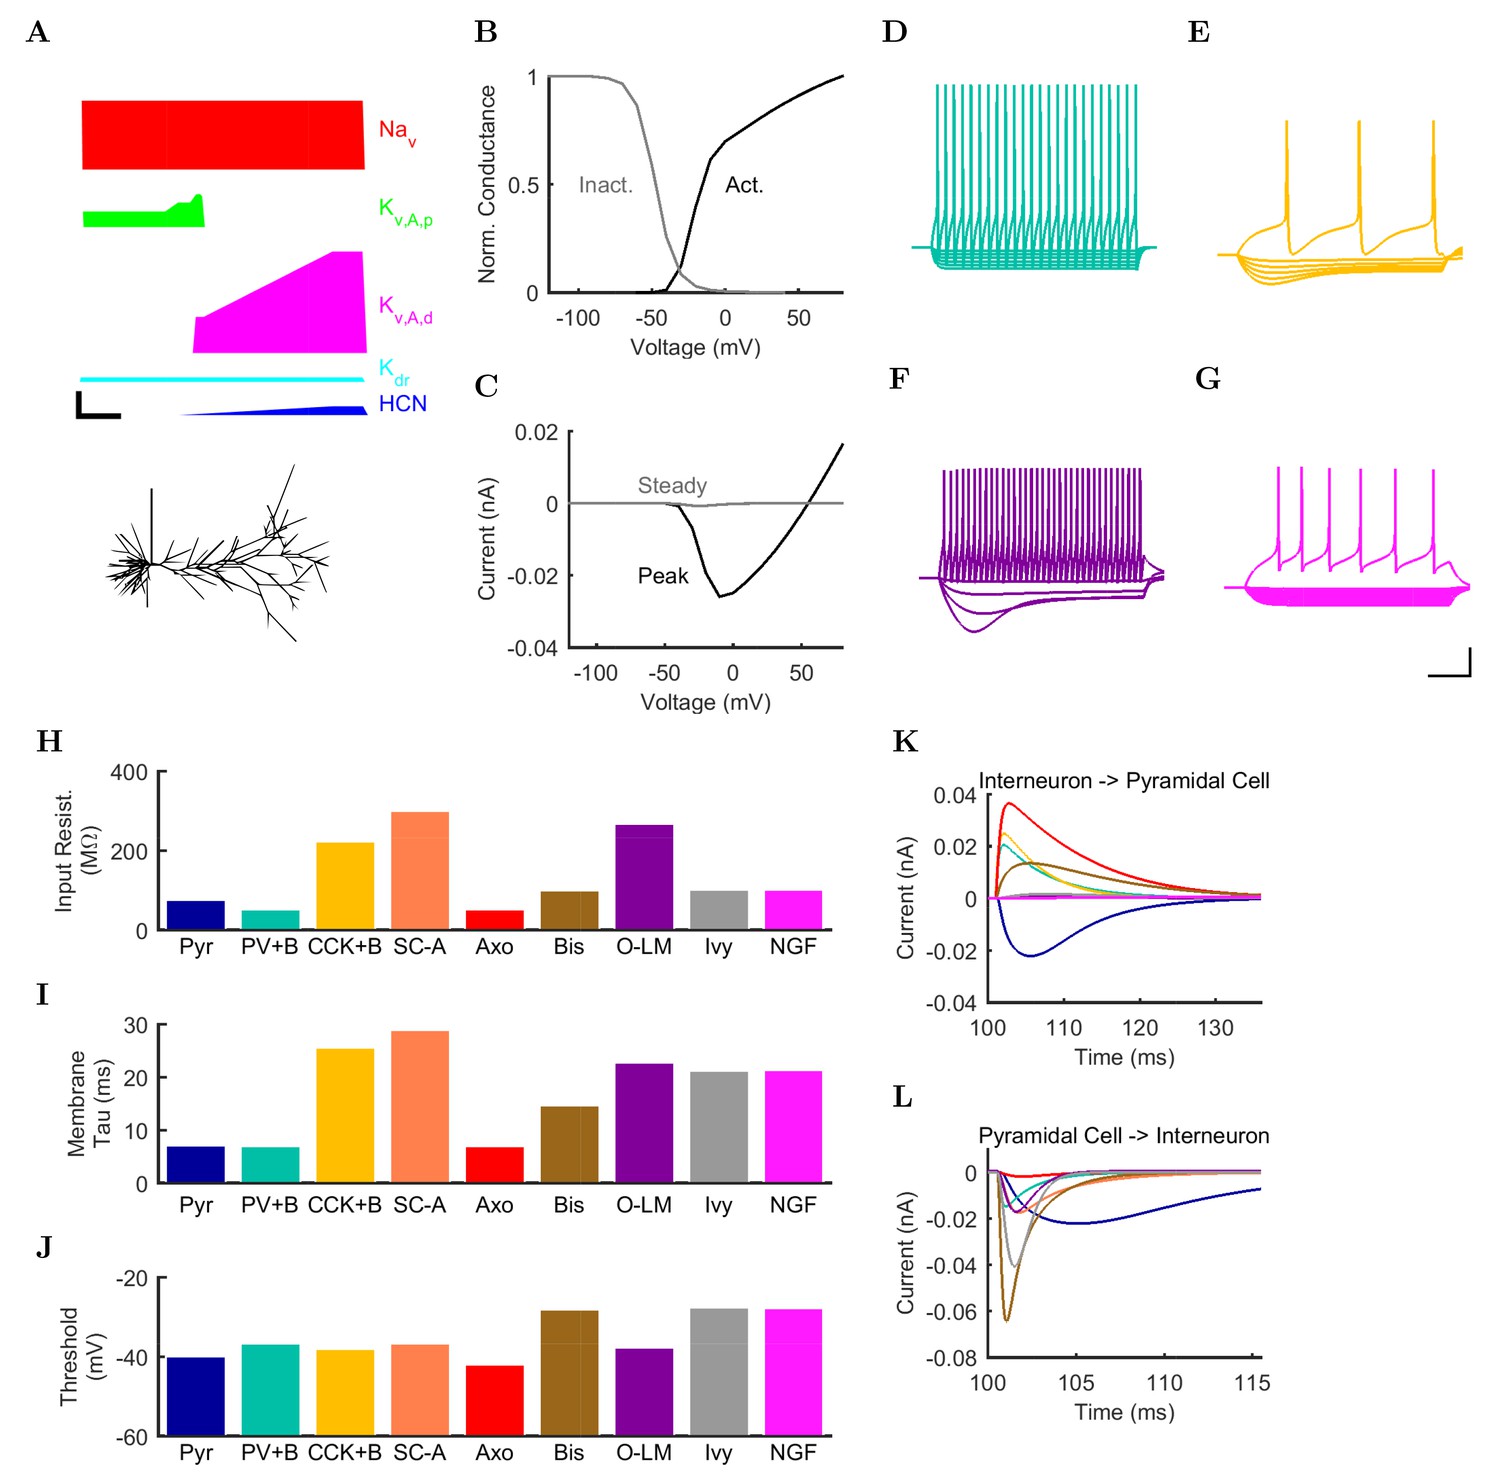
Electrophysiology of the model network components.
(A) Ion channel densities vary as a function of location (top) in the morphologically detailed pyramidal cell model (bottom; adapted from Poolos et al., 2002). Scale bar: 100 m and 0.01 F/cm. (B–C) The sodium channel found in the pyramidal cell soma is characterized in terms of (B) the activation/inactivation curves and (C) the current-voltage relation at peak (transient) current and steady state. (D–G) Current sweeps are shown for four model cell types: (D) PV+ basket cell, (E) CCK+ basket cell, (F) O-LM cell, and (G) neurogliaform cell. Scale bar: 100 ms and 20 mV. (H–J) Electrophysiological properties for each cell type, including (H) input resistance, (I) membrane time constant, and (J) action potential threshold. (K–L) Pyramidal cell synaptic connections are characterized as post-synaptic currents with the postsynaptic cell voltage clamped at −50 mV; (K) synapses made onto the pyramidal cell from all other cell types and (L) synapses made by the pyramidal cell onto all network cell types. Cells represented by same colors as in Figure 1. Source Data available for electrophysiological characterizations shown here. Additional details available in the Methods, Table 3, and the Appendix.
-
Figure 2—source data 1
Model sodium channel activation.
The ion channel characterized in this figure was an Na channel, inserted into a single compartment cell of diameter and length 16.8 microns (a soma) with a density such that the maximum, macroscopic conductance was 0.001 S/cm2. The reversal potential of the channel was + 55 mV and the settings during the characterization protocol were: temperature = 34 degrees Celsius, axial resistance = 210 ohm*cm, [Ca2+]internal=5.0000e-06 mM, specific membrane capacitance = 1 F/cm2. For activation steps, the cell was held at −120 mV and then stepped to potential levels ranging from −90 mV to + 90 mV. For inactivation steps, the cell was held at various potential levels ranging from −90 mV to + 40 mV for 500 ms and then stepped to + 20 mV. Each current injection step is recorded in three columns, where t: time (ms), i: injection (nA), g: conductance (S/cm). The column labels are followed by the voltage (hold or step, according to the file), with activation steps being recorded in the Na_Channel_Step.dat and inactivation steps being recorded in the Na_Channel_Hold.dat file.
- https://doi.org/10.7554/eLife.18566.006
-
Figure 2—source data 2
Model sodium channel inactivation.
The ion channel characterized in this figure was an Na channel, inserted into a single compartment cell of diameter and length 16.8 microns (a soma) with a density such that the maximum, macroscopic conductance was .001 S/cm2. The reversal potential of the channel was + 55 mV and the settings during the characterization protocol were: temperature = 34 degrees Celsius, axial resistance = 210 ohm*cm, [Ca2+]=5.0000e-06 mM, specific membrane capacitance = 1 F/cm2. For activation steps, the cell was held at −120 mV and then stepped to potential levels ranging from −90 mV to +90 mV. For inactivation steps, the cell was held at various potential levels ranging from −90 mV to +40 mV for 500 ms and then stepped to +20 mV. Each current injection step is recorded in three columns, where t: time (ms), i: injection (nA), g: conductance (S/cm). The column labels are followed by the voltage (hold or step, according to the file), with activation steps being recorded in the Na_Channel_Step.dat and inactivation steps being recorded in the Na_Channel_Hold.dat file.
- https://doi.org/10.7554/eLife.18566.007
-
Figure 2—source data 3
Model axo-axonic cell current injection sweep.
Simulated current injection sweep in AxoClamp ATF (tab-delimited) file format.
- https://doi.org/10.7554/eLife.18566.008
-
Figure 2—source data 4
Model bistratified cell current injection sweep.
Simulated current injection sweep in AxoClamp ATF (tab-delimited) file format.
- https://doi.org/10.7554/eLife.18566.009
-
Figure 2—source data 5
Model CCK+ basket cell current injection sweep.
Simulated current injection sweep in AxoClamp ATF (tab-delimited) file format.
- https://doi.org/10.7554/eLife.18566.010
-
Figure 2—source data 6
Model ivy cell current injection sweep.
Simulated current injection sweep in AxoClamp ATF (tab-delimited) file format.
- https://doi.org/10.7554/eLife.18566.011
-
Figure 2—source data 7
Model neurogliaform cell current injection sweep.
Simulated current injection sweep in AxoClamp ATF (tab-delimited) file format.
- https://doi.org/10.7554/eLife.18566.012
-
Figure 2—source data 8
Model O-LM cell current injection sweep.
Simulated current injection sweep in AxoClamp ATF (tab-delimited) file format.
- https://doi.org/10.7554/eLife.18566.013
-
Figure 2—source data 9
Model PV+ basket cell current injection sweep.
Simulated current injection sweep in AxoClamp ATF (tab-delimited) file format.
- https://doi.org/10.7554/eLife.18566.014
-
Figure 2—source data 10
Model pyramidal cell current injection sweep.
Simulated current injection sweep in AxoClamp ATF (tab-delimited) file format.
- https://doi.org/10.7554/eLife.18566.015
-
Figure 2—source data 11
Model Schaffer Collateral-Associated cell current injection sweep.
Simulated current injection sweep in AxoClamp ATF (tab-delimited) file format.
- https://doi.org/10.7554/eLife.18566.016
-
Figure 2—source data 12
Model paired recording of an Axo-axonic cell to Pyramidal cell connection.
Simulated paired recordings where the postsynaptic cell was voltage-clamped at −50 mV and the reversal potential of the synapse was kept at its physiological potential, as defined in the network model code. Sodium channels in the postsynaptic cell were blocked to prevent a suprathreshold response. A spike was triggered in the presynaptic cell and the current response was measured in the postsynaptic cell at the soma. This recording was repeated 10 times, with a randomly chosen connection location (from anatomically likely locations) each time. Each of the 10 trials are included in this file.
- https://doi.org/10.7554/eLife.18566.017
-
Figure 2—source data 13
Model paired recording of a Bistratified cell to Pyramidal cell connection.
Simulated paired recordings where the postsynaptic cell was voltage-clamped at −50 mV and the reversal potential of the synapse was kept at its physiological potential, as defined in the network model code. Sodium channels in the postsynaptic cell were blocked to prevent a suprathreshold response. A spike was triggered in the presynaptic cell and the current response was measured in the postsynaptic cell at the soma. This recording was repeated 10 times, with a randomly chosen connection location (from anatomically likely locations) each time. Each of the 10 trials are included in this file.
- https://doi.org/10.7554/eLife.18566.018
-
Figure 2—source data 14
Model paired recording of a CA3 cell to Pyramidal cell connection.
Simulated paired recordings where the postsynaptic cell was voltage-clamped at −50 mV and the reversal potential of the synapse was kept at its physiological potential, as defined in the network model code. Sodium channels in the postsynaptic cell were blocked to prevent a suprathreshold response. A spike was triggered in the presynaptic cell and the current response was measured in the postsynaptic cell at the soma. This recording was repeated 10 times, with a randomly chosen connection location (from anatomically likely locations) each time. Each of the 10 trials are included in this file.
- https://doi.org/10.7554/eLife.18566.019
-
Figure 2—source data 15
Model paired recording of a CCK+ basket cell to Pyramidal cell connection.
Simulated paired recordings where the postsynaptic cell was voltage-clamped at −50 mV and the reversal potential of the synapse was kept at its physiological potential, as defined in the network model code. Sodium channels in the postsynaptic cell were blocked to prevent a suprathreshold response. A spike was triggered in the presynaptic cell and the current response was measured in the postsynaptic cell at the soma. This recording was repeated 10 times, with a randomly chosen connection location (from anatomically likely locations) each time. Each of the 10 trials are included in this file.
- https://doi.org/10.7554/eLife.18566.020
-
Figure 2—source data 16
Model paired recording of an ECIII cell to Pyramidal cell connection.
Simulated paired recordings where the postsynaptic cell was voltage-clamped at −50 mV and the reversal potential of the synapse was kept at its physiological potential, as defined in the network model code. Sodium channels in the postsynaptic cell were blocked to prevent a suprathreshold response. A spike was triggered in the presynaptic cell and the current response was measured in the postsynaptic cell at the soma. This recording was repeated 10 times, with a randomly chosen connection location (from anatomically likely locations) each time. Each of the 10 trials are included in this file.
- https://doi.org/10.7554/eLife.18566.021
-
Figure 2—source data 17
Model paired recording of an Ivy cell to Pyramidal cell connection.
Simulated paired recordings where the postsynaptic cell was voltage-clamped at −50 mV and the reversal potential of the synapse was kept at its physiological potential, as defined in the network model code. Sodium channels in the postsynaptic cell were blocked to prevent a suprathreshold response. A spike was triggered in the presynaptic cell and the current response was measured in the postsynaptic cell at the soma. This recording was repeated 10 times, with a randomly chosen connection location (from anatomically likely locations) each time. Each of the 10 trials are included in this file.
- https://doi.org/10.7554/eLife.18566.022
-
Figure 2—source data 18
Model paired recording of a Pyramidal cell to Pyramidal cell connection.
Simulated paired recordings where the postsynaptic cell was voltage-clamped at −50 mV and the reversal potential of the synapse was kept at its physiological potential, as defined in the network model code. Sodium channels in the postsynaptic cell were blocked to prevent a suprathreshold response. A spike was triggered in the presynaptic cell and the current response was measured in the postsynaptic cell at the soma. This recording was repeated 10 times, with a randomly chosen connection location (from anatomically likely locations) each time. Each of the 10 trials are included in this file.
- https://doi.org/10.7554/eLife.18566.023
-
Figure 2—source data 19
Model paired recording of a Neurogliaform cell to Pyramidal cell connection.
Simulated paired recordings where the postsynaptic cell was voltage-clamped at −50 mV and the reversal potential of the synapse was kept at its physiological potential, as defined in the network model code. Sodium channels in the postsynaptic cell were blocked to prevent a suprathreshold response. A spike was triggered in the presynaptic cell and the current response was measured in the postsynaptic cell at the soma. This recording was repeated 10 times, with a randomly chosen connection location (from anatomically likely locations) each time. Each of the 10 trials are included in this file.
- https://doi.org/10.7554/eLife.18566.024
-
Figure 2—source data 20
Model paired recording of an O-LM cell to Pyramidal cell connection.
Simulated paired recordings where the postsynaptic cell was voltage-clamped at −50 mV and the reversal potential of the synapse was kept at its physiological potential, as defined in the network model code. Sodium channels in the postsynaptic cell were blocked to prevent a suprathreshold response. A spike was triggered in the presynaptic cell and the current response was measured in the postsynaptic cell at the soma. This recording was repeated 10 times, with a randomly chosen connection location (from anatomically likely locations) each time. Each of the 10 trials are included in this file.
- https://doi.org/10.7554/eLife.18566.025
-
Figure 2—source data 21
Model paired recording of a PV+ basket cell to Pyramidal cell connection.
Simulated paired recordings where the postsynaptic cell was voltage-clamped at −50 mV and the reversal potential of the synapse was kept at its physiological potential, as defined in the network model code. Sodium channels in the postsynaptic cell were blocked to prevent a suprathreshold response. A spike was triggered in the presynaptic cell and the current response was measured in the postsynaptic cell at the soma. This recording was repeated 10 times, with a randomly chosen connection location (from anatomically likely locations) each time. Each of the 10 trials are included in this file.
- https://doi.org/10.7554/eLife.18566.026
-
Figure 2—source data 22
Model paired recording of a Pyramidal cell to Axo-axonic cell connection.
Simulated paired recordings where the postsynaptic cell was voltage-clamped at −50 mV and the reversal potential of the synapse was kept at its physiological potential, as defined in the network model code. Sodium channels in the postsynaptic cell were blocked to prevent a suprathreshold response. A spike was triggered in the presynaptic cell and the current response was measured in the postsynaptic cell at the soma. This recording was repeated 10 times, with a randomly chosen connection location (from anatomically likely locations) each time. Each of the 10 trials are included in this file.
- https://doi.org/10.7554/eLife.18566.027
-
Figure 2—source data 23
Model paired recording of a Pyramidal cell to Bistratified cell connection.
Simulated paired recordings where the postsynaptic cell was voltage-clamped at −50 mV and the reversal potential of the synapse was kept at its physiological potential, as defined in the network model code. Sodium channels in the postsynaptic cell were blocked to prevent a suprathreshold response. A spike was triggered in the presynaptic cell and the current response was measured in the postsynaptic cell at the soma. This recording was repeated 10 times, with a randomly chosen connection location (from anatomically likely locations) each time. Each of the 10 trials are included in this file.
- https://doi.org/10.7554/eLife.18566.028
-
Figure 2—source data 24
Model paired recording of a Pyramidal cell to Ivy cell connection.
Simulated paired recordings where the postsynaptic cell was voltage-clamped at −50 mV and the reversal potential of the synapse was kept at its physiological potential, as defined in the network model code. Sodium channels in the postsynaptic cell were blocked to prevent a suprathreshold response. A spike was triggered in the presynaptic cell and the current response was measured in the postsynaptic cell at the soma. This recording was repeated 10 times, with a randomly chosen connection location (from anatomically likely locations) each time. Each of the 10 trials are included in this file.
- https://doi.org/10.7554/eLife.18566.029
-
Figure 2—source data 25
Model paired recording of a Pyramidal cell to O-LM cell connection.
Simulated paired recordings where the postsynaptic cell was voltage-clamped at −50 mV and the reversal potential of the synapse was kept at its physiological potential, as defined in the network model code. Sodium channels in the postsynaptic cell were blocked to prevent a suprathreshold response. A spike was triggered in the presynaptic cell and the current response was measured in the postsynaptic cell at the soma. This recording was repeated 10 times, with a randomly chosen connection location (from anatomically likely locations) each time. Each of the 10 trials are included in this file.
- https://doi.org/10.7554/eLife.18566.030
-
Figure 2—source data 26
Model paired recording of a Pyramidal cell to PV+ basket cell connection.
Simulated paired recordings where the postsynaptic cell was voltage-clamped at −50 mV and the reversal potential of the synapse was kept at its physiological potential, as defined in the network model code. Sodium channels in the postsynaptic cell were blocked to prevent a suprathreshold response. A spike was triggered in the presynaptic cell and the current response was measured in the postsynaptic cell at the soma. This recording was repeated 10 times, with a randomly chosen connection location (from anatomically likely locations) each time. Each of the 10 trials are included in this file.
- https://doi.org/10.7554/eLife.18566.031
-
Figure 2—source data 27
Model paired recording of a Pyramidal cell to Schaffer Collateral-Associated cell connection.
Simulated paired recordings where the postsynaptic cell was voltage-clamped at −50 mV and the reversal potential of the synapse was kept at its physiological potential, as defined in the network model code. Sodium channels in the postsynaptic cell were blocked to prevent a suprathreshold response. A spike was triggered in the presynaptic cell and the current response was measured in the postsynaptic cell at the soma. This recording was repeated 10 times, with a randomly chosen connection location (from anatomically likely locations) each time. Each of the 10 trials are included in this file.
- https://doi.org/10.7554/eLife.18566.032
Figure 3
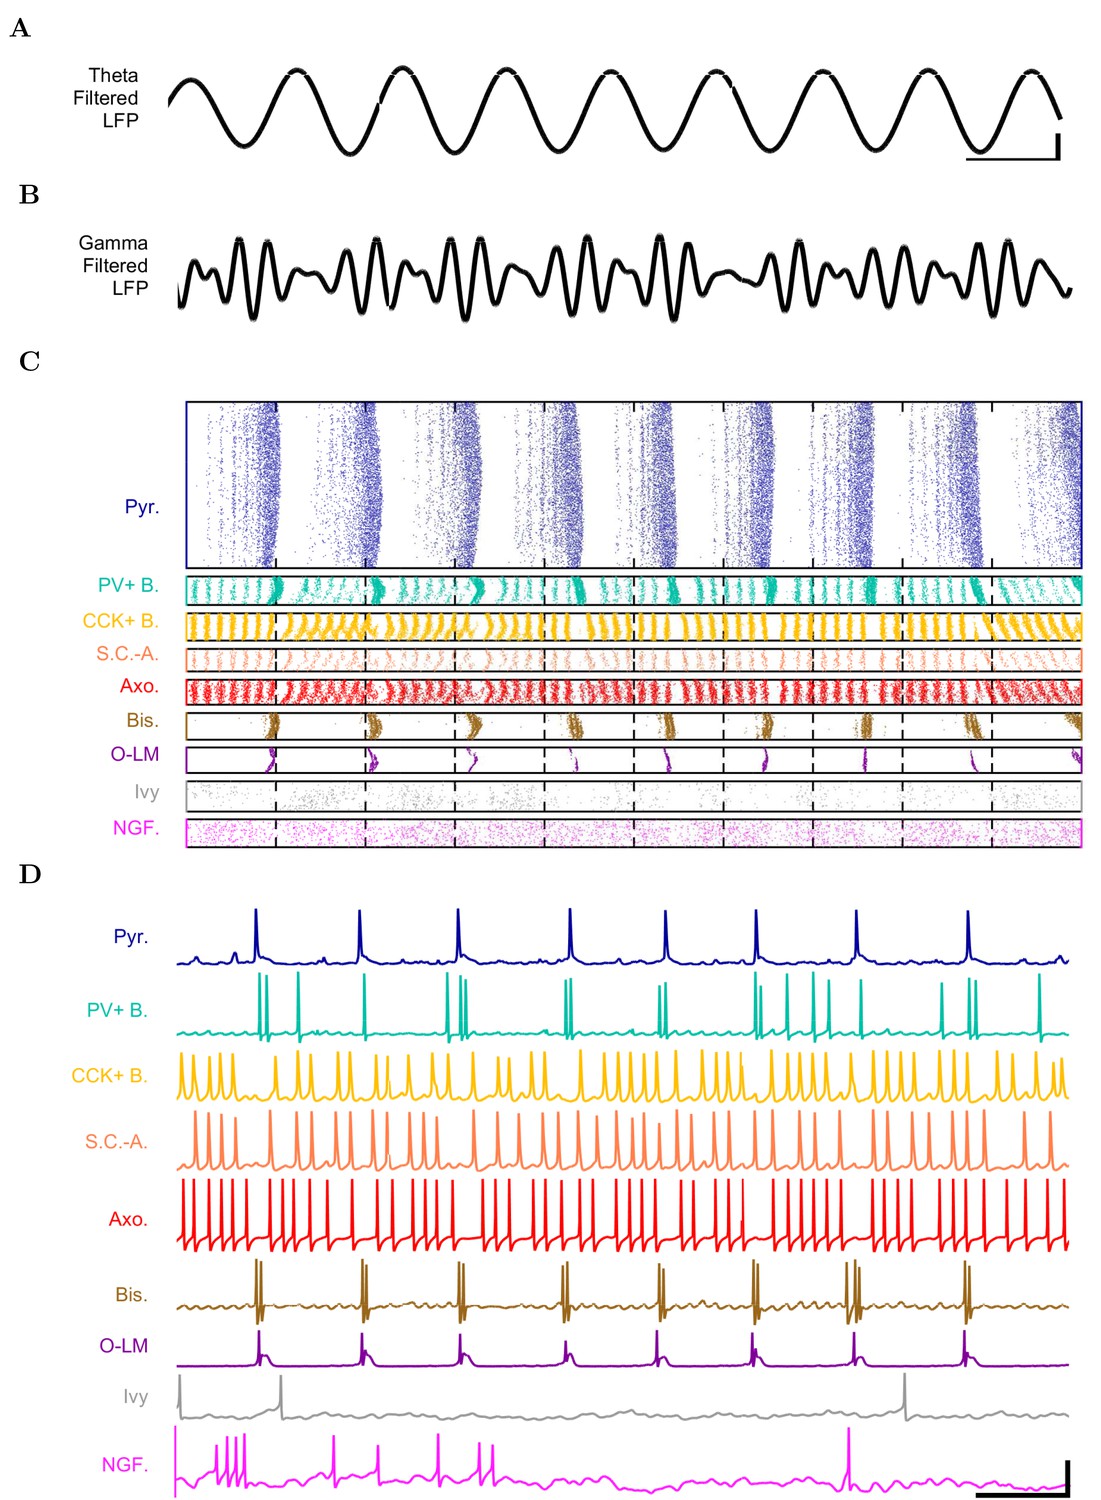
Detailed network activity.
(A–D) One second of network activity is shown. (A–B) The LFP analog, filtered at (A) the theta range of 5–10 Hz and (B) the low gamma range of 25–40 Hz, shows consistent theta and gamma signals. Scale bar represents 100 ms and 0.2 mV (theta) or 0.27 mV (gamma) for filtered LFP traces. (C) Raster of all spikes from cells within 100 m of the reference electrode point. (D) Representative intracellular somatic membrane potential traces from cells near the reference electrode point. Scale bar represents 100 ms and 50 mV for the intracellular traces.
-
Figure 3—source data 1
Filtered analog local field potential of model network.
The theta-filtered and gamma-filtered local field potential (LFP) analog traces.
- https://doi.org/10.7554/eLife.18566.038
-
Figure 3—source data 2
Spike Raster.
Spike times for the length of the entire simulation, from the specific cells displayed in raster shown in Figure 3 (spike times of every single cell in the network are available in the CRCNS repository entry for Bezaire et al. [2016b]).
- https://doi.org/10.7554/eLife.18566.039
-
Figure 3—source data 3
Somatic membrane potential recordings.
Full duration, intracellular somatic membrane potential recordings from the specific cells shown in Figure 3.
- https://doi.org/10.7554/eLife.18566.040
Figure 4 with 1 supplement
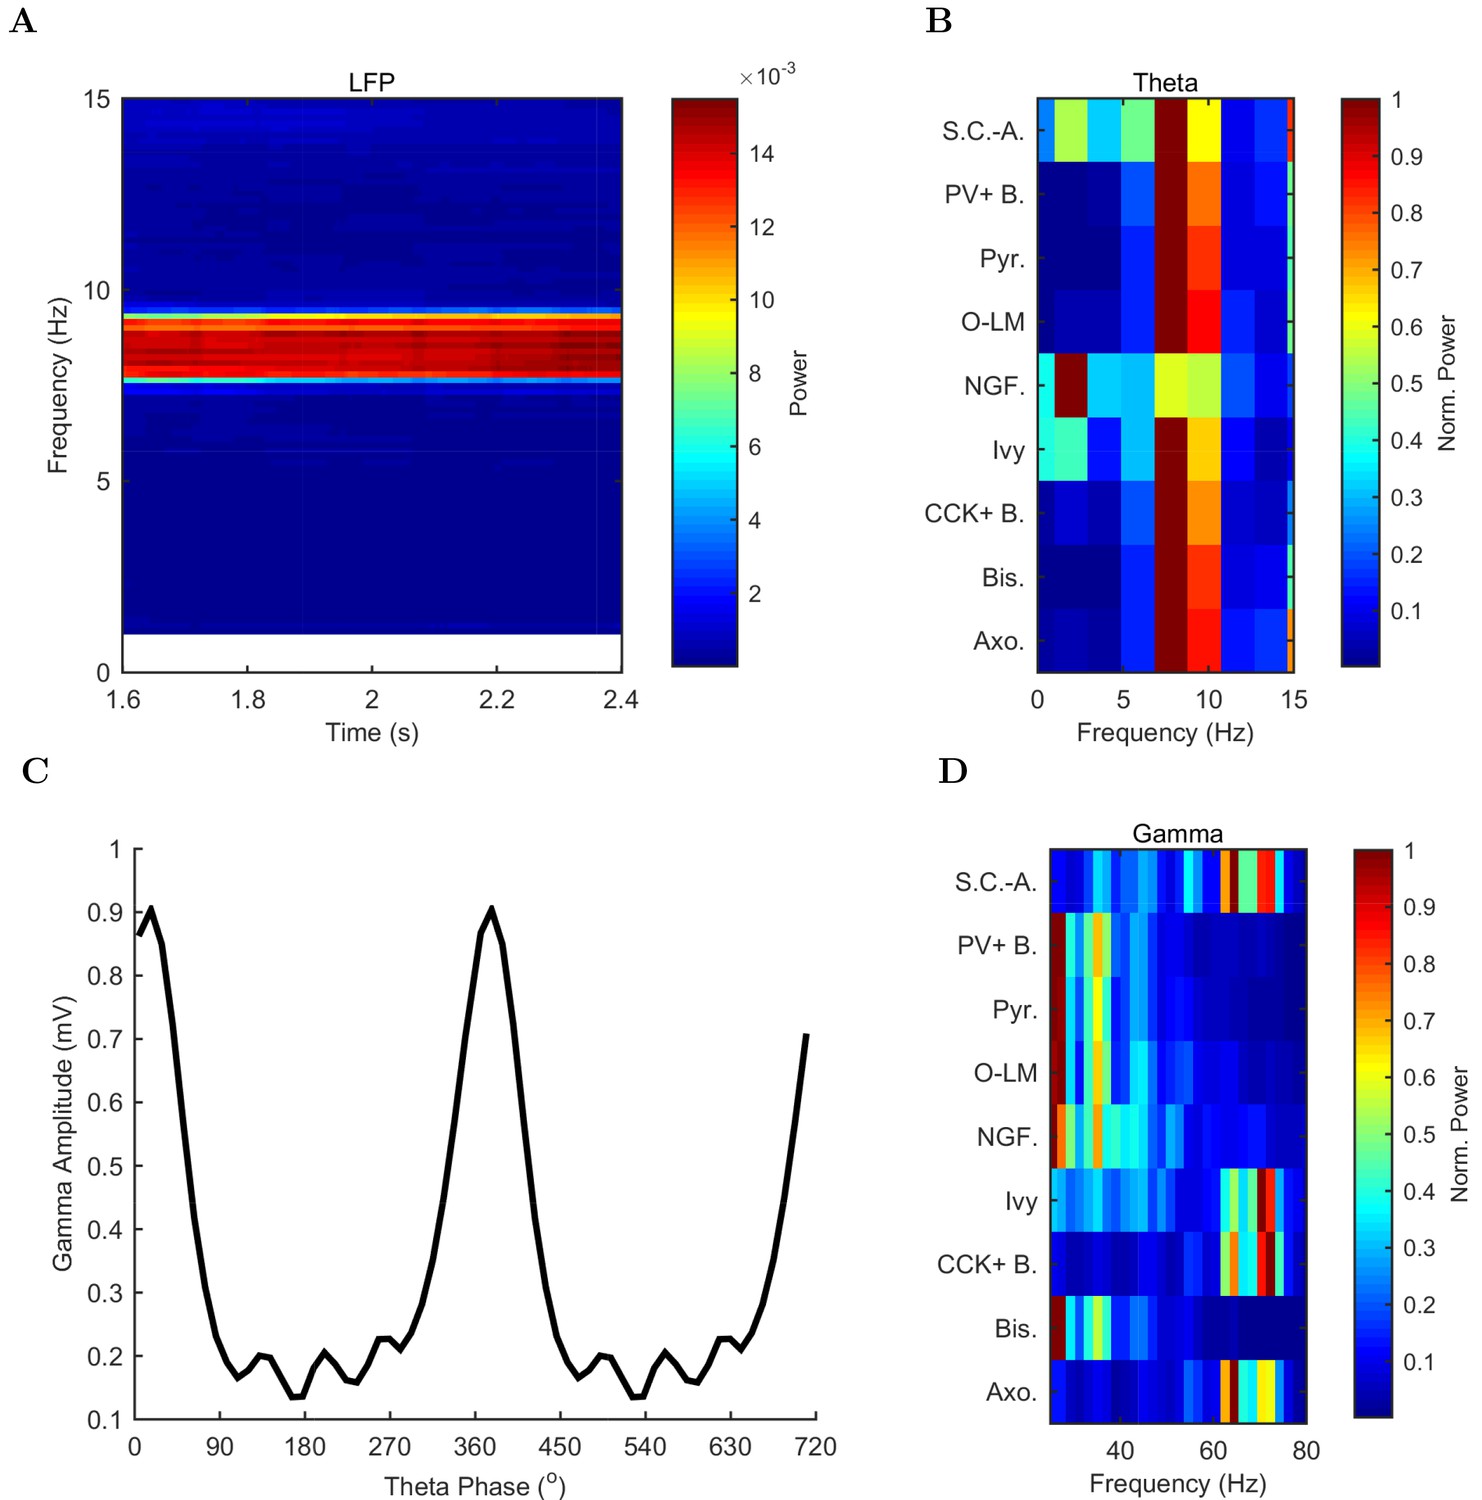
Spectral analysis of model activity.
(A) A spectrogram of the local pyramidal-layer LFP analog (including contributions from all pyramidal cells within 100 m of the reference electrode and 10% of pyramidal cells outside that radius) shows the stability and strength of the theta oscillation over time. The oscillation also featured strong harmonics at multiples of the theta frequency of 7.8 Hz. (B,D) Welch’s periodogram of the spike density function for each cell type, normalized by cell type and by displayed frequency range, shows the dominant network frequencies of (B) theta (7.8 Hz) and (D) gamma (71 Hz). Power is normalized to the peak power displayed in the power spectrum for each cell type. (C) Cross-frequency coupling between theta and gamma components of the LFP analog shows that the gamma oscillation is theta modulated. The gamma envelope is a function of the theta phase with the largest amplitude gamma oscillations occurring at the trough of the theta oscillation. Following convention, the theta trough was designated 0°/360°; see e.g., Varga et al. (2012). A graphical explanation of the relation between a spike train and its spike density function is shown in Figure 4—figure supplement 1.
-
Figure 4—source data 1
Raw analog local field potential of model network.
The raw local field potential (LFP) analog calculated from the network activity, as detailed in the Materials and methods section.
- https://doi.org/10.7554/eLife.18566.042
-
Figure 4—source data 2
Spike Density Functions of each cell type in control network.
The power of the Spike Density Functions was calculated from a one-sided periodogram using Welch’s method where segments have a 50% overlap with a Hamming Window.
- https://doi.org/10.7554/eLife.18566.043
Figure 4—figure supplement 1
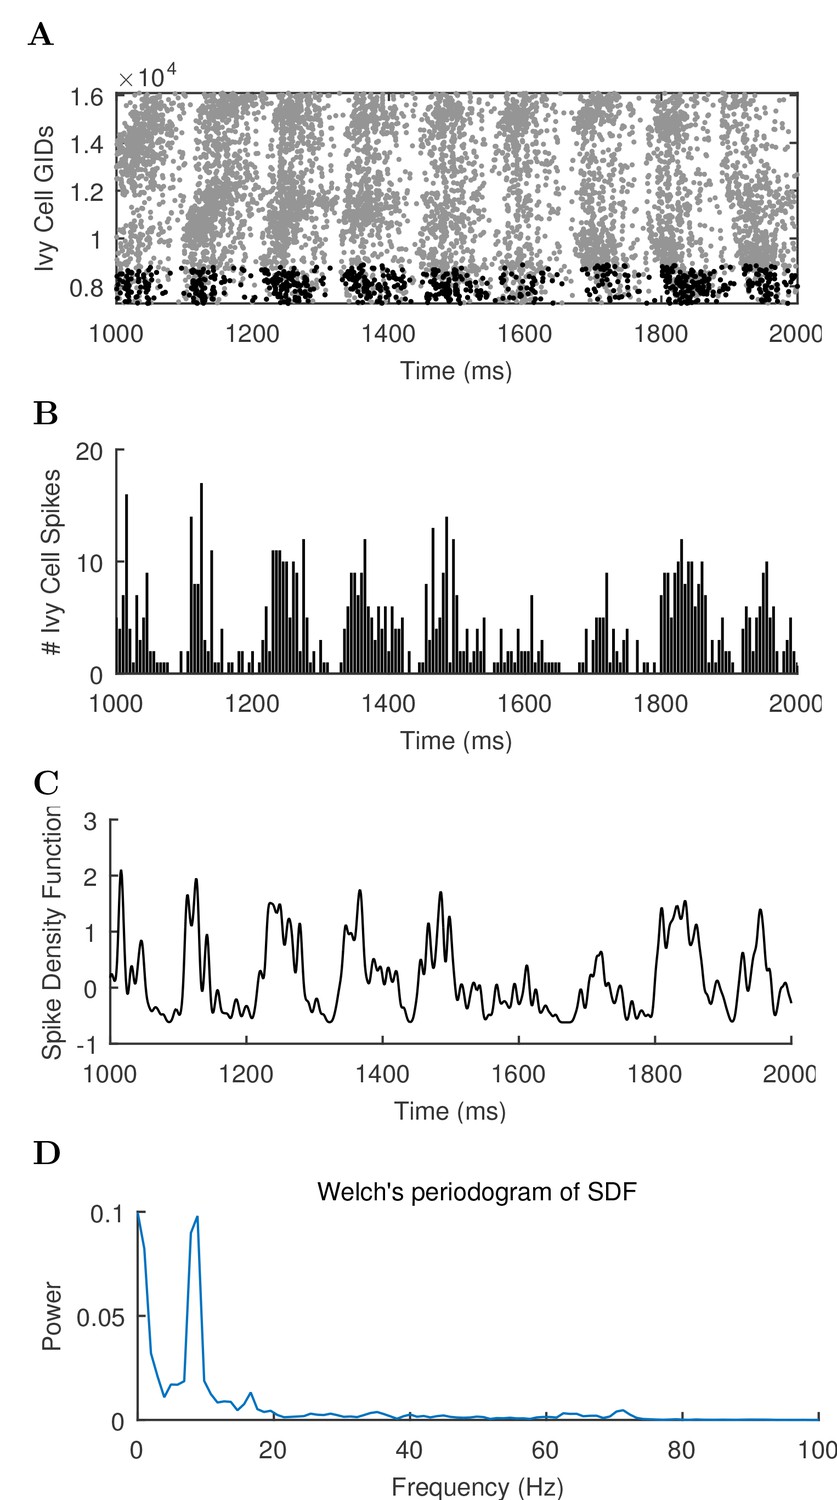
Different views of cell activity.
Several ways of characterizing model cell activity per cell type are shown using the spikes from the ivy cells as an example. (A) The spike times of each ivy cell are plotted as a function of time and ivy cell number. A subset of ivy cells positioned within 100 μm of the reference electrode location (whose spikes are shown in black) are then carried forward in the remaining calculations. (B) The spikes of the local ivy cells are binned into 1 ms windows to give spike counts per window. (C) A continuous representation of the ivy cell spikes as a function of time is given in the spike density function (SDF) computed from the ivy cell spike times. (D) A Welch’s Periodogram is computed, which summarizes the power of each oscillation frequency in the ivy cell SDF Although only a part of the simulation is shown, the full simulation length (except the first 50 ms) was used in the spectral analysis.
Figure 5 with 2 supplements
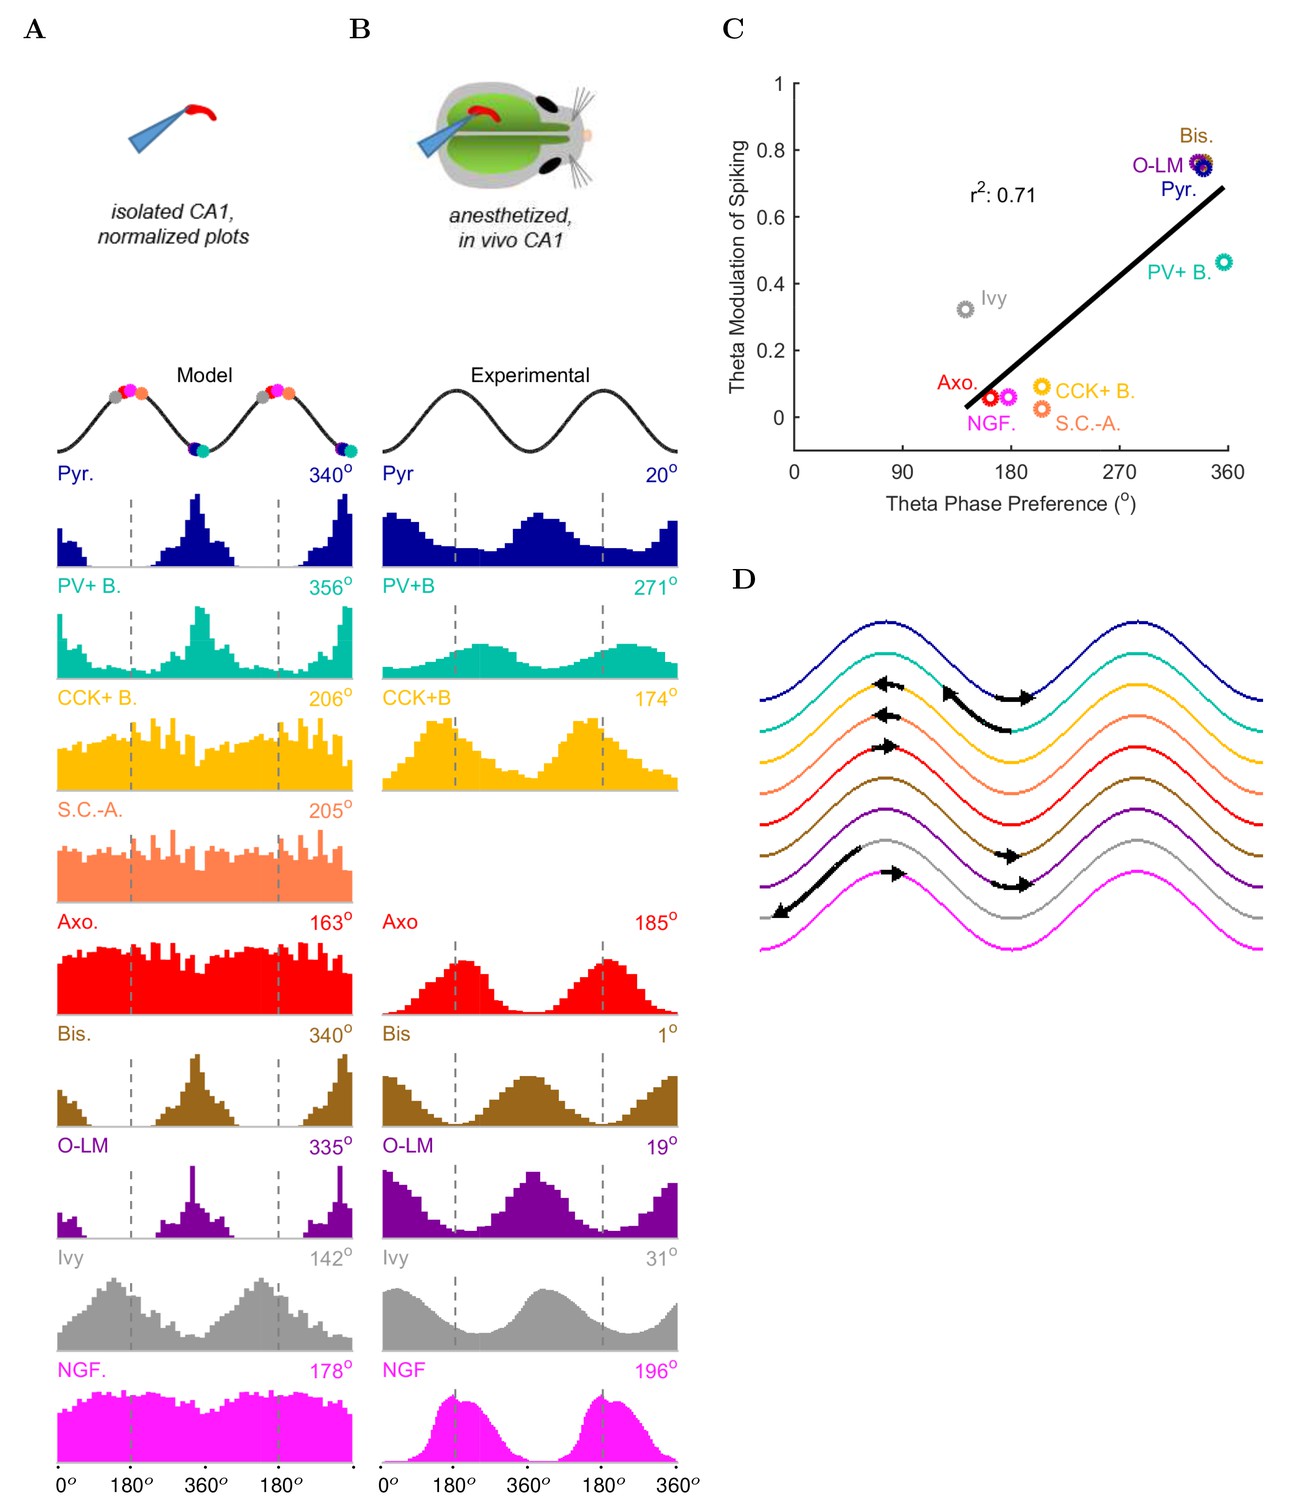
Model and experimental cell theta phases.
All model results are based on the spiking of the cells within 100 m of the reference electrode. (A–B) Firing probability by cell type as a function of theta phase for (A) model and (B) experimental cells under anesthesia (histograms adapted with permission from Figure 2, Figure 5B left, and Figure 6F respectively from Klausberger and Somogyi, 2008; Fuentealba et al., 2008; Fuentealba et al., 2010). The model histograms are normalized; see Figure 5—figure supplement 1 for firing rates. (C) Theta phase preference and theta modulation level were correlated; better modulated cell types spiked closer to the LFP analog trough near the phase preference of pyramidal cells. (D) Theta phase preference plotted on an idealized LFP wave for model data (base of arrow signifies the model phase preference and head of the arrow shows the distance to anesthetized, experimental phase preference).
-
Figure 5—source data 1
Spike times of axo-axonic cells.
All spike times from all axo-axonic cells, as well as the calculated theta phases (relative to the theta-filtered LFP analog) of each spike.
- https://doi.org/10.7554/eLife.18566.046
-
Figure 5—source data 2
Spike times of bistratified cells.
All spike times from all bistratified cells, as well as the calculated theta phases (relative to the theta-filtered LFP analog) of each spike.
- https://doi.org/10.7554/eLife.18566.047
-
Figure 5—source data 3
Spike times of proximal afferent cells.
All spike times from all proximal afferent cells, as well as the calculated theta phases (relative to the theta-filtered LFP analog) of each spike.
- https://doi.org/10.7554/eLife.18566.048
-
Figure 5—source data 4
Spike times of CCK+ basket cells.
All spike times from all CCK+ basket cells, as well as the calculated theta phases (relative to the theta-filtered LFP analog) of each spike.
- https://doi.org/10.7554/eLife.18566.049
-
Figure 5—source data 5
Spike times of distal afferent cells.
All spike times from all distal afferent cells, as well as the calculated theta phases (relative to the theta-filtered LFP analog) of each spike.
- https://doi.org/10.7554/eLife.18566.050
-
Figure 5—source data 6
Spike times of ivy cells.
All spike times from all ivy cells, as well as the calculated theta phases (relative to the theta-filtered LFP analog) of each spike.
- https://doi.org/10.7554/eLife.18566.051
-
Figure 5—source data 7
Spike times of neurogliaform cells.
All spike times from all neurogliaform cells, as well as the calculated theta phases (relative to the theta-filtered LFP analog) of each spike.
- https://doi.org/10.7554/eLife.18566.052
-
Figure 5—source data 8
Spike times of O-LM cells.
All spike times from all O-LM cells, as well as the calculated theta phases (relative to the theta-filtered LFP analog) of each spike.
- https://doi.org/10.7554/eLife.18566.053
-
Figure 5—source data 9
Spike times of PV+ basket cells.
All spike times from all PV+ basket cells, as well as the calculated theta phases (relative to the theta-filtered LFP analog) of each spike.
- https://doi.org/10.7554/eLife.18566.054
-
Figure 5—source data 10
Spike times of pyramidal cells.
All spike times from all pyramidal cells, as well as the calculated theta phases (relative to the theta-filtered LFP analog) of each spike.
- https://doi.org/10.7554/eLife.18566.055
-
Figure 5—source data 11
Spike times of Schaffer Collateral-associated cells.
All spike times from all Schaffer Collateral-associated cells, as well as the calculated theta phases (relative to the theta-filtered LFP analog) of each spike.
- https://doi.org/10.7554/eLife.18566.056
Figure 5—figure supplement 1

Firing rates of model and experimental cells of each type.
For experimental cells, firing rates in both the anesthetized and awake states were included where available. See Table 6 for sources of experimental data.
Figure 5—figure supplement 2
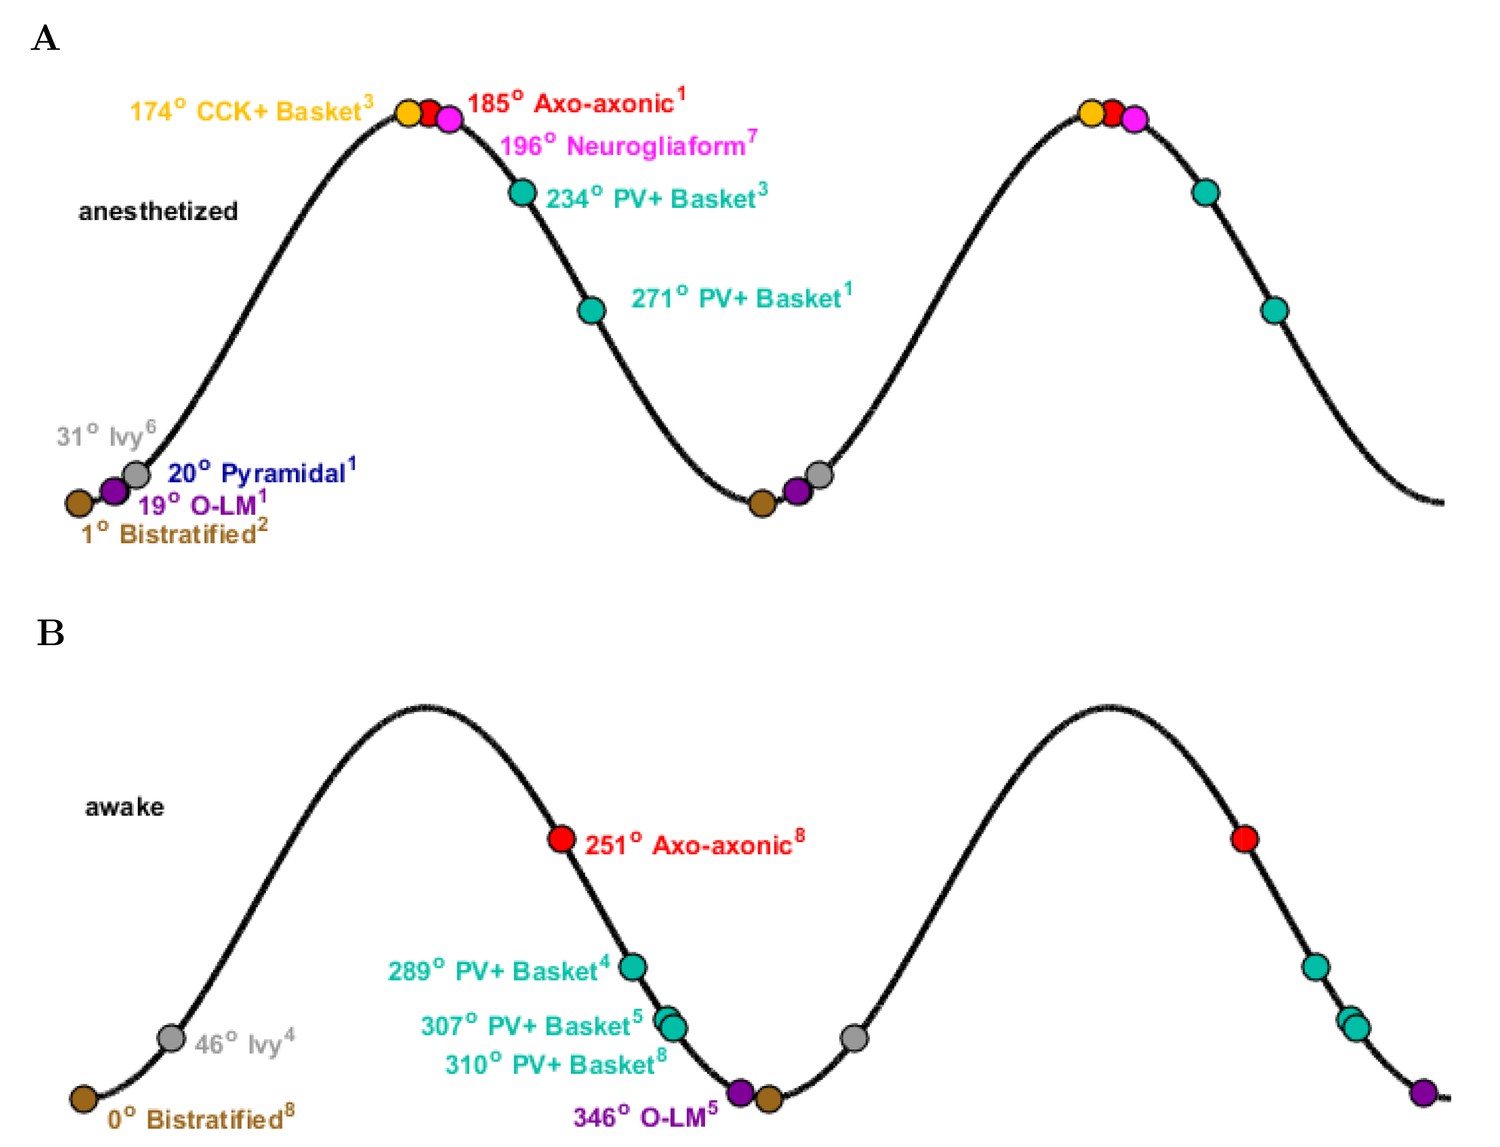
Theta phase-specific firing preferences of various biological hippocampal cell types as reported in the literature.
The trough of the pyramidal-layer LFP is designated as 0/360 and the peak as 180. There is variation in phase preference for given cell types as a function of the experimental preparation. Shown are (A) anesthetized and (B) awake experimental conditions. Reference subscripts correspond to: 1: Klausberger et al. (2003), 2: Klausberger et al. (2004), 3: Klausberger et al. (2005), 4: Lapray et al. (2012), 5: Varga et al. (2012), 6: Fuentealba et al. (2008), 7: Fuentealba et al. (2010), 8: Varga et al. (2014). See Table 6 for further details.
Figure 6 with 2 supplements
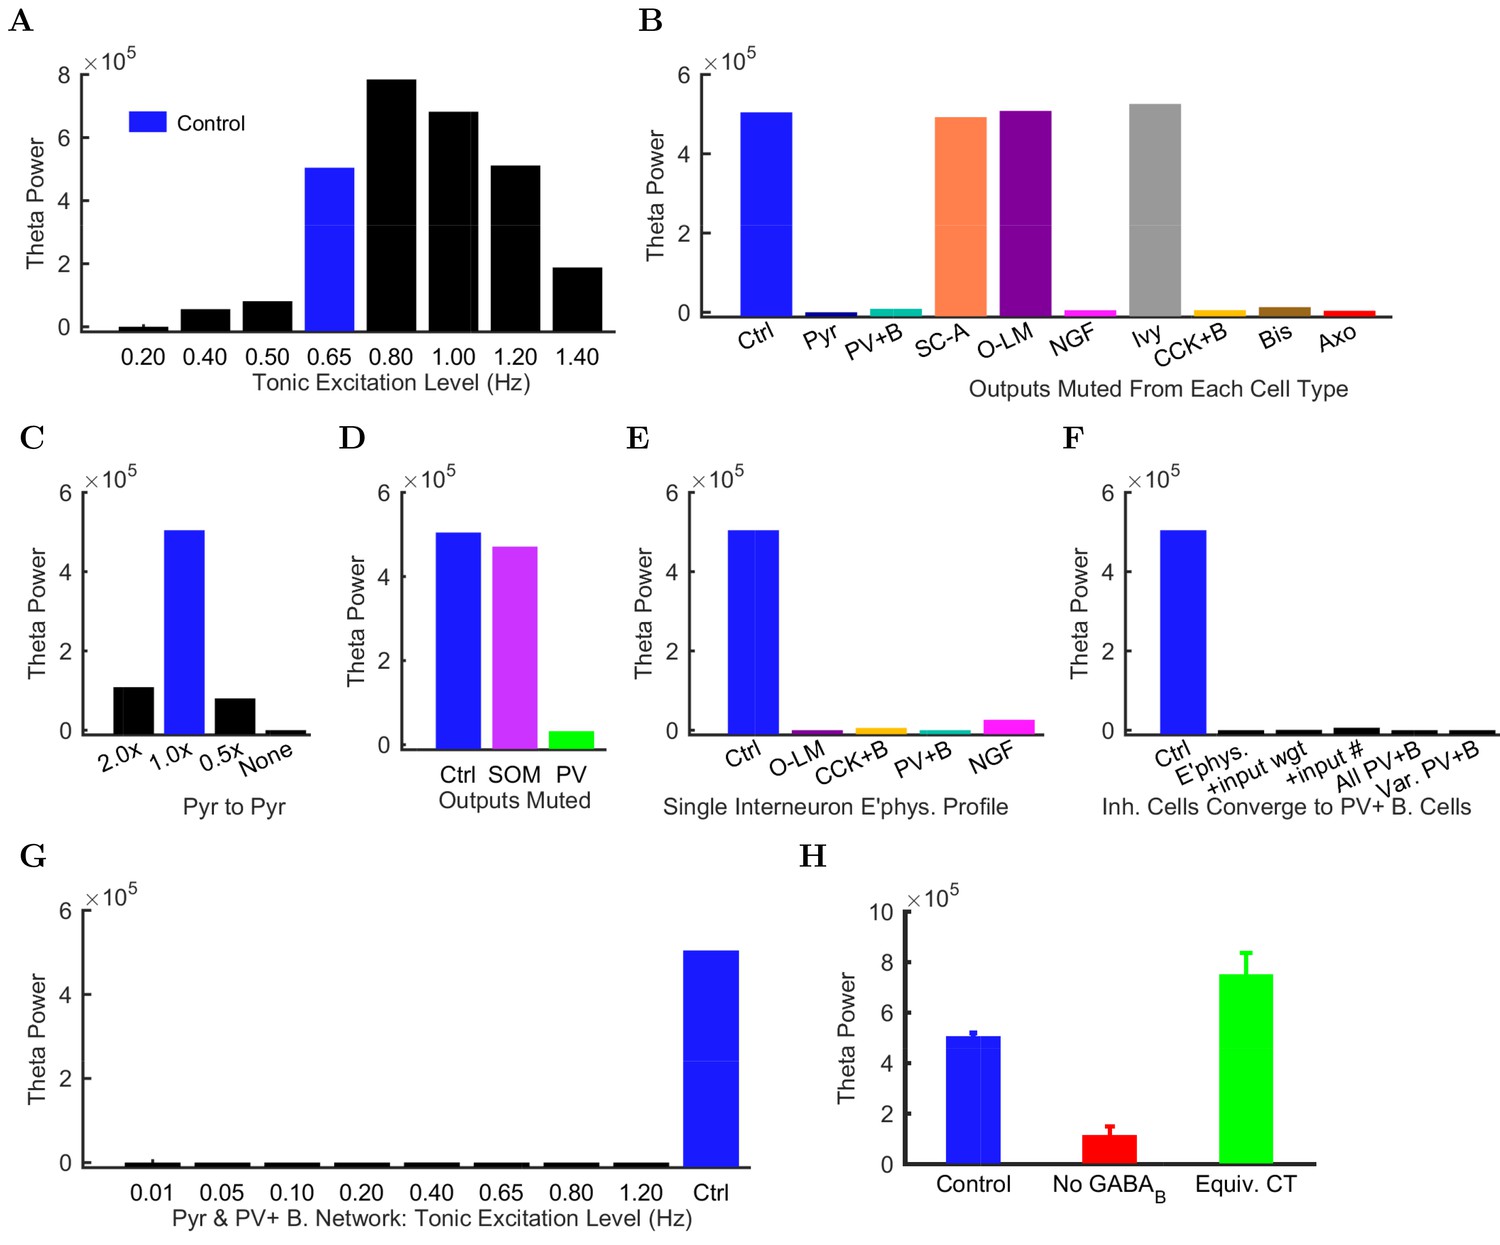
Altered network configurations.
Oscillation power (in mV2/Hz) of the spike density function (SDF) for pyramidal cells within 100 m of the reference electrode, at the peak frequency within theta range (5–10 Hz) in altered network configurations. For corresponding peak frequencies, see Figure 6—figure supplement 1. (A) Theta is present at some excitation levels. (B) Muting each cell type’s output caused a range of effects. (C) The stability and frequency of spontaneous theta in the network was sensitive to the presence and number of recurrent connections between CA1 pyramidal cells. (D) Partially muting the broad classes of PV+ or SOM+ cells by 50% showed that PV+ muting disrupted the network more than SOM+ muting. (E) Theta falls apart when all interneurons are given the same electrophysiological profile, whether it be of a PV+ basket, CCK+ basket, neurogliaform, or O-LM cell. (F) Gradually setting all interneuron properties to those of PV+ basket cells did not restore theta. From left to right: control network; PV+ basket cell electrophysiology; also weights of incoming synapses; also numbers of incoming synapses; then all interneurons being PV+ basket cells (with the addition of the output synapse numbers, weights, and kinetics); then variable RMP (normal distribution with standard deviation of 8 mV). (G) A wide range in excitation was unable to produce theta in the PV+ B. network. (H) Removing the GABA component from the neurogliaform synapses onto other neurogliaform cells and pyramidal cells showed a significant drop in theta power. Massively increasing the weight of the GABA component to produce a similar amount of charge transfer restored theta power (compare the IPSCs corresponding to each condition in Figure 6—figure supplement 2). Standard deviations (n = 3) shown; significance (p=1.8e-05).
-
Figure 6—source data 1
Simulation name mapping.
Map the names of the simulations (used in the header of SDF_All_Conditions.txt) to the bar labels in the graphs of Figure 6.
- https://doi.org/10.7554/eLife.18566.062
-
Figure 6—source data 2
SDF of each network condition.
The full length pyramidal cell Spike Density Function computed at a resolution of 1000 Hz from the spikes of all pyramidal cells within the local range of the electrode point in the model network, for each network condition studied in Figure 6.
- https://doi.org/10.7554/eLife.18566.063
Figure 6—figure supplement 1
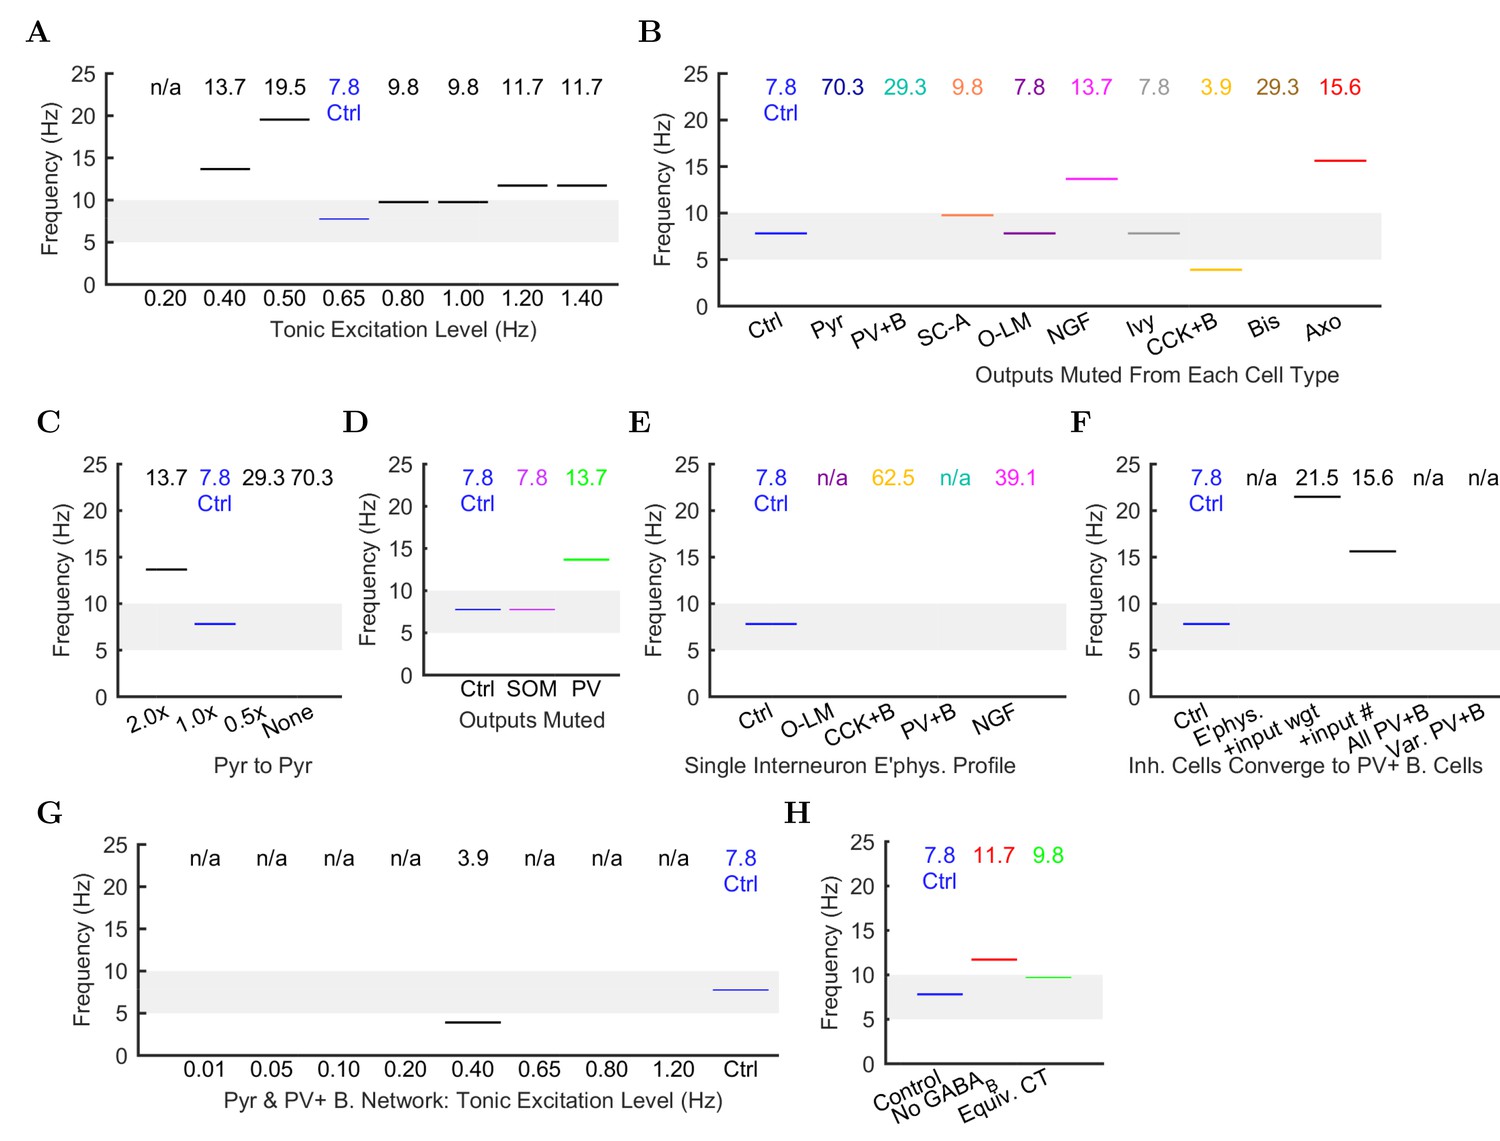
Peak frequencies of oscillations in altered networks.
Peak theta frequency (within 5–10 Hz) of the spike density function (SDF) for all pyramidal cells within 100 m of the reference electrode in each altered network configuration. For networks where no pyramidal cells spiked, resulting in zero power within the spectral analysis of the pyramidal cell spike density function, their peak frequencies are listed as ‘not available’ or ‘n/a’. (A) Spontaneous theta oscillation accelerated out of theta range with more excitation. (B) Muting each cell type shifted the oscillation out of range (neurogliaform, CCK+ basket, and axo-axonic cells), disrupted theta but not gamma (not shown; pyramidal, PV+ basket, and bistratified cells), or had little effect (S.C.-A., O-LM, and ivy cells). (C) Doubling the connections between CA1 pyramidal cells increased the theta frequency, while networks with half the number or no recurrent collaterals lost the slow oscillation but kept gamma. (D) Removing 50% of PV+ cell inhibition (PV+ basket, bistratified, and axo-axonic cells) or 50% of SOM+ cell inhibition (bistratified or O-LM cells) shifted the oscillation out of theta range or lost the slow oscillation entirely but kept gamma. (E) Peak oscillation shifted out of theta range when all interneurons had the same electrophysiological profile, regardless of the profile used. (F) Converging all properties to PV+ basket cells, gamma was restored (not shown) but not theta (left to right: control; network with 1: diverse interneurons with same electrophysiology; 2: also with same weights of incoming synapses; 3: also with same numbers of incoming synapses; 4: complete conversion to PV+ basket cells; 5: added variability in resting membrane potential (normal distribution with st. dev.=8 mV)). (G) In the all-PV+ basket cell network, a wide range of excitation levels could not produce a spontaneous theta rhythm. (H) Removing GABA increased the oscillation frequency.
Figure 6—figure supplement 2
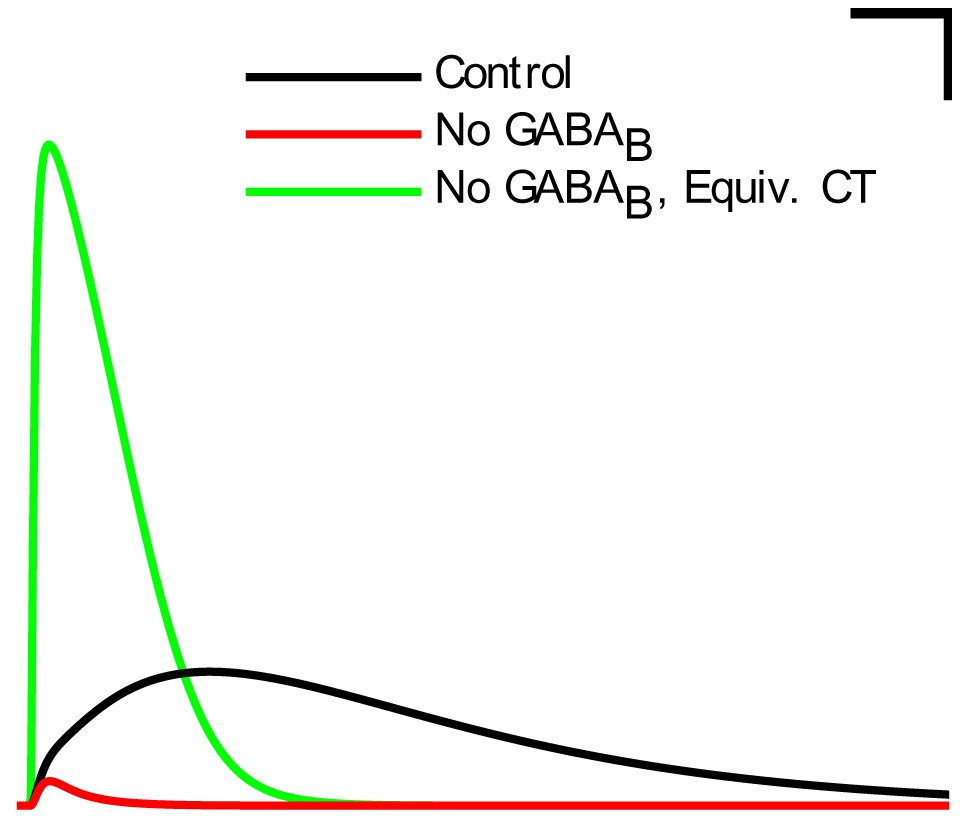
IPSCs from the neurogliaform to pyramidal cell synapse corresponding to the different conditions in Figure 6H.
These traces are from pyramidal cells clamped at −50 mV during a paired recording from a presynaptic neurogliaform cell with a GABA reversal potential of −60 mV and a GABA reversal potential of −90 mV. The currents shown are averages from 10 recordings. Scale bar = 100 ms and 5 pA.
Appendix 1—figure 1
Firing Rates of Experimental Cells.
Rebound spiking, which occurs in some O-LM cells at hyperpolarized current injection levels, is not shown in this graph.
Appendix 1—figure 2
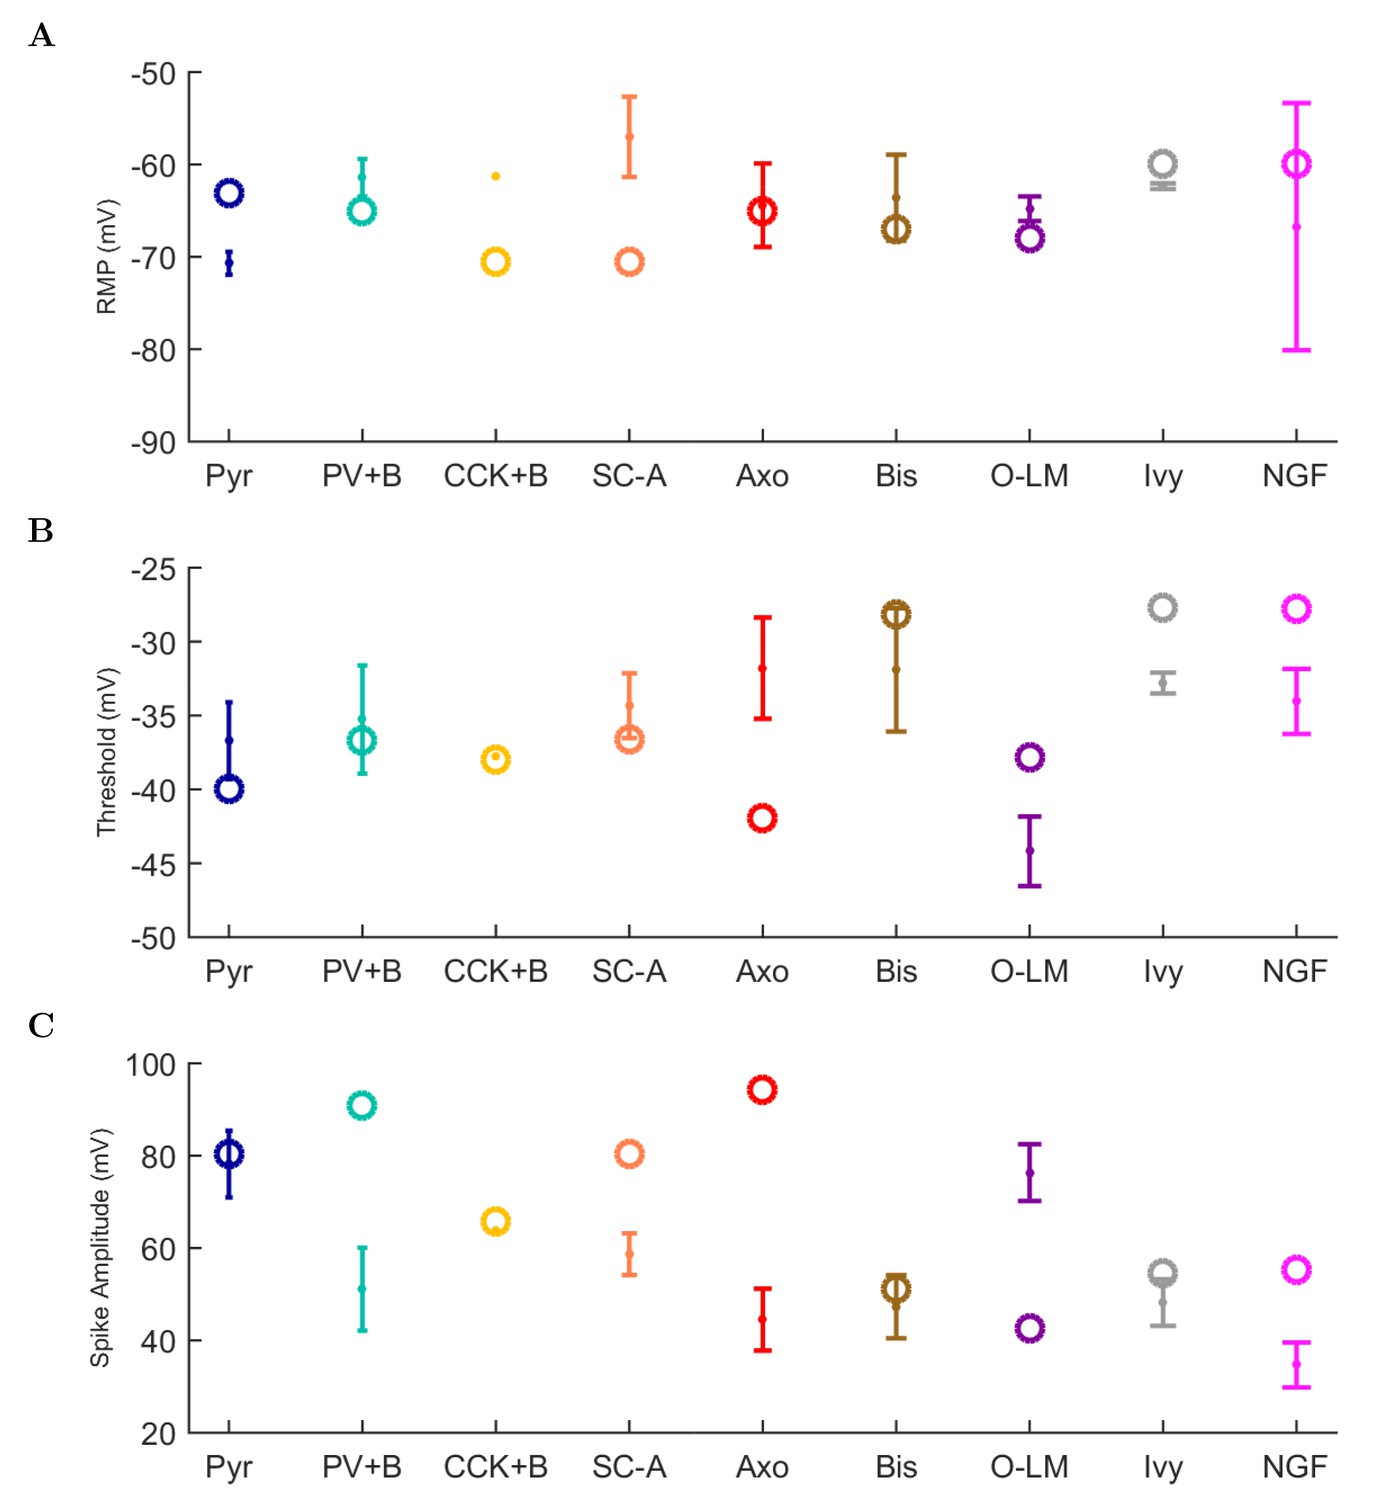
Physiological properties of experimental and model cells.
Experimental data are shown with closed markers for the mean and error bars for cell types where n > 1. The model cell properties are plotted as open circles. Calculation of properties is explained in the text. (A) resting membrane potential, (B) threshold, and (C) spike amplitude.
Appendix 1—figure 3
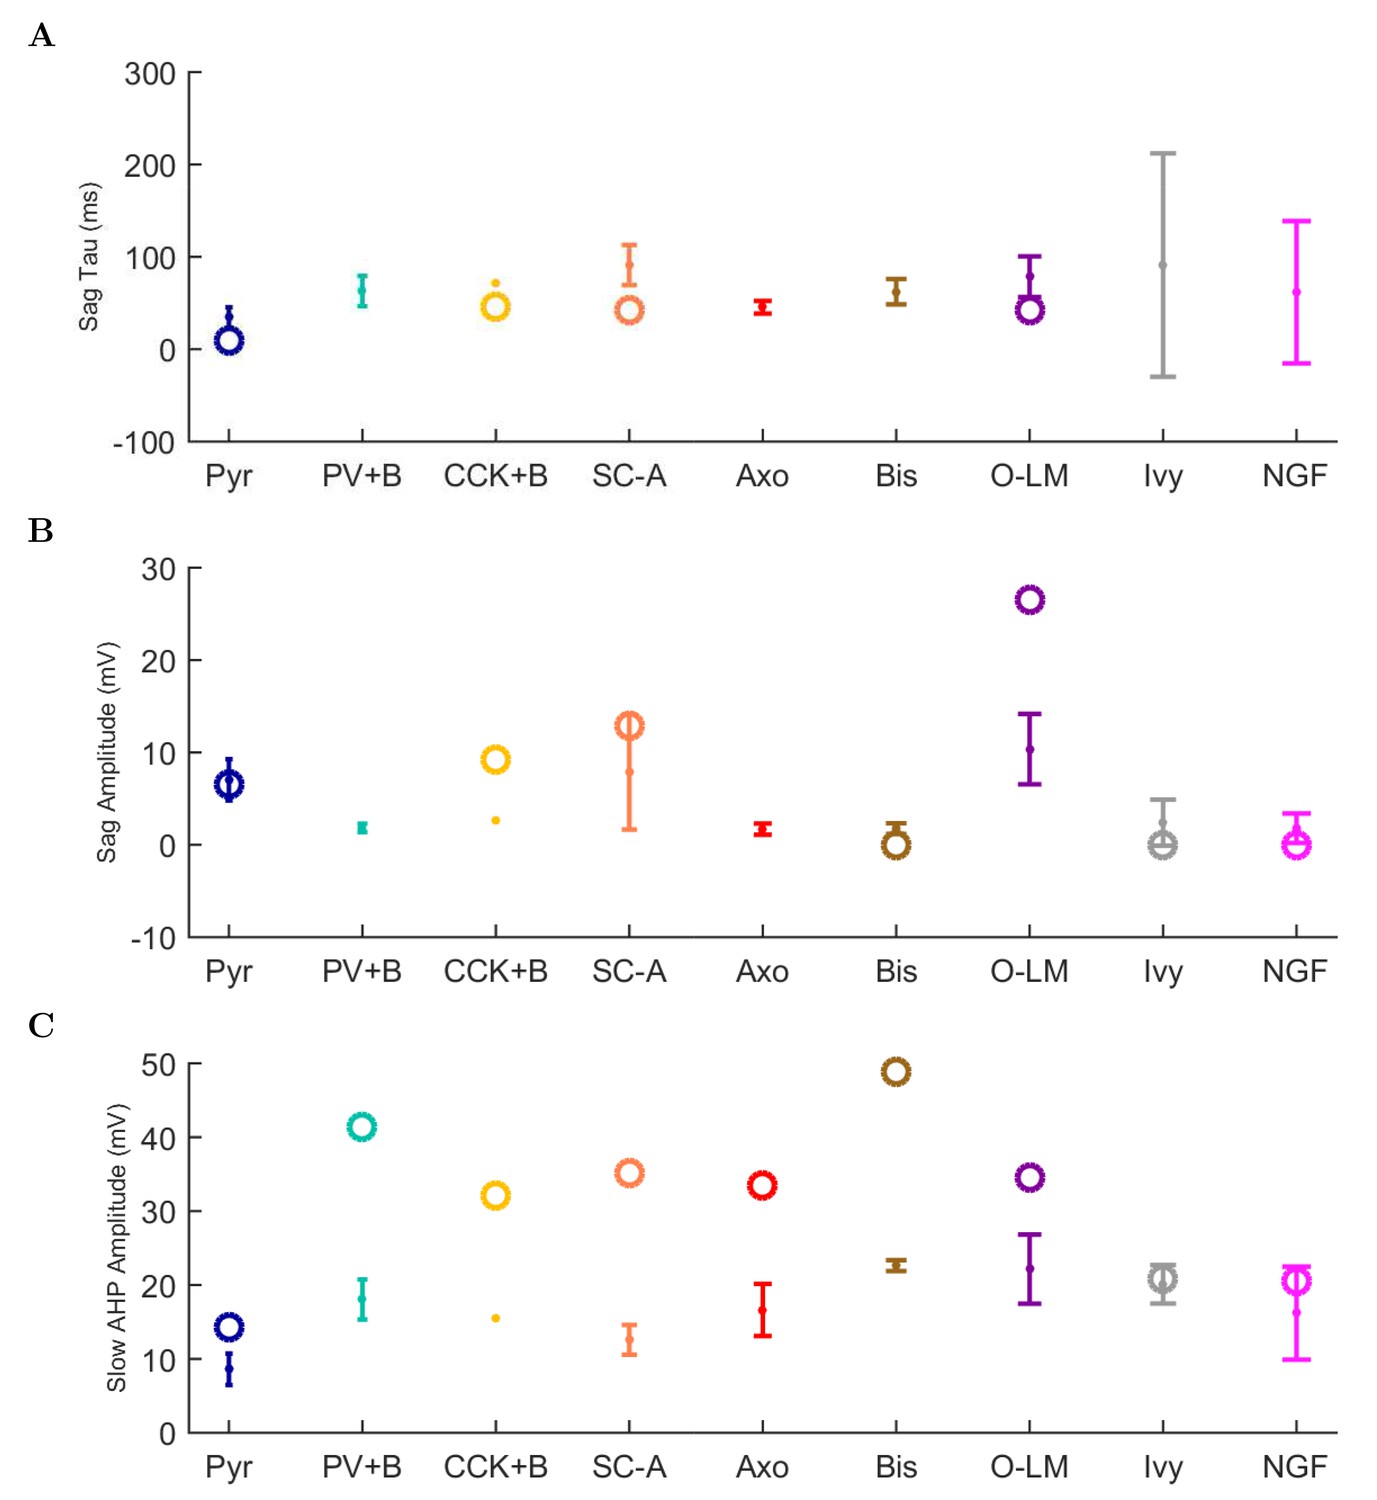
Physiological properties, continued.
(A) sag time constant, (B) sag amplitude, and (C) amplitude of afterhyperpolarization (AHP).
Appendix 1—figure 4
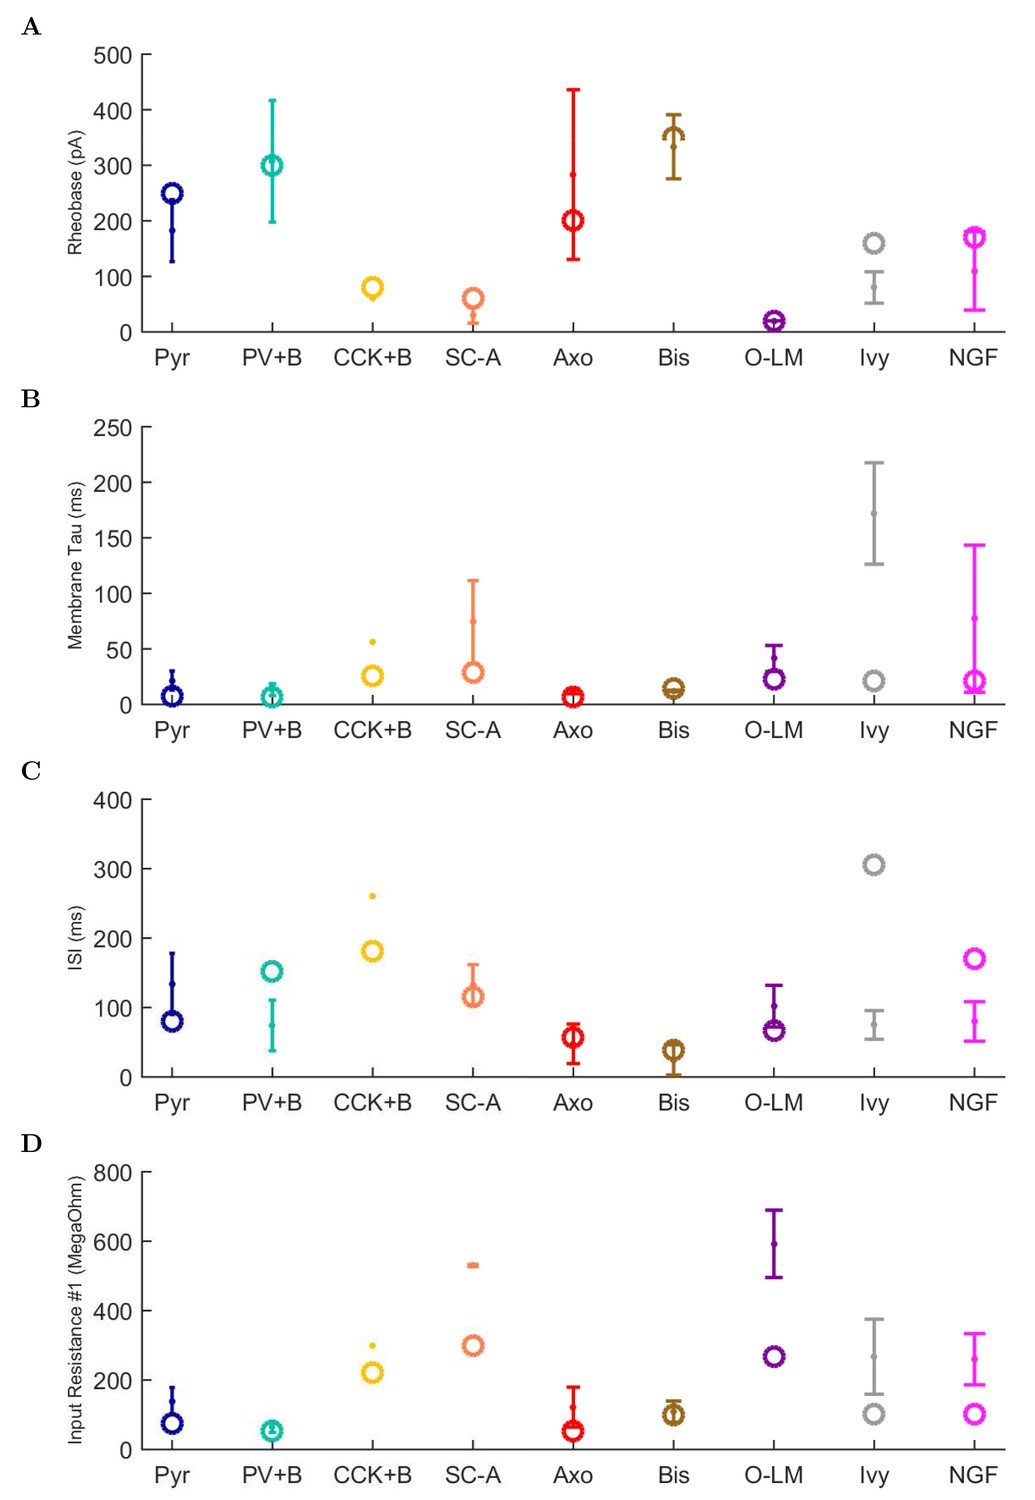
Physiological properties, continued.
(A) rheobase, (B) membrane time constant, (C) interspike interval (ISI), and (D) input resistance.
Appendix 1—figure 5
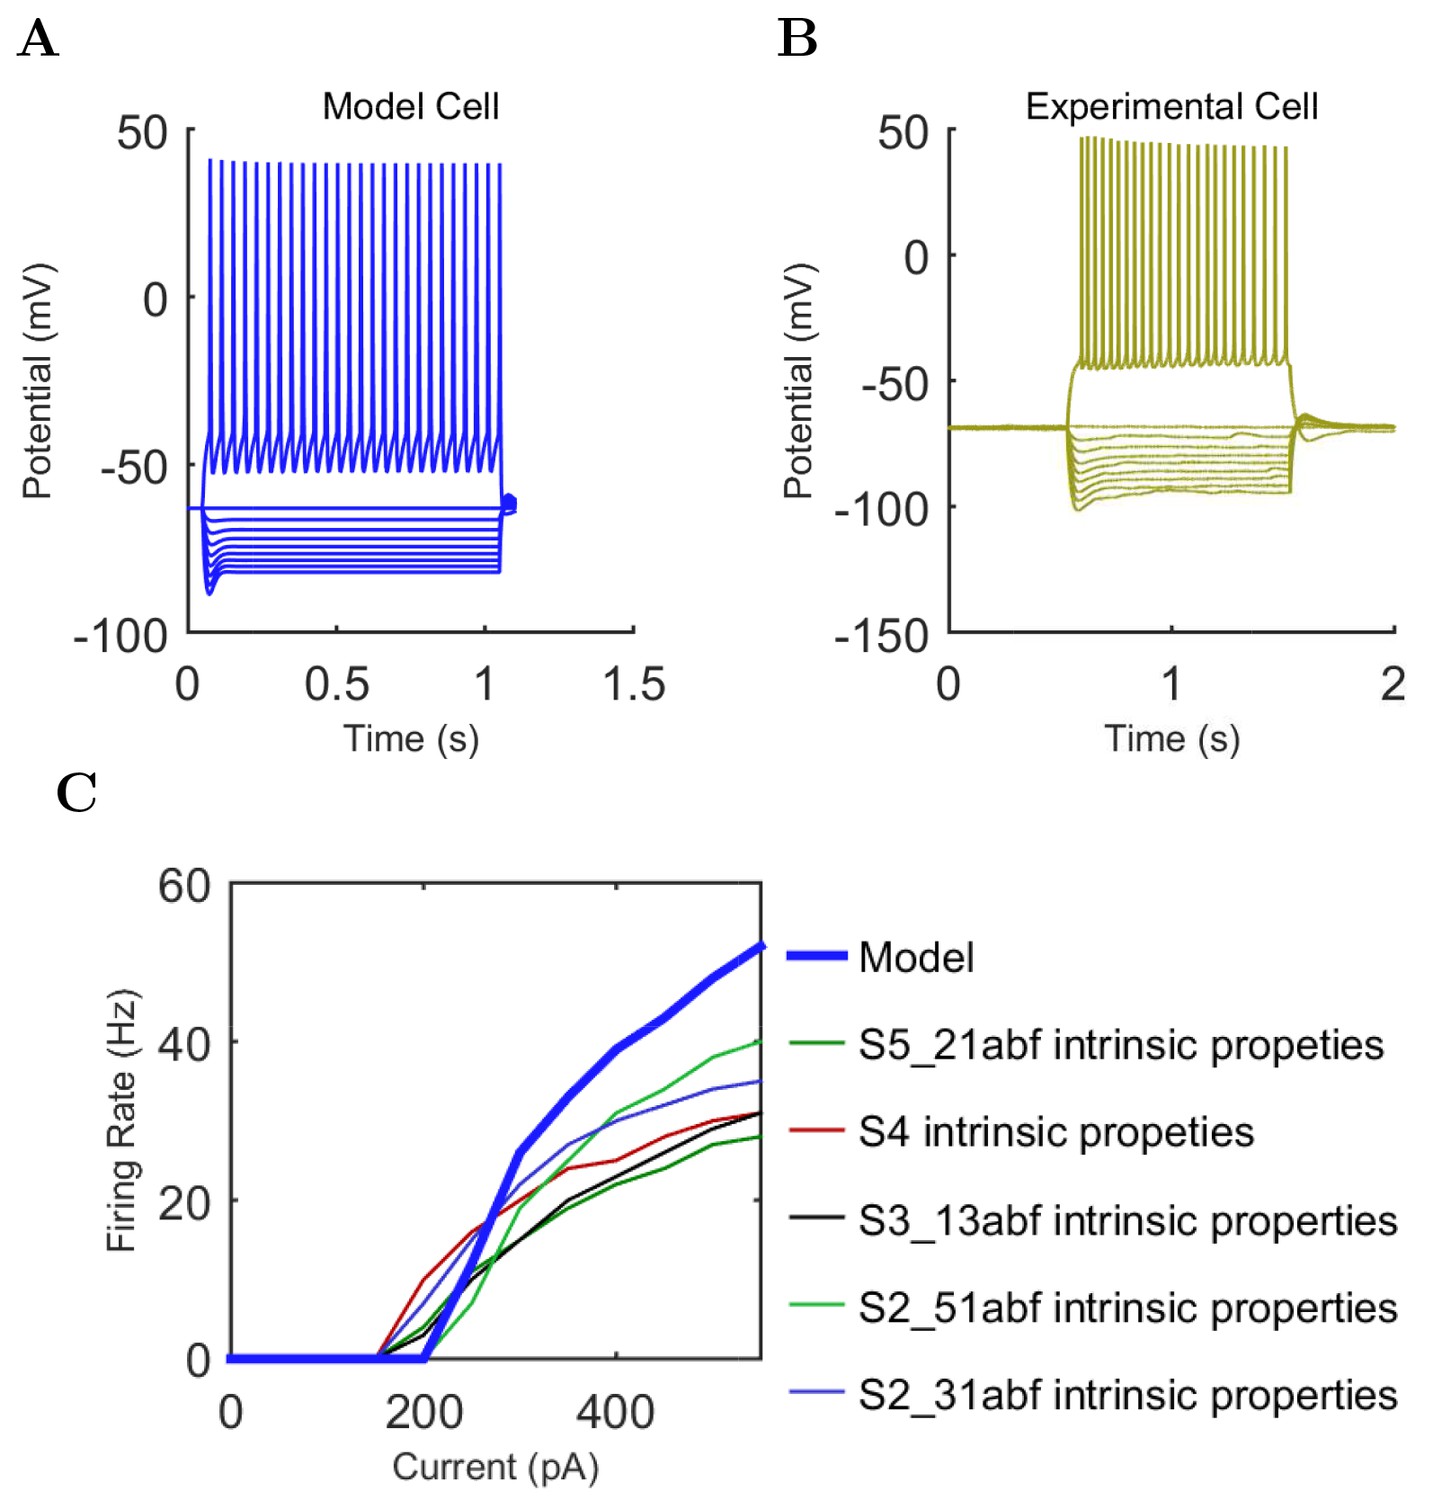
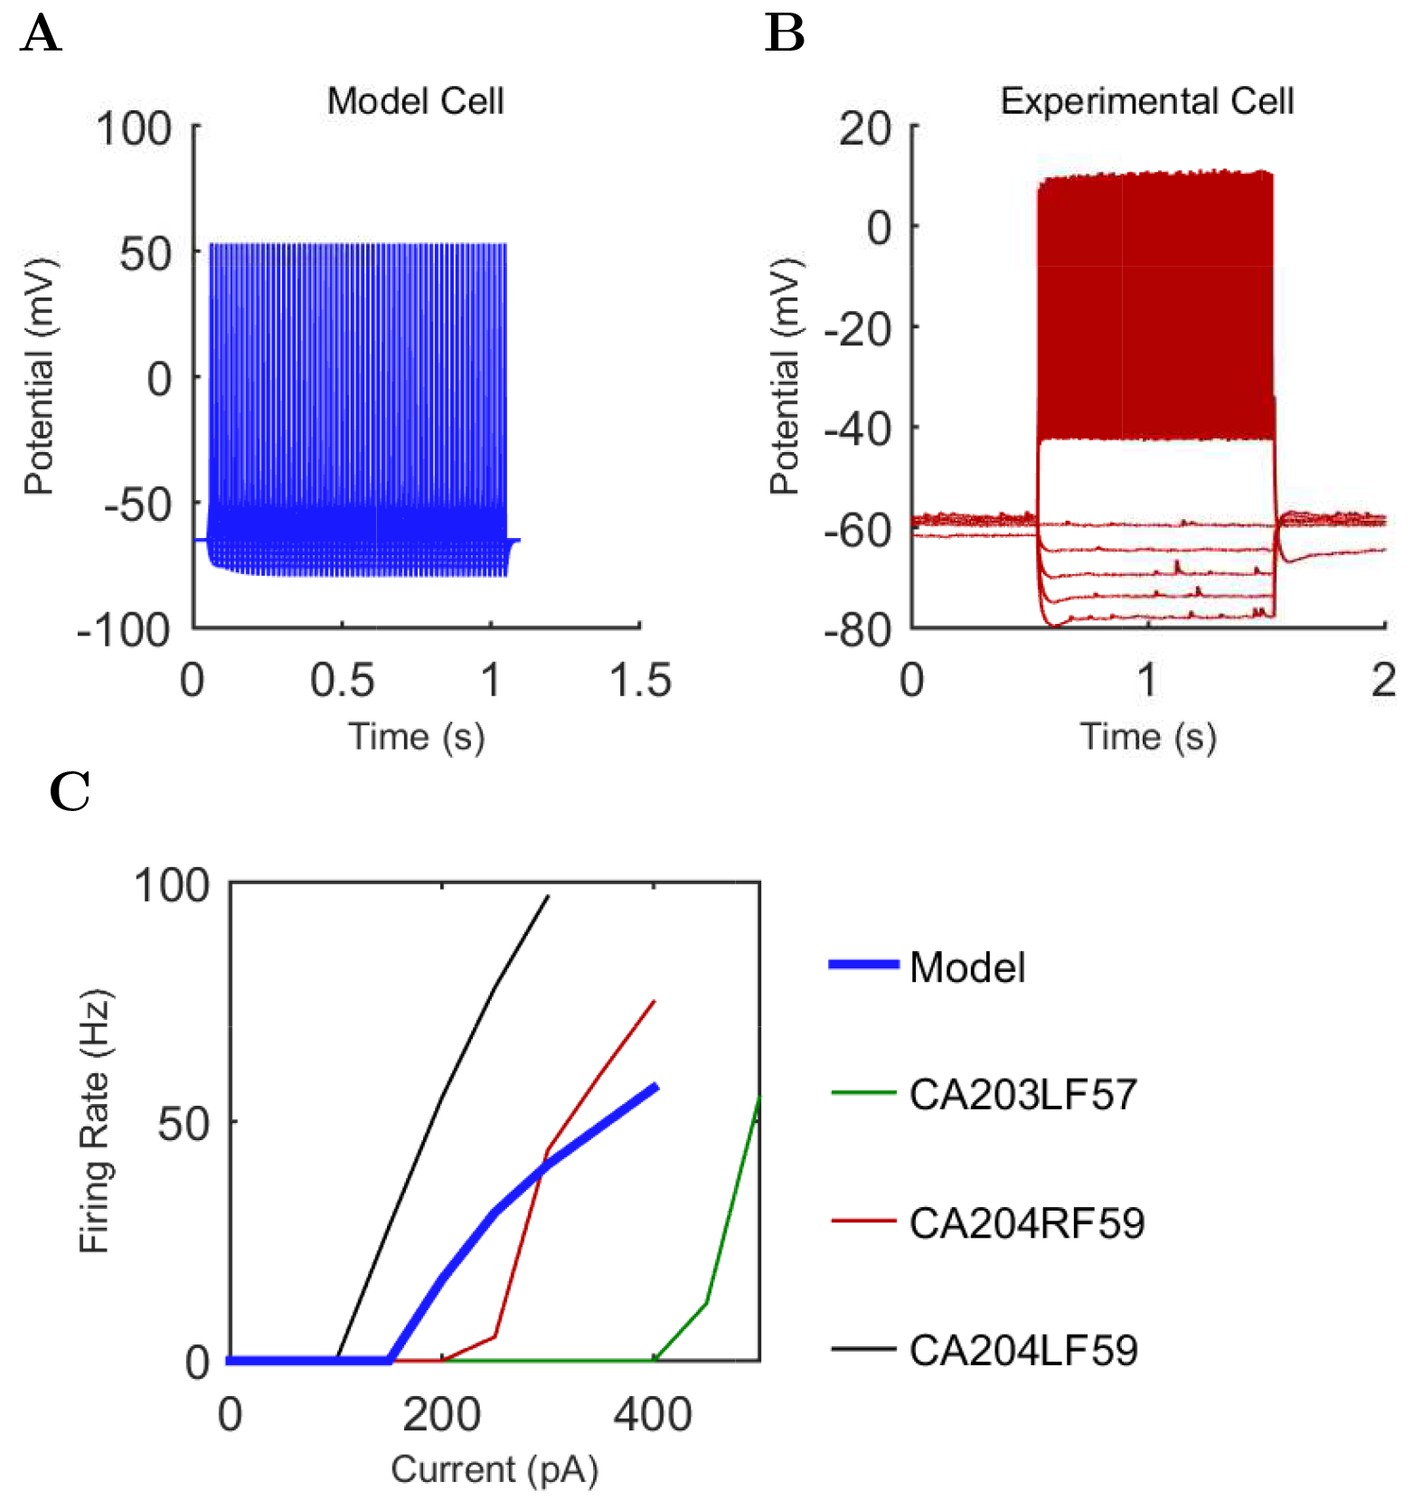
Pyramidal (A) model and (B) experimental current sweep.
(C) Firing rates of model and experimental cells.
Appendix 1—figure 6
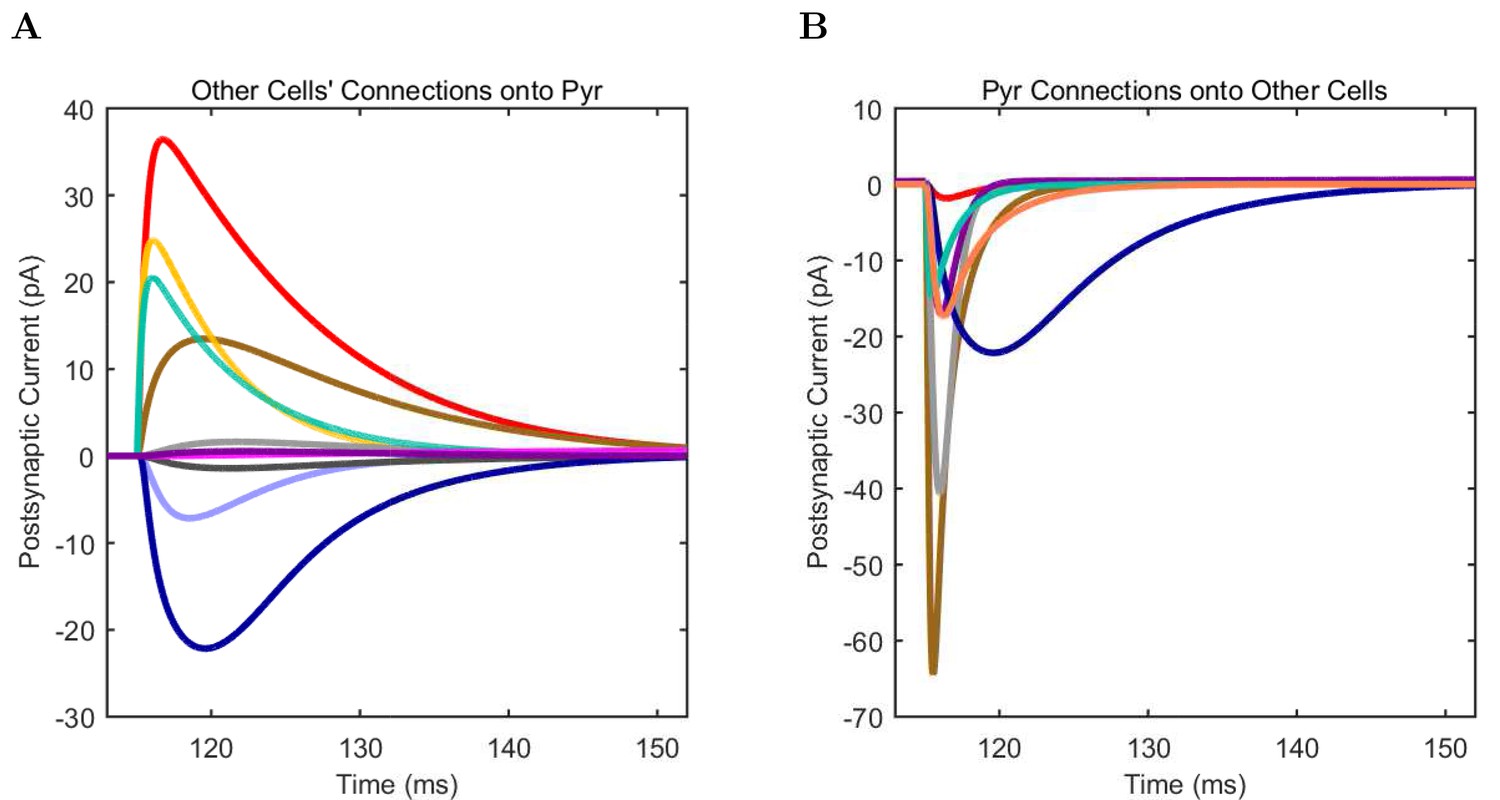
Connections onto (A) and (B) from model Pyramidal cells, under voltage clamp at −50 mV with physiological reversal potentials.
https://doi.org/10.7554/eLife.18566.081
Appendix 1—figure 7
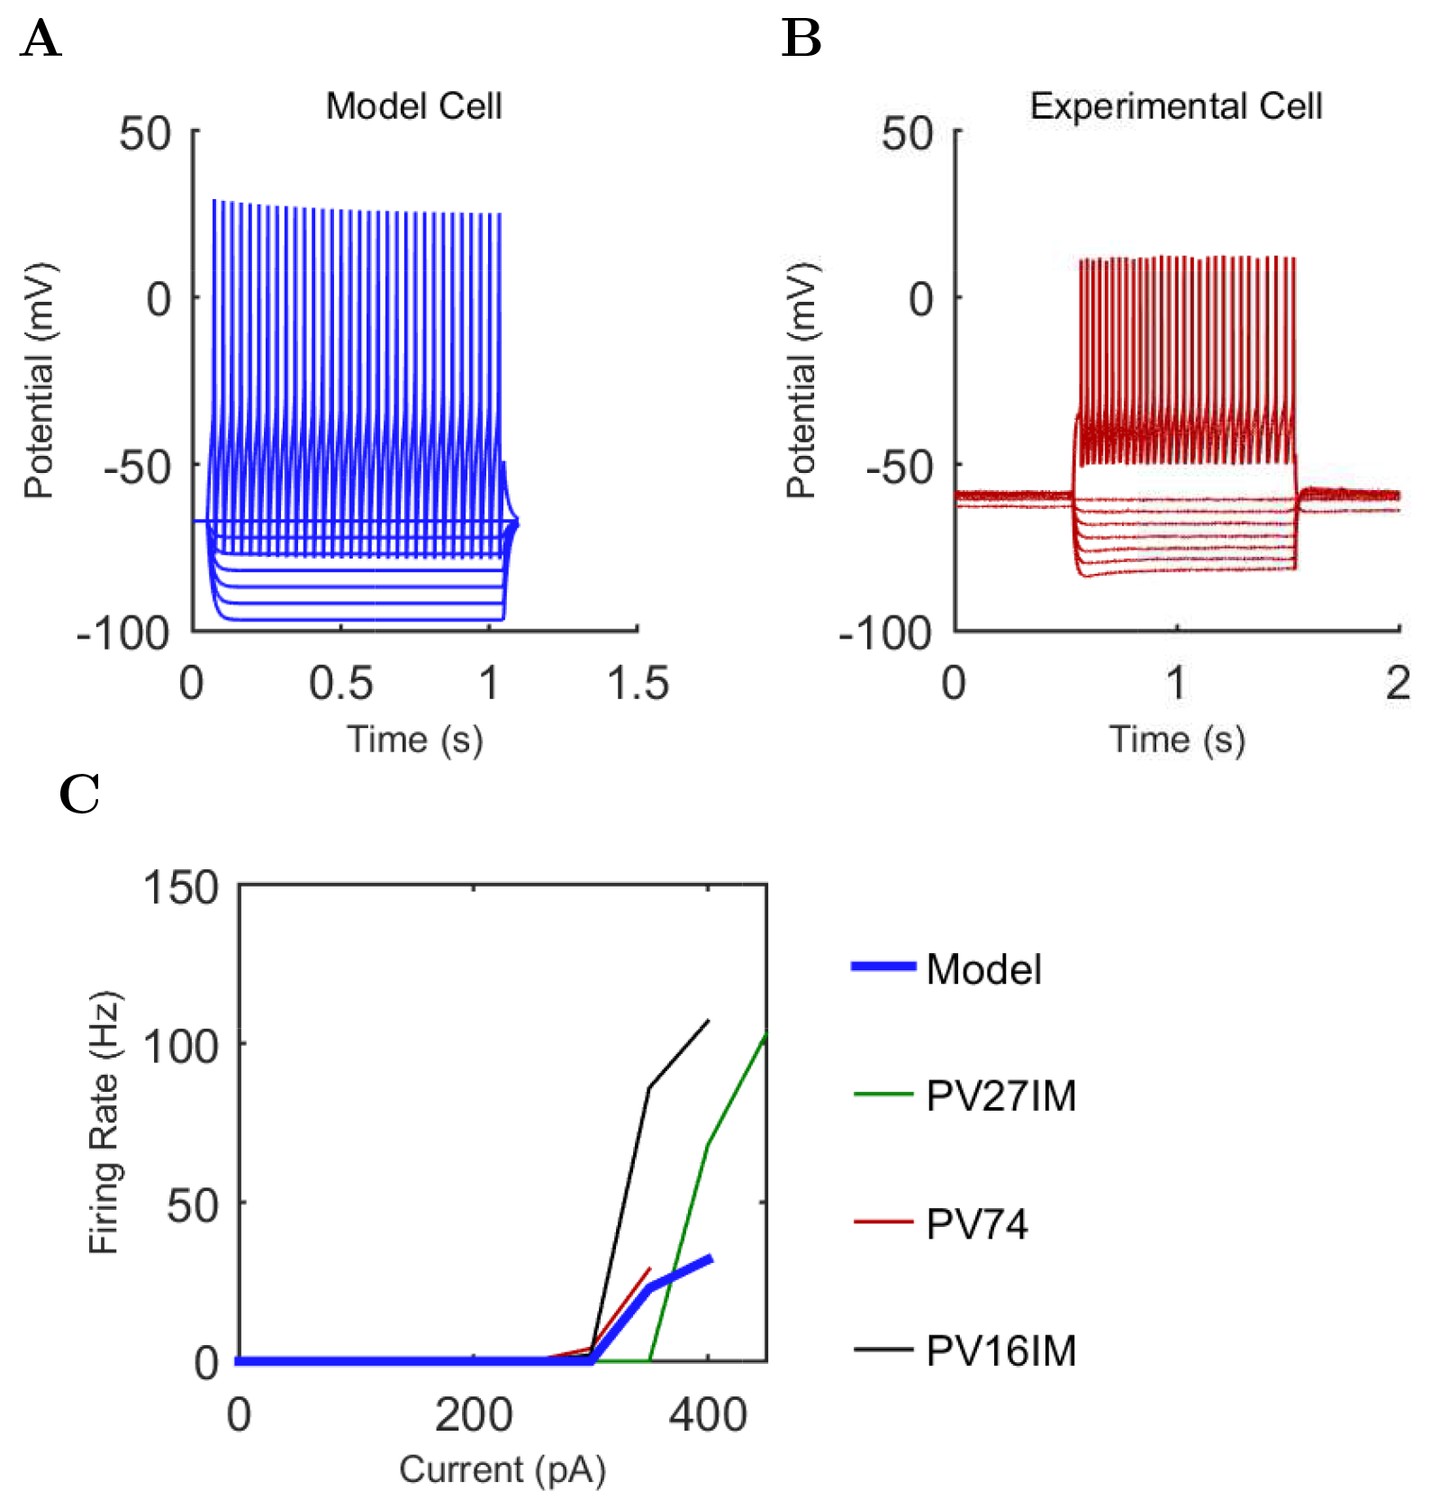
Axo-axonic (A) model and (B) experimental current sweep.
(C) Firing rates of model and experimental cells.
Appendix 1—figure 8
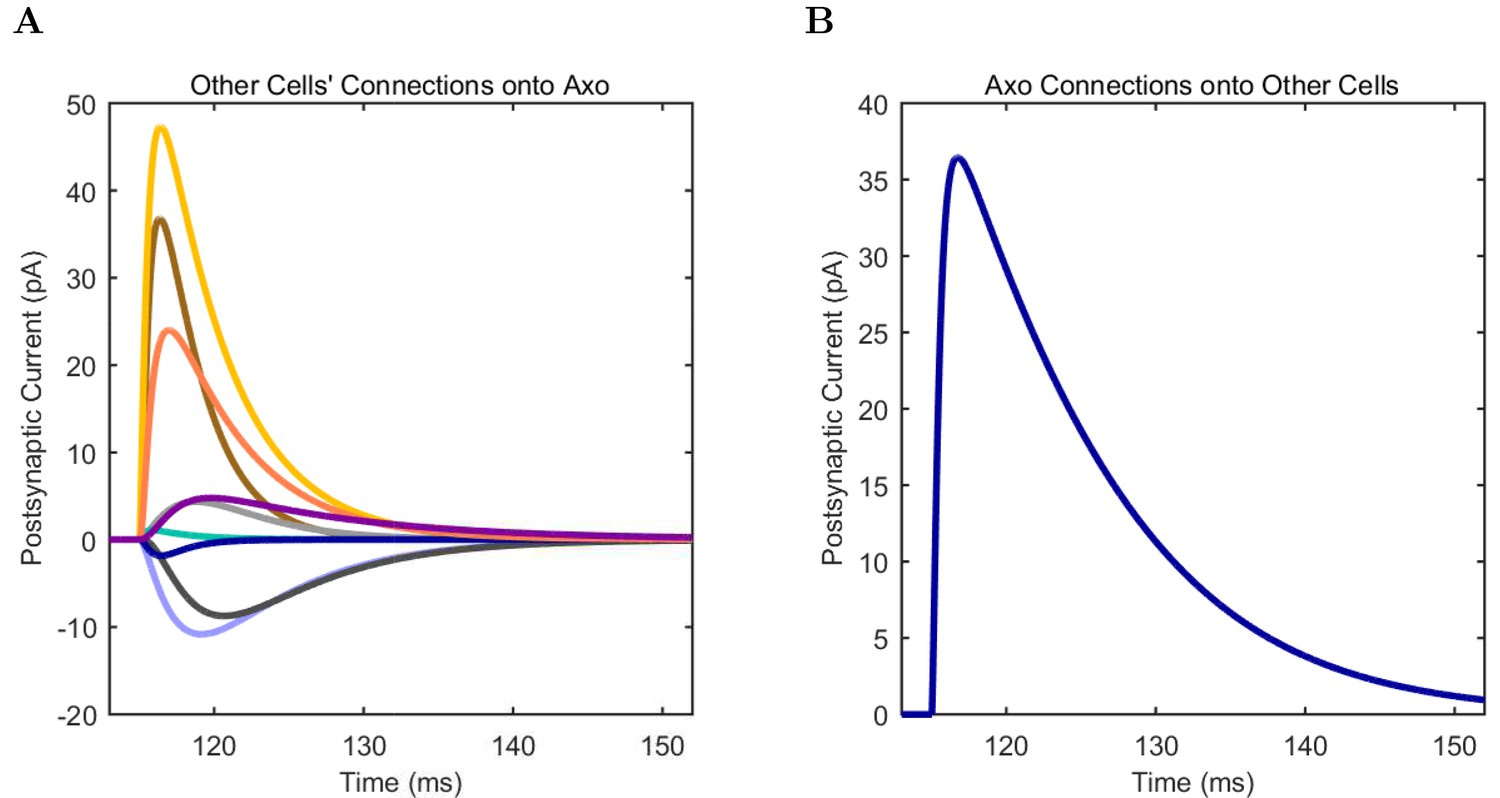
Connections onto (A) and (B) from model Axo-axonic cells, under voltage clamp at −50 mV with physiological reversal potentials.
https://doi.org/10.7554/eLife.18566.089
Appendix 1—figure 9
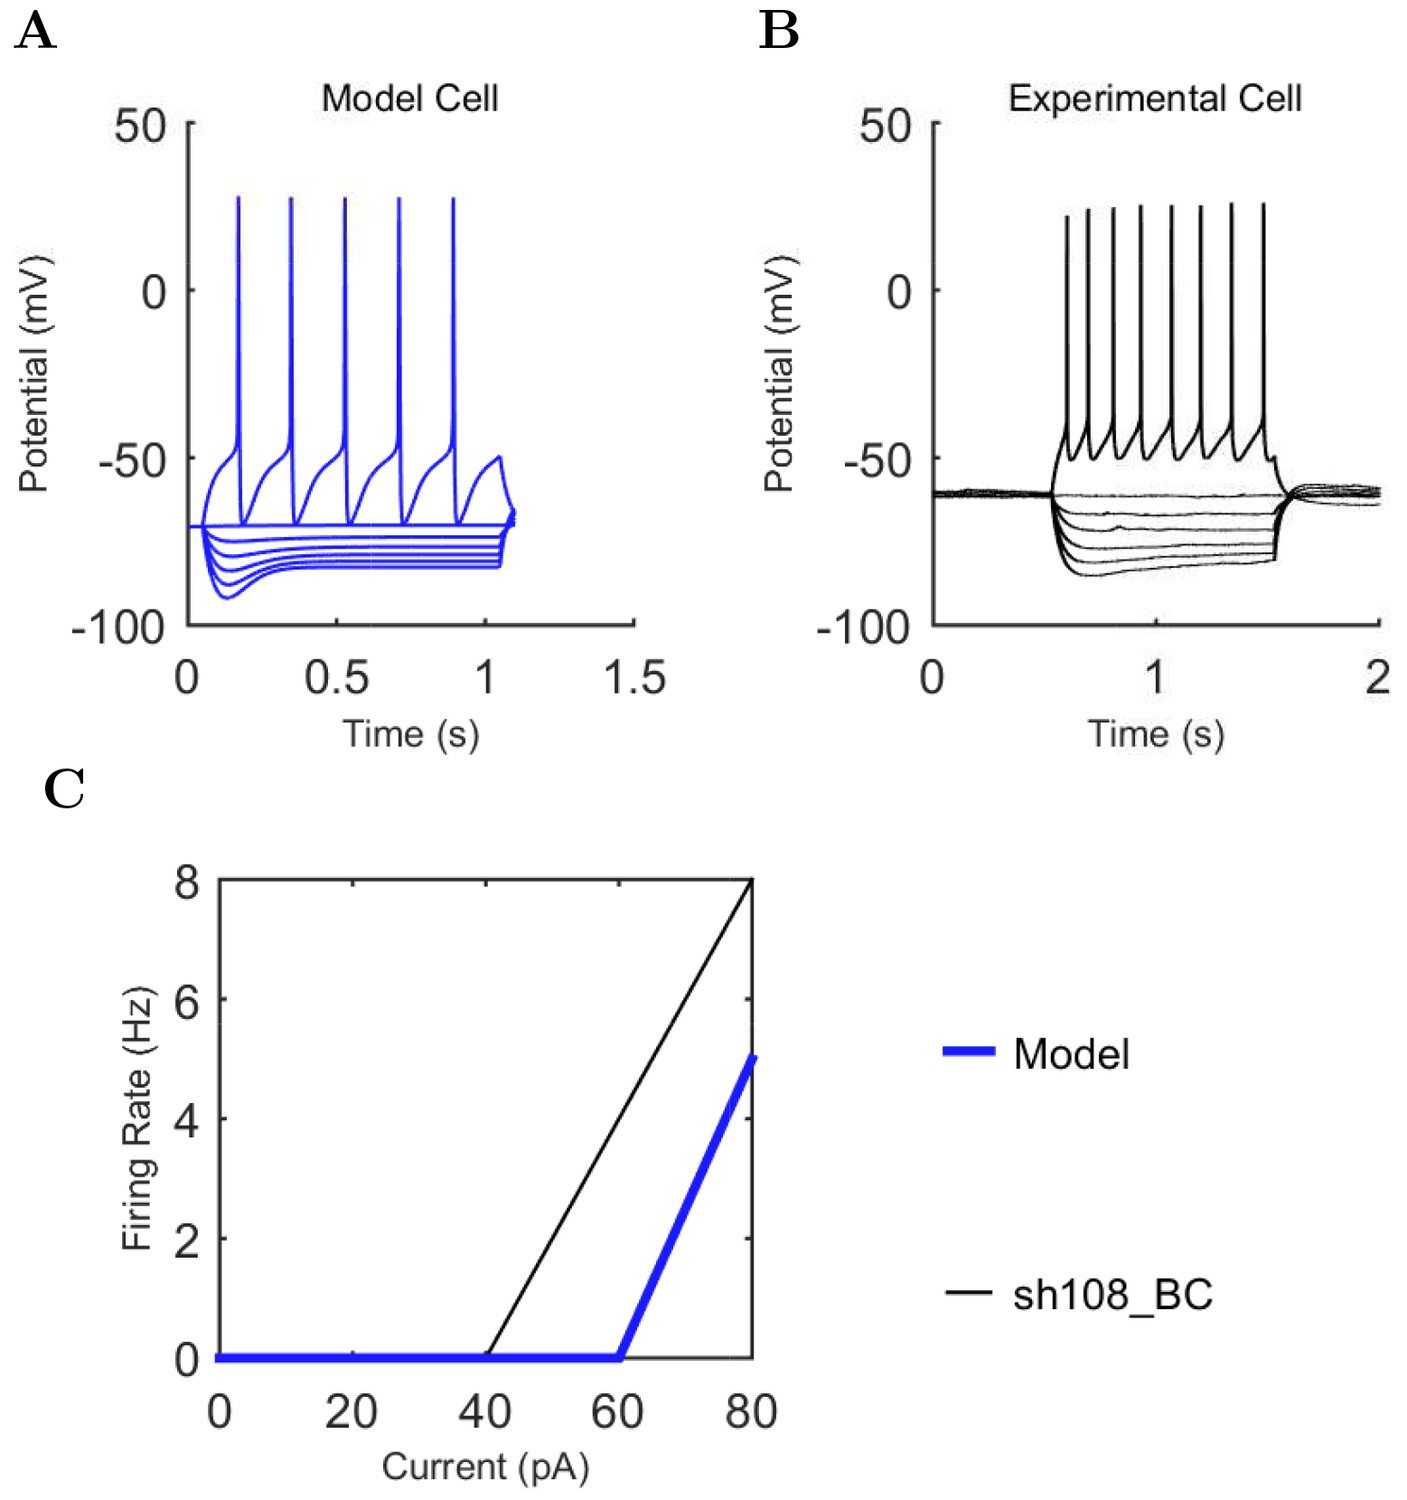
Bistratified (A) model and (B) experimental current sweep.
(C) Firing rates of model and experimental cells.
Appendix 1—figure 10
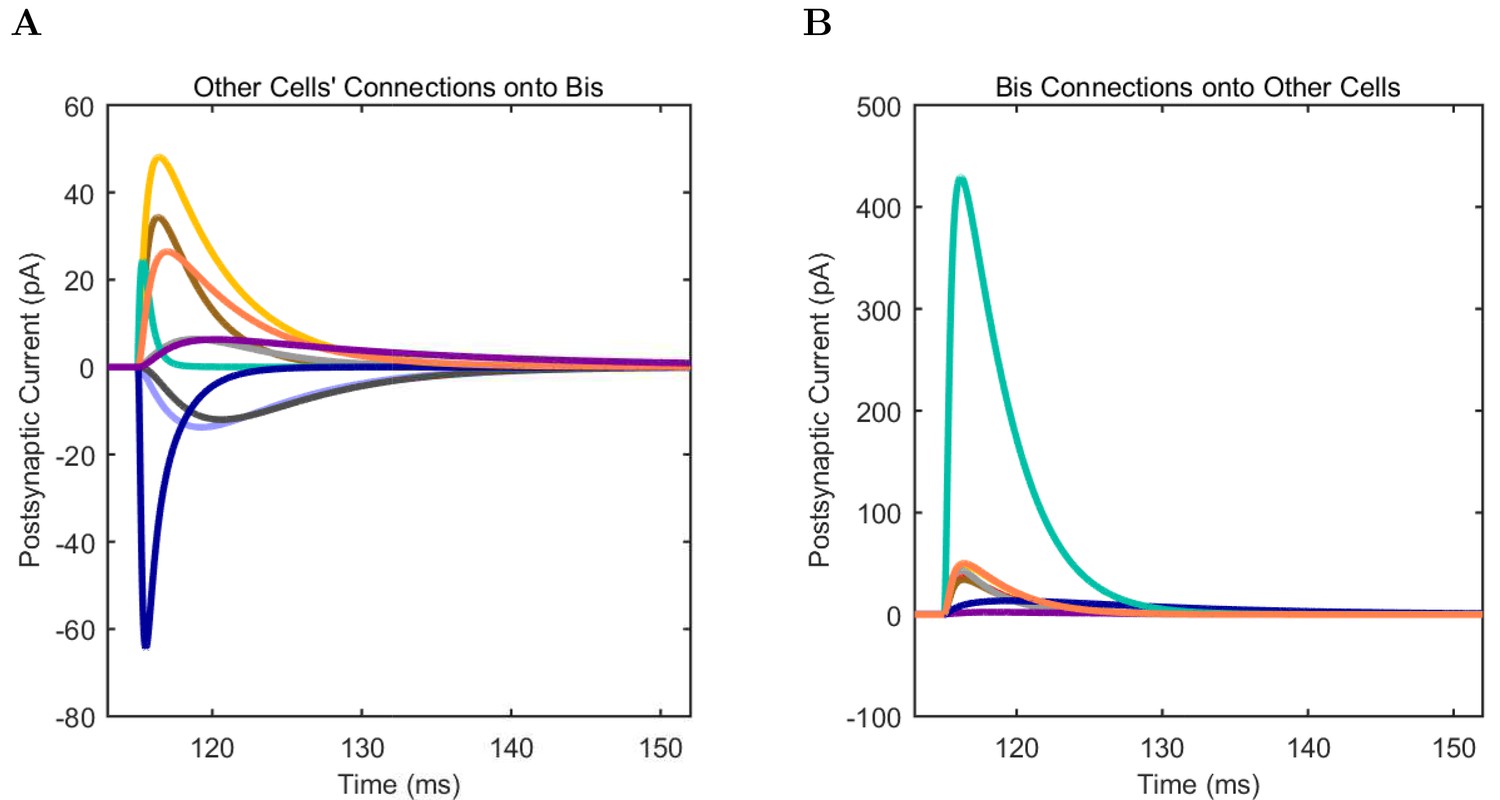
Connections onto (A) and (B) from model Bistratified cells, under voltage clamp at −50 mV with physiological reversal potentials.
https://doi.org/10.7554/eLife.18566.098
Appendix 1—figure 11
CCK+ Basket (A) model and (B) experimental current sweep.
(C) Firing rates of model and experimental cells.
Appendix 1—figure 12
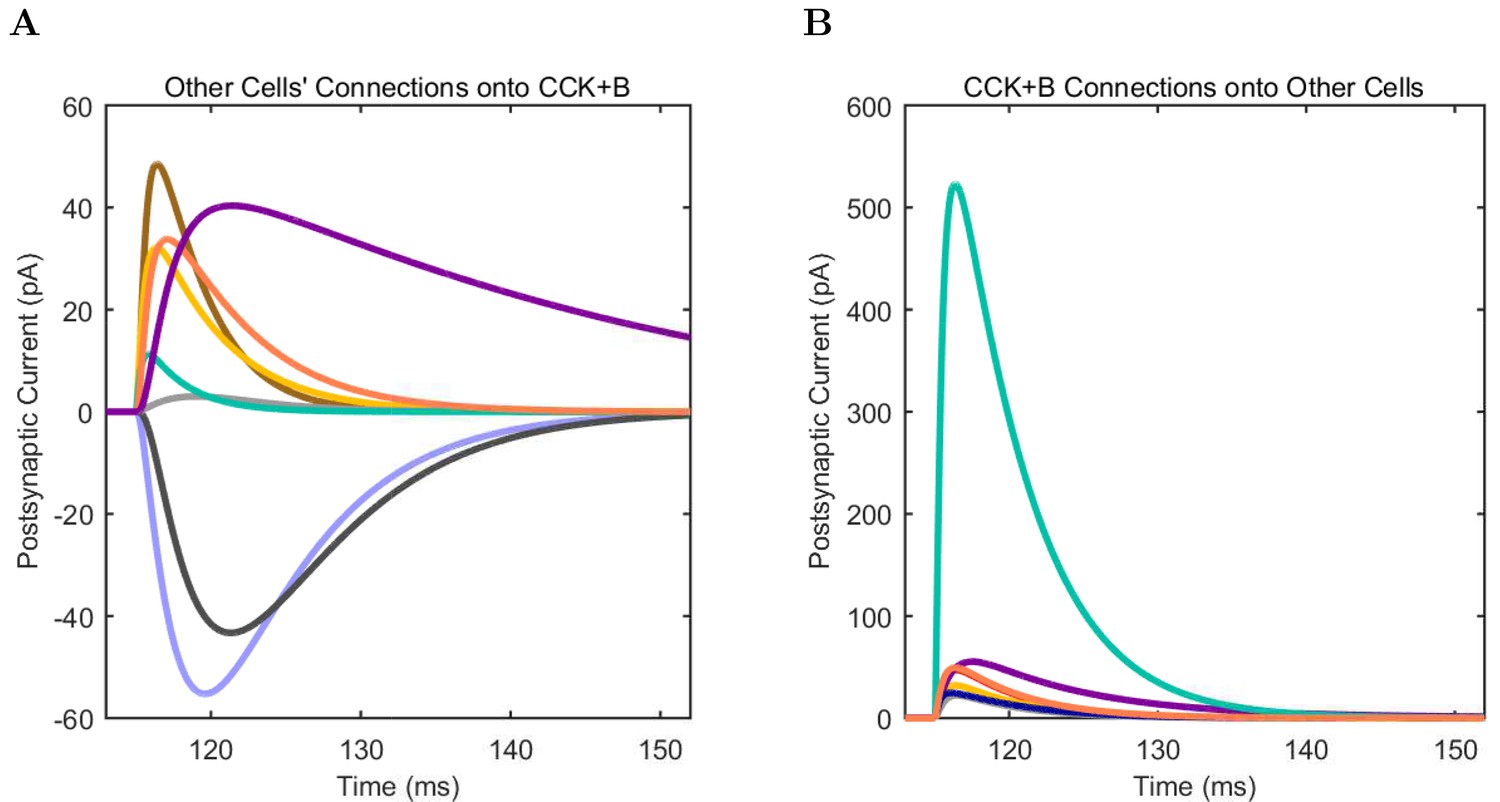
Connections onto (A) and (B) from model CCK+ Basket cells, under voltage clamp at −50 mV with physiological reversal potentials.
https://doi.org/10.7554/eLife.18566.106
Appendix 1—figure 13
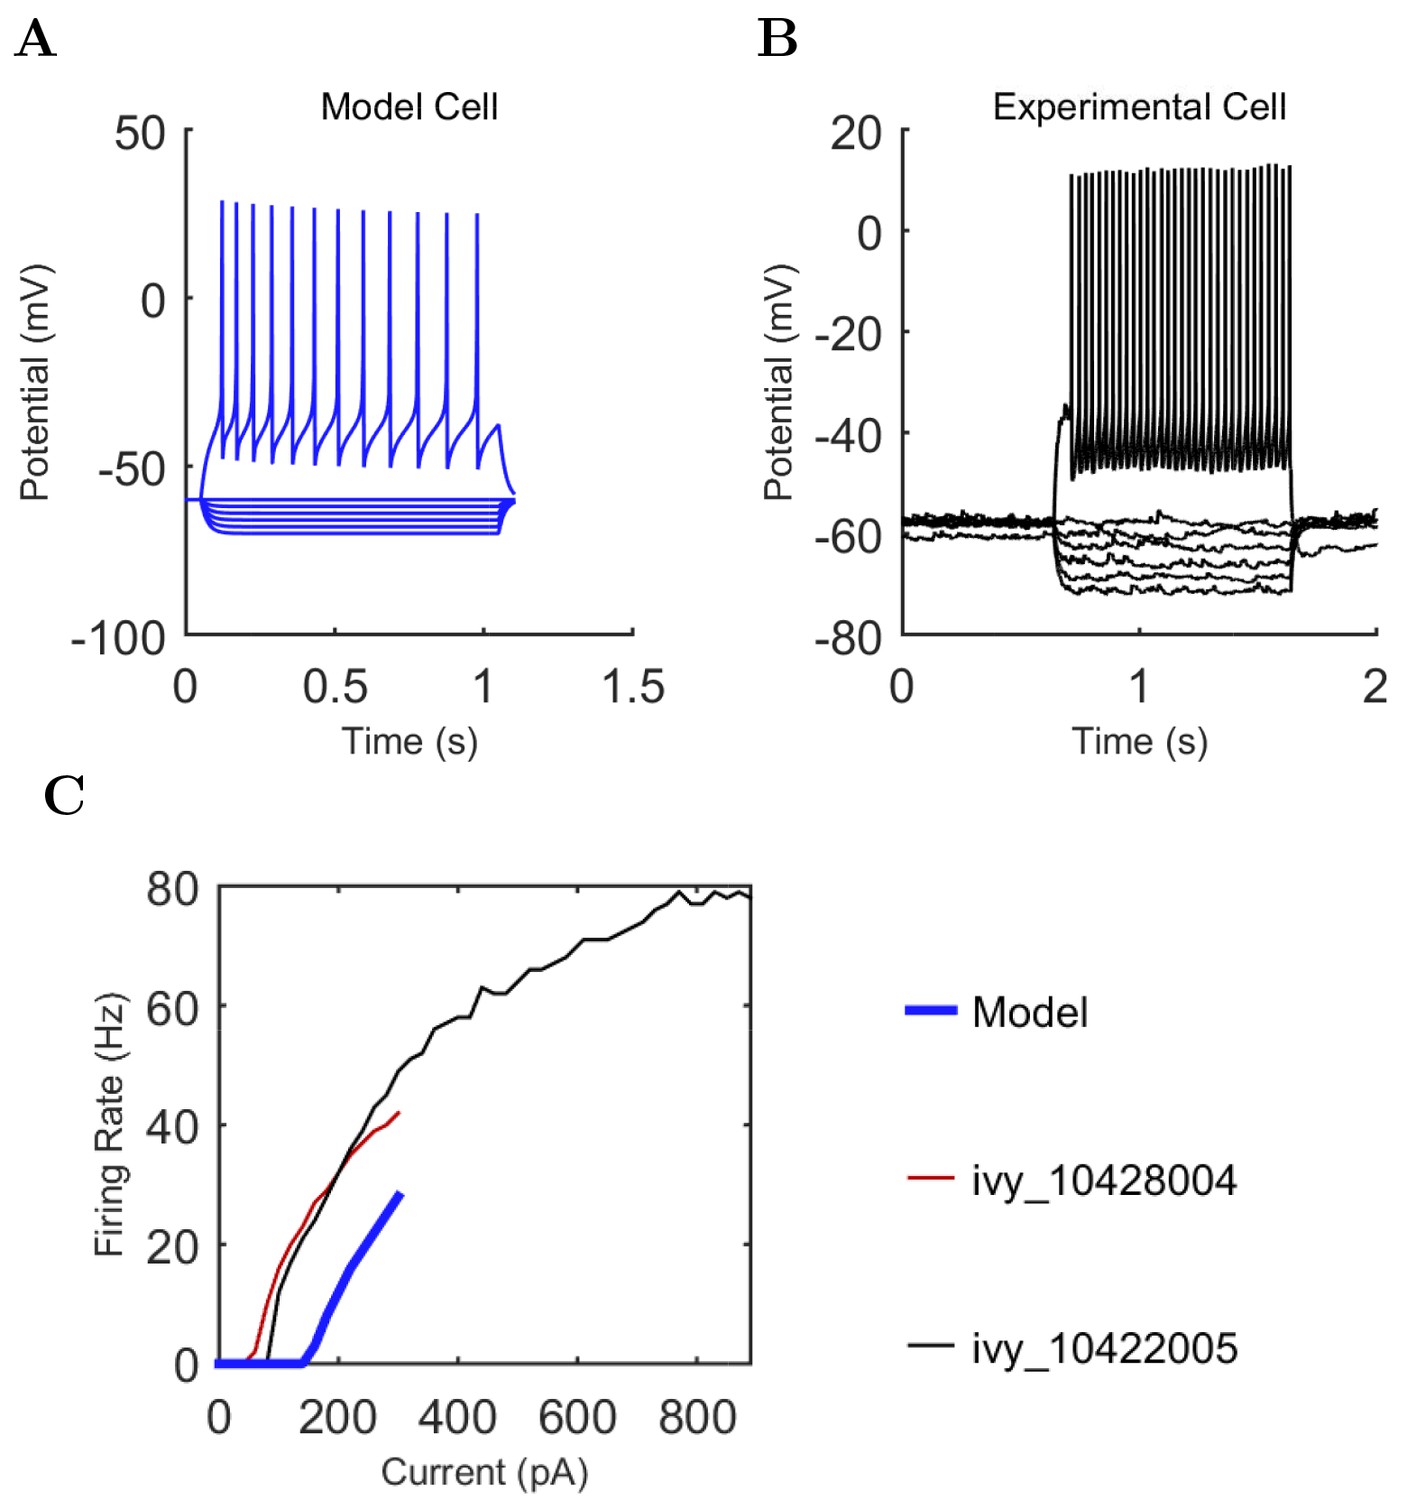
Ivy (A) model and (B) experimental current sweep.
(fig:ivypage:firing) Firing rates of model and experimental cells.
Appendix 1—figure 14
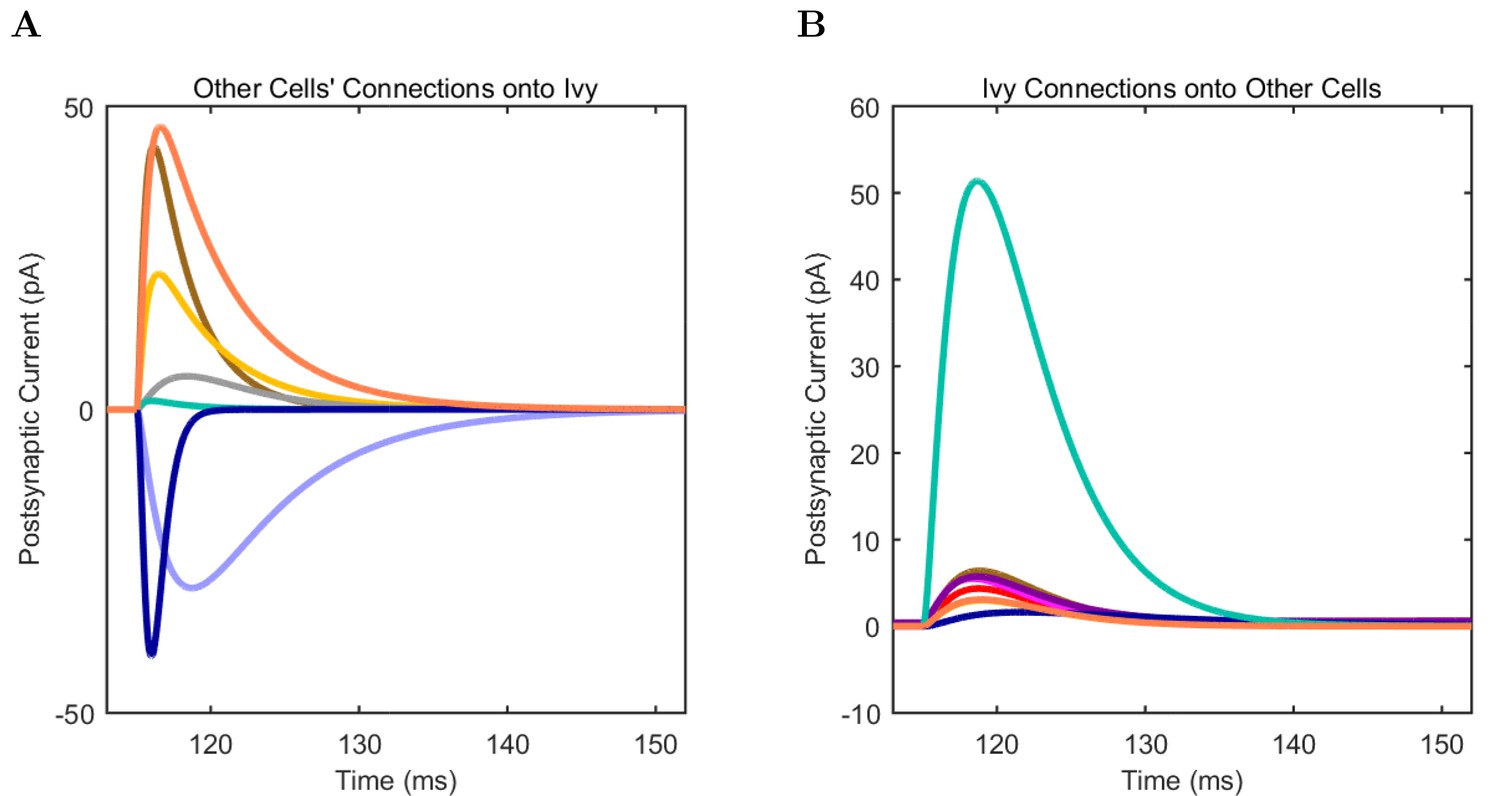
Connections onto (A) and (B) from model Ivy cells, under voltage clamp at −50 mV with physiological reversal potentials.
https://doi.org/10.7554/eLife.18566.115
Appendix 1—figure 15
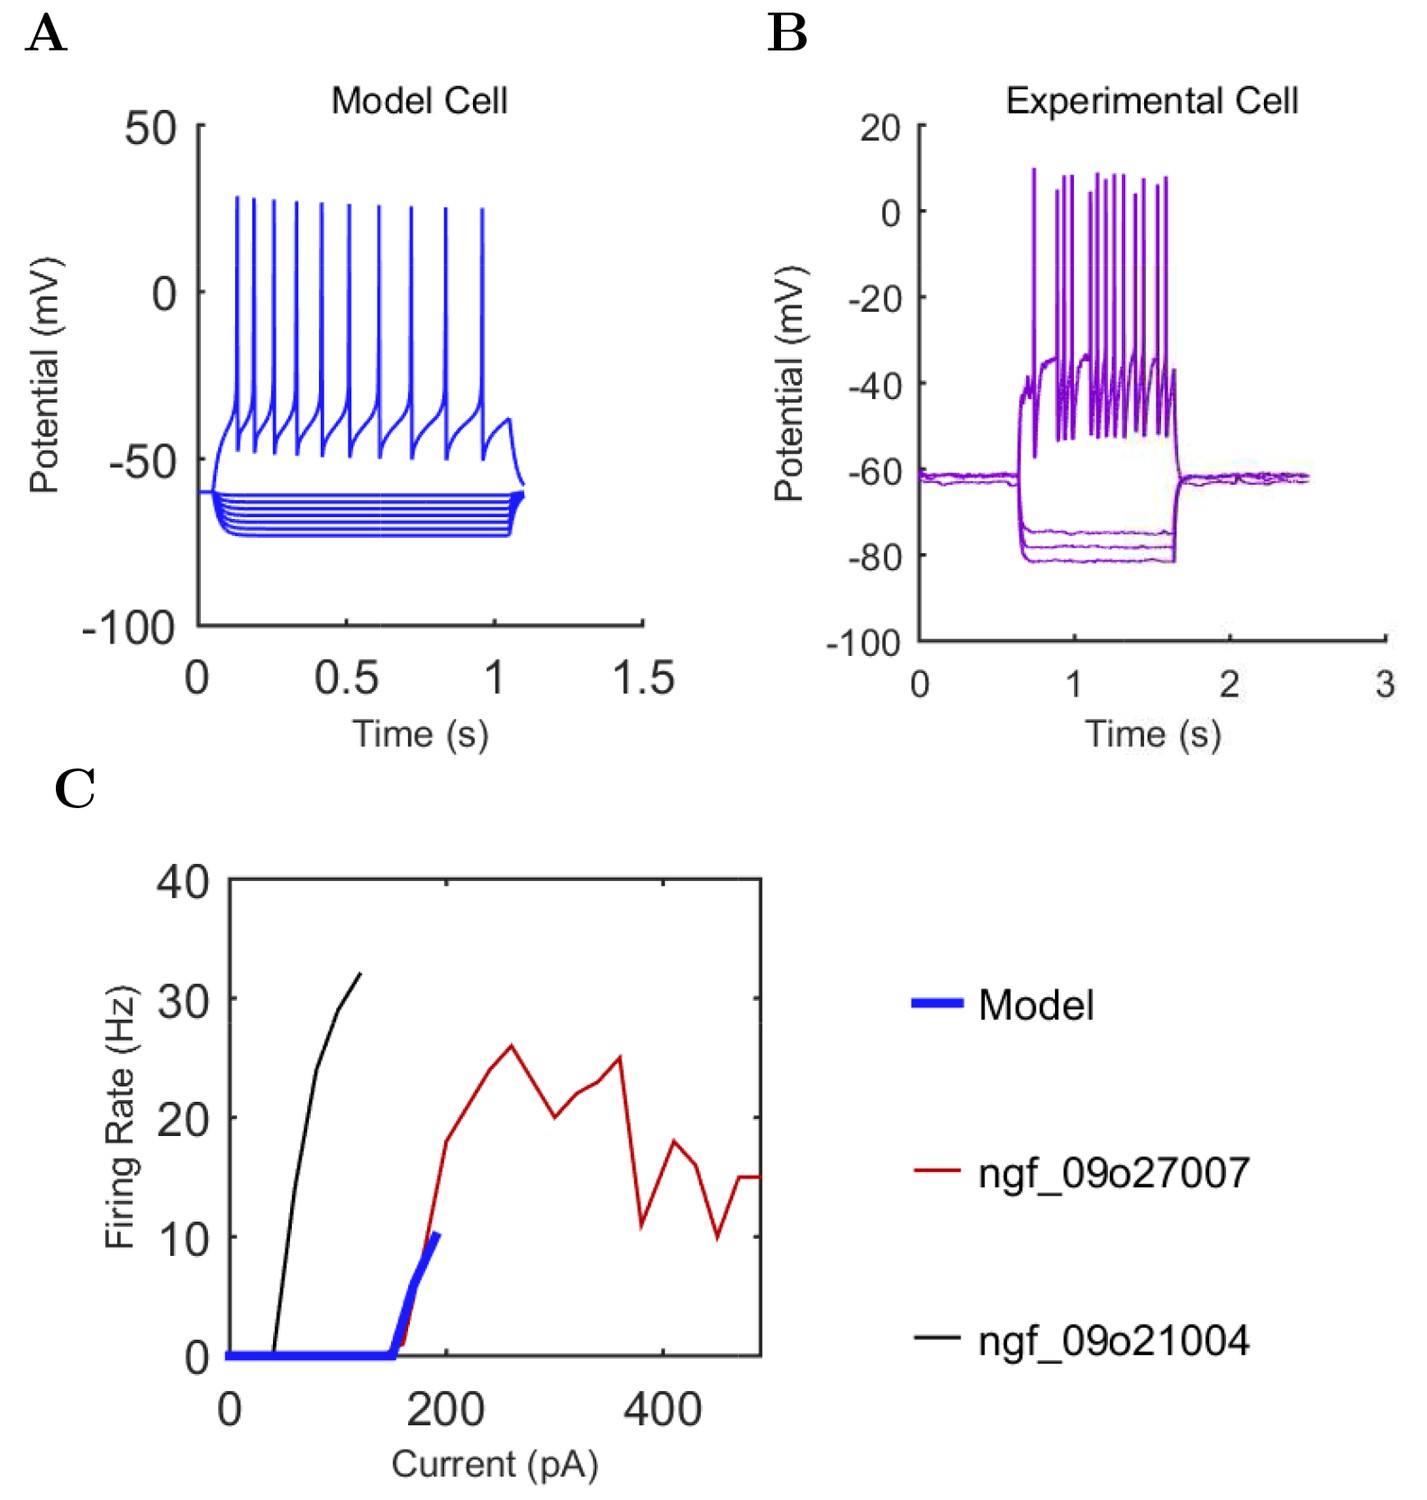
Neurogliaform (A) model and (B) experimental current sweep.
(C) Firing rates of model and experimental cells.
Appendix 1—figure 16

Connections onto (A) and (B) from model Neurogliaform cells, under voltage clamp at −50 mV with physiological reversal potentials.
https://doi.org/10.7554/eLife.18566.124
Appendix 1—figure 17
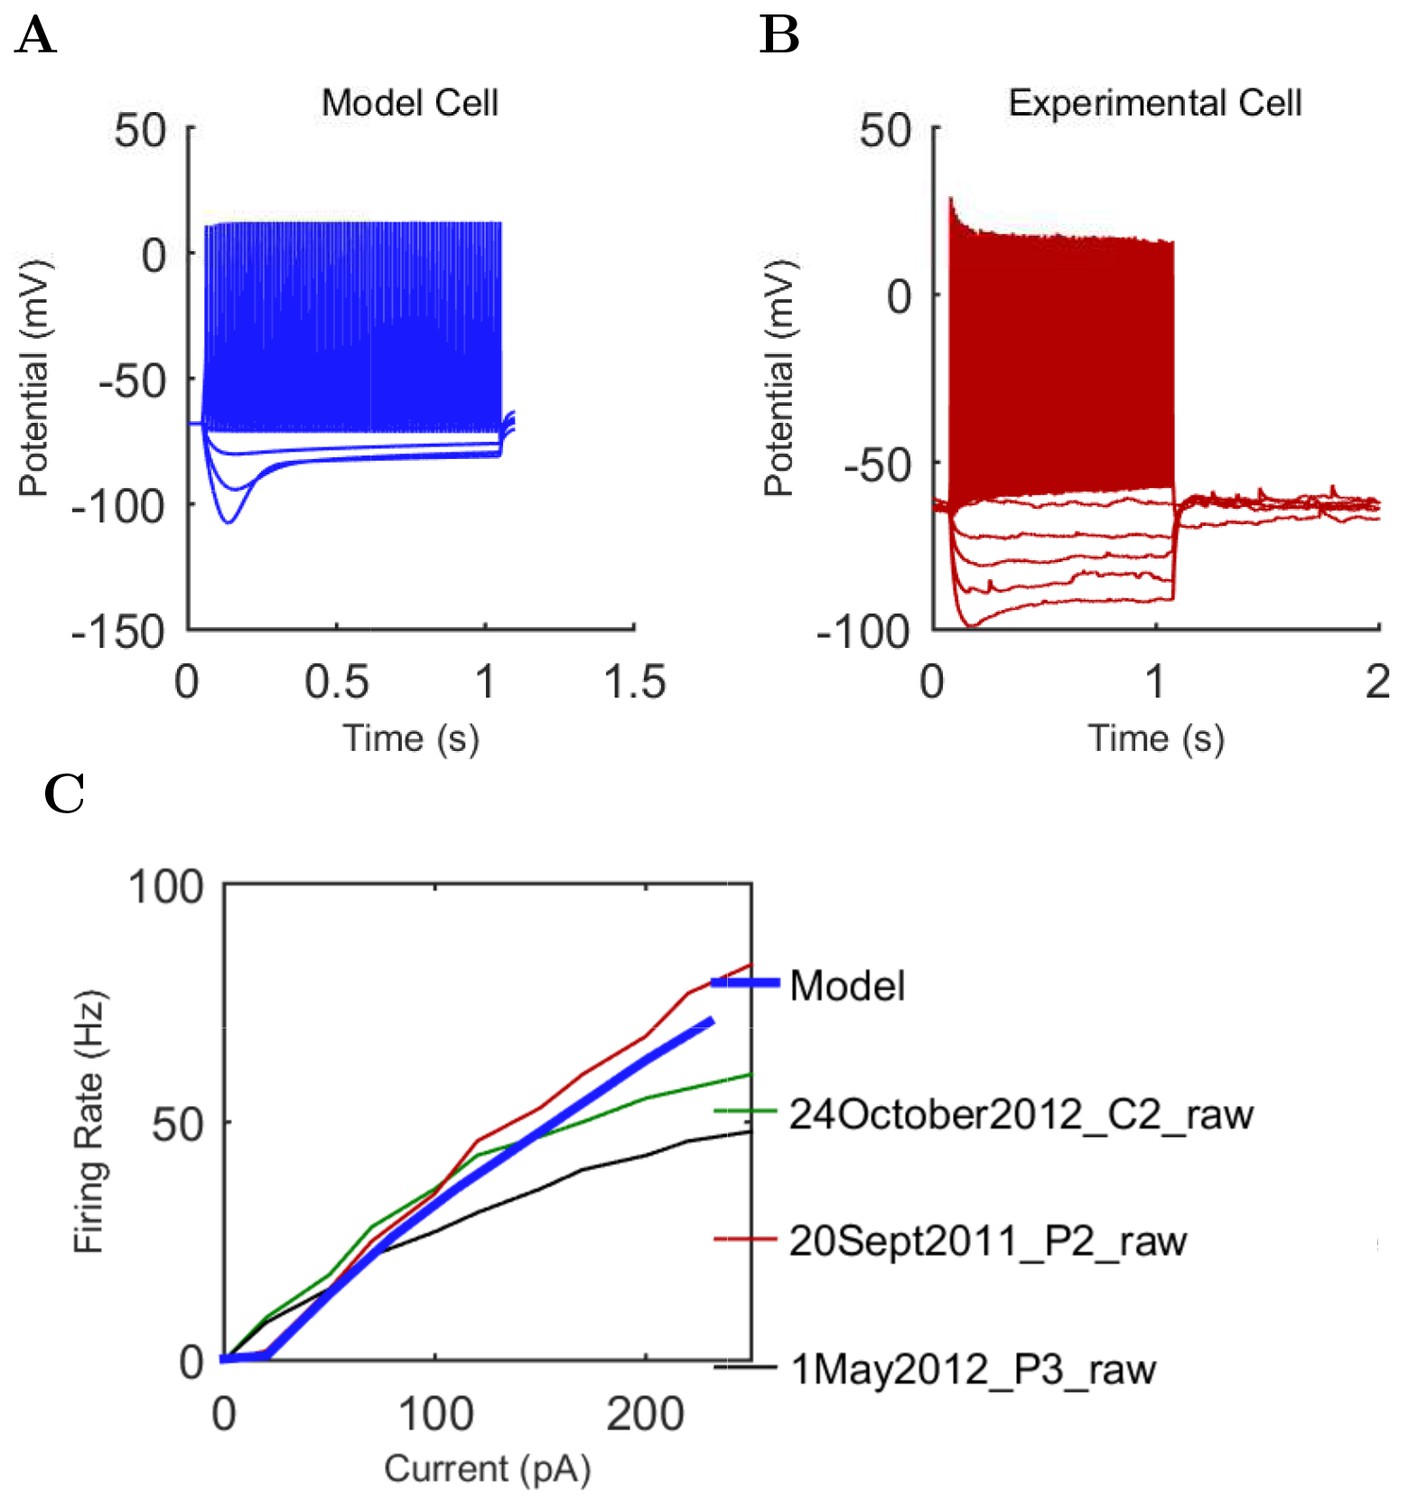
O-LM (A) model and (B) experimental current sweep.
(C) Firing rates of model and experimental cells.
Appendix 1—figure 18
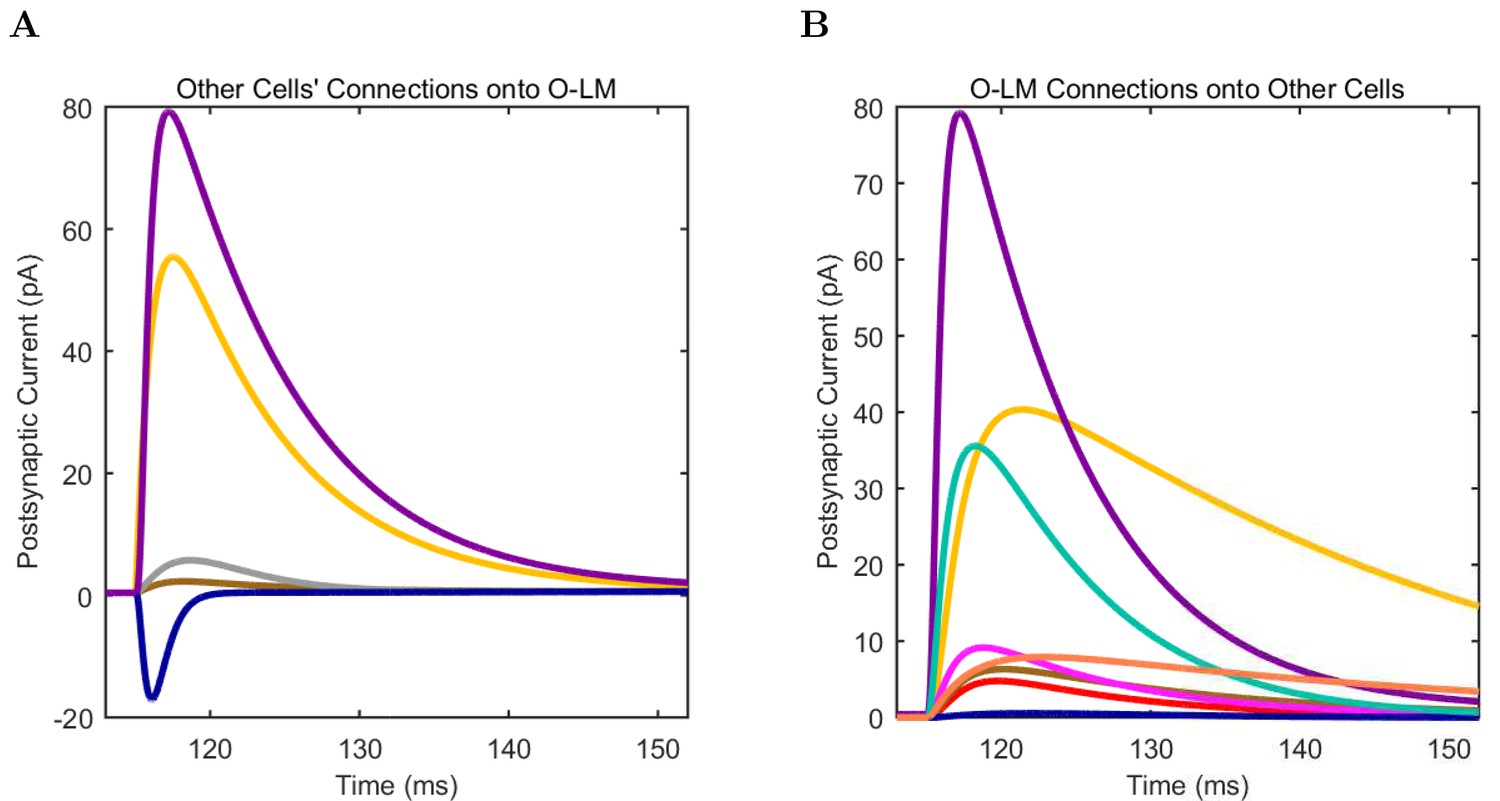
Connections onto (A) and (B) from model O-LM cells, under voltage clamp at −50 mV with physiological reversal potentials.
https://doi.org/10.7554/eLife.18566.132
Appendix 1—figure 19
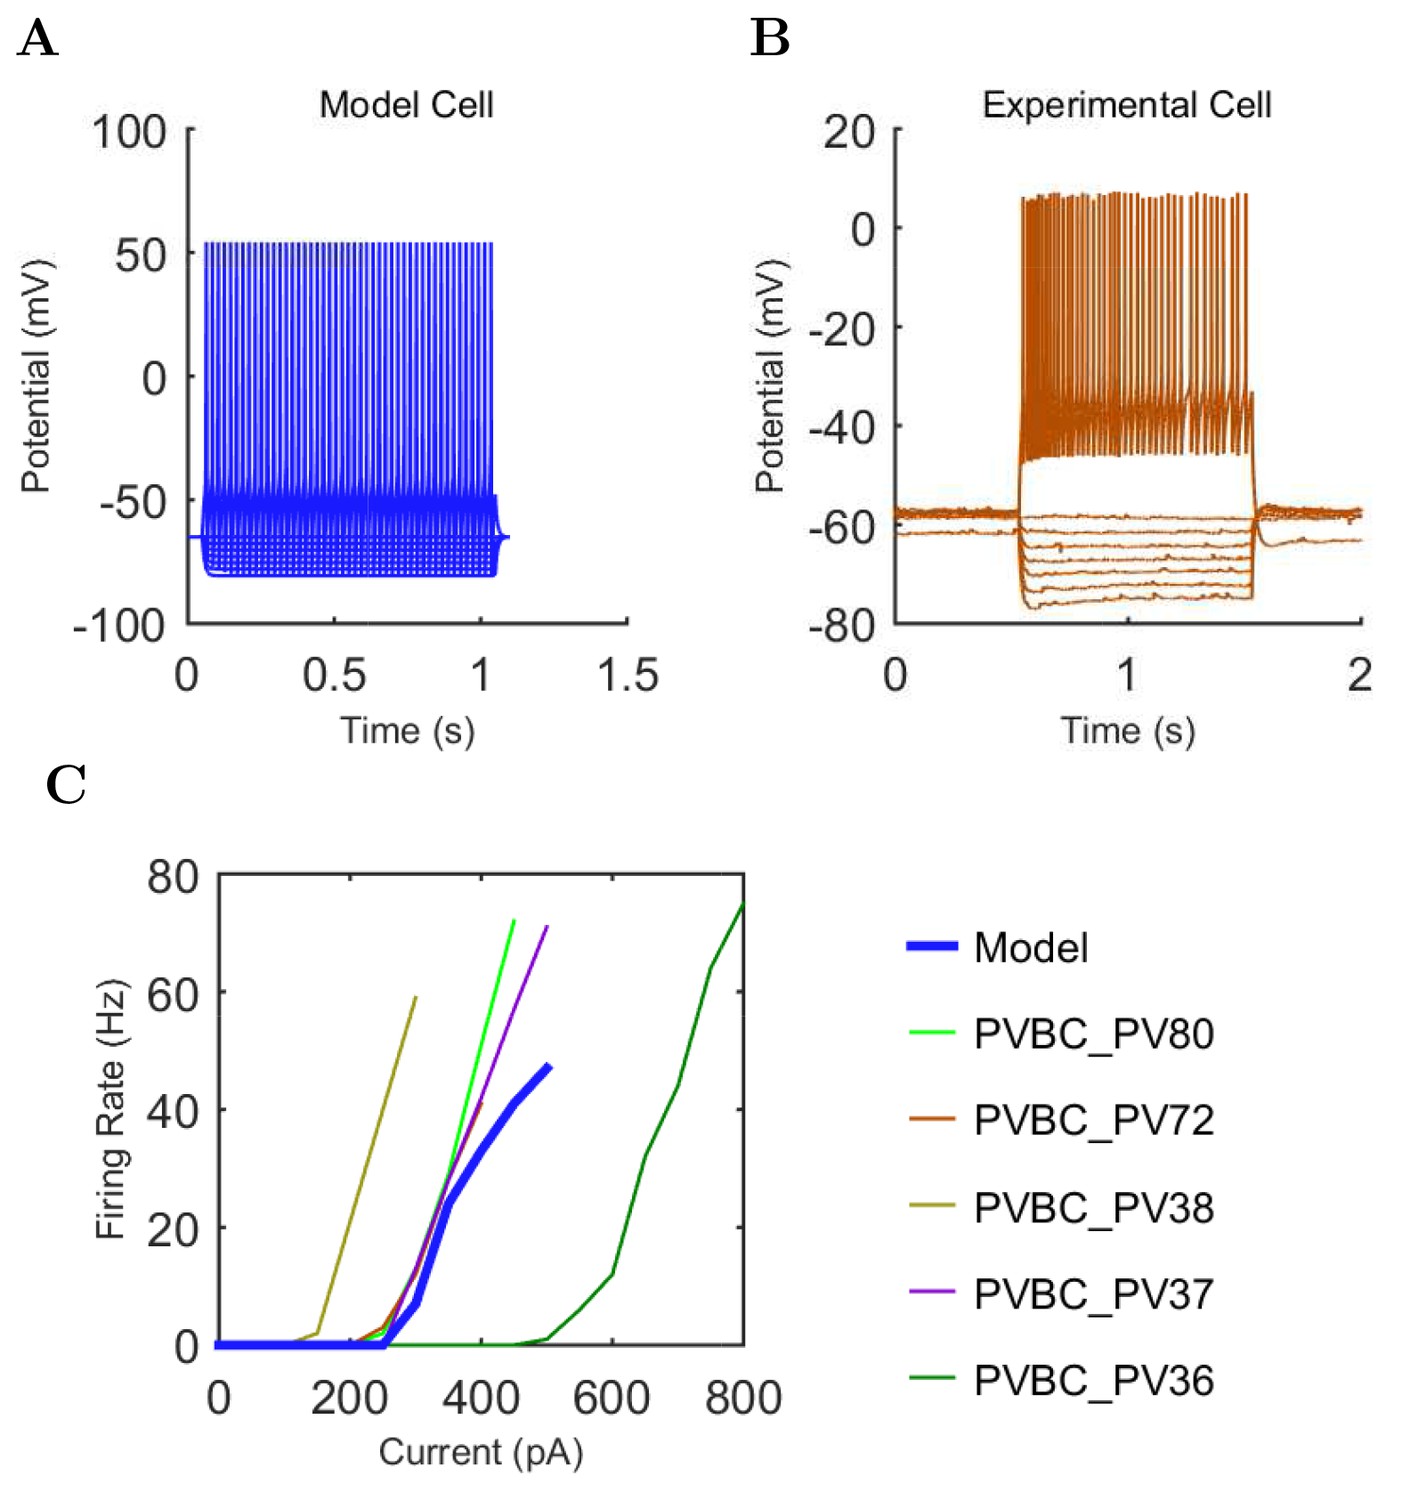
PV+ Basket (A) model and (B) experimental current sweep.
(C) Firing rates of model and experimental cells.
Appendix 1—figure 20

Connections onto (A) and (B) from model PV+ Basket cells, under voltage clamp at −50 mV with physiological reversal potentials.
https://doi.org/10.7554/eLife.18566.141
Appendix 1—figure 21
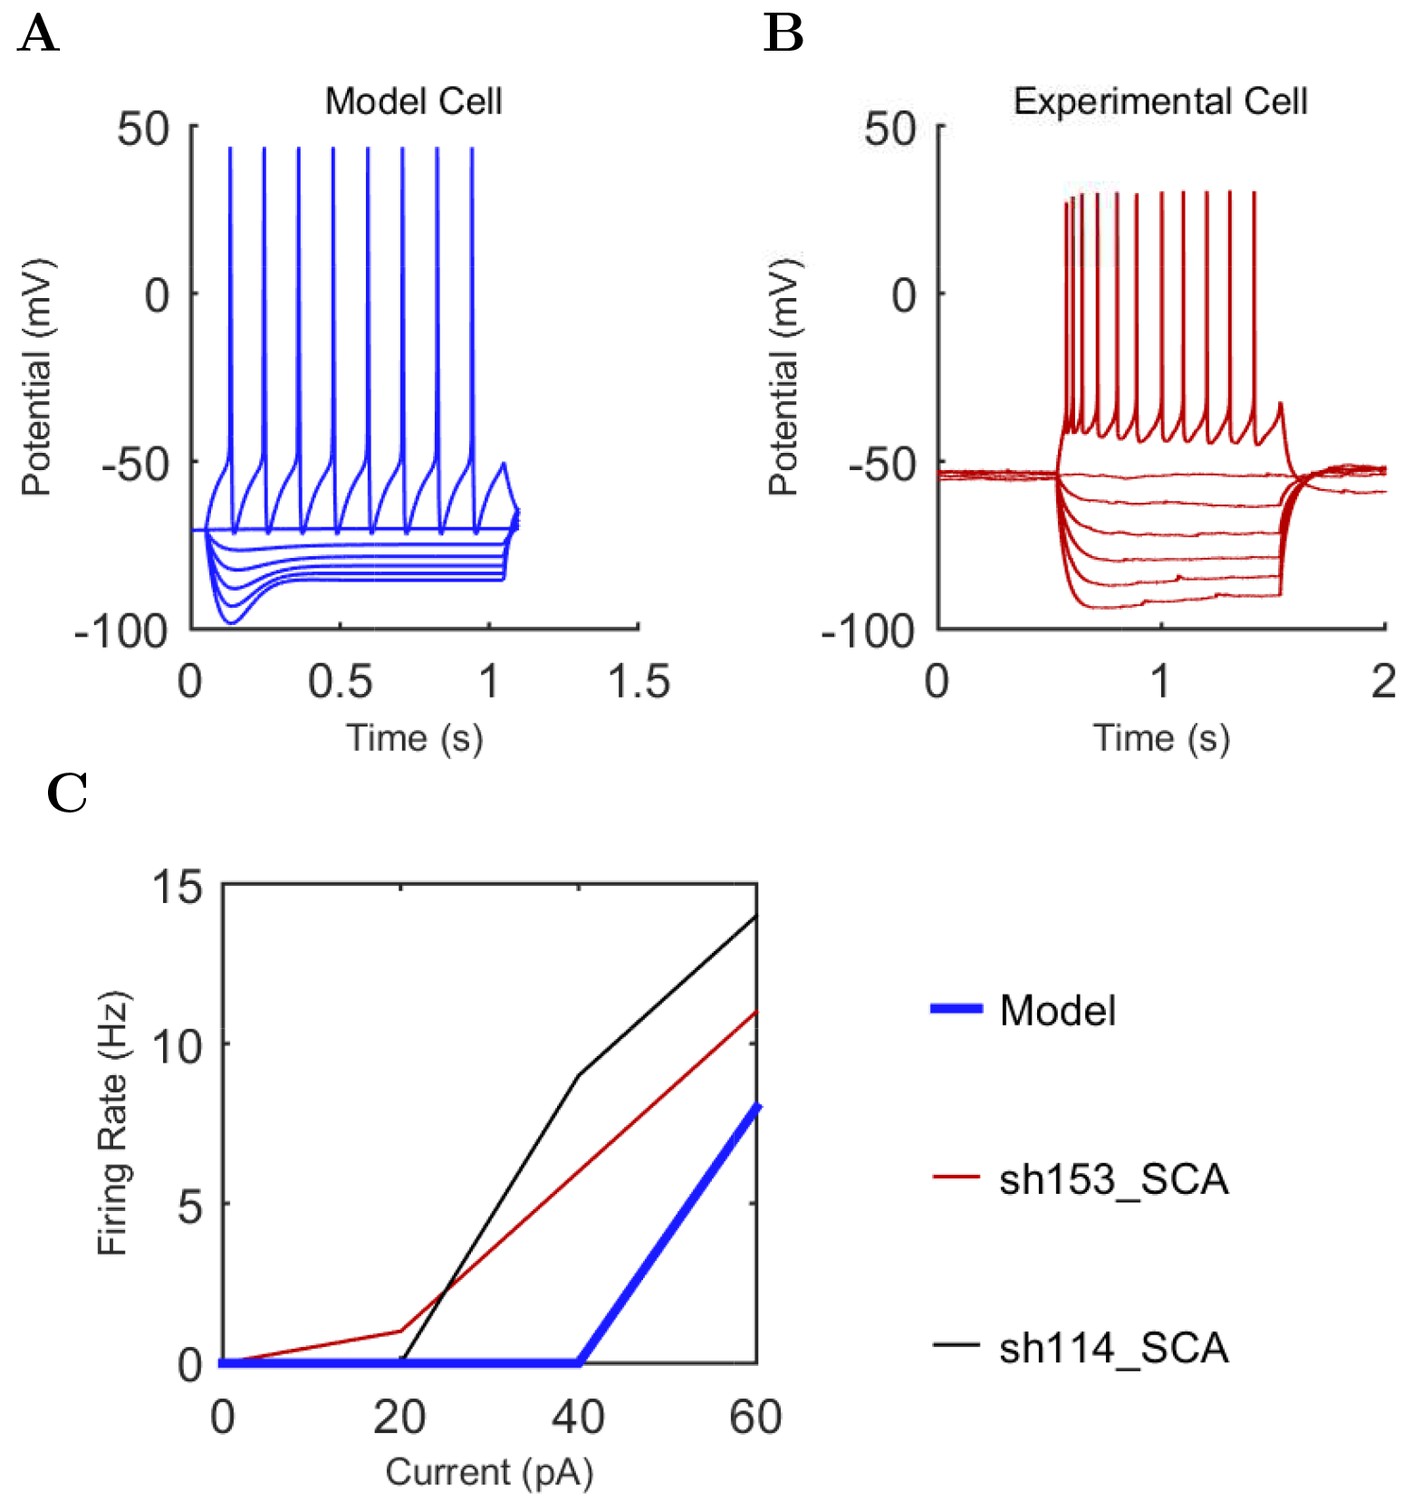
Schaffer Collateral-Associated (A) model and (B) experimental current sweep.
(C) Firing rates of model and experimental cells.
Appendix 1—figure 22
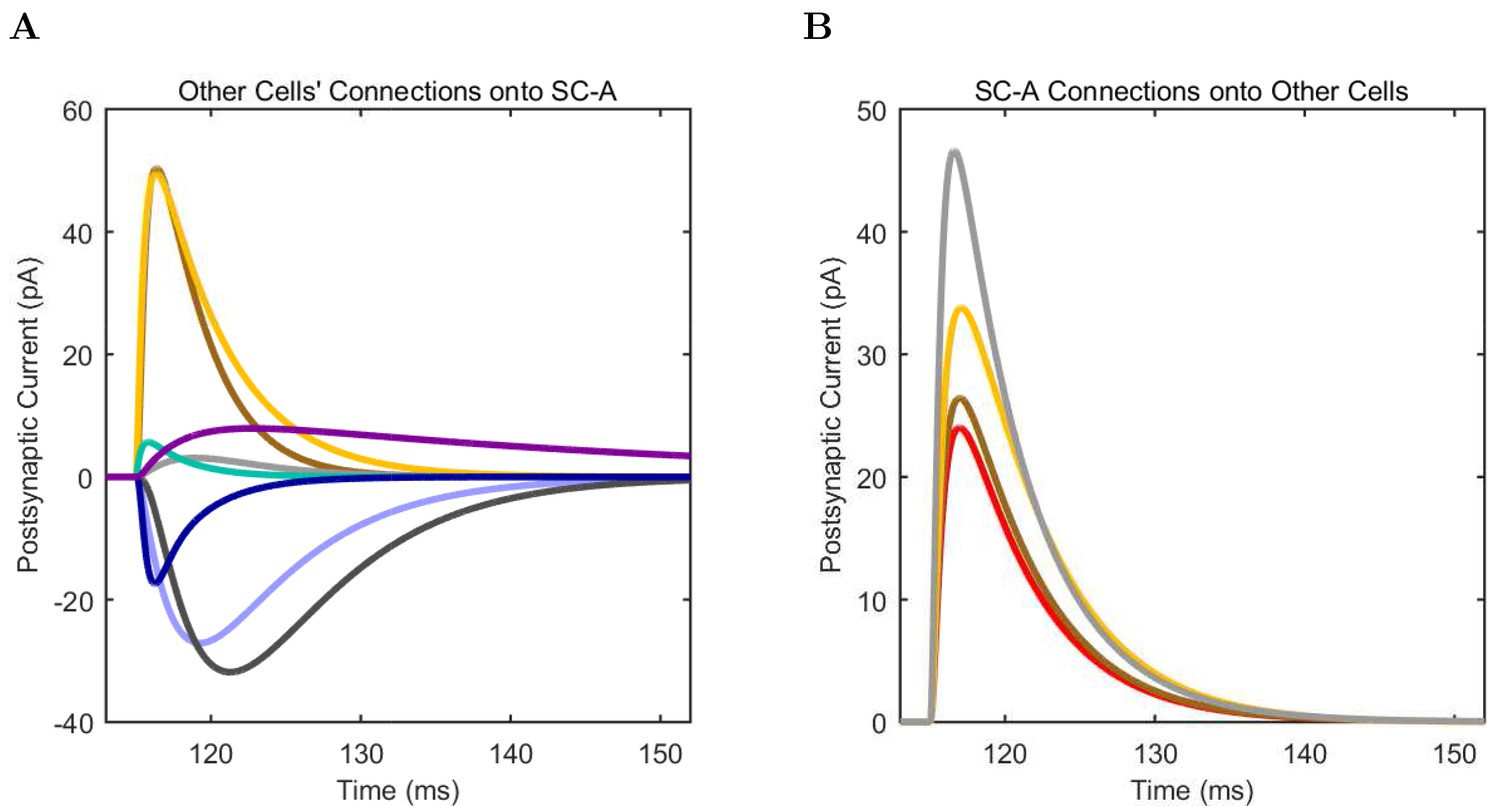
Connections onto (A) and (B) from model Schaffer Collateral-Associated cells, under voltage clamp at −50 mV with physiological reversal potentials.
https://doi.org/10.7554/eLife.18566.150
Appendix 1—figure 23
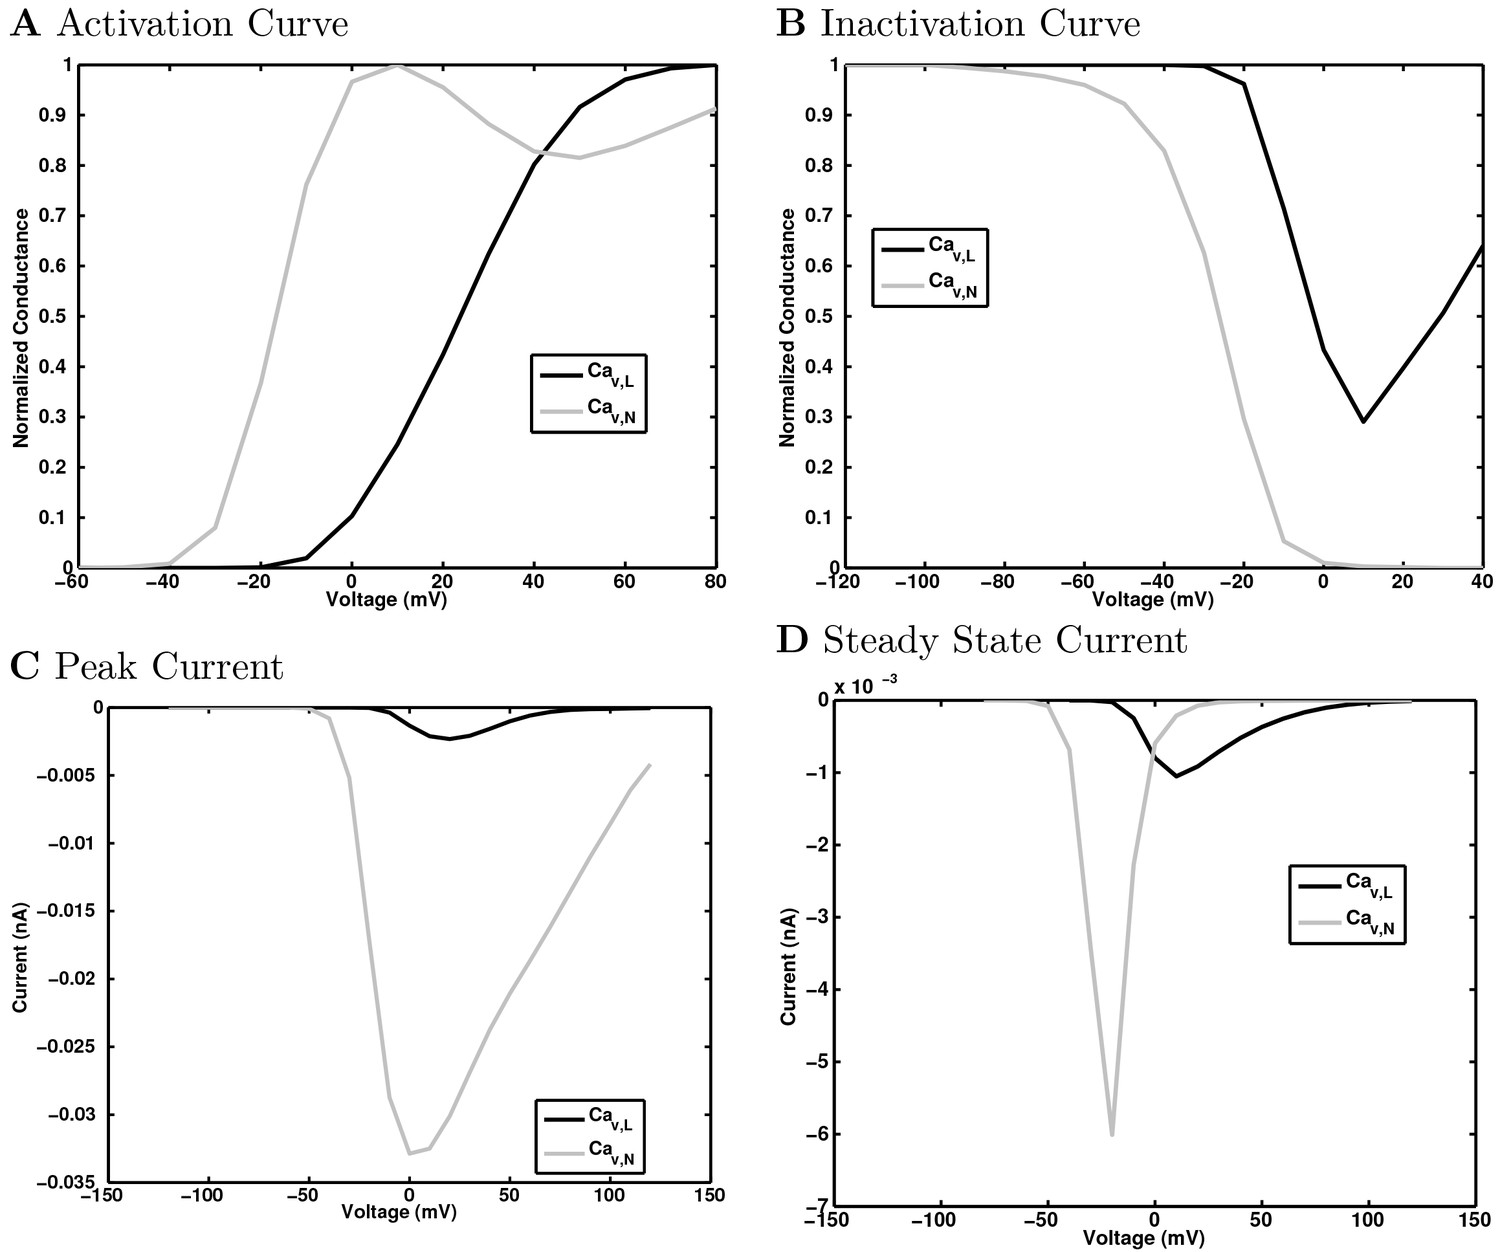
Calcium channel currents.
https://doi.org/10.7554/eLife.18566.156
Appendix 1—figure 24
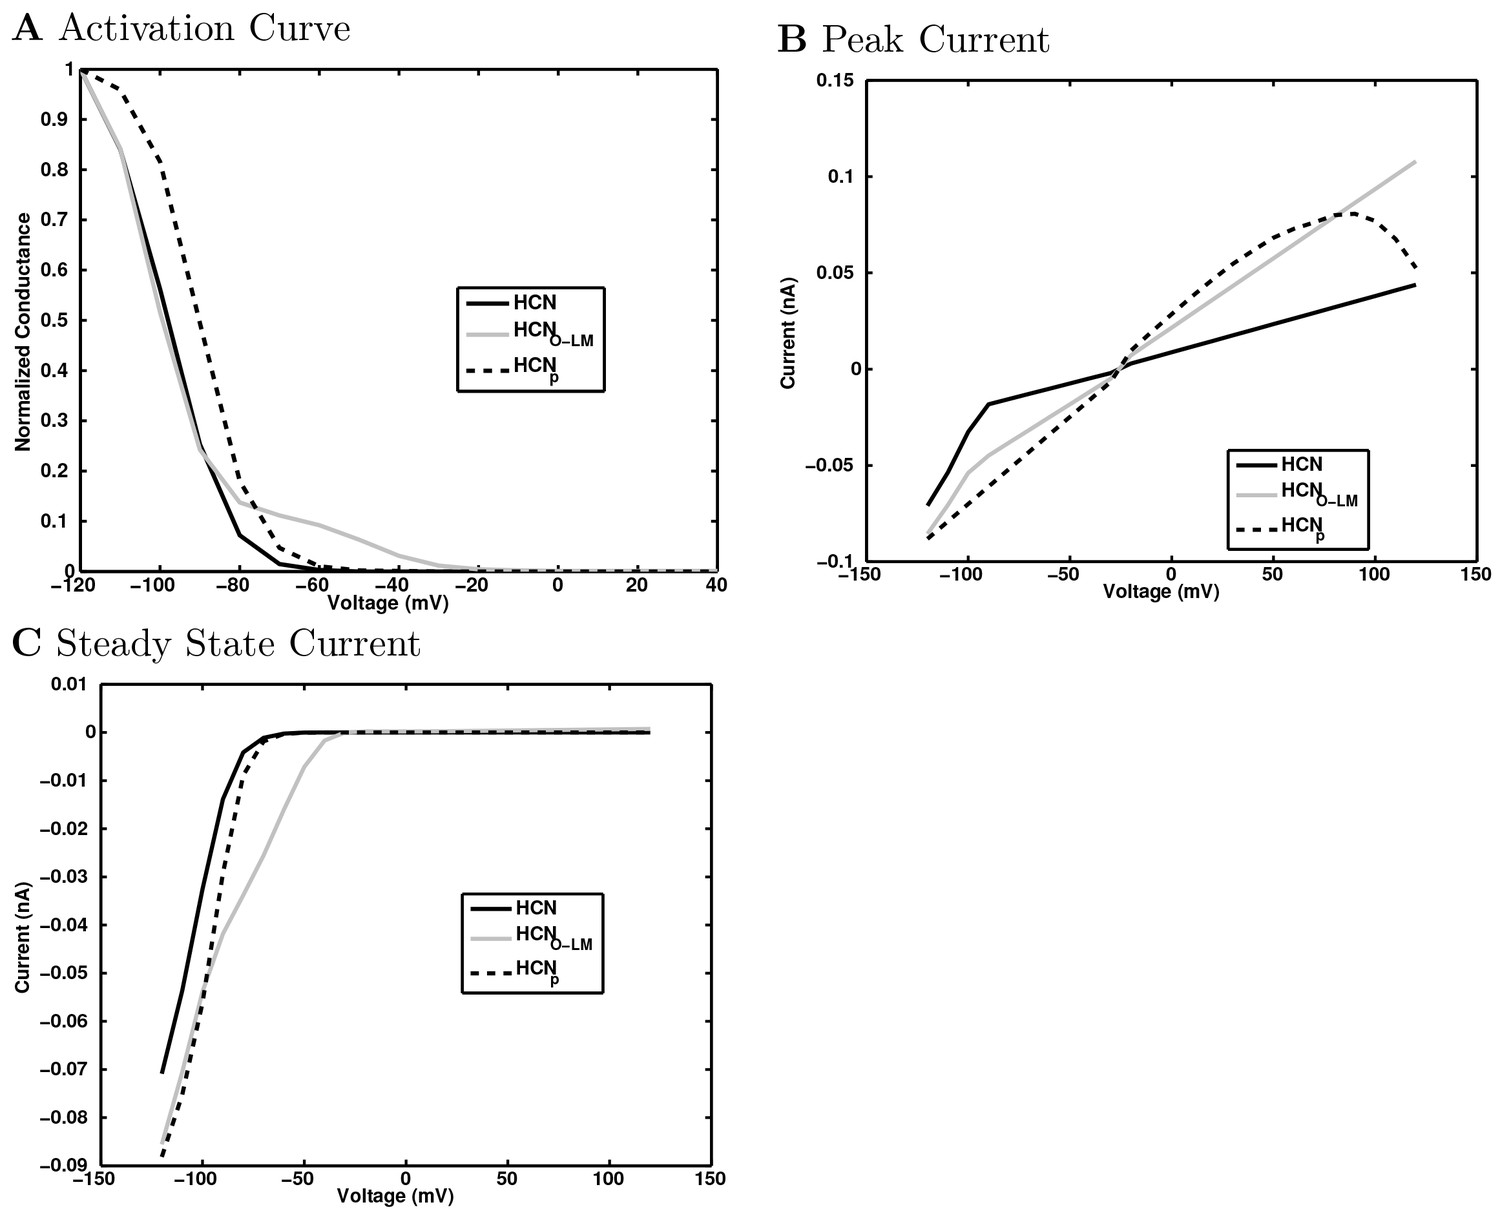
HCN channel currents.
https://doi.org/10.7554/eLife.18566.157
Appendix 1—figure 25
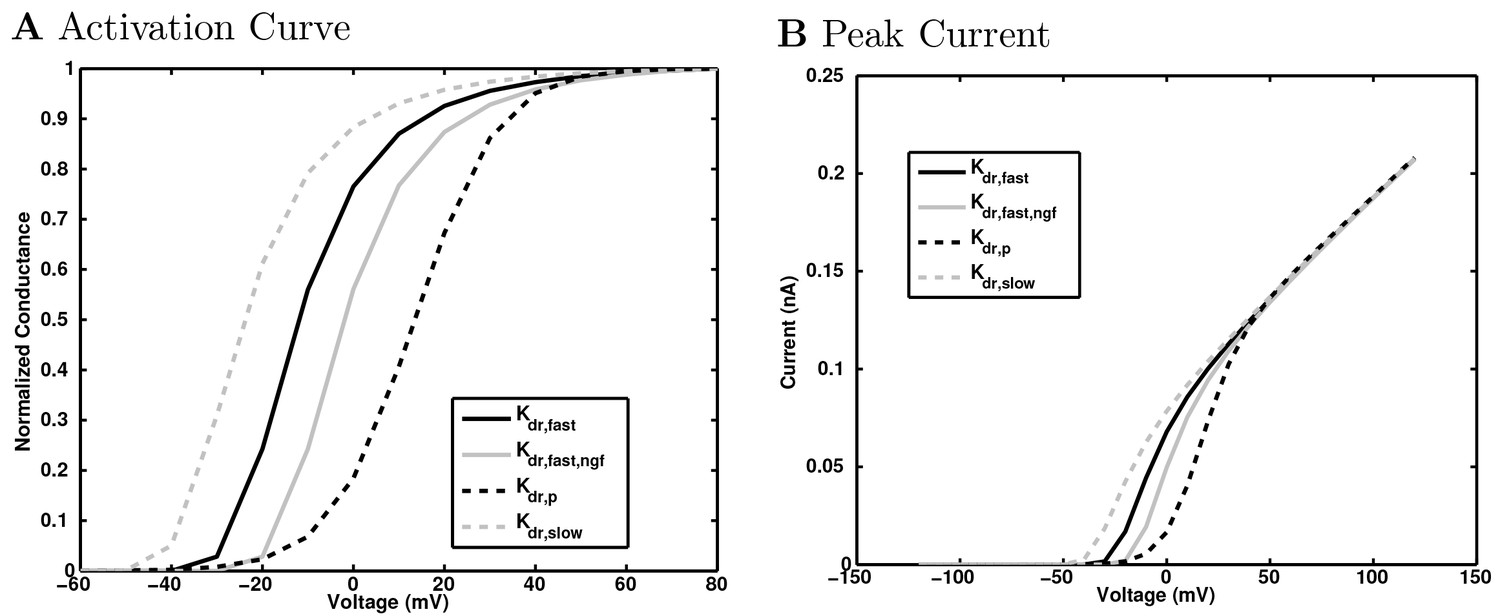
Delayed rectifier potassium channel currents.
https://doi.org/10.7554/eLife.18566.158
Appendix 1—figure 26
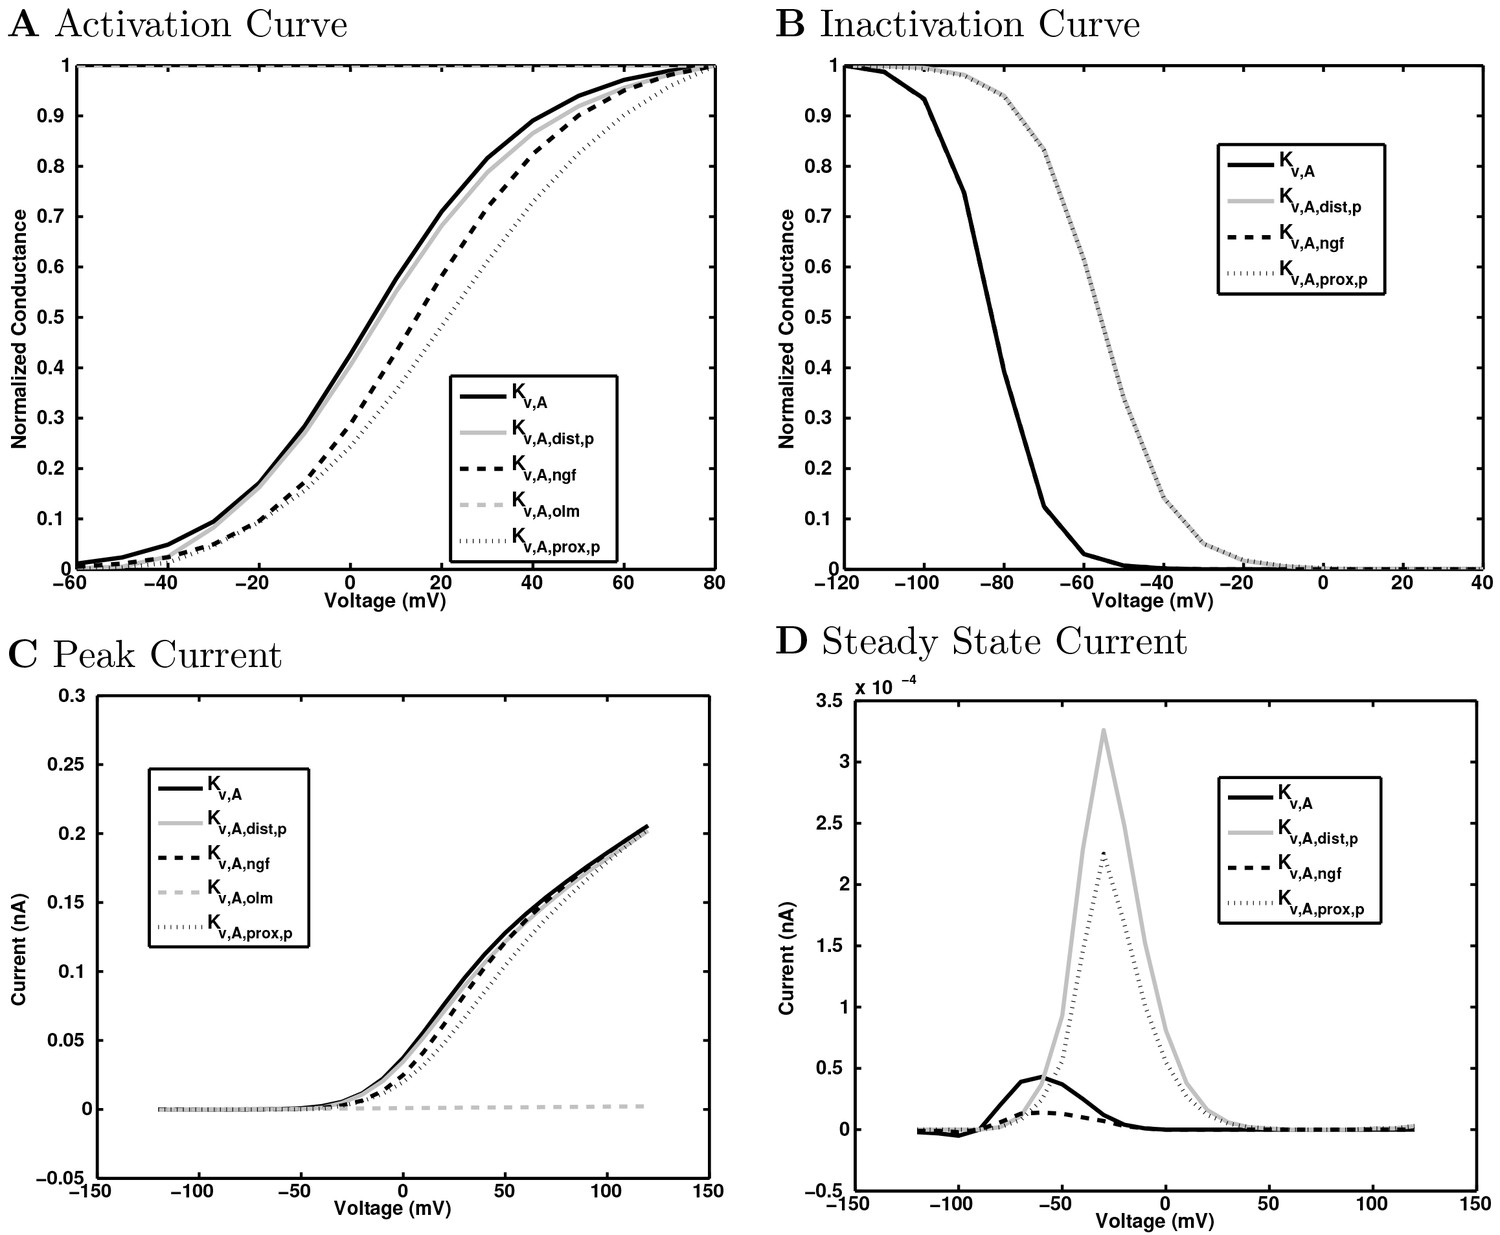
A-type potassium channel currents.
https://doi.org/10.7554/eLife.18566.159
Appendix 1—figure 27
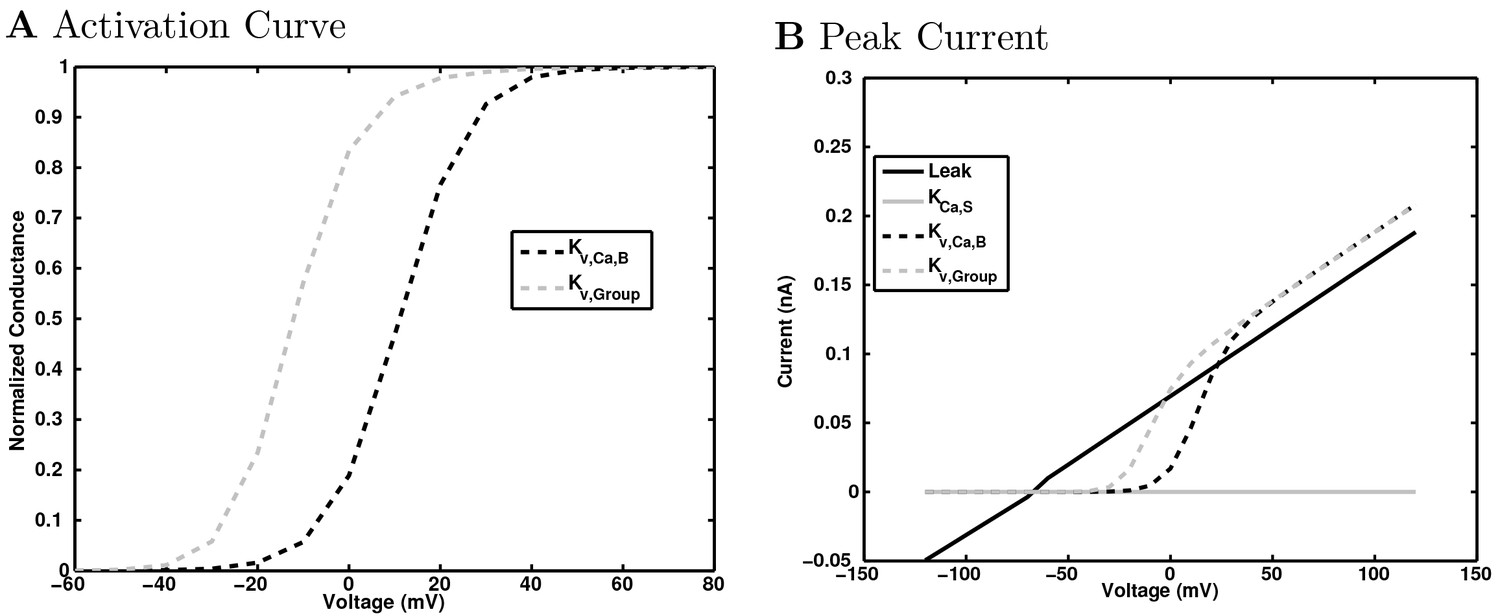
Other potassium channel currents.
Because they didn’t have a voltage-sensitive inactivation component, only the activation curve, which is equivalent to the IV Peak curve, need be shown here.
Appendix 1—figure 28

Calcium-dependent potassium channel dependence on calcium concentration.
(a) The normalized conductance of the channels are plotted as a function of test voltage step and calcium concentration. (b) and (c) The current-voltage relation is shown at several calcium concentrations for (b) KvCaB channel and (c) KCaS channel. Note that the KCaS channel is only active at the highest calcium concentration and is not dependent on voltage (although the voltage continues to set the driving force) when it is active.
Appendix 1—figure 29

Sodium channel voltage dependence.
The normalized conductance of the sodium channel is plotted as (a) a function of test voltage step to show activation and (b) as a function of holding voltage prior to the test step to show inactivation.
Tables
Table 1
Number of synapses between each cell type. Connections between cells generally comprise 1–10 synapses each. Presynaptic cells are listed down the first column (corresponding to each row) and postsynaptic cells are listed along the first row (corresponding to each column).
| Pre/Post | Axo | Bis | CCK+B | Ivy | NGF | O-LM | Pyr | PV+B | SC-A |
|---|---|---|---|---|---|---|---|---|---|
| Axo | 0.00e + 00 | 0.00e + 00 | 0.00e + 00 | 0.00e + 00 | 0.00e + 00 | 0.00e + 00 | 1.12e + 07 | 0.00e + 00 | 0.00e + 00 |
| Bis | 2.35e + 05 | 3.54e + 05 | 5.76e + 05 | 2.64e + 05 | 0.00e + 00 | 6.40e + 05 | 3.12e + 07 | 8.85e + 05 | 6.80e + 04 |
| CCK+B | 1.41e + 05 | 2.12e + 05 | 9.79e + 05 | 5.64e + 05 | 0.00e + 00 | 2.62e + 05 | 3.24e + 07 | 5.31e + 05 | 8.32e + 04 |
| Ivy | 3.53e + 05 | 5.30e + 05 | 3.42e + 06 | 2.11e + 06 | 1.00e + 06 | 2.23e + 06 | 1.28e + 08 | 1.33e + 06 | 4.08e + 05 |
| NGF | 0.00e + 00 | 0.00e + 00 | 0.00e + 00 | 0.00e + 00 | 6.09e + 05 | 0.00e + 00 | 4.36e + 07 | 0.00e + 00 | 0.00e + 00 |
| O-LM | 1.18e + 05 | 1.77e + 05 | 1.44e + 06 | 0.00e + 00 | 4.65e + 05 | 9.84e + 04 | 2.49e + 07 | 4.42e + 05 | 1.60e + 05 |
| Pyr | 7.19e + 05 | 2.43e + 06 | 0.00e + 00 | 2.38e + 05 | 0.00e + 00 | 1.17e + 07 | 6.14e + 07 | 7.03e + 06 | 1.26e + 05 |
| PV+B | 5.73e + 04 | 8.62e + 04 | 1.37e + 05 | 7.05e + 04 | 0.00e + 00 | 0.00e + 00 | 5.83e + 07 | 2.16e + 05 | 9.60e + 03 |
| SC-A | 8.82e + 03 | 1.33e + 04 | 1.30e + 05 | 1.06e + 05 | 0.00e + 00 | 1.97e + 04 | 3.74e + 06 | 3.32e + 04 | 1.44e + 04 |
| CA3 | 1.23e + 07 | 2.56e + 07 | 1.44e + 07 | 3.39e + 07 | 0.00e + 00 | 0.00e + 00 | 3.73e + 09 | 6.69e + 07 | 1.55e + 06 |
| ECIII | 1.43e + 06 | 1.91e + 06 | 4.02e + 06 | 0.00e + 00 | 3.75e + 06 | 0.00e + 00 | 8.09e + 08 | 0.00e + 00 | 4.58e + 05 |
Table 2
Simulation time, exchange time, and load balance for simulations executed on various supercomputers and numbers of processors.
| Supercomputer | # Processors | Sim time (s) | Exchange time (s) | Load balance |
|---|---|---|---|---|
| Comet | 1680 | 2610.28 | 1.05 | 0.999 |
| Comet | 1704 | 2566.76 | 0.65 | 0.999 |
| Comet | 1728 | 2601.22 | 0.86 | 0.999 |
| Comet via NSG | 1728 | 2060.88 | 0.83 | 0.999 |
| Stampede via NSG | 2048 | 2471.64 | 1.71 | 1.000 |
| Stampede | 2048 | 2578.32 | 0.29 | 1.000 |
| Stampede | 2528 | 2189.56 | 1.78 | 0.999 |
| Stampede | 3008 | 1844.22 | 0.91 | 0.999 |
| Stampede | 3488 | 1641.91 | 0.86 | 0.999 |
Table 3
Electrophysiological characteristics of each model cell type. For more information about model electrophysiology, see the Appendix.
| Condition | Pyr | PV+B | CCK+B | SC-A | Axo | Bis | O-LM | Ivy | NGF |
|---|---|---|---|---|---|---|---|---|---|
| Resting Membrane Potential (mV) | −63.0 | −65.0 | −70.6 | −70.5 | −65.0 | −67.0 | −71.5 | −60.0 | −60.0 |
| Input Resistance (M) | 62.2 | 52.0 | 211.0 | 272.4 | 52.0 | 98.7 | 343.8 | 100.0 | 100.0 |
| Membrane Tau (ms) | 4.8 | 6.9 | 22.6 | 24.4 | 7.0 | 14.7 | 22.4 | 21.1 | 21.1 |
| Rheobase (pA) | 250.0 | 300.0 | 60.0 | 40.0 | 200.0 | 350.0 | 50.0 | 160.0 | 170.0 |
| Threshold (mV) | 52.0 | −36.6 | −40.6 | −43.1 | −41.6 | −28.1 | 100.2 | −27.6 | −27.7 |
| Delay to 1st Spike (ms) | 12.4 | 74.6 | 166.6 | 127.7 | 43.5 | 28.4 | 8.9 | 173.3 | 119.0 |
| Half-Width (ms) | 80.7 | 0.9 | 1.9 | 1.6 | 0.6 | 0.5 | 112.9 | 0.6 | 0.6 |
Table 4
Current injection levels used to characterize interneuron current sweeps in Figure 2D–G.
| Cell type | Hyper. (pA) | Step size (pA) | Depol. (pA) |
|---|---|---|---|
| PV+ B. | −300 | 50 | +500 |
| CCK+ B. | −100 | 20 | +80 |
| O-LM | −130 | 30 | +80 |
| NGF | −130 | 20 | +190 |
Table 5
Preferred theta firing phases for each model cell type.
| Cell type | Firing rate (Hz) | Modulation | Phase (0=trough) | |
|---|---|---|---|---|
| Level | p | |||
| Axo. | 8.9 | 0.07 | 4.58e − 130 | 163.4 |
| Bis. | 18.0 | 0.76 | 0.00e + 00 | 340.0 |
| CCK+ B. | 54.4 | 0.10 | 0.00e + 00 | 202.8 |
| Ivy | 43.3 | 0.33 | 0.00e + 00 | 142.1 |
| NGF. | 55.1 | 0.07 | 1.46e − 32 | 176.3 |
| O-LM | 17.4 | 0.76 | 0.00e + 00 | 334.7 |
| Pyr. | 6.0 | 0.74 | 0.00e + 00 | 339.7 |
| PV+ B. | 0.9 | 0.46 | 0.00e + 00 | 356.8 |
| S.C.-A. | 5.2 | 0.03 | 1.13e − 07 | 197.9 |
Table 6
Firing rates and theta phase preferences for various cell types in various conditions. Theta phase is relative to the LFP recorded in the pyramidal layer, where 0o and 360o are at the trough of the oscillation. non: non-theta/non-SWR state. SWR: sharp wave/ripple. u+k and x: urethane + supplemental doses of ketamine and xylazine.
| Cell type | Firing rate (Hz) | Theta phase () | State of animal | Animal | Ref. | ||
|---|---|---|---|---|---|---|---|
| Theta | Non | SWR | |||||
| ADI | anesth: u+k and x | rat | (Klausberger et al., 2005) | ||||
| Axo-axonic | anesth: u+k and x | rat | (Klausberger et al., 2003) | ||||
| Axo-axonic | awake, head restraint | mouse | (Varga et al., 2014) | ||||
| Bistratified | anesth: u+k and x | rat | (Klausberger et al., 2004) | ||||
| Bistratified | 0 | awake, head restraint | mouse | (Varga et al., 2014) | |||
| Bistratified | awake | rat | (Katona et al., 2014) | ||||
| CCK+ Basket | anesth: u+k and x | rat | (Klausberger et al., 2005) | ||||
| Ivy | anesth: u+k and x | rat | (Fuentealba et al., 2008) | ||||
| Ivy | awake, free | rat | (Lapray et al., 2012) | ||||
| Ivy | awake, free | rat | (Fuentealba et al., 2008) | ||||
| NGF | anesth: u+k and x | rat | (Fuentealba et al., 2010) | ||||
| O-LM | anesth: u+k and x | rat | (Klausberger et al., 2003) | ||||
| O-LM | awake, head restraint | mouse | (Varga et al., 2012) | ||||
| O-LM | awake | rat | (Katona et al., 2014) | ||||
| PPA | anesth: u+k and x | rat | (Klausberger et al., 2005) | ||||
| PV+ Basket | anesth: u+k and x | rat | (Klausberger et al., 2003) | ||||
| PV+ Basket | anesth: u+k and x | rat | (Klausberger et al., 2005) | ||||
| PV+ Basket | awake, free | rat | (Lapray et al., 2012) | ||||
| PV+ Basket | awake, head restraint | mouse | (Varga et al., 2012) | ||||
| PV+ Basket | awake, head restraint | mouse | (Varga et al., 2014) | ||||
| Pyramidal | anesth: u+k and x | rat | (Klausberger et al., 2003) | ||||
| Trilaminar | trough | anesth: u+k and x | rat | (Ferraguti et al., 2005) | |||
| Double Proj. | anesth: u+k and x | rat | (Jinno et al., 2007) | ||||
| Oriens Retro. | anesth: u+k and x | rat | (Jinno et al., 2007) | ||||
| Radiatum Retro. | anesth: u+k and x | rat | (Jinno et al., 2007) | ||||
Table 7
Peak, theta and gamma frequencies and powers of the pyramidal cell spike density function using Welch’s Periodogram. As in Figure 6—figure supplement 1, networks where no pyramidal cells spiked - resulting in zero power within the spectral analysis of the pyramidal cell spike density function - have their peak frequencies listed as ‘n/a’ for ‘not available’.
| Theta | Gamma | Overall | ||||
|---|---|---|---|---|---|---|
| Condition | Frequency | Power | Frequency | Power | Frequency | Power |
| Tonic excitation level (Hz) | ||||||
| 0.20 | n/a | 0.0e + 00 | n/a | 0.0e + 00 | n/a | 0.0e + 00 |
| 0.40 | 5.9 | 5.6e + 04 | 25.4 | 4.1e + 04 | 13.7 | 6.5e + 04 |
| 0.50 | 9.8 | 8.1e + 04 | 25.4 | 1.0e + 05 | 19.5 | 5.6e + 05 |
| 0.65 (Ctrl.) | 7.8 | 5.0e + 05 | 25.4 | 2.0e + 05 | 7.8 | 5.0e + 05 |
| 0.80 | 9.8 | 7.8e + 05 | 29.3 | 2.6e + 05 | 9.8 | 7.8e + 05 |
| 1.00 | 9.8 | 6.8e + 05 | 29.3 | 1.4e + 05 | 9.8 | 6.8e + 05 |
| 1.20 | 9.8 | 5.1e + 05 | 33.2 | 1.8e + 05 | 11.7 | 8.2e + 05 |
| 1.40 | 9.8 | 1.9e + 05 | 25.4 | 3.4e + 05 | 11.7 | 8.6e + 05 |
| Single Interneuron E’phys. Profile | ||||||
| Ctrl | 7.8 | 5.0e + 05 | 25.4 | 2.0e + 05 | 7.8 | 5.0e + 05 |
| O-LM | n/a | 0.0e + 00 | n/a | 0.0e + 00 | n/a | 0.0e + 00 |
| CCK+B | 9.8 | 5.7e + 03 | 62.5 | 6.9e + 05 | 62.5 | 6.9e + 05 |
| PV+B | n/a | 0.0e + 00 | n/a | 0.0e + 00 | n/a | 0.0e + 00 |
| NGF | 5.9 | 2.6e + 04 | 39.1 | 2.4e + 06 | 39.1 | 2.4e + 06 |
| Inh. Cells Converge to PV+ B. Cells | ||||||
| Ctrl | 7.8 | 5.0e + 05 | 25.4 | 2.0e + 05 | 7.8 | 5.0e + 05 |
| E’phys. | n/a | 0.0e + 00 | n/a | 0.0e + 00 | n/a | 0.0e + 00 |
| +input wgt | 7.8 | 6.8e + 02 | 44.9 | 1.6e + 06 | 21.5 | 3.4e + 06 |
| +input # | 9.8 | 6.1e + 03 | 31.3 | 1.1e + 06 | 15.6 | 2.0e + 06 |
| All PV+B | n/a | 0.0e + 00 | n/a | 0.0e + 00 | n/a | 0.0e + 00 |
| Var. PV+B | n/a | 0.0e + 00 | n/a | 0.0e + 00 | n/a | 0.0e + 00 |
| Outputs Muted | ||||||
| Ctrl | 7.8 | 5.0e + 05 | 25.4 | 2.0e + 05 | 7.8 | 5.0e + 05 |
| SOM | 7.8 | 4.7e + 05 | 27.3 | 1.4e + 05 | 7.8 | 4.7e + 05 |
| PV | 9.8 | 3.2e + 04 | 27.3 | 8.1e + 05 | 13.7 | 1.5e + 06 |
| Pyr to Pyr | ||||||
| 2.0x | 9.8 | 1.1e + 05 | 25.4 | 7.3e + 05 | 13.7 | 1.0e + 06 |
| 1.0x (Ctrl.) | 7.8 | 5.0e + 05 | 25.4 | 2.0e + 05 | 7.8 | 5.0e + 05 |
| 0.5x | 7.8 | 8.0e + 04 | 29.3 | 2.2e + 05 | 29.3 | 2.2e + 05 |
| None | 9.8 | 1.1e + 00 | 70.3 | 3.7e + 01 | 70.3 | 3.7e + 01 |
| Outputs Muted From Each Cell Type | ||||||
| Ctrl | 7.8 | 5.0e + 05 | 25.4 | 2.0e + 05 | 7.8 | 5.0e + 05 |
| Pyr | 7.8 | 1.1e + 00 | 70.3 | 3.8e + 01 | 70.3 | 3.8e + 01 |
| PV+B | 9.8 | 8.8e + 03 | 29.3 | 1.9e + 06 | 29.3 | 1.9e + 06 |
| SC-A | 9.8 | 4.9e + 05 | 27.3 | 1.8e + 05 | 9.8 | 4.9e + 05 |
| O-LM | 7.8 | 5.1e + 05 | 25.4 | 8.3e + 04 | 7.8 | 5.1e + 05 |
| NGF | 9.8 | 5.2e + 03 | 27.3 | 9.1e + 05 | 13.7 | 1.6e + 06 |
| Ivy | 7.8 | 5.3e + 05 | 25.4 | 2.0e + 05 | 7.8 | 5.3e + 05 |
| CCK+B | 5.9 | 5.5e + 03 | 25.4 | 3.3e + 03 | 3.9 | 5.7e + 03 |
| Bis | 5.9 | 1.3e + 04 | 29.3 | 1.7e + 06 | 29.3 | 1.7e + 06 |
| Axo | 7.8 | 4.0e + 03 | 33.2 | 1.2e + 06 | 15.6 | 1.9e + 06 |
| Pyr & PV+ B. Network: Tonic Excitation Level (Hz) | ||||||
| 0.01 | n/a | 0.0e + 00 | n/a | 0.0e + 00 | n/a | 0.0e + 00 |
| 0.05 | n/a | 0.0e + 00 | n/a | 0.0e + 00 | n/a | 0.0e + 00 |
| 0.10 | n/a | 0.0e + 00 | n/a | 0.0e + 00 | n/a | 0.0e + 00 |
| 0.20 | n/a | 0.0e + 00 | n/a | 0.0e + 00 | n/a | 0.0e + 00 |
| 0.40 | 5.9 | 2.3e + 02 | 25.4 | 1.2e + 02 | 3.9 | 2.4e + 02 |
| 0.65 | n/a | 0.0e + 00 | n/a | 0.0e + 00 | n/a | 0.0e + 00 |
| 0.80 | n/a | 0.0e + 00 | n/a | 0.0e + 00 | n/a | 0.0e + 00 |
| 1.20 | n/a | 0.0e + 00 | n/a | 0.0e + 00 | n/a | 0.0e + 00 |
| Ctrl | 7.8 | 5.0e + 05 | 25.4 | 2.0e + 05 | 7.8 | 5.0e + 05 |
Appendix 1—table 1
Intrinsic electrophysiological properties of experimental cells.
| Cell type | n | RMP (mV) | Input resistance (M) | Sag amplitude (mV) | Sag tau (ms) | Membrane tau (ms) | Rheobase (pA) | ISI (ms) | Threshold (mV) | Spike amplitude (mV) | AHP (mV) | |
|---|---|---|---|---|---|---|---|---|---|---|---|---|
| From mouse | ||||||||||||
| Pyr | 17 | −70.7 1.2 | 139.5 38.8 | 7.0 2.2 | 34.4 11.0 | 21.5 8.6 | 182.4 55.7 | 134.0 44.0 | −36.7 2.6 | 78.2 7.2 | 8.6 2.1 | |
| Axo | 3 | −64.4 4.5 | 122.0 57.5 | 1.7 0.6 | 45.4 6.9 | 11.9 2.2 | 283.3 152.8 | 47.8 28.5 | −31.8 3.4 | 44.5 6.7 | 16.6 3.5 | |
| Bis | 3 | −63.6 4.7 | 109.1 30.5 | 1.7 0.6 | 62.3 13.7 | 12.2 0.6 | 333.3 57.7 | 24.5 21.8 | −31.9 4.2 | 47.3 6.8 | 22.6 0.7 | |
| O-LM | 3 | −64.8 1.3 | 592.3 97.0 | 10.4 3.8 | 78.5 22.0 | 41.4 11.7 | 20.0 0.0 | 101.9 30.1 | −44.2 2.3 | 76.3 6.1 | 22.1 4.7 | |
| PV+B | 7 | −61.4 2.0 | 65.2 16.2 | 1.8 0.5 | 62.9 16.3 | 13.3 5.4 | 307.1 109.7 | 74.2 36.4 | −35.3 3.7 | 51.1 9.0 | 18.0 2.7 | |
| From rat | ||||||||||||
| CCK+B | 1 | −61.2 | 298.1 | 2.7 | 72.1 | 56.0 | 60.0 | 261.0 | −37.7 | 63.7 | 15.5 | |
| Ivy | 2 | −62.3 0.3 | 267.2 107.9 | 2.4 2.5 | 91.1 120.9 | 171.9 45.6 | 80.0 28.3 | 74.9 20.6 | −32.8 0.7 | 48.2 5.1 | 20.1 2.6 | |
| NGF | 2 | −66.7 13.4 | 260.0 73.6 | 1.8 1.6 | 61.7 77.0 | 77.2 66.2 | 110.0 70.7 | 80.0 28.4 | −34.0 2.2 | 34.7 4.9 | 16.2 6.3 | |
| SC-A | 2 | −57.0 4.3 | 529.9 2.9 | 7.9 6.2 | 91.1 21.7 | 74.2 37.3 | 30.0 14.1 | 132.4 29.4 | −34.3 2.2 | 58.7 4.5 | 12.6 2.0 | |
Appendix 1—table 2
AxoClamp raw data files. Sch. Coll.-Assoc.: Schaffer Collateral-Associated; Super: superficial. Current sweep injection levels are reported as minimum (most hyperpolarized) : step size : maximum (depolarized) level in units of pA.
| Cell type | Lab | Cell name | Current inj. | Original use and methods reference | |
|---|---|---|---|---|---|
| Species | Levels (pA) | ||||
| Axo-axonic | Soltesz | CA203LF57 | mouse | −200:50:+500 | unpublished |
| Axo-axonic | Soltesz | CA204LF59 | mouse | −200:50:+300 | unpublished |
| Axo-axonic | Soltesz | CA204RF59 | mouse | −200:50:+400 | unpublished |
| Bistratified | Soltesz | PV16IM | mouse | −300:50:+400 | unpublished |
| Bistratified | Soltesz | PV74 | mouse | −300:50:+350 | unpublished |
| Bistratified | Soltesz | PV27IM | mouse | −300:50:+450 | unpublished |
| PV+ Basket | Soltesz | PV34 | mouse | −300:50:+500 | Lee et al. (2014) |
| PV+ Basket | Soltesz | PV36 | mouse | −300:50:+800 | Lee et al. (2014) |
| PV+ Basket | Soltesz | PV37 | mouse | −300:50:+500 | Lee et al. (2014) |
| PV+ Basket | Soltesz | PV38 | mouse | −300:50:+300 | Lee et al. (2014) |
| PV+ Basket | Soltesz | PV72 | mouse | −300:50:+400 | Lee et al. (2014) |
| PV+ Basket | Soltesz | PV80 | mouse | −300:50:+450 | Lee et al. (2014) |
| Deep Pyramidal | Soltesz | D1_25abf | mouse | −400:50:+550 | Lee et al. (2014) |
| Deep Pyramidal | Soltesz | D1_45abf | mouse | −400:50:+550 | Lee et al. (2014) |
| Deep Pyramidal | Soltesz | D2_06abf | mouse | −400:50:+550 | Lee et al. (2014) |
| Deep Pyramidal | Soltesz | D2_49abf | mouse | −400:50:+550 | Lee et al. (2014) |
| Deep Pyramidal | Soltesz | D3_55abf | mouse | −400:50:+550 | Lee et al. (2014) |
| Deep Pyramidal | Soltesz | D4_11abf | mouse | −400:50:+550 | Lee et al. (2014) |
| Deep Pyramidal | Soltesz | D5_15abf | mouse | −400:50:+550 | Lee et al. (2014) |
| Deep Pyramidal | Soltesz | D6_19abf | mouse | −400:50:+550 | Lee et al. (2014) |
| Deep Pyramidal | Soltesz | D7 | mouse | −400:50:+550 | Lee et al. (2014) |
| Super. Pyramidal | Soltesz | S1_04abf | mouse | −400:50:+550 | Lee et al. (2014) |
| Super. Pyramidal | Soltesz | S1_47abf | mouse | −400:50:+550 | Lee et al. (2014) |
| Super. Pyramidal | Soltesz | S2_08abf | mouse | −400:50:+550 | Lee et al. (2014) |
| Super. Pyramidal | Soltesz | S2_31abf | mouse | −400:50:+550 | Lee et al. (2014) |
| Super. Pyramidal | Soltesz | S2_51abf | mouse | −400:50:+550 | Lee et al. (2014) |
| Super. Pyramidal | Soltesz | S3_13abf | mouse | −400:50:+550 | Lee et al. (2014) |
| Super. Pyramidal | Soltesz | S4 | mouse | −400:50:+550 | Lee et al. (2014) |
| Super. Pyramidal | Soltesz | S5_21abf | mouse | −400:50:+550 | Lee et al. (2014) |
| Ivy | Soltesz | 0422–1 (File 5) | rat | −100:20:+890 | Krook-Magnuson et al. (2011) |
| Ivy | Soltesz | 0428–1 (File 4) | rat | −100:20:+300 | Krook-Magnuson et al. (2011) |
| Neurogliaform | Soltesz | 09o21 (File 4) | rat | −100:20:+120 | Krook-Magnuson et al. (2011) |
| Neurogliaform | Soltesz | 09o27 (File 7) | rat | −100:20:+490 | Krook-Magnuson et al. (2011) |
| CCK+ Basket | Soltesz | sh108_BC | rat | −100:20:+80 | Lee et al. (2010) |
| Sch. Coll.-Assoc. | Soltesz | sh114_SCA | rat | −100:20:+60 | Lee et al. (2010) |
| Sch. Coll.-Assoc. | Soltesz | sh153_SCA | rat | −100:20:+60 | Lee et al. (2010) |
| O-LM | Maccaferri | 1May2012_P3 | mouse | −100:30:+250 | Quattrocolo and Maccaferri (2013) |
| O-LM | Maccaferri | 20Sept2011_P2 | mouse | −100:30:+250 | Quattrocolo and Maccaferri (2013) |
| O-LM | Maccaferri | 24October2012_C2 | mouse | −100:30:+250 | Quattrocolo and Maccaferri (2013) |
Appendix 1—table 3
Model Pyramidal cell electrophysiological properties.
| Property | Value | |
|---|---|---|
| RMP | −63.0 mV | |
| Input Resistance | 76.1 MΩ | |
| Sag Amplitude | 6.5 mV | |
| Sag Tau | 9.6 ms | |
| Membrane Tau | 7.1 ms | |
| Rheobase | 250.0 pA | |
| ISI | 80.7 ms | |
| Threshold | −39.9 mV | |
| Spike Amplitude | 80.3 mV | |
| Slow AHP Amplitude | 14.3 mV | |
Appendix 1—table 4
Model Pyramidal cell ion channels and conductance at highest density location in cell.
| Channel | Highest conductance Gmax (S/cm2) |
|---|---|
| HCNp | 4.968e-03 |
| Kdrp | 3.000e-03 |
| KvAdistp | 4.682e-02 |
| KvAproxp | 1.599e-02 |
| Navaxonp | 6.400e-02 |
| Navp | 3.200e-02 |
Appendix 1—table 5
Structural connection parameters for Pyramidal cells, based on Bezaire and Soltesz (2013).
| Other type | Other cell to pyr | Pyr to other cell | ||||||
|---|---|---|---|---|---|---|---|---|
| # | Syn.s | # | Post | # | Syn.s | # | Post | |
| Conn.s | /Conn. | # | Loc. | Conn.s | /Conn. | # | Loc. | |
| Axo | 6 | 6 | 36 | axon | 1 | 3 | 2 | apical dendrite |
| Bis | 10 | 10 | 100 | any dendrite | 3 | 3 | 7 | apical dendrite |
| CCK+B | 13 | 8 | 104 | any dendrite | ||||
| Ivy | 42 | 10 | 420 | any dendrite | 0 | 3 | 0 | apical dendrite |
| NGF | 14 | 10 | 140 | apical dendrite | ||||
| O-LM | 8 | 10 | 80 | apical dendrite | 13 | 3 | 37 | basal dendrite |
| Pyr | 197 | 1 | 197 | apical dendrite | 197 | 1 | 197 | apical dendrite |
| PV+B | 17 | 11 | 187 | soma | 8 | 3 | 22 | apical dendrite |
| SC-A | 0 | 3 | 0 | apical dendrite | ||||
| CA3 | 5985 | 2 | 11970 | any dendrite | ||||
| ECIII | 1299 | 2 | 2598 | any dendrite | ||||
Appendix 1—table 6
Experimental constraints for incoming connections onto Pyramidal cells (clamp: black=voltage; purple=current).
| Pre type | Exp. ref. | Hold (mV) | (mV) | Amp. (pA,mV) | Diff. % | (ms) | Diff. % | (ms) | Diff. % |
|---|---|---|---|---|---|---|---|---|---|
| Axo | Maccaferri et al., 2000 | −70.0 | 7.0 | 323.78 | +5.1 | 0.83 | +3.1 | 11.20 | +0.0 |
| Bis | Maccaferri et al., 2000 | −70.0 | 7.0 | 143.21 | −4.5 | 2.22 | +11.2 | 15.40 | −4.3 |
| CCK+B | Lee et al., 2010 | −70.0 | −26.0 | 118.97 | +3.1 | 0.53 | −16.7 | 6.15 | −4.9 |
| Ivy | Fuentealba et al., 2008 | −50.0 | −88.0 | 8.17 | +2.1 | 3.50 | +25.0 | 15.43 | −3.9 |
| NGF | Price et al., 2008 | −50.0 | −89.0 | 5.25 | +7.1 | 15.48 | −3.9 | 32.73 | −34.5 |
| O-LM | Maccaferri et al., 2000 | −70.0 | 7.0 | 24.35 | −6.3 | 4.68 | −24.6 | 18.88 | −9.3 |
| Pyr | Deuchars and Thomson, 1996 | −67.0 | 0.0 | 0.60 | −14.5 | 6.00 | +122.2 | 20.55 | +22.3 |
| PV+B | Szabadics et al., 2007 | −70.0 | −26.0 | 91.94 | −13.9 | 0.50 | −5.7 | 6.70 | +4.7 |
| SC-A | Lee et al., 2010 | −70.0 | −26.0 | 52.42 | −12.9 | 1.63 | +13.6 | 8.55 | +3.0 |
Appendix 1—table 7
Experimental constraints for outgoing connections from Pyramidal cells (clamp: black=voltage; purple=current).
| Post type | Exp. ref. | Hold (mV) | (mV) | Amp. (pA,mV) | Diff. % | (ms) | Diff. % | (ms) | Diff. % |
|---|---|---|---|---|---|---|---|---|---|
| Bis | Pawelzik et al., 2002 | −66.0 | 0.0 | 0.77 | −19.6 | 1.58 | +31.3 | 16.75 | +41.1 |
| Ivy | Fuentealba et al., 2008 | −65.8 | −70.0 | 0.06 | −97.9 | 1.38 | −8.3 | 21.35 | +41.1 |
| Pyr | Deuchars and Thomson, 1996 | −67.0 | 0.0 | 0.60 | −14.5 | 6.00 | +122.2 | 19.05 | +22.3 |
| PV+B | Lee et al., 2014 | −60.0 | 0.0 | 15.09 | −67.7 | 0.28 | −72.5 | 2.00 | +22.3 |
Appendix 1—table 8
Model synaptic parameters for Pyramidal cells in the control network.
| Type | Other cell to pyr | Pyr to other cell | ||||||
|---|---|---|---|---|---|---|---|---|
| (mV) | (nS) | (ms) | (ms) | (mV) | (nS) | (ms) | (ms) | |
| Axo | −60.0 | 1.150e-03 | 0.28 | 8.40 | 0.0 | 4.000e-05 | 0.30 | 0.60 |
| Bis | −60.0 | 5.100e-04 | 0.11 | 9.70 | 0.0 | 1.900e-03 | 0.11 | 0.25 |
| CCK+B | −60.0 | 5.200e-04 | 0.20 | 4.20 | ||||
| Ivy | −60.0 | 4.100e-05 | 1.10 | 11.00 | 0.0 | 4.050e-04 | 0.30 | 0.60 |
| NGF | −60.0 | 6.500e-05 | 9.00 | 39.00 | ||||
| O-LM | −60.0 | 3.000e-04 | 0.13 | 11.00 | 0.0 | 2.000e-04 | 0.30 | 0.60 |
| Pyr | 0.0 | 7.000e-02 | 0.10 | 1.50 | 0.0 | 7.000e-02 | 0.10 | 1.50 |
| PV+B | −60.0 | 2.000e-04 | 0.30 | 6.20 | 0.0 | 7.000e-04 | 0.07 | 0.20 |
| SC-A | 0.0 | 4.050e-04 | 0.30 | 0.60 | ||||
| CA3 | 0.0 | 2.000e-04 | 0.50 | 3.00 | ||||
| ECIII | 0.0 | 2.000e-04 | 0.50 | 3.00 | ||||
Appendix 1—table 9
Model synaptic properties under voltage clamp at −50 mV with physiological reversal potentials
| Type | Other cell to pyr | Pyr to other cell | ||||||||
|---|---|---|---|---|---|---|---|---|---|---|
| Hold (mV) | (mV) | Amp. (pA) | (ms) | (ms) | Hold (mV) | (mV) | Amp. (pA) | (ms) | (ms) | |
| Axo | −50.0 | −60.0 | 36.45 | 0.85 | 11.57 | −50.0 | 0.0 | 1.85 | 0.78 | 2.53 |
| Bis | −50.0 | −60.0 | 13.47 | 2.17 | 15.20 | −50.0 | 0.0 | 64.48 | 0.28 | 1.42 |
| CCK+B | −50.0 | −60.0 | 24.86 | 0.52 | 6.03 | |||||
| Ivy | −50.0 | −60.0 | 1.63 | 3.63 | 15.35 | −50.0 | 0.0 | 40.70 | 0.58 | 1.28 |
| NGF | −50.0 | −60.0 | 1.10 | 65.58 | 0.00 | |||||
| O-LM | −50.0 | −60.0 | 0.54 | 3.70 | 14.10 | −50.0 | 0.0 | 17.47 | 0.60 | 1.53 |
| Pyr | −50.0 | 0.0 | 22.13 | 2.22 | 9.65 | −50.0 | 0.0 | 22.13 | 2.22 | 9.65 |
| PV+B | −50.0 | −60.0 | 20.56 | 0.50 | 6.70 | −50.0 | 0.0 | 14.75 | 0.25 | 1.77 |
| SC-A | −50.0 | 0.0 | 17.42 | 0.68 | 3.05 | |||||
| CA3 | −50.0 | 0.0 | 7.15 | 1.83 | 7.08 | |||||
| ECIII | −50.0 | 0.0 | 1.41 | 3.25 | 13.63 | |||||
Appendix 1—table 10
Model Axo-axonic cell electrophysiological properties.
| Property | Value | |
|---|---|---|
| RMP | −65.0 mV | |
| Input Resistance | 52.3 MΩ | |
| Sag Amplitude | − | |
| Sag Tau | − | |
| Membrane Tau | 7.0 ms | |
| Rheobase | 200.0 pA | |
| ISI | 57.3 ms | |
| Threshold | −42.0 mV | |
| Spike Amplitude | 94.3 mV | |
| Slow AHP Amplitude | 33.4 mV | |
Appendix 1—table 11
Model Axo-axonic cell ion channels and conductance at highest density location in cell.
| Channel | Gmax (S/cm2) |
|---|---|
| CavL | 5.000e-03 |
| CavN | 8.000e-04 |
| KCaS | 2.000e-06 |
| Kdrfast | 1.300e-02 |
| KvA | 1.500e-04 |
| KvCaB | 2.000e-07 |
| Nav | 1.500e-01 |
| leak | 1.800e-04 |
Appendix 1—table 12
Structural connection parameters for Axo-axonic cells, based on Bezaire and Soltesz (2013).
| Other type | Other cell to axo | Axo to other cell | ||||||
|---|---|---|---|---|---|---|---|---|
| # | Syn.s | # | Post | # | Syn.s | # | Post | |
| Conn.s | /Conn. | # | Loc. | Conn.s | /Conn. | # | Loc. | |
| Bis | 16 | 10 | 160 | any dendrite | ||||
| CCK+B | 12 | 8 | 96 | any dendrite | ||||
| Ivy | 24 | 10 | 240 | any dendrite | ||||
| O-LM | 8 | 10 | 80 | apical dendrite | ||||
| Pyr | 162 | 3 | 486 | apical dendrite | 1271 | 6 | 7628 | axon |
| PV+B | 39 | 1 | 39 | soma | ||||
| SC-A | 1 | 6 | 6 | any dendrite | ||||
| CA3 | 4170 | 2 | 8340 | any dendrite | ||||
| ECIII | 485 | 2 | 970 | any dendrite | ||||
Appendix 1—table 13
Experimental constraints for outgoing connections from Axo-axonic cells (clamp: black=voltage; purple=current).
| Post type | Exp. ref. | Hold (mV) | (mV) | Amp. (pA,mV) | Diff. % | (ms) | Diff. % | (ms) | Diff. % |
|---|---|---|---|---|---|---|---|---|---|
| Pyr | Maccaferri et al., 2000 | −70.0 | 7.0 | 323.78 | +5.1 | 0.83 | +3.1 | 11.20 | +0.0 |
Appendix 1—table 14
Model synaptic parameters for Axo-axonic cells in the control network.
| Type | Other cell to axo | Axo to other cell | ||||||
|---|---|---|---|---|---|---|---|---|
| (mV) | (nS) | (ms) | (ms) | (mV) | (nS) | (ms) | (ms) | |
| Bis | −60.0 | 6.000e-04 | 0.29 | 2.67 | ||||
| CCK+B | −60.0 | 7.000e-04 | 0.43 | 4.49 | ||||
| Ivy | −60.0 | 5.700e-05 | 2.90 | 3.10 | ||||
| O-LM | −60.0 | 1.200e-04 | 0.73 | 10.00 | ||||
| Pyr | 0.0 | 4.000e-05 | 0.30 | 0.60 | −60.0 | 1.150e-03 | 0.28 | 8.40 |
| PV+B | −60.0 | 1.200e-04 | 0.29 | 2.67 | ||||
| SC-A | −60.0 | 6.000e-04 | 0.42 | 4.99 | ||||
| CA3 | 0.0 | 1.200e-04 | 2.00 | 6.30 | ||||
| ECIII | 0.0 | 1.200e-04 | 2.00 | 6.30 | ||||
Appendix 1—table 15
Model synaptic properties under voltage clamp at −50 mV with physiological reversal potentials
| Type | Other cell to axo | Axo to other cell | ||||||||
|---|---|---|---|---|---|---|---|---|---|---|
| Hold (mV) | (mV) | Amp. (pA) | (ms) | (ms) | Hold (mV) | (mV) | Amp. (pA) | (ms) | (ms) | |
| Bis | −50.0 | −60.0 | 36.77 | 0.70 | 3.70 | |||||
| CCK+B | −50.0 | −60.0 | 47.29 | 0.75 | 5.27 | |||||
| Ivy | −50.0 | −60.0 | 4.34 | 2.13 | 6.57 | |||||
| O-LM | −50.0 | −60.0 | 4.76 | 2.55 | 12.03 | |||||
| Pyr | −50.0 | 0.0 | 1.85 | 0.78 | 2.53 | −50.0 | −60.0 | 36.45 | 0.85 | 11.57 |
| PV+B | −50.0 | −60.0 | 1.08 | 0.45 | 3.13 | |||||
| SC-A | −50.0 | −60.0 | 24.00 | 1.00 | 6.13 | |||||
| CA3 | −50.0 | 0.0 | 10.85 | 2.30 | 8.80 | |||||
| ECIII | −50.0 | 0.0 | 8.74 | 3.08 | 9.20 | |||||
Appendix 1—table 16
Model Bistratified cell electrophysiological properties.
| Property | Value | |
|---|---|---|
| RMP | −67.0 mV | |
| Input Resistance | 98.8 MΩ | |
| Sag Amplitude | 0.0 mV | |
| Sag Tau | − | |
| Membrane Tau | 14.7 ms | |
| Rheobase | 350.0 pA | |
| ISI | 39.0 ms | |
| Threshold | −28.1 mV | |
| Spike Amplitude | 51.2 mV | |
| Slow AHP Amplitude | 48.8 mV | |
Appendix 1—table 17
Model Bistratified cell ion channels and conductance at highest density location in cell.
| Channel | Gmax (S/cm2) |
|---|---|
| CavL | 4.000e-03 |
| CavN | 4.000e-04 |
| KCaS | 7.000e-07 |
| Kdrfast | 1.600e-02 |
| KvA | 5.000e-05 |
| KvCaB | 7.000e-08 |
| Navbis | 7.000e-02 |
| leak | 9.001e-05 |
Appendix 1—table 18
Structural connection parameters for Bistratified cells, based on Bezaire and Soltesz (2013).
| Other type | Other cell to bis | Bis to other cell | ||||||
|---|---|---|---|---|---|---|---|---|
| # | Syn.s | # | Post | # | Syn.s | # | Post | |
| Conn.s | /Conn. | # | Loc. | Conn.s | /Conn. | # | Loc. | |
| Axo | 11 | 10 | 106 | any dendrite | ||||
| Bis | 16 | 10 | 160 | any dendrite | 16 | 10 | 160 | any dendrite |
| CCK+B | 12 | 8 | 96 | any dendrite | 26 | 10 | 260 | any dendrite |
| Ivy | 24 | 10 | 240 | any dendrite | 12 | 10 | 119 | any dendrite |
| O-LM | 8 | 10 | 80 | apical dendrite | 29 | 10 | 289 | any dendrite |
| Pyr | 366 | 3 | 1098 | apical dendrite | 1410 | 10 | 14095 | any dendrite |
| PV+B | 39 | 1 | 39 | soma | 40 | 10 | 400 | any dendrite |
| SC-A | 1 | 6 | 6 | any dendrite | 3 | 10 | 30 | any dendrite |
| CA3 | 5782 | 2 | 11564 | any dendrite | ||||
| ECIII | 432 | 2 | 864 | any dendrite | ||||
Appendix 1—table 19
Experimental constraints for incoming connections onto Bistratified cells (clamp: black=voltage; purple=current).
| Pre type | Exp. ref. | Hold (mV) | (mV) | Amp. (pA,mV) | Diff. % | (ms) | Diff. % | (ms) | Diff. % |
|---|---|---|---|---|---|---|---|---|---|
| Pyr | Pawelzik et al., 2002 | −66.0 | 0.0 | 0.77 | −19.6 | 1.58 | +31.3 | 14.68 | +41.1 |
| PV+B | Cobb et al., 1997 | −55.0 | −70.0 | 0.27 | −27.5 | 0.47 | −52.5 | 7.30 | +30.4 |
Appendix 1—table 20
Experimental constraints for outgoing connections from Bistratified cells (clamp: black=voltage; purple=current).
| Post type | Exp. ref. | Hold (mV) | (mV) | Amp. (pA,mV) | Diff. % | (ms) | Diff. % | (ms) | Diff. % |
|---|---|---|---|---|---|---|---|---|---|
| Pyr | Maccaferri et al., 2000 | −70.0 | 7.0 | 143.21 | −4.5 | 2.22 | +11.2 | 15.40 | −4.3 |
Appendix 1—table 21
Model synaptic parameters for Bistratified cells in the control network.
| Type | Other cell to bis | Bis to other cell | ||||||
|---|---|---|---|---|---|---|---|---|
| (mV) | (nS) | (ms) | (ms) | (mV) | (nS) | (ms) | (ms) | |
| Axo | −60.0 | 6.000e-04 | 0.29 | 2.67 | ||||
| Bis | −60.0 | 5.100e-04 | 0.29 | 2.67 | −60.0 | 5.100e-04 | 0.29 | 2.67 |
| CCK+B | −60.0 | 7.000e-04 | 0.43 | 4.49 | −60.0 | 8.000e-04 | 0.29 | 2.67 |
| Ivy | −60.0 | 7.700e-05 | 2.90 | 3.10 | −60.0 | 5.000e-04 | 0.29 | 2.67 |
| O-LM | −60.0 | 1.100e-04 | 0.60 | 15.00 | −60.0 | 2.000e-05 | 1.00 | 8.00 |
| Pyr | 0.0 | 1.900e-03 | 0.11 | 0.25 | −60.0 | 5.100e-04 | 0.11 | 9.70 |
| PV+B | −60.0 | 2.900e-03 | 0.18 | 0.45 | −60.0 | 9.000e-03 | 0.29 | 2.67 |
| SC-A | −60.0 | 6.000e-04 | 0.42 | 4.99 | −60.0 | 8.000e-04 | 0.29 | 2.67 |
| CA3 | 0.0 | 1.500e-04 | 2.00 | 6.30 | ||||
| ECIII | 0.0 | 1.500e-04 | 2.00 | 6.30 | ||||
Appendix 1—table 22
Model synaptic properties under voltage clamp at −50 mV with physiological reversal potentials
| Type | Other cell to bis | Bis to other cell | ||||||||
|---|---|---|---|---|---|---|---|---|---|---|
| Hold (mV) | (mV) | Amp. (pA) | (ms) | (ms) | Hold (mV) | (mV) | Amp. (pA) | (ms) | (ms) | |
| Axo | −50.0 | −60.0 | 36.77 | 0.70 | 3.70 | |||||
| Bis | −50.0 | −60.0 | 34.34 | 0.70 | 3.72 | −50.0 | −60.0 | 34.34 | 0.70 | 3.72 |
| CCK+B | −50.0 | −60.0 | 48.13 | 0.78 | 5.35 | −50.0 | −60.0 | 48.55 | 0.73 | 4.15 |
| Ivy | −50.0 | −60.0 | 6.39 | 2.15 | 6.63 | −50.0 | −60.0 | 43.40 | 0.60 | 3.17 |
| O-LM | −50.0 | −60.0 | 6.31 | 2.70 | 17.05 | −50.0 | −60.0 | 1.86 | 1.78 | 8.13 |
| Pyr | −50.0 | 0.0 | 64.48 | 0.28 | 1.42 | −50.0 | −60.0 | 13.47 | 2.17 | 15.20 |
| PV+B | −50.0 | −60.0 | 24.45 | 0.17 | 0.73 | −50.0 | −60.0 | 429.34 | 0.57 | 4.13 |
| SC-A | −50.0 | −60.0 | 26.43 | 1.02 | 6.20 | −50.0 | −60.0 | 50.35 | 0.70 | 4.10 |
| CA3 | −50.0 | 0.0 | 13.81 | 2.38 | 8.82 | |||||
| ECIII | −50.0 | 0.0 | 12.04 | 3.05 | 9.30 | |||||
Appendix 1—table 23
Model CCK+ Basket cell electrophysiological properties.
| Property | Value | |
|---|---|---|
| RMP | −70.6 mV | |
| Input Resistance | 222.4 MΩ | |
| Sag Amplitude | 9.2 mV | |
| Sag Tau | 45.6 ms | |
| Membrane Tau | 25.5 ms | |
| Rheobase | 80.0 pA | |
| ISI | 180.8 ms | |
| Threshold | −38.0 mV | |
| Spike Amplitude | 65.9 mV | |
| Slow AHP Amplitude | 32.1 mV | |
Appendix 1—table 24
Model CCK+ Basket cell ion channels and conductance at highest density location in cell.
| Channel | Gmax (S/cm2) |
|---|---|
| CavL | 2.700e-03 |
| CavN | 2.000e-05 |
| HCN | 1.000e-04 |
| KCaS | 4.000e-06 |
| Kdrfast | 8.000e-05 |
| KvA | 4.000e-04 |
| KvCaB | 4.000e-05 |
| KvGroup | 2.600e-03 |
| Navcck | 1.800e-02 |
| leak | 3.704e-05 |
Appendix 1—table 25
Structural connection parameters for CCK+ Basket cells, based on Bezaire and Soltesz (2013).
| Other type | Other cell to CCK+B | CCK+B to other cell | ||||||
|---|---|---|---|---|---|---|---|---|
| # | Syn.s | # | Post | # | Syn.s | # | Post | |
| Conn.s | /Conn. | # | Loc. | Conn.s | /Conn. | # | Loc. | |
| Axo | 5 | 8 | 39 | any dendrite | ||||
| Bis | 16 | 10 | 160 | any dendrite | 7 | 8 | 58 | any dendrite |
| CCK+B | 35 | 8 | 280 | any dendrite | 35 | 8 | 280 | any dendrite |
| Ivy | 96 | 10 | 960 | any dendrite | 20 | 8 | 156 | any dendrite |
| O-LM | 40 | 10 | 400 | apical dendrite | 9 | 8 | 72 | any dendrite |
| Pyr | 1125 | 8 | 8998 | any dendrite | ||||
| PV+B | 38 | 1 | 38 | soma | 18 | 8 | 147 | any dendrite |
| SC-A | 6 | 6 | 36 | any dendrite | 3 | 8 | 24 | any dendrite |
| CA3 | 2000 | 2 | 4000 | any dendrite | ||||
| ECIII | 559 | 2 | 1118 | any dendrite | ||||
Appendix 1—table 26
Experimental constraints for outgoing connections from CCK+ Basket cells (clamp: black=voltage; purple=current).
| Post type | Exp. ref. | Hold (mV) | (mV) | Amp. (pA,mV) | Diff. % | (ms) | Diff. % | (ms) | Diff. % |
|---|---|---|---|---|---|---|---|---|---|
| Pyr | Lee et al., 2010 | −70.0 | −26.0 | 118.97 | +3.1 | 0.53 | −16.7 | 6.15 | −4.9 |
Appendix 1—table 27
Model synaptic parameters for CCK+ Basket cells in the control network.
| Type | Other cell to CCK+B | CCK+B to other cell | ||||||
|---|---|---|---|---|---|---|---|---|
| (mV) | (nS) | (ms) | (ms) | (mV) | (nS) | (ms) | (ms) | |
| Axo | −60.0 | 7.000e-04 | 0.43 | 4.49 | ||||
| Bis | −60.0 | 8.000e-04 | 0.29 | 2.67 | −60.0 | 7.000e-04 | 0.43 | 4.49 |
| CCK+B | −60.0 | 4.500e-04 | 0.43 | 4.49 | −60.0 | 4.500e-04 | 0.43 | 4.49 |
| Ivy | −60.0 | 3.700e-05 | 2.90 | 3.10 | −60.0 | 3.000e-04 | 0.43 | 4.49 |
| O-LM | −60.0 | 1.200e-03 | 0.73 | 20.20 | −60.0 | 7.000e-04 | 1.00 | 8.00 |
| Pyr | −60.0 | 5.200e-04 | 0.20 | 4.20 | ||||
| PV+B | −60.0 | 1.200e-03 | 0.29 | 2.67 | −60.0 | 9.000e-03 | 0.43 | 4.49 |
| SC-A | −60.0 | 8.500e-04 | 0.42 | 4.99 | −60.0 | 7.000e-04 | 0.43 | 4.49 |
| CA3 | 0.0 | 6.500e-04 | 2.00 | 6.30 | ||||
| ECIII | 0.0 | 6.500e-04 | 2.00 | 6.30 | ||||
Appendix 1—table 28
Model synaptic properties under voltage clamp at −50 mV with physiological reversal potentials
| Type | Other cell to CCK+B | CCK+B to other cell | ||||||||
|---|---|---|---|---|---|---|---|---|---|---|
| Hold (mV) | (mV) | Amp. (pA) | (ms) | (ms) | Hold (mV) | (mV) | Amp. (pA) | (ms) | (ms) | |
| Axo | −50.0 | −60.0 | 47.29 | 0.75 | 5.27 | |||||
| Bis | −50.0 | −60.0 | 48.55 | 0.73 | 4.15 | −50.0 | −60.0 | 48.13 | 0.78 | 5.35 |
| CCK+B | −50.0 | −60.0 | 32.19 | 0.73 | 5.30 | −50.0 | −60.0 | 32.19 | 0.73 | 5.30 |
| Ivy | −50.0 | −60.0 | 3.00 | 2.25 | 6.95 | −50.0 | −60.0 | 22.34 | 0.80 | 5.05 |
| O-LM | −50.0 | −60.0 | 40.32 | 3.10 | 28.42 | −50.0 | −60.0 | 54.98 | 1.35 | 9.05 |
| Pyr | −50.0 | −60.0 | 24.86 | 0.52 | 6.03 | |||||
| PV+B | −50.0 | −60.0 | 11.31 | 0.42 | 3.08 | −50.0 | −60.0 | 523.11 | 0.68 | 5.70 |
| SC-A | −50.0 | −60.0 | 33.81 | 1.05 | 6.90 | −50.0 | −60.0 | 49.55 | 0.70 | 5.38 |
| CA3 | −50.0 | 0.0 | 55.24 | 2.53 | 9.35 | |||||
| ECIII | −50.0 | 0.0 | 43.27 | 3.40 | 10.87 | |||||
Appendix 1—table 29
Model Ivy cell electrophysiological properties.
| Property | Value | |
|---|---|---|
| RMP | −60.0 mV | |
| Input Resistance | 100.7 MΩ | |
| Sag Amplitude | 0.0 mV | |
| Sag Tau | − | |
| Membrane Tau | 21.3 ms | |
| Rheobase | 160.0 pA | |
| ISI | 305.5 ms | |
| Threshold | −27.7 mV | |
| Spike Amplitude | 54.6 mV | |
| Slow AHP Amplitude | 20.9 mV | |
Appendix 1—table 30
Model Ivy cell ion channels and conductance at highest density location in cell.
| Channel | Gmax (S/cm2) |
|---|---|
| CavL | 5.611e-02 |
| CavN | 5.817e-04 |
| KCaS | 4.515e-07 |
| Kdrfastngf | 1.551e-01 |
| KvAngf | 5.220e-06 |
| KvCaB | 1.024e-06 |
| Navngf | 3.786e+00 |
| leak | 8.471e-05 |
Appendix 1—table 31
Structural connection parameters for Ivy cells, based on Bezaire and Soltesz (2013).
| OtherType | Other cell to ivy | Ivy to other cell | ||||||
|---|---|---|---|---|---|---|---|---|
| # | Syn.s | # | Post | # | Syn.s | # | Post | |
| Conn.s | /Conn. | # | Loc. | Conn.s | /Conn. | # | Loc. | |
| Axo | 4 | 10 | 40 | any dendrite | ||||
| Bis | 3 | 10 | 30 | any dendrite | 6 | 10 | 60 | any dendrite |
| CCK+B | 8 | 8 | 64 | any dendrite | 39 | 10 | 392 | any dendrite |
| Ivy | 24 | 10 | 240 | any dendrite | 24 | 10 | 240 | any dendrite |
| NGF | 11 | 10 | 113 | any dendrite | ||||
| O-LM | 25 | 10 | 253 | any dendrite | ||||
| Pyr | 9 | 3 | 27 | apical dendrite | 1485 | 10 | 14850 | any dendrite |
| PV+B | 8 | 1 | 8 | soma | 15 | 10 | 150 | any dendrite |
| SC-A | 2 | 6 | 12 | any dendrite | 5 | 10 | 46 | any dendrite |
| CA3 | 1923 | 2 | 3846 | any dendrite | ||||
Appendix 1—table 32
Experimental constraints for incoming connections onto Ivy cells (clamp: black=voltage; purple=current).
| Pre type | Exp. ref. | Hold (mV) | (mV) | Amp. (pA,mV) | Diff. % | (ms) | Diff. % | (ms) | Diff. % |
|---|---|---|---|---|---|---|---|---|---|
| Pyr | Fuentealba et al., 2008 | −65.8 | −70.0 | 0.06 | −97.9 | 1.38 | −8.3 | − | −4.9 |
Appendix 1—table 33
Experimental constraints for outgoing connections from Ivy cells (clamp: black=voltage; purple=current).
| Post type | Exp. ref. | Hold (mV) | (mV) | Amp. (pA,mV) | Diff. % | (ms) | Diff. % | (ms) | Diff. % |
|---|---|---|---|---|---|---|---|---|---|
| Pyr | Fuentealba et al., 2008 | −50.0 | −88.0 | 8.17 | +2.1 | 3.50 | +25.0 | 15.43 | −3.9 |
Appendix 1—table 34
Model synaptic parameters for Ivy cells in the control network.
| Type | Other cell to ivy | Ivy to other cell | ||||||
|---|---|---|---|---|---|---|---|---|
| (mV) | (nS) | (ms) | (ms) | (mV) | (nS) | (ms) | (ms) | |
| Axo | −60.0 | 5.700e-05 | 2.90 | 3.10 | ||||
| Bis | −60.0 | 5.000e-04 | 0.29 | 2.67 | −60.0 | 7.700e-05 | 2.90 | 3.10 |
| CCK+B | −60.0 | 3.000e-04 | 0.43 | 4.49 | −60.0 | 3.700e-05 | 2.90 | 3.10 |
| Ivy | −60.0 | 5.700e-05 | 2.90 | 3.10 | −60.0 | 5.700e-05 | 2.90 | 3.10 |
| NGF | −60.0 | 5.700e-05 | 2.90 | 3.10 | ||||
| O-LM | −60.0 | 5.700e-05 | 2.90 | 3.10 | ||||
| Pyr | 0.0 | 4.050e-04 | 0.30 | 0.60 | −60.0 | 4.100e-05 | 1.10 | 11.00 |
| PV+B | −60.0 | 1.600e-04 | 0.29 | 2.67 | −60.0 | 7.000e-04 | 2.90 | 3.10 |
| SC-A | −60.0 | 8.500e-04 | 0.42 | 4.99 | −60.0 | 3.700e-05 | 2.90 | 3.10 |
| CA3 | 0.0 | 3.000e-04 | 2.00 | 6.30 | ||||
Appendix 1—table 35
Model synaptic properties under voltage clamp at −50 mV with physiological reversal potentials
| Type | Other cell to ivy | Ivy to other cell | ||||||||
|---|---|---|---|---|---|---|---|---|---|---|
| Hold (mV) | (mV) | Amp. (pA) | (ms) | (ms) | Hold (mV) | (mV) | Amp. (pA) | (ms) | (ms) | |
| Axo | −50.0 | −60.0 | 4.34 | 2.13 | 6.57 | |||||
| Bis | −50.0 | −60.0 | 43.40 | 0.60 | 3.17 | −50.0 | −60.0 | 6.39 | 2.15 | 6.63 |
| CCK+B | −50.0 | −60.0 | 22.34 | 0.80 | 5.05 | −50.0 | −60.0 | 3.00 | 2.25 | 6.95 |
| Ivy | −50.0 | −60.0 | 5.48 | 1.88 | 6.42 | −50.0 | −60.0 | 5.48 | 1.88 | 6.42 |
| NGF | −50.0 | −60.0 | 5.48 | 1.88 | 6.42 | |||||
| O-LM | −50.0 | −60.0 | 5.32 | 2.10 | 6.33 | |||||
| Pyr | −50.0 | 0.0 | 40.70 | 0.58 | 1.28 | −50.0 | −60.0 | 1.63 | 3.63 | 15.35 |
| PV+B | −50.0 | −60.0 | 1.44 | 0.55 | 3.13 | −50.0 | −60.0 | 51.35 | 2.05 | 6.75 |
| SC-A | −50.0 | −60.0 | 46.62 | 0.85 | 5.58 | −50.0 | −60.0 | 3.09 | 2.22 | 6.88 |
| CA3 | −50.0 | 0.0 | 29.42 | 2.05 | 8.60 | |||||
Appendix 1—table 36
Model Neurogliaform cell electrophysiological properties.
| Property | Value | |
|---|---|---|
| RMP | −60.0 mV | |
| Input Resistance | 100.8 MΩ | |
| Sag Amplitude | 0.0 mV | |
| Sag Tau | − | |
| Membrane Tau | 21.3 ms | |
| Rheobase | 170.0 pA | |
| ISI | 170.3 ms | |
| Threshold | −27.8 mV | |
| Spike Amplitude | 55.2 mV | |
| Slow AHP Amplitude | 20.6 mV | |
Appendix 1—table 37
Model Neurogliaform cell ion channels and conductance at highest density location in cell.
| Channel | Gmax (S/cm2) |
|---|---|
| CavL | 5.611e-02 |
| CavN | 5.817e-04 |
| KCaS | 4.515e-07 |
| Kdrfastngf | 1.551e-01 |
| KvAngf | 5.220e-06 |
| KvCaB | 1.024e-06 |
| Navngf | 3.786e+00 |
| leak | 8.471e-05 |
Appendix 1—table 38
Structural connection parameters for Neurogliaform cells, based on Bezaire and Soltesz (2013).
| Other type | Other cell to NGF | NGF to other cell | ||||||
|---|---|---|---|---|---|---|---|---|
| # | Syn.s | # | Post | # | Syn.s | # | Post | |
| Conn.s | /Conn. | # | Loc. | Conn.s | /Conn. | # | Loc. | |
| Ivy | 28 | 10 | 280 | any dendrite | ||||
| NGF | 17 | 10 | 170 | apical dendrite | 17 | 10 | 170 | apical dendrite |
| O-LM | 13 | 10 | 130 | apical dendrite | ||||
| Pyr | 1218 | 10 | 12181 | apical dendrite | ||||
| ECIII | 523 | 2 | 1046 | any dendrite | ||||
Appendix 1—table 39
Experimental constraints for incoming connections onto Neurogliaform cells (clamp: black=voltage; purple=current).
| Pre type | Exp. ref. | Hold (mV) | (mV) | Amp. (pA,mV) | Diff. % | (ms) | Diff. % | (ms) | Diff. % |
|---|---|---|---|---|---|---|---|---|---|
| NGF | Karayannis et al., 2010 | −65.0 | −11.0 | 85.50 | +0.2 | 4.83 | −1.7 | 32.03 | −46.9 |
| O-LM | Elfant et al., 2007 | −50.0 | −70.0 | 18.43 | −4.0 | 1.98 | −10.2 | 11.63 | +7.6 |
Appendix 1—table 40
Experimental constraints for outgoing connections from Neurogliaform cells (clamp: black=voltage; purple=current).
| Post type | Exp. ref. | Hold (mV) | (mV) | Amp. (pA,mV) | Diff. % | (ms) | Diff. % | (ms) | Diff. % |
|---|---|---|---|---|---|---|---|---|---|
| NGF | Karayannis et al., 2010 | −65.0 | −11.0 | 85.50 | +0.2 | 4.83 | −1.7 | 32.03 | −46.9 |
| Pyr | Price et al., 2008 | −50.0 | −89.0 | 5.25 | +7.1 | 15.48 | −3.9 | 32.73 | −34.5 |
Appendix 1—table 41
Model synaptic parameters for Neurogliaform cells in the control network.
| Type | Other cell to NGF | NGF to other cell | ||||||
|---|---|---|---|---|---|---|---|---|
| (mV) | (nS) | (ms) | (ms) | (mV) | (nS) | (ms) | (ms) | |
| Ivy | −60.0 | 5.700e-05 | 2.90 | 3.10 | ||||
| NGF | −60.0 | 1.600e-04 | 3.10 | 42.00 | −60.0 | 1.600e-04 | 3.10 | 42.00 |
| O-LM | −60.0 | 9.800e-05 | 1.30 | 10.20 | ||||
| Pyr | −60.0 | 6.500e-05 | 9.00 | 39.00 | ||||
| ECIII | 0.0 | 3.500e-03 | 2.00 | 6.30 | ||||
Appendix 1—table 42
Model synaptic properties under voltage clamp at −50 mV with physiological reversal potentials
| Type | Other cell to NGF | NGF to other cell | ||||||||
|---|---|---|---|---|---|---|---|---|---|---|
| Hold (mV) | (mV) | Amp. (pA) | (ms) | (ms) | Hold (mV) | (mV) | Amp. (pA) | (ms) | (ms) | |
| Ivy | −50.0 | −60.0 | 5.48 | 1.88 | 6.42 | |||||
| NGF | −50.0 | −60.0 | 17.52 | 5.67 | 14.32 | −50.0 | −60.0 | 17.52 | 5.67 | 14.32 |
| O-LM | −50.0 | −60.0 | 9.14 | 1.98 | 11.63 | |||||
| Pyr | −50.0 | −60.0 | 1.10 | 65.58 | 0.00 | |||||
| ECIII | −50.0 | 0.0 | 324.35 | 2.13 | 8.80 | |||||
Appendix 1—table 43
Model O-LM cell electrophysiological properties.
| Property | Value | |
|---|---|---|
| RMP | −68.0 mV | |
| Input Resistance | 267.7 MΩ | |
| Sag Amplitude | 26.5 mV | |
| Sag Tau | 42.5 ms | |
| Membrane Tau | 22.7 ms | |
| Rheobase | 20.0 pA | |
| ISI | 66.9 ms | |
| Threshold | −37.8 mV | |
| Spike Amplitude | 42.6 mV | |
| Slow AHP Amplitude | 34.6 mV | |
Appendix 1—table 44
Model O-LM cell ion channels and conductance at highest density location in cell.
| Channel | Gmax (S/cm2) |
|---|---|
| HCNolm | 5.000e-04 |
| Kdrfast | 1.174e-01 |
| KvAolm | 4.950e-03 |
| Nav | 2.340e-02 |
| leak | 1.000e-05 |
Appendix 1—table 45
Structural connection parameters for O-LM cells, based on Bezaire and Soltesz (2013).
| Other type | Other cell to O-LM | O-LM to other cell | ||||||
|---|---|---|---|---|---|---|---|---|
| # | Syn.s | # | Post | # | Syn.s | # | Post | |
| Conn.s | /Conn. | # | Loc. | Conn.s | /Conn. | # | Loc. | |
| Axo | 7 | 10 | 71 | apical dendrite | ||||
| Bis | 39 | 10 | 390 | any dendrite | 11 | 10 | 107 | apical dendrite |
| CCK+B | 20 | 8 | 160 | any dendrite | 88 | 10 | 878 | apical dendrite |
| Ivy | 136 | 10 | 1360 | any dendrite | ||||
| NGF | 28 | 10 | 283 | apical dendrite | ||||
| O-LM | 6 | 10 | 60 | basal dendrite | 6 | 10 | 60 | basal dendrite |
| Pyr | 2379 | 3 | 7137 | basal dendrite | 1520 | 10 | 15195 | apical dendrite |
| PV+B | 27 | 10 | 269 | apical dendrite | ||||
| SC-A | 10 | 10 | 97 | apical dendrite | ||||
Appendix 1—table 46
Experimental constraints for outgoing connections from O-LM cells (clamp: black=voltage; purple=current).
| Post type | Exp. ref. | Hold (mV) | (mV) | Amp. (pA,mV) | Diff. % | (ms) | Diff. % | (ms) | Diff. % |
|---|---|---|---|---|---|---|---|---|---|
| NGF | Elfant et al., 2007 | −50.0 | −70.0 | 18.43 | −4.0 | 1.98 | −10.2 | 11.63 | +7.6 |
| Pyr | Maccaferri et al., 2000 | −70.0 | 7.0 | 24.35 | −6.3 | 4.68 | −24.6 | 18.88 | −9.3 |
| SC-A | Elfant et al., 2007 | −50.0 | −70.0 | 17.06 | −12.5 | 4.07 | +114.5 | 30.08 | −3.6 |
Appendix 1—table 47
Model synaptic parameters for O-LM cells in the control network.
| Type | Other cell to O-LM | O-LM to other cell | ||||||
|---|---|---|---|---|---|---|---|---|
| (mV) | (nS) | (ms) | (ms) | (mV) | (nS) | (ms) | (ms) | |
| Axo | −60.0 | 1.200e-04 | 0.73 | 10.00 | ||||
| Bis | −60.0 | 2.000e-05 | 1.00 | 8.00 | −60.0 | 1.100e-04 | 0.60 | 15.00 |
| CCK+B | −60.0 | 7.000e-04 | 1.00 | 8.00 | −60.0 | 1.200e-03 | 0.73 | 20.20 |
| Ivy | −60.0 | 5.700e-05 | 2.90 | 3.10 | ||||
| NGF | −60.0 | 9.800e-05 | 1.30 | 10.20 | ||||
| O-LM | −60.0 | 1.200e-03 | 0.25 | 7.50 | −60.0 | 1.200e-03 | 0.25 | 7.50 |
| Pyr | 0.0 | 2.000e-04 | 0.30 | 0.60 | −60.0 | 3.000e-04 | 0.13 | 11.00 |
| PV+B | −60.0 | 1.100e-03 | 0.25 | 7.50 | ||||
| SC-A | −60.0 | 1.500e-04 | 0.07 | 29.00 | ||||
Appendix 1—table 48
Model synaptic properties under voltage clamp at −50 mV with physiological reversal potentials
| Type | Other cell to O-LM | O-LM to other cell | ||||||||
|---|---|---|---|---|---|---|---|---|---|---|
| Hold (mV) | (mV) | Amp. (pA) | (ms) | (ms) | Hold (mV) | (mV) | Amp. (pA) | (ms) | (ms) | |
| Axo | −50.0 | −60.0 | 4.76 | 2.55 | 12.03 | |||||
| Bis | −50.0 | −60.0 | 1.86 | 1.78 | 8.13 | −50.0 | −60.0 | 6.31 | 2.70 | 17.05 |
| CCK+B | −50.0 | −60.0 | 54.98 | 1.35 | 9.05 | −50.0 | −60.0 | 40.32 | 3.10 | 28.42 |
| Ivy | −50.0 | −60.0 | 5.32 | 2.10 | 6.33 | |||||
| NGF | −50.0 | −60.0 | 9.14 | 1.98 | 11.63 | |||||
| O-LM | −50.0 | −60.0 | 78.69 | 1.05 | 9.30 | −50.0 | −60.0 | 78.69 | 1.05 | 9.30 |
| Pyr | −50.0 | 0.0 | 17.47 | 0.60 | 1.53 | −50.0 | −60.0 | 0.54 | 3.70 | 14.10 |
| PV+B | −50.0 | −60.0 | 35.53 | 1.65 | 10.18 | |||||
| SC-A | −50.0 | −60.0 | 7.91 | 3.90 | 29.83 | |||||
Appendix 1—table 49
Model PV+ Basket cell electrophysiological properties.
| Property | Value | |
|---|---|---|
| RMP | −65.0 mV | |
| Input Resistance | 52.1 MΩ | |
| Sag Amplitude | − | |
| Sag Tau | − | |
| Membrane Tau | 7.0 ms | |
| Rheobase | 300.0 pA | |
| ISI | 151.4 ms | |
| Threshold | −36.7 mV | |
| Spike Amplitude | 90.7 mV | |
| Slow AHP Amplitude | 41.4 mV | |
Appendix 1—table 50
Model PV+ Basket cell ion channels and conductance at highest density location in cell.
| Channel | Gmax (S/cm2) |
|---|---|
| CavL | 5.000e-03 |
| CavN | 8.000e-04 |
| KCaS | 2.000e-06 |
| Kdrfast | 1.300e-02 |
| KvA | 1.500e-04 |
| KvCaB | 2.000e-07 |
| Navaxonp | 1.500e-01 |
| leak | 1.800e-04 |
Appendix 1—table 51
Structural connection parameters for PV+ Basket cells, based on Bezaire and Soltesz (2013).
| Other type | Other cell to PV+B | PV+B to other cell | ||||||
|---|---|---|---|---|---|---|---|---|
| # | Syn.s | # | Post | # | Syn.s | # | Post | |
| Conn.s | /Conn. | # | Loc. | Conn.s | /Conn. | # | Loc. | |
| Axo | 10 | 1 | 10 | soma | ||||
| Bis | 16 | 10 | 160 | any dendrite | 16 | 1 | 15 | soma |
| CCK+B | 12 | 8 | 96 | any dendrite | 25 | 1 | 24 | soma |
| Ivy | 24 | 10 | 240 | any dendrite | 13 | 1 | 12 | soma |
| O-LM | 8 | 10 | 80 | apical dendrite | ||||
| Pyr | 424 | 3 | 1272 | apical dendrite | 958 | 11 | 10533 | soma |
| PV+B | 39 | 1 | 39 | soma | 39 | 1 | 39 | soma |
| SC-A | 2 | 1 | 1 | soma | ||||
| CA3 | 6047 | 2 | 12094 | any dendrite | ||||
Appendix 1—table 52
Experimental constraints for incoming connections onto PV+ Basket cells (clamp: black=voltage; purple=current).
| Pre type | Exp. ref. | Hold (mV) | (mV) | Amp. (pA,mV) | Diff. % | (ms) | Diff. % | (ms) | Diff. % |
|---|---|---|---|---|---|---|---|---|---|
| Pyr | Lee et al., 2014 | −60.0 | 0.0 | 15.09 | −67.7 | 0.28 | −72.5 | 1.83 | −55.7 |
| PV+B | Cobb et al., 1997 | −59.0 | −70.0 | 0.29 | +14.9 | 2.67 | +105.8 | 14.72 | −45.5 |
Appendix 1—table 53
Experimental constraints for outgoing connections from PV+ Basket cells (clamp: black=voltage; purple=current).
| Post type | Exp. ref. | Hold (mV) | (mV) | Amp. (pA,mV) | Diff. % | (ms) | Diff. % | (ms) | Diff. % |
|---|---|---|---|---|---|---|---|---|---|
| Bis | Cobb et al., 1997 | −55.0 | −70.0 | 0.27 | −27.5 | 0.47 | −52.5 | 11.85 | +30.4 |
| Pyr | Szabadics et al., 2007 | −70.0 | −26.0 | 91.94 | −13.9 | 0.50 | −5.7 | 6.70 | +4.7 |
| PV+B | Cobb et al., 1997 | −59.0 | −70.0 | 0.29 | +14.9 | 2.67 | +105.8 | 13.45 | −45.5 |
Appendix 1—table 54
Model synaptic parameters for PV+ Basket cells in the control network.
| Type | Other cell to PV+B | PV+B to other cell | ||||||
|---|---|---|---|---|---|---|---|---|
| (mV) | (nS) | (ms) | (ms) | (mV) | (nS) | (ms) | (ms) | |
| Axo | −60.0 | 1.200e-04 | 0.29 | 2.67 | ||||
| Bis | −60.0 | 9.000e-03 | 0.29 | 2.67 | −60.0 | 2.900e-03 | 0.18 | 0.45 |
| CCK+B | −60.0 | 9.000e-03 | 0.43 | 4.49 | −60.0 | 1.200e-03 | 0.29 | 2.67 |
| Ivy | −60.0 | 7.000e-04 | 2.90 | 3.10 | −60.0 | 1.600e-04 | 0.29 | 2.67 |
| O-LM | −60.0 | 1.100e-03 | 0.25 | 7.50 | ||||
| Pyr | 0.0 | 7.000e-04 | 0.07 | 0.20 | −60.0 | 2.000e-04 | 0.30 | 6.20 |
| PV+B | −60.0 | 1.600e-03 | 0.08 | 4.80 | −60.0 | 1.600e-03 | 0.08 | 4.80 |
| SC-A | −60.0 | 6.000e-04 | 0.29 | 2.67 | ||||
| CA3 | 0.0 | 2.200e-04 | 2.00 | 6.30 | ||||
Appendix 1—table 55
Model synaptic properties under voltage clamp at −50 mV with physiological reversal potentials
| Type | Other cell to PV+B | PV+B to other cell | ||||||||
|---|---|---|---|---|---|---|---|---|---|---|
| Hold (mV) | (mV) | Amp. (pA) | (ms) | (ms) | Hold (mV) | (mV) | Amp. (pA) | (ms) | (ms) | |
| Axo | −50.0 | −60.0 | 1.08 | 0.45 | 3.13 | |||||
| Bis | −50.0 | −60.0 | 429.34 | 0.57 | 4.13 | −50.0 | −60.0 | 24.45 | 0.17 | 0.73 |
| CCK+B | −50.0 | −60.0 | 523.11 | 0.68 | 5.70 | −50.0 | −60.0 | 11.31 | 0.42 | 3.08 |
| Ivy | −50.0 | −60.0 | 51.35 | 2.05 | 6.75 | −50.0 | −60.0 | 1.44 | 0.55 | 3.13 |
| O-LM | −50.0 | −60.0 | 35.53 | 1.65 | 10.18 | |||||
| Pyr | −50.0 | 0.0 | 14.75 | 0.25 | 1.77 | −50.0 | −60.0 | 20.56 | 0.50 | 6.70 |
| PV+B | −50.0 | −60.0 | 13.94 | 0.23 | 5.25 | −50.0 | −60.0 | 13.94 | 0.23 | 5.25 |
| SC-A | −50.0 | −60.0 | 5.71 | 0.42 | 3.08 | |||||
| CA3 | −50.0 | 0.0 | 19.71 | 2.38 | 8.78 | |||||
Appendix 1—table 56
Model Schaffer Collateral-Associated cell electrophysiological properties.
| Property | Value | |
|---|---|---|
| RMP | −70.5 mV | |
| Input Resistance | 300.0 MΩ | |
| Sag Amplitude | 12.9 mV | |
| Sag Tau | 41.7 ms | |
| Membrane Tau | 28.9 ms | |
| Rheobase | 60.0 pA | |
| ISI | 115.9 ms | |
| Threshold | −36.6 mV | |
| Spike Amplitude | 80.3 mV | |
| Slow AHP Amplitude | 35.2 mV | |
Appendix 1—table 57
Model Schaffer Collateral-Associated cell ion channels and conductance at highest density location in cell.
| Channel | Gmax (S/cm2) |
|---|---|
| CavL | 1.000e-03 |
| CavN | 2.000e-05 |
| HCN | 7.000e-05 |
| KCaS | 1.000e-06 |
| Kdrfast | 6.000e-05 |
| KvA | 1.000e-04 |
| KvCaB | 7.000e-06 |
| KvGroup | 2.200e-03 |
| Navcck | 4.000e-02 |
| leak | 2.857e-05 |
Appendix 1—table 58
Structural connection parameters for Schaffer Collateral-Associated cells, based on Bezaire and Soltesz (2013).
| Other type | Other cell to SC-A | SC-A to other cell | ||||||
|---|---|---|---|---|---|---|---|---|
| # | Syn.s | # | Post | # | Syn.s | # | Post | |
| Conn.s | /Conn. | # | Loc. | Conn.s | /Conn. | # | Loc. | |
| Axo | 4 | 6 | 22 | any dendrite | ||||
| Bis | 17 | 10 | 170 | any dendrite | 6 | 6 | 33 | any dendrite |
| CCK+B | 27 | 8 | 216 | any dendrite | 54 | 6 | 324 | any dendrite |
| Ivy | 102 | 10 | 1020 | any dendrite | 44 | 6 | 264 | any dendrite |
| O-LM | 40 | 10 | 400 | apical dendrite | ||||
| Pyr | 105 | 3 | 315 | apical dendrite | ||||
| PV+B | 24 | 1 | 24 | soma | ||||
| CA3 | 1940 | 2 | 3880 | any dendrite | ||||
| ECIII | 573 | 2 | 1146 | any dendrite | ||||
Appendix 1—table 59
Experimental constraints for incoming connections onto Schaffer Collateral-Associated cells (clamp: black=voltage; purple=current).
| Pre type | Exp. ref. | Hold (mV) | (mV) | Amp. (pA,mV) | Diff. % | (ms) | Diff. % | (ms) | Diff.% |
|---|---|---|---|---|---|---|---|---|---|
| O-LM | Elfant et al., 2007 | −50.0 | −70.0 | 17.06 | −12.5 | 4.07 | +114.5 | 30.08 | −3.6 |
| SC-A | Pawelzik et al., 2002 | −58.0 | −70.0 | 1.53 | −405.6 | 2.35 | −41.3 | 22.90 | −33.2 |
Appendix 1—table 60
Experimental constraints for outgoing connections from Schaffer Collateral-Associated cells (clamp: black=voltage; purple=current).
| Post type | Exp. ref. | Hold (mV) | (mV) | Amp. (pA,mV) | Diff. % | (ms) | Diff. % | (ms) | Diff. % |
|---|---|---|---|---|---|---|---|---|---|
| Pyr | Lee et al., 2010 | −70.0 | −26.0 | 52.42 | −12.9 | 1.63 | +13.6 | 8.55 | +3.0 |
| SC-A | Pawelzik et al., 2002 | −58.0 | −70.0 | 1.53 | −405.6 | 2.35 | −41.3 | 27.98 | −33.2 |
Appendix 1—table 61
Model synaptic parameters for Schaffer Collateral-Associated cells in the control network.
| Other cell to SC-A | SC-A to other cell | |||||||
|---|---|---|---|---|---|---|---|---|
| Type | (mV) | (nS) | (ms) | (ms) | (mV) | (nS) | (ms) | (ms) |
| Axo | −60.0 | 6.000e-04 | 0.42 | 4.99 | ||||
| Bis | −60.0 | 8.000e-04 | 0.29 | 2.67 | −60.0 | 6.000e-04 | 0.42 | 4.99 |
| CCK+B | −60.0 | 7.000e-04 | 0.43 | 4.49 | −60.0 | 8.500e-04 | 0.42 | 4.99 |
| Ivy | −60.0 | 3.700e-05 | 2.90 | 3.10 | −60.0 | 8.500e-04 | 0.42 | 4.99 |
| O-LM | −60.0 | 1.500e-04 | 0.07 | 29.00 | ||||
| Pyr | 0.0 | 4.050e-04 | 0.30 | 0.60 | ||||
| PV+B | −60.0 | 6.000e-04 | 0.29 | 2.67 | ||||
| CA3 | 0.0 | 3.000e-04 | 2.00 | 6.30 | ||||
| ECIII | 0.0 | 4.500e-04 | 2.00 | 6.30 | ||||
Appendix 1—table 62
Model synaptic properties under voltage clamp at −50 mV with physiological reversal potentials
| Type | Other cell to SC-A | SC-A to other cell | ||||||||
|---|---|---|---|---|---|---|---|---|---|---|
| Hold (mV) | (mV) | Amp. (pA) | (ms) | (ms) | Hold (mV) | (mV) | Amp. (pA) | (ms) | (ms) | |
| Axo | −50.0 | −60.0 | 24.00 | 1.00 | 6.13 | |||||
| Bis | −50.0 | −60.0 | 50.35 | 0.70 | 4.10 | −50.0 | −60.0 | 26.43 | 1.02 | 6.20 |
| CCK+B | −50.0 | −60.0 | 49.55 | 0.70 | 5.38 | −50.0 | −60.0 | 33.81 | 1.05 | 6.90 |
| Ivy | −50.0 | −60.0 | 3.09 | 2.22 | 6.88 | −50.0 | −60.0 | 46.62 | 0.85 | 5.58 |
| O-LM | −50.0 | −60.0 | 7.91 | 3.90 | 29.83 | |||||
| Pyr | −50.0 | 0.0 | 17.42 | 0.68 | 3.05 | |||||
| PV+B | −50.0 | −60.0 | 5.71 | 0.42 | 3.08 | |||||
| CA3 | −50.0 | 0.0 | 27.10 | 2.35 | 9.13 | |||||
| ECIII | −50.0 | 0.0 | 31.82 | 3.38 | 10.47 | |||||
Appendix 1—table 63
Measured dendritic lengths and somatic diameters for ivy and neurogliaform cells from the hippocampal CA1 area in Wistar rats, with calculation of somatic surface area included. Cells were characterized in our lab and their function has been reported in Krook-Magnuson et al. (2011). Source Data available in Appendix 1—table 1 - Source Data.
| Cell type | Cell name | Dendritic length (M)) | Somatic dia-meter (m) | Calculated synap-tic Area () | ||||
|---|---|---|---|---|---|---|---|---|
| # Sections | SO | SP | SR | SLM | ||||
| Ivy | 0217–1 DAB 3_2_10 left slice | 1 | 129.2 | 64.5 | 1200.6 | 0 | 38.9 | 1188.5 |
| Ivy | 9 n23-7 DAB 12_16_09 left+middle slice | 2 | 0 | 0 | 2703.2 | 300.3 | 45.2 | 1604.6 |
| Ivy | 9 n23-6 DAB 06_10 left slice | 1 | 75.4 | 133.8 | 2115.4 | 0 | 36.6 | 1052.1 |
| Ivy | 9 n16-3 DAB 12_29_09 left slice | 1 | 0 | 0 | 1015.2 | 0 | 52.5 | 2164.8 |
| Ivy | Average | 51.15 | 49.575 | 1758.6 | 75.075 | 1502.5 | ||
| Neurogliaform | 9n 12–5 DAB 1_06_09 | 1 | 0 | 0 | 2097.7 | 525 | 34.4 | 929.4 |
| Neurogliaform | 91021 DAB 3_18_10 second,third,fourth from left slice | 3 | 0 | 0 | 1230.7 | 780.1 | 28 | 615.8 |
| Neurogliaform | 9d 8–3 DAB 1_15_10 left and right slice | 2 | 0 | 0 | 2328.2 | 1382.4 | 32.2 | 814.3 |
| Neurogliaform | Average | 0 | 0 | 1885.5 | 895.8 | 786.5 | ||
Appendix 1—table 64
Estimated or observed somatic area and dendritic length. Experimental observations of the dendritic length of broad interneuron classes were used as the basis for these estimations. The relative lengths for PV+ basket cells and axo-axonic cells were further differentiated based on experimental observations in region CA3 Papp et al. (2013). The observations published in Mátyás et al. (2004) for CCK+ basket cells were also applied to the CCK+ Schaffer Collateral-Associated cells, based on the discussion in Mátyás et al. (2004). The data for ivy and neurogliaform cells were based on measurements from filled cells from slices. Due to the compact nature of their morphology, especially the neurogliaform cells, the dendritic lengths within the slices were assumed to comprise most or all of the dendritic extents of those cells. See section below for raw data. The O-LM cell morphological measurements were taken from Blasco-Ibáñez and Freund (1995).
| Interneuron | Soma area (100 ) | Dendritic length () | Reference | ||||
|---|---|---|---|---|---|---|---|
| Total | SO | SP | SR | SLM | |||
| Ivy | 1502 | 1934.4 | 51.15 | 49.575 | 1758.6 | 75.075 | See below |
| Neurogliaform | 786 | 2781.4 | 0 | 0 | 1885.5 | 895.8 | See below |
| PV+ basket | 3428 | 4359 | 1493 | 697 | 1877 | 292 | (Papp et al., 2013) |
| Bistratified | 1006 | 4347.75 | 1074.57 | 248.28 | 2369.24 | 655.66 | (Gulyás et al., 1999) |
| Axo-axonic | 2329 | 2825 | 570 | 659 | 1259 | 337 | (Papp et al., 2013) |
| CCK+ basket | 966 | 6338.31 | 1213.92 | 310.61 | 3522.6 | 1291.18 | (Mátyás et al., 2004) |
| SCA | 966 | 6338.31 | 1213.92 | 310.61 | 3522.6 | 1291.18 | (Mátyás et al., 2004) |
| O-LM | 3007.78 | 4165.68 | 4165.68 | 0 | 0 | 0 | (Blasco-Ibáñez and Freund, 1995) |
Appendix 1—table 65
The synaptic densities (# boutons per 100 m of dendritic length, or # boutons per 100 m of somatic area) on the soma and dendrites of PV cells, given in Gulyás et al. (1999), were applied to the axo-axonic, PV+ basket, and bistratified cells. The synaptic densities of CCK+ cells Mátyás et al. (2004) were applied to the CCK+ basket and the Schaffer Collateral-Associated cells. For the ivy, neurogliaform, and O-LM cells, there were not sufficient experimental data published to constrain the synaptic density, and so an average of all synaptic densities for all cell classes was computed and applied to these cell types.
| Dendritic | |||||||||||
|---|---|---|---|---|---|---|---|---|---|---|---|
| Somatic | SO | SP | SR | SLM | |||||||
| Reference | Exc | Inh | Exc | Inh | Exc | Inh | Exc | Inh | Exc | Inh | Ref |
| Ivy | 21.8 | 16.1 | 172.2 | 23.7 | 163.3 | 38.5 | 193.8 | 25.3 | 97.4 | 31.7 | Calc. from average |
| Neurogliaform | 21.8 | 16.1 | 172.2 | 23.7 | 163.3 | 38.5 | 193.8 | 25.3 | 97.4 | 31.7 | Calc. from average |
| PV+ basket | 40.7 | 18.1 | 342.5 | 19.2 | 345 | 16.1 | 371.2 | 18.3 | 132.2 | 28.6 | (Gulyás et al., 1999) |
| Bistratified | 40.7 | 18.1 | 342.5 | 19.2 | 345 | 16.1 | 371.2 | 18.3 | 132.2 | 28.6 | (Gulyás et al., 1999) |
| Axo-axonic | 40.7 | 18.1 | 342.5 | 19.2 | 345 | 16.1 | 371.2 | 18.3 | 132.2 | 28.6 | (Gulyás et al., 1999) |
| CCK+ basket | 3.4 | 16.1 | 84.3 | 32.5 | 52.7 | 87.4 | 82 | 37.8 | 86.5 | 58.8 | (Mátyás et al., 2004) |
| SCA | 3.4 | 16.1 | 84.3 | 32.5 | 52.7 | 87.4 | 82 | 37.8 | 86.5 | 58.8 | (Mátyás et al., 2004) |
| O-LM | 21.8 | 16.1 | 172.2 | 23.7 | 163.3 | 38.5 | 193.8 | 25.3 | 97.4 | 31.7 | Calc. from average |
Appendix 1—table 66
Estimated numbers of excitatory and inhibitory synapses on each cell type, calculated by multiplying the somatic area or dendritic length by the respective synaptic density. About 20% of synapses onto O-LM cells are GABAergic, while at least 60% are from local excitatory collaterals Kispersky et al. (2012). Therefore, we conserved the total (inhibitory + excitatory) synaptic density of O-LM cells as calculated previously, but set 20% of that total to be inhibitory and the rest to be excitatory synapses.
| Dendritic | |||||||||||||
|---|---|---|---|---|---|---|---|---|---|---|---|---|---|
| Somatic | SO | SP | SR | SLM | Total | ||||||||
| Ref | Exc | Inh | Exc | Inh | Exc | Inh | Exc | Inh | Exc | Inh | Exc | Inh | Ref |
| Ivy | 326.9 | 242.3 | 88 | 12 | 82 | 19 | 3408 | 445 | 73 | 24 | 3651 | 500 | Calculated |
| Neurogliaform | 171.1 | 126.8 | 0 | 0 | 0 | 0 | 3654 | 477 | 873 | 284 | 4527 | 761 | Calculated |
| PV+ basket | 1395.2 | 620.1 | 4230 | 237 | 866 | 40 | 9449 | 466 | 840 | 182 | 15385 | 925 | Calculated |
| Bistratified | 409.4 | 182 | 3681 | 206 | 856 | 40 | 8796 | 434 | 867 | 188 | 14200 | 868 | Calculated |
| Axo-axonic | 947.9 | 421.3 | 1615 | 90 | 819 | 38 | 6338 | 313 | 969 | 210 | 9741 | 651 | Calculated |
| CCK+ basket | 32.8 | 155.7 | 1024 | 394 | 164 | 271 | 2887 | 1332 | 1117 | 759 | 5192 | 2756 | Calculated |
| SCA | 32.8 | 155.7 | 1024 | 394 | 164 | 271 | 2887 | 1332 | 1117 | 759 | 5192 | 2756 | Calculated |
| O-LM | 654.6 | 485.2 | 6527 | 1632 | 0 | 0 | 0 | 0 | 0 | 0 | 6527 | 1632 | Calculated |
Appendix 1—table 67
Ion channels included in the model. GHK: based on Goldman-Hodgkin-Katz equation; Q-O: quasi-ohmic; Hyperpol.-act: Hyperpolarization-activated; Nucleo.-gated: Nucleotide-gated; voltage-act.: voltage activated; voltage-dep.: voltage dependent; Calcium-act.: Calcium-activated; Pyr.: pyramidal; NGF: neurogliaform; dist.: distal; prox.: proximal.
| Ion | Model | ||||||||||
|---|---|---|---|---|---|---|---|---|---|---|---|
| Channel | Description | Type | Pyramidal | Axo-axonic | Bistratified | CCK+ Basket | Ivy | Neurogliaform | O-LM | PV+ Basket | S.C.-Assoc. |
| Ca | L-type Calcium | GHK | |||||||||
| Ca | N-type Calcium | Q-O | |||||||||
| HCN | Hyperpol.-act, Cyclic Nucleo.-gated | Q-O | |||||||||
| HCN | Hyperpol.-act, Cyclic Nucleo.-gated for O-LM cells | Q-O | |||||||||
| HCN | Hyperpol.-act, Cyclic Nucleo.-gated for Pyr. cells | Q-O | |||||||||
| K | Small (SK) Calcium-activated potassium | Q-O | |||||||||
| K | Fast delayed rectifier potassium | Q-O | |||||||||
| K | Fast delayed rectifier potassium for NGF-family cells | Q-O | |||||||||
| K | Delayed rectifier potassium for Pyr. cells | Q-O | |||||||||
| K | A-type voltage-act. potassium | Q-O | |||||||||
| K | A-type voltage-act. potassium for dist. Pyr. dendrites | Q-O | |||||||||
| K | A-type voltage-act. potassium for NGF-family cells | Q-O | |||||||||
| K | A-type voltage-act. potassium for O-LM cells | Q-O | |||||||||
| K | A-type voltage-act. potassium for prox. Pyr. dendrites | Q-O | |||||||||
| K | Big (BK) Calcium-act., voltage-dep. potassium | Q-O | |||||||||
| K | Multiple slower voltage-dep. potassium | Q-O | |||||||||
| leak | Leak | Q-O | |||||||||
| Na | Voltage-dep. sodium | Q-O | |||||||||
| Na | Voltage-dep. sodium for bistratified cells | Q-O | |||||||||
| Na | Voltage-dep. sodium for CCK+ cells | Q-O | |||||||||
| Na | Voltage-dep. sodium for NGF-family cells | Q-O | |||||||||
| Na | Voltage-dep. sodium for Pyr. cells | Q-O | |||||||||
| pas | Leak | Q-O |
Download links
A two-part list of links to download the article, or parts of the article, in various formats.
Downloads (link to download the article as PDF)
Open citations (links to open the citations from this article in various online reference manager services)
Cite this article (links to download the citations from this article in formats compatible with various reference manager tools)
Interneuronal mechanisms of hippocampal theta oscillations in a full-scale model of the rodent CA1 circuit
eLife 5:e18566.
https://doi.org/10.7554/eLife.18566


