Implications of the differing roles of the β1 and β3 transmembrane and cytoplasmic domains for integrin function
- Vanderbilt University Medical Center, United States
- Vanderbilt Medical Center, United States
- Max Planck Institute of Biochemistry, Germany
- Veterans Affairs Hospital, United States
Figures
Figure 1
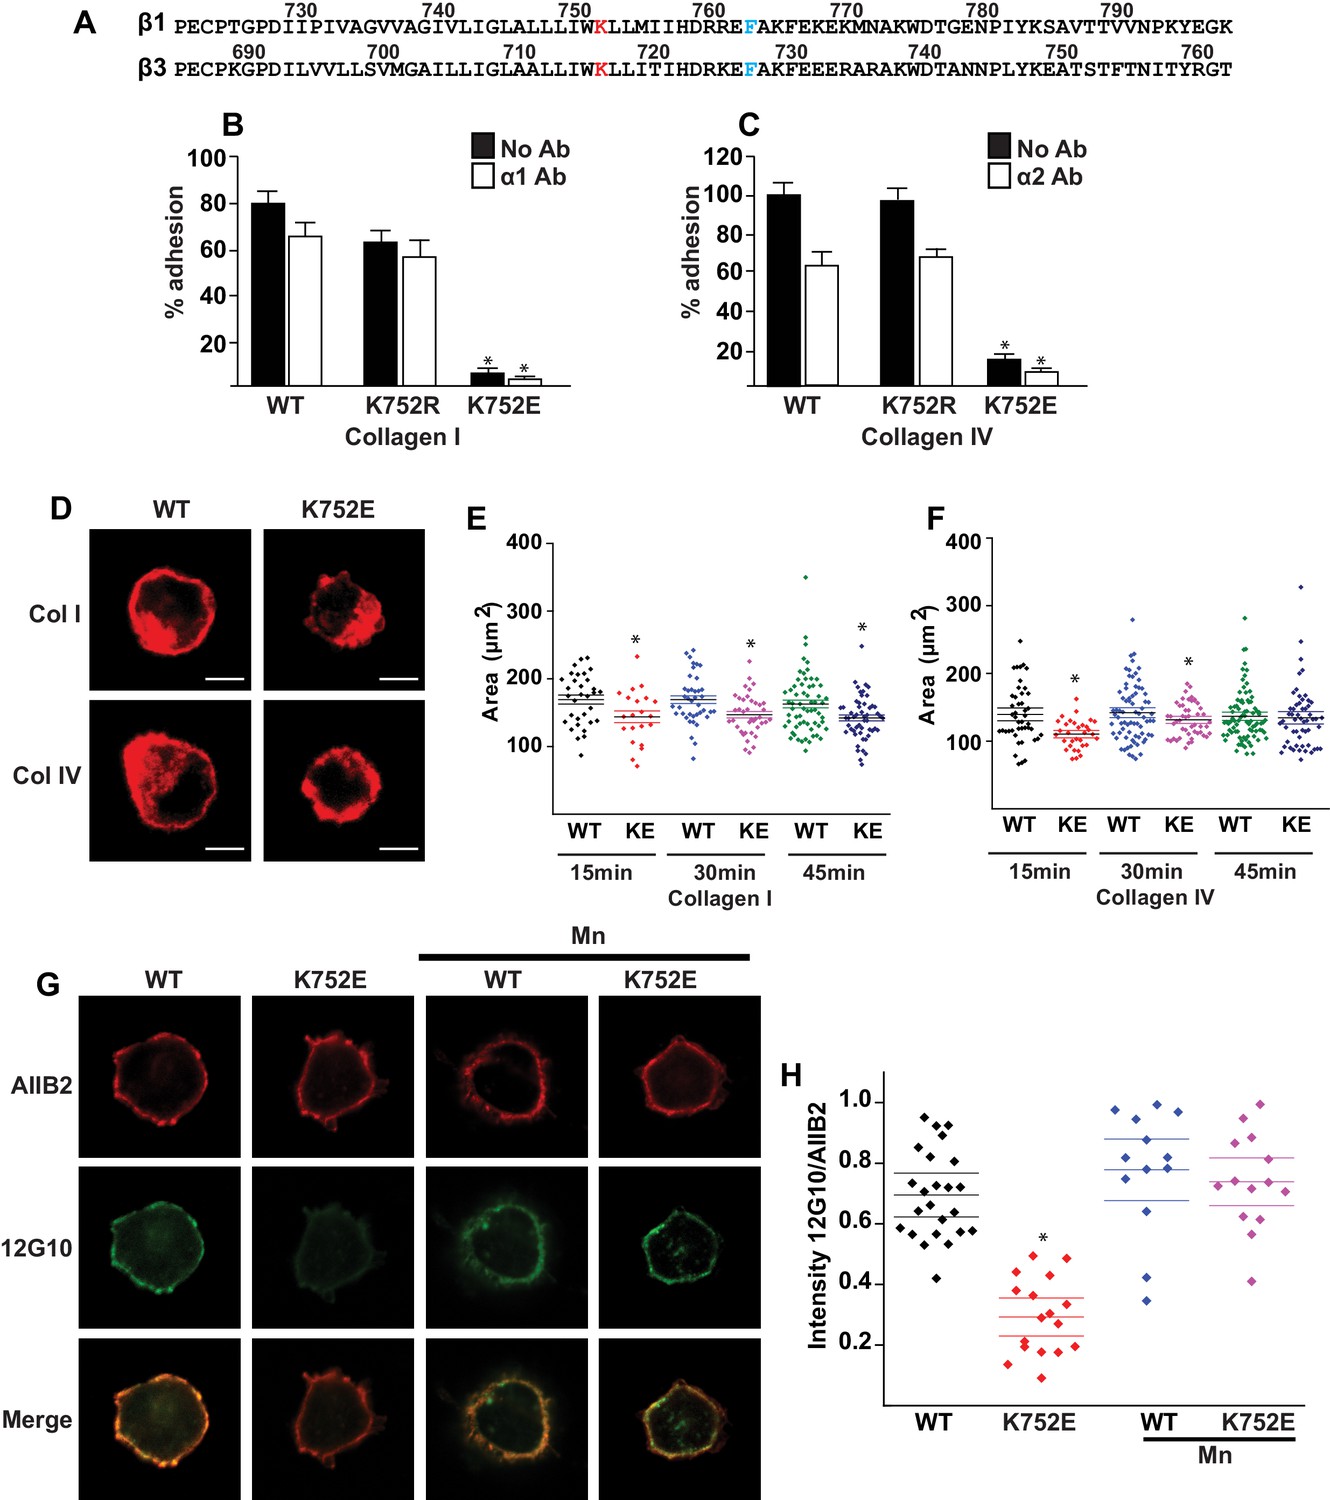
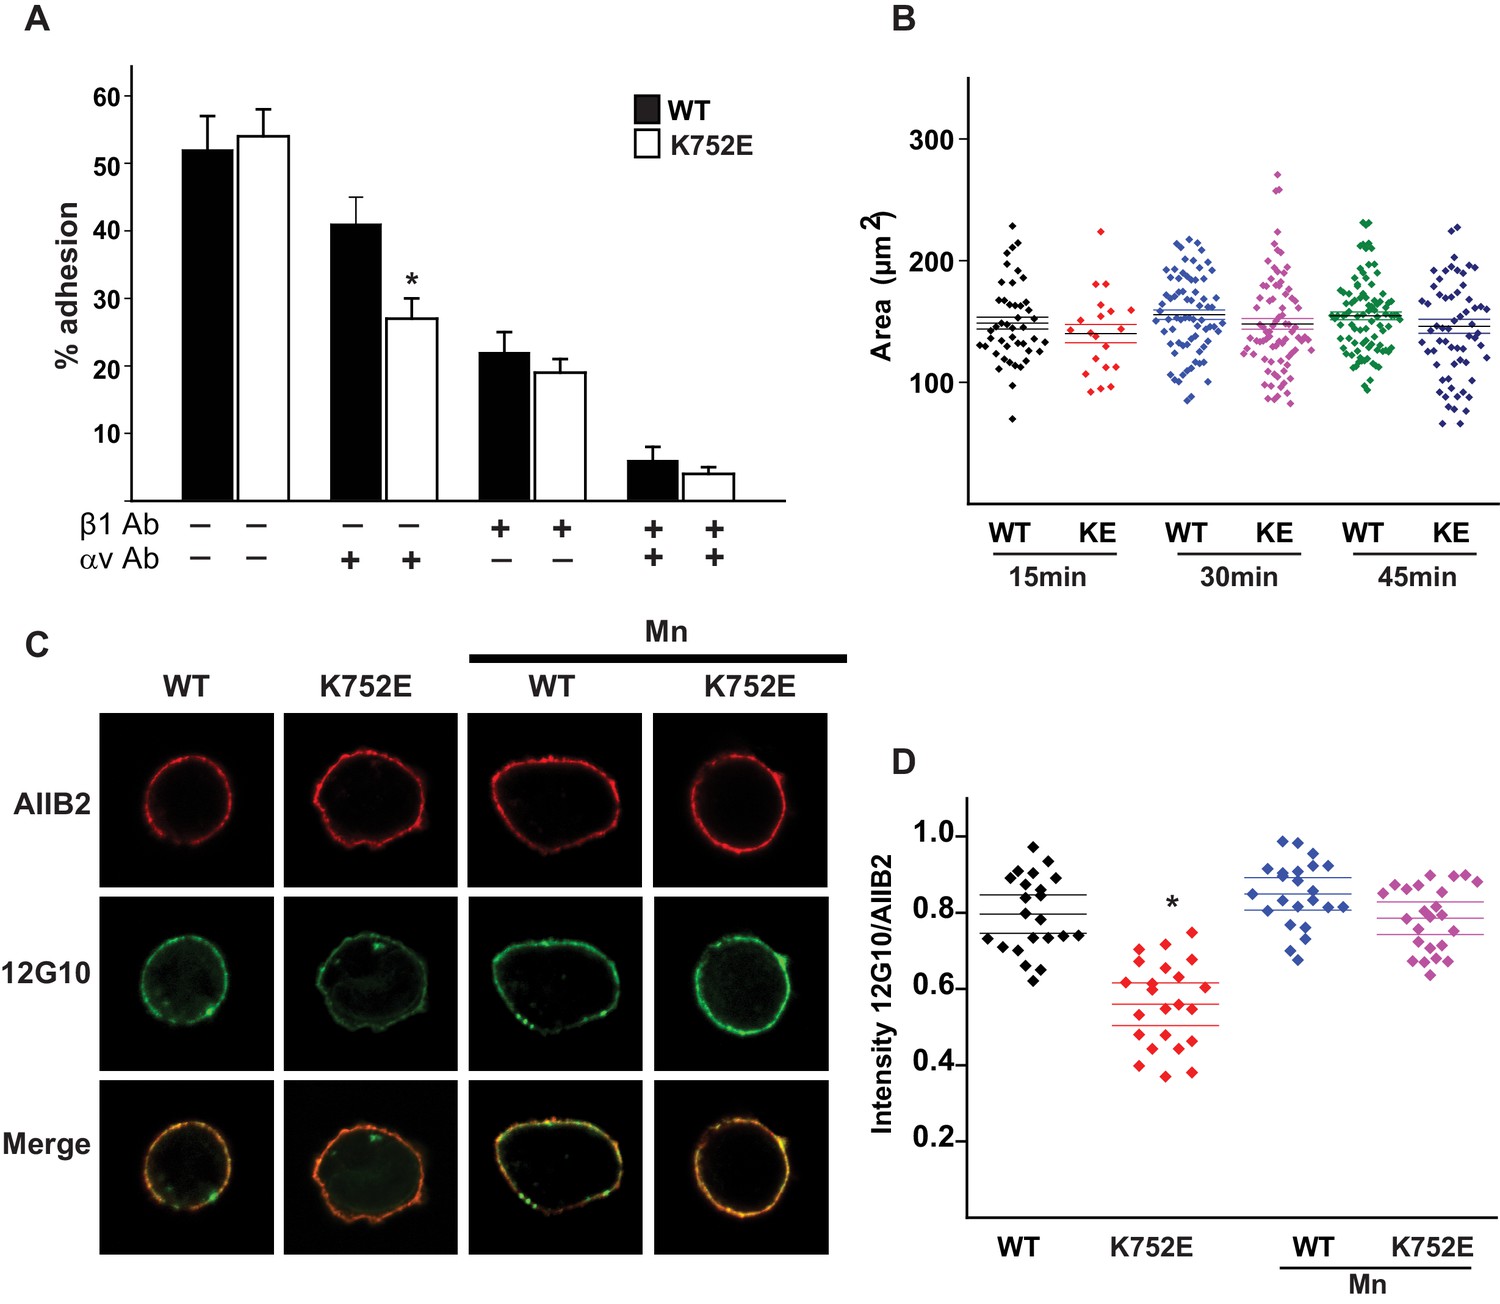
The β1-K752E mutation decreases collecting duct cell adhesion to collagens.
(A) The sequences of the β1 and β3 TM/CTs are annotated. The highly conserved lysine (K752 in integrin β1and K716 in integrin β3) is colored in red. The β3 TM-only construct used in previous studies (Kim et al., 2012) ends at F727, which was colored in blue along with the corresponding residue in β1, F763. (B–C) The adhesion of CD cells to collagen I (0.5 μg/ml) (B) or collagen IV (0.25 μg/ml) (C) for 1 hr was measured. These assays were performed in the presence and absence of blocking antibodies to α1 or α2 respectively. The error bars indicate SD and * indicates a statistically significant difference (p<0.01) between WT and K752E CD cells. These assays were performed at least three times. (D–F) The spreading of wild type and K752E CD cells on collagen I and collagen IV at 15, 30 and 45 min was measured on cells stained with rhodamine phalloidin. All the images were taken close to the substrate. Representative cells at 30 min on both collagen I and IV is shown (D). The area of at least 35 cells per time point were quantified using ImageJ software and expressed graphically. Scale bar represents 10 microns (E and F). The error bars indicate SD and * indicates a statistically significant difference (p<0.05) between WT and K752E CD cells. These assays were performed at least three times. (G–H). The active conformation of integrin β1 on adherent wild type (WT) and K752E expressing CD cells that were allowed to adhere to collagen I for 1 hr was determined using 12 G10 antibody. Total integrin β1 surface expression was determined using AIIB2 antibody. All the images were taken close to the substrate. (G). The relative fluorescence intensity of 12 G10/AIIB2 as described in the Materials and methods is expressed graphically (H). The error bars indicate SD and * indicates a statistically significant difference (p<0.01) between WT and K752E CD cells. These experiments were performed at least three times each. Intensity measurements were performed on over 40 different fields for each of the samples.
Figure 2 with 2 supplements
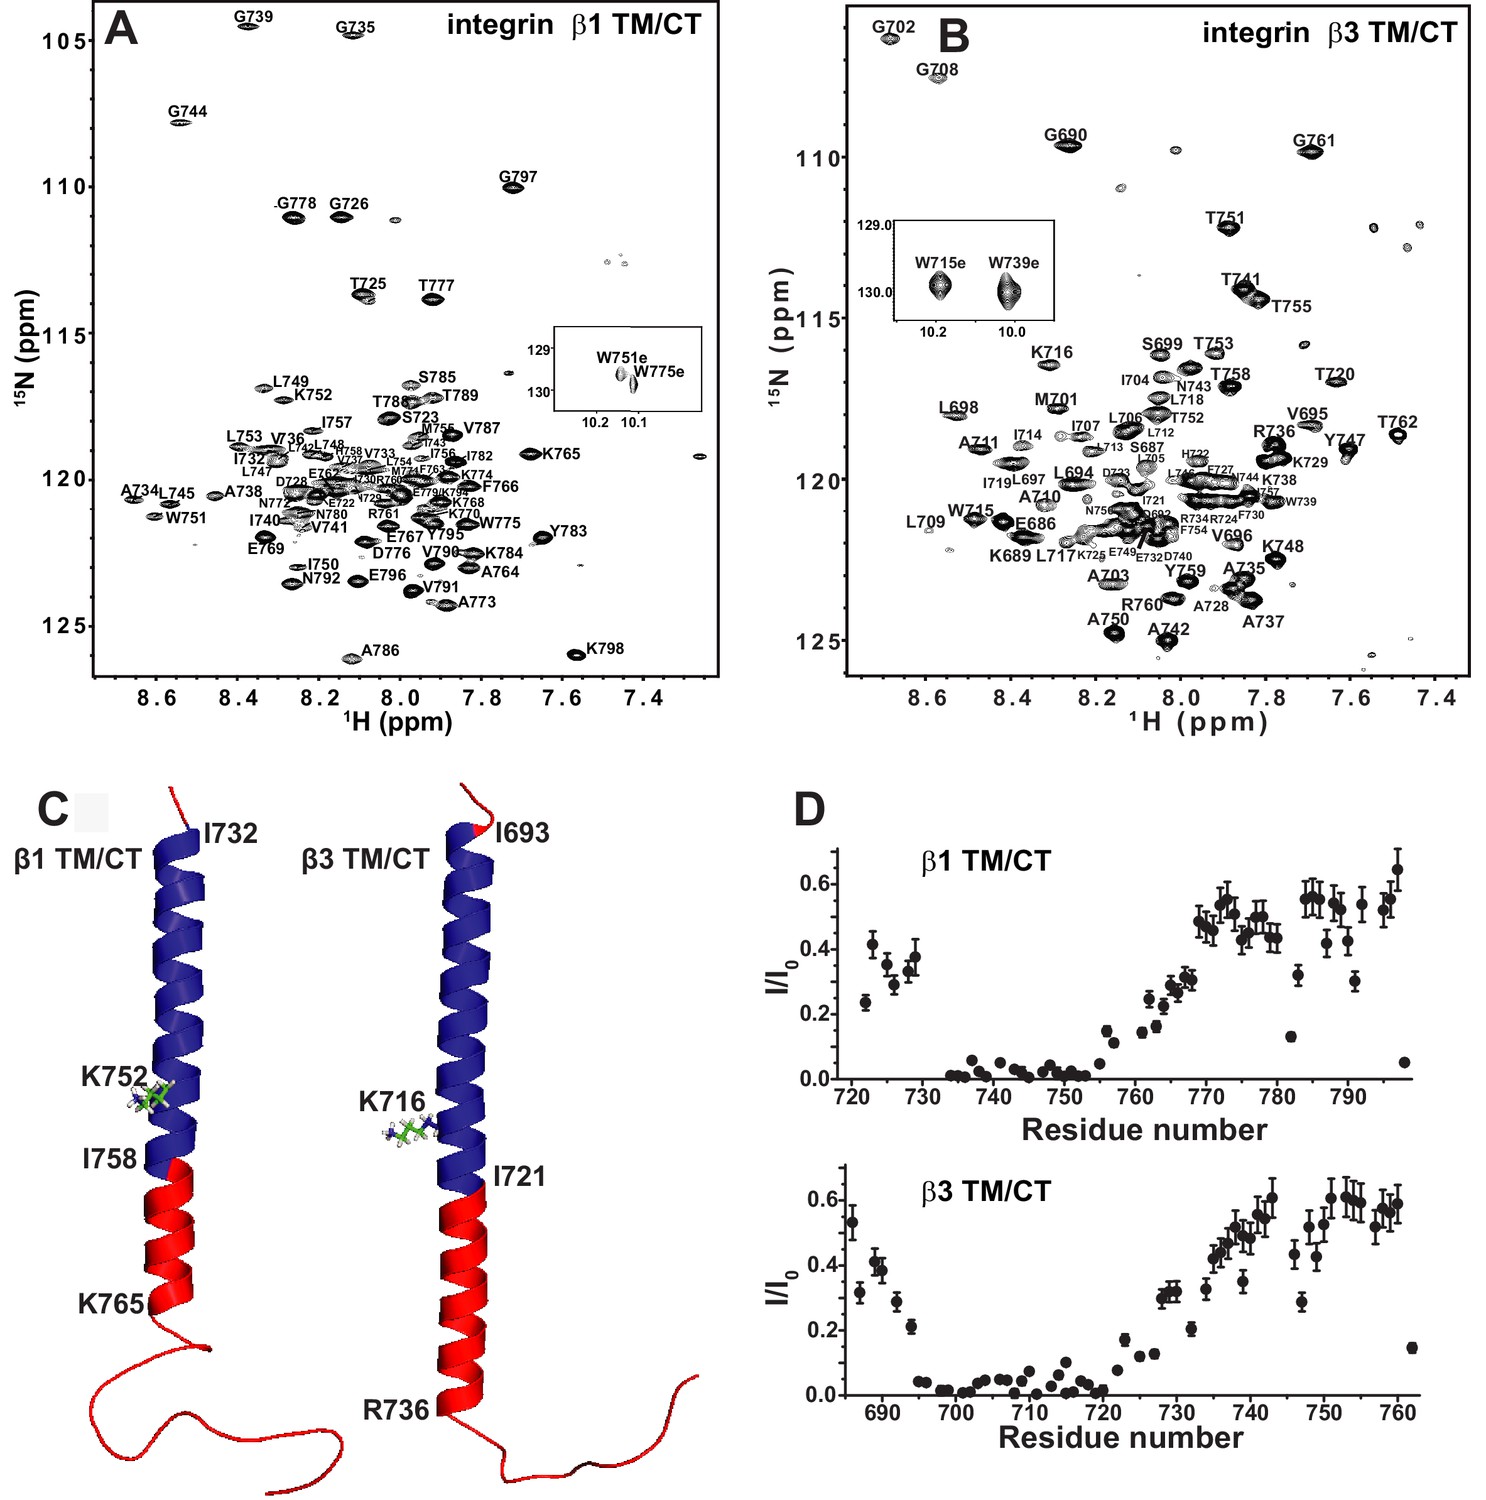
The β1 and β3 transmembrane and cytosolic domains have distinct structures.
(A) 800 MHz 1H-15N TROSY spectrum of the WT integrin β1 TM/CT with peak assignments shown. This spectrum was collected at 45°C and the sample contains 500 µM β1 TM/CT (0.57 mol%), 20% q = 0.3 D6PC-DMPC bicelles, 1 mM EDTA, 250 mM IMD at pH 6.5% and 10% D2O. (B) 900MHz 1H-15N TROSY spectrum of the WT integrin β3 TM/CT with peak assignments shown. This spectrum was collected at 45°C and the sample contained 300 µM β3 TM/CT, 20% q = 0.3 D6PC-DMPC bicelles, 1 mM EDTA, 250 mM IMD buffer at pH 6.5, with 10% D2O. (C) Structural comparison of integrin β1 and β3 TM/CT in D6PC/DMPC bicelles. These structural models are based on backbone dihedral angles as determined by TALOS-N and chemical shift index analysis of backbone NMR chemical shift values. The figure was made in PYMOL. As described in the results section, the CT segments of the helices observed for both β integrins appear to be subject to significant dynamic fraying. (D) Assessment of exchange of protons between backbone amide sites and water at 100 msec, as determined by the CLEANEX-PM NMR experiment. Sites with low peak intensities after the 100 msec mixing period relative to control conditions (I/I0) are resistant to hydrogen exchange, while sites with high I/I0 values exchange rapidly on the time scale of 100 msec.
Figure 2—figure supplement 1
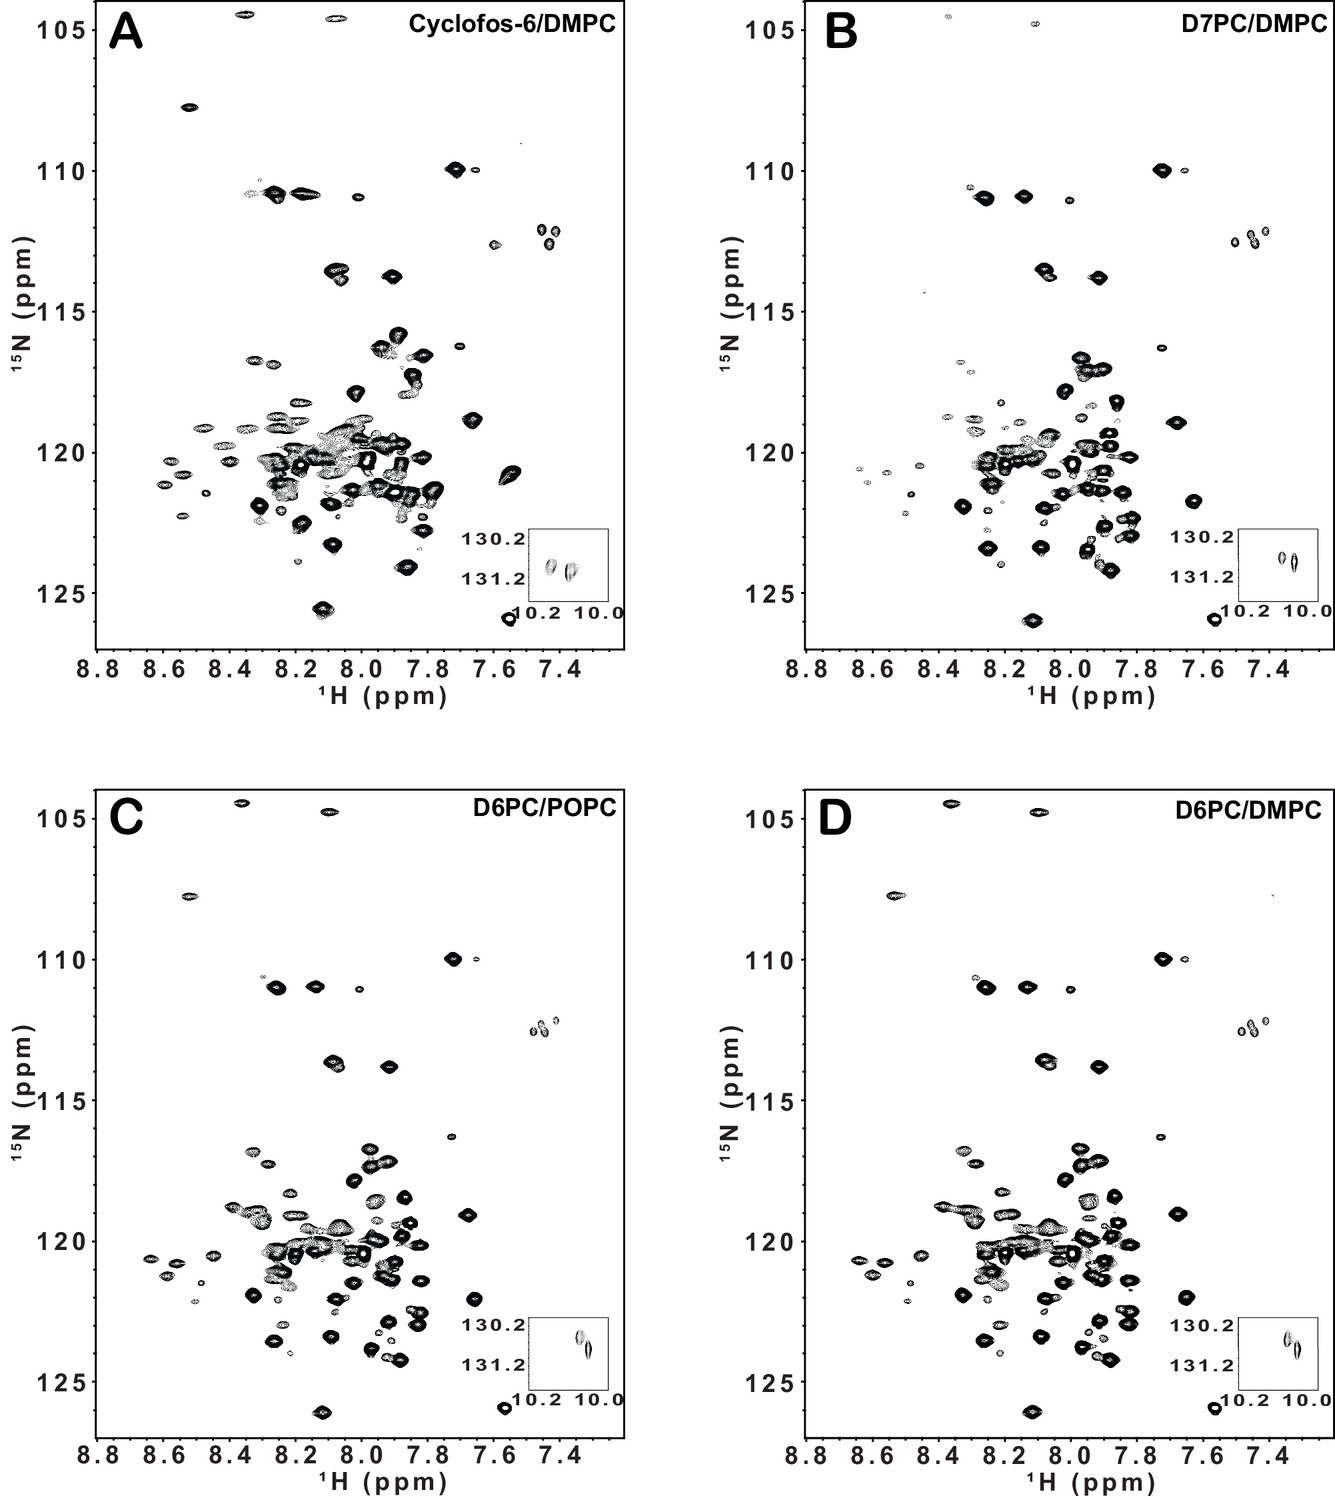
900 MHz 1H,15N-TROSY spectra of integrin β1 TM/CT.
900 MHz 1H,15N-TROSY spectra of integrin β1 TM/CTat 45o C in four different bicelle mixtures: (A) Cyclofos-6/DMPC, (B) D7PC/DMPC, (C) D6PC/POPC, (D) D6PC/DMPC. The NMR samples contain ~500 µM β1 TM/CT, 20% q = 0.3 bicelles, 1 mM EDTA, 250 mM IMD, at pH 6.5, with 10% D2O.
Figure 2—figure supplement 2
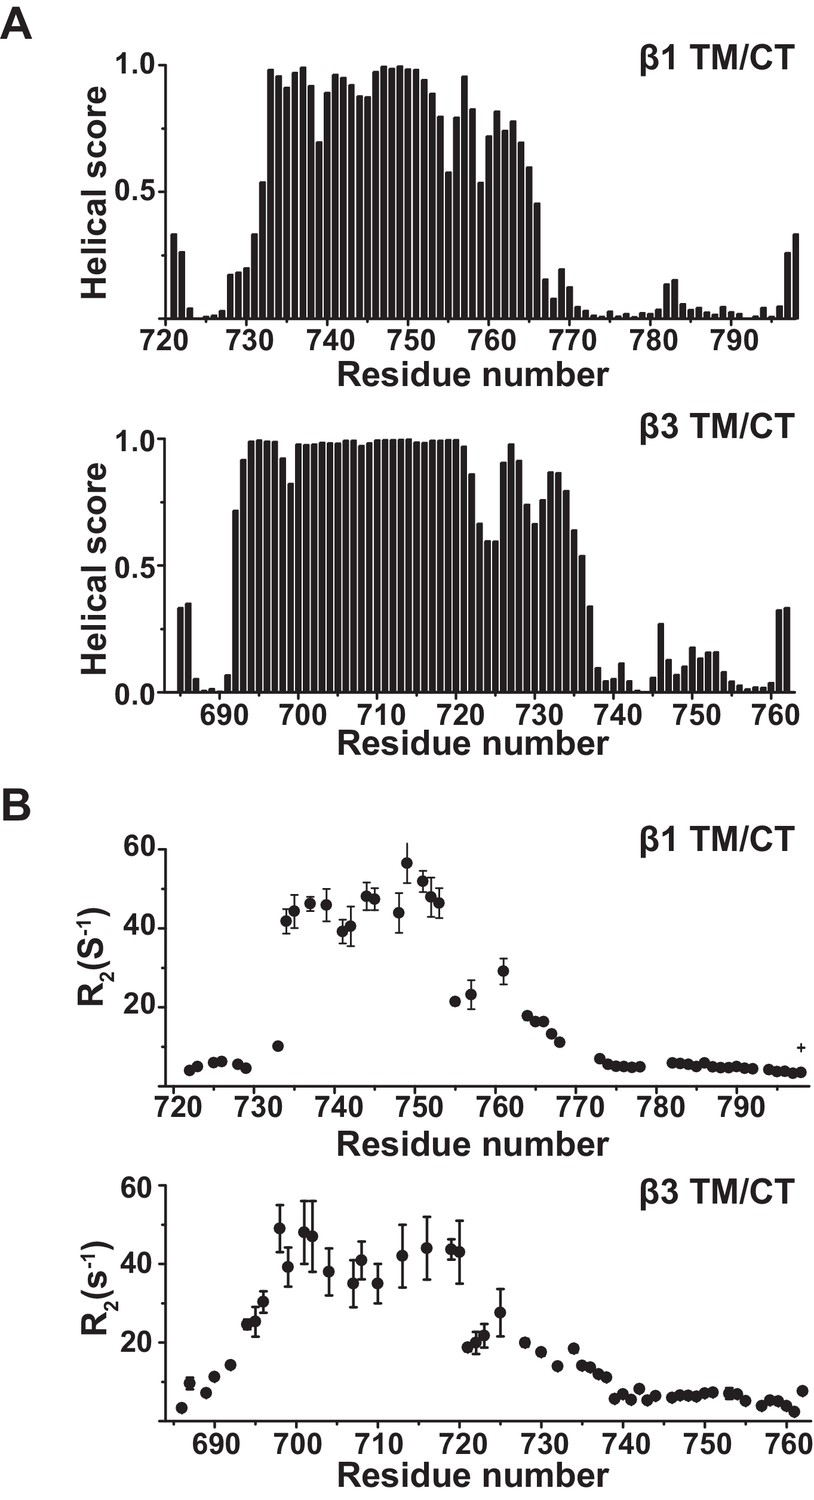
NMR chemical shifts to determine alpha helical content of the integrin β1 and β3 TM/CT.
(A) TALOS-N analysis of backbone 13C NMR chemical shifts to determine α-helical content of the integrin β1 and β3 TM/CT. Sample conditions were as described in the captions for Figure 2A and B. (B) 600 MHz backbone 15N NMR transverse relation rates (R2) for the integrin β1 and β3 TM/CT. Sample conditions were as described in the captions for Figure 2A and B.
Figure 3 with 1 supplement

Examination of the bilayer topology of integrin WT β1 TM/CT and two mutants (K752E, K752R) in bicelles using NMR and paramagnetic probes.
Peak intensity changes in the 600MHz 1H-15N TROSY spectra are reported for the integrin WT β1 TM/CT and two mutants (K752E, K752R) as induced either by 4 mol% 16-DSA as the hydrophobic paramagnet or by 10 mM Gd-DTPA as the water soluble paramagnet. The spectra were collected at 45°C and the samples contained ~500 µM β1 TM/CT, 20% q = 0.3 D6PC-DMPC bicelles, 1 mM EDTA, 250 mM IMD buffer at pH 6.5, with10% D2O. The overlaid spectra for WT β1 TM/CT containing no paramagnetic probe (black, bottom) and with Gd-DTPA (red, on top) are shown (A), while the corresponding spectra for the two mutants are shown in supporting Figure 3. The absence of a red peak indicates that the peak is broadened beyond detection by the presence of the paramagnetic probe. The overlay of spectra for WT β1 TM/CT containing 16-DSA (red) versus no paramagnetic probe (black) are shown (B). Panel C shows the peak intensity changes induced by 10 mM Gd-DTPA on the three forms of the integrin β1 TM/CT, while panel D shows the results for 16-DSA. The intensity ratio (I/I0) reported for each TROSY amide resonance is the observed peak intensity in the presence of the paramagnetic probe divided by the intensity of the corresponding peak under probe-free diamagnetic conditions. Two replicates of this experiment giving consistent results were performed. We show one representative example. The error is estimated from the noise level, or 5% of value, whichever is larger.
Figure 3—figure supplement 1
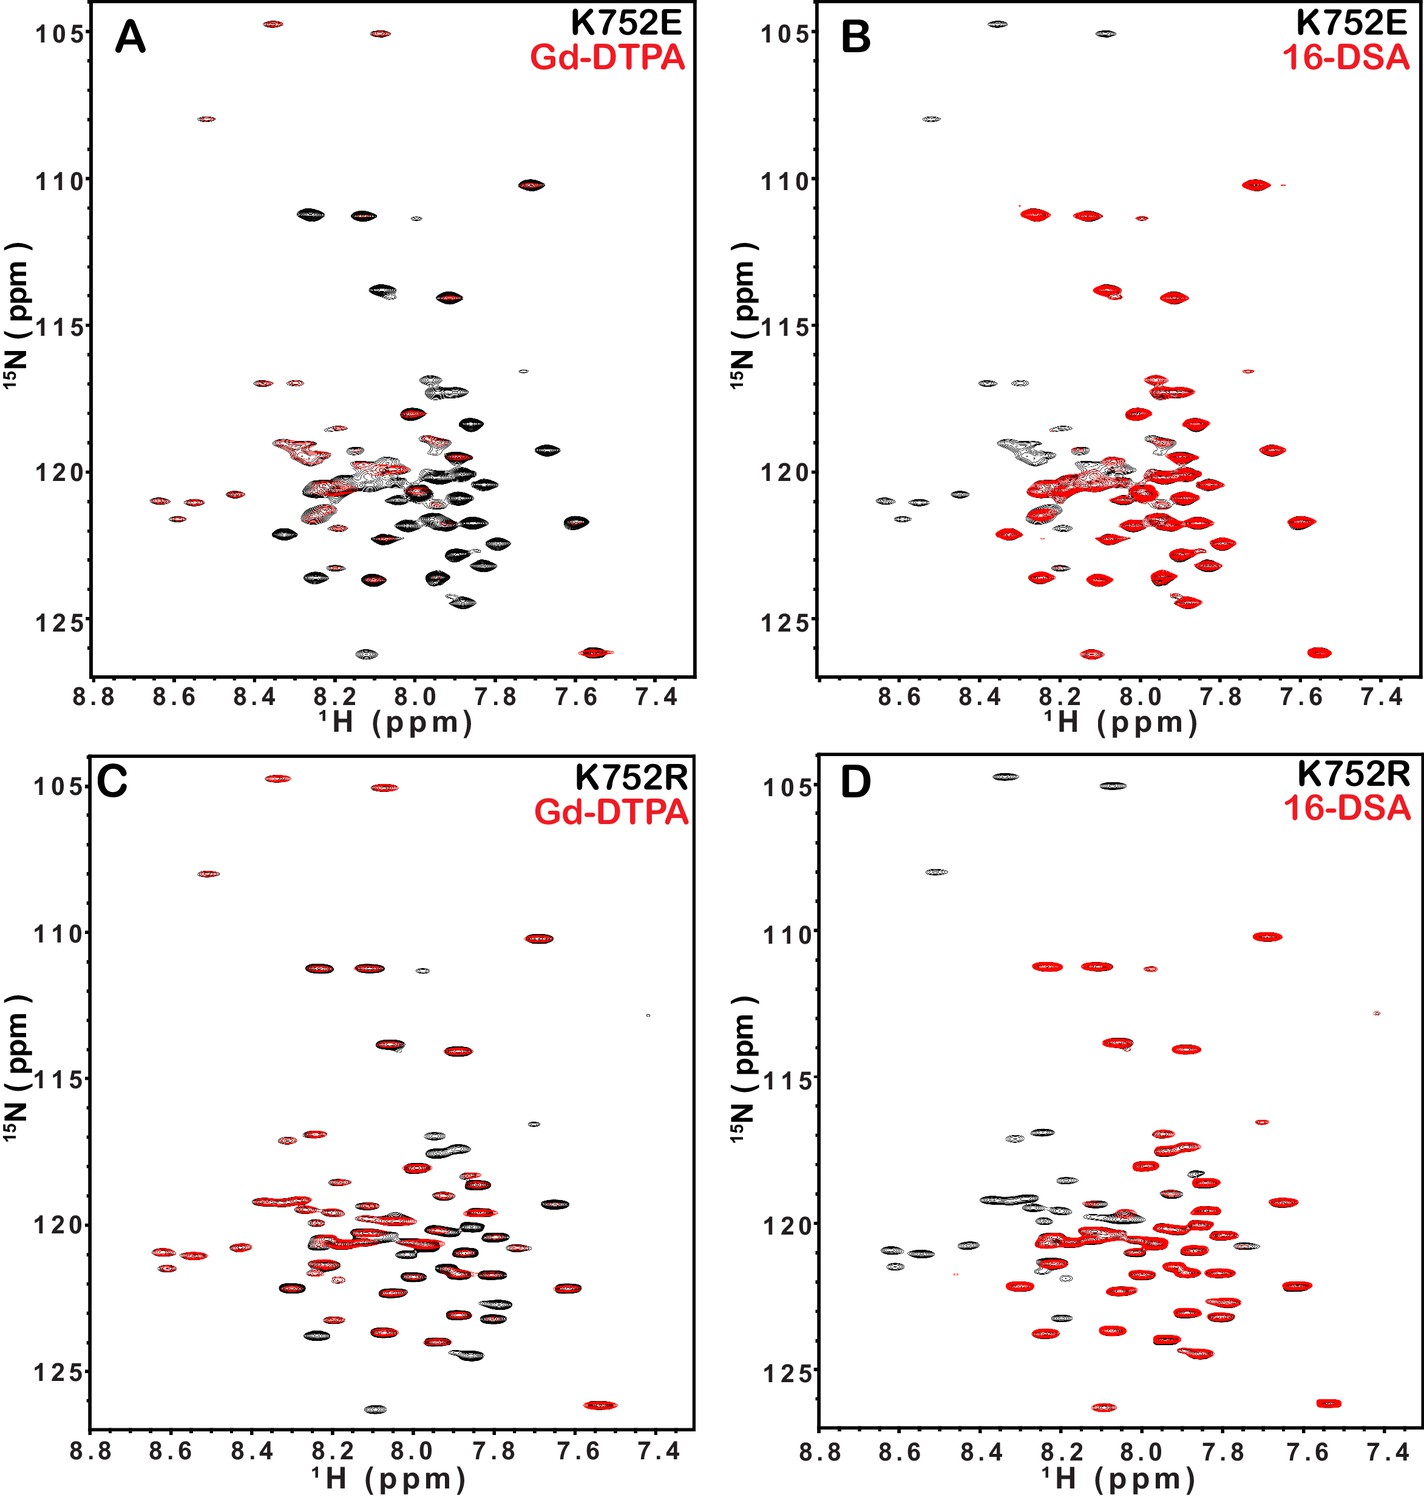
1H,15N-TROSY spectral overlays of integrin β1 TM/CT in D6PC/DMPC bicelle with no paramagnetic probe (black) and with either 10 mM Gd-DTPA (red) or 4 mol% 16-DSA (red).
Panels A–B are for integrin β1 K752E and panels C–D are for the K752R mutant form. The NMR samples contain ~500 µM β1 TM/CT, 20% q = 0.3 D6PC/DMPC bicelles, 1 mM EDTA 250 mM IMD, at pH 6.5, with 10% D2O. All the spectra were collected with a 600MHz NMR spectrometer at 45°C.
Figure 4 with 1 supplement
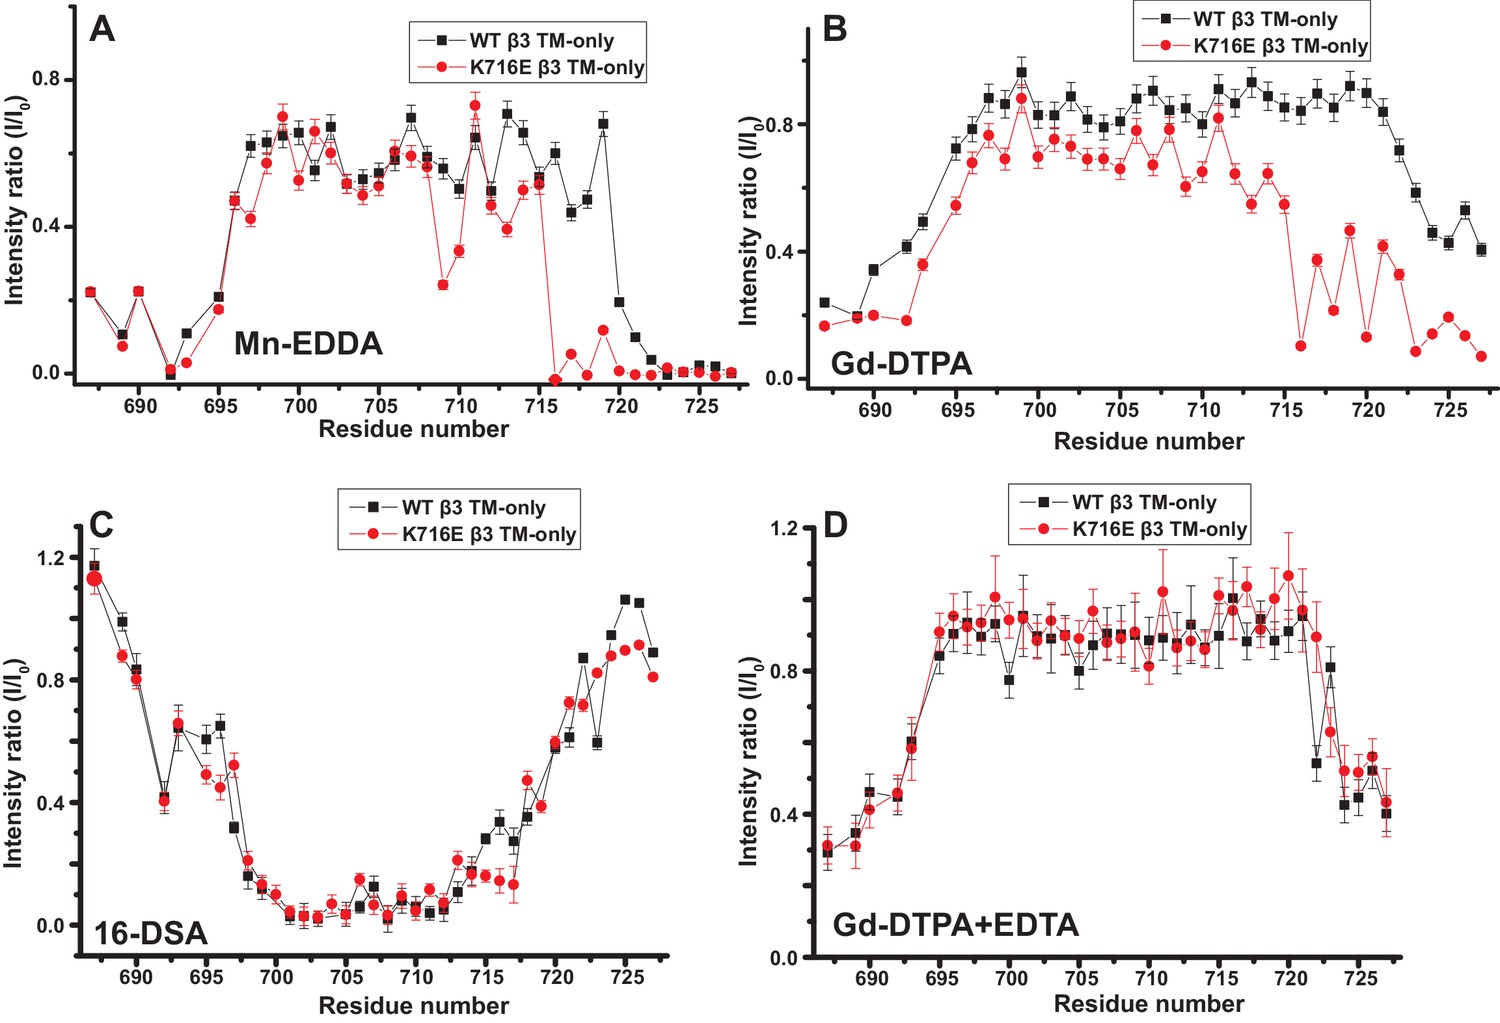
Examination of the bilayer topology of isolated WT integrin β3 TM and of β3 K716E TM in bicelles using NMR and paramagnetic probes.
Paramagnetic probe-induced intensity changes are reported for the peaks in 900 MHz 1H-15N TROSY spectra of WT integrin β3 TM and β3 K716E TM at 45°C: (A) 1 mM Mn-EDDA, (B) 10 mM Gd-DTPA, (C) 10 mM Gd-DTPA plus 10 mM EDTA, (D) 4 mol % 16-DSA. The NMR samples contained 0.3 mM protein, 20% D6PC/POPC/POPS bicelles (q = 0.3, 2:1 POPC:POPS), 25 mM HEPES at pH 7.4, with 10% D2O. The intensity ratio (I/I0) reported for each TROSY amide resonance is the observed peak intensity in the presence of the paramagnetic probe divided by the intensity of the corresponding peak under probe-free diamagnetic conditions. Three replicates of these experiments giving consistent results were performed. We show one representative example. The error is estimated from noise level, or 5% of value, whichever is larger.
Figure 4—figure supplement 1
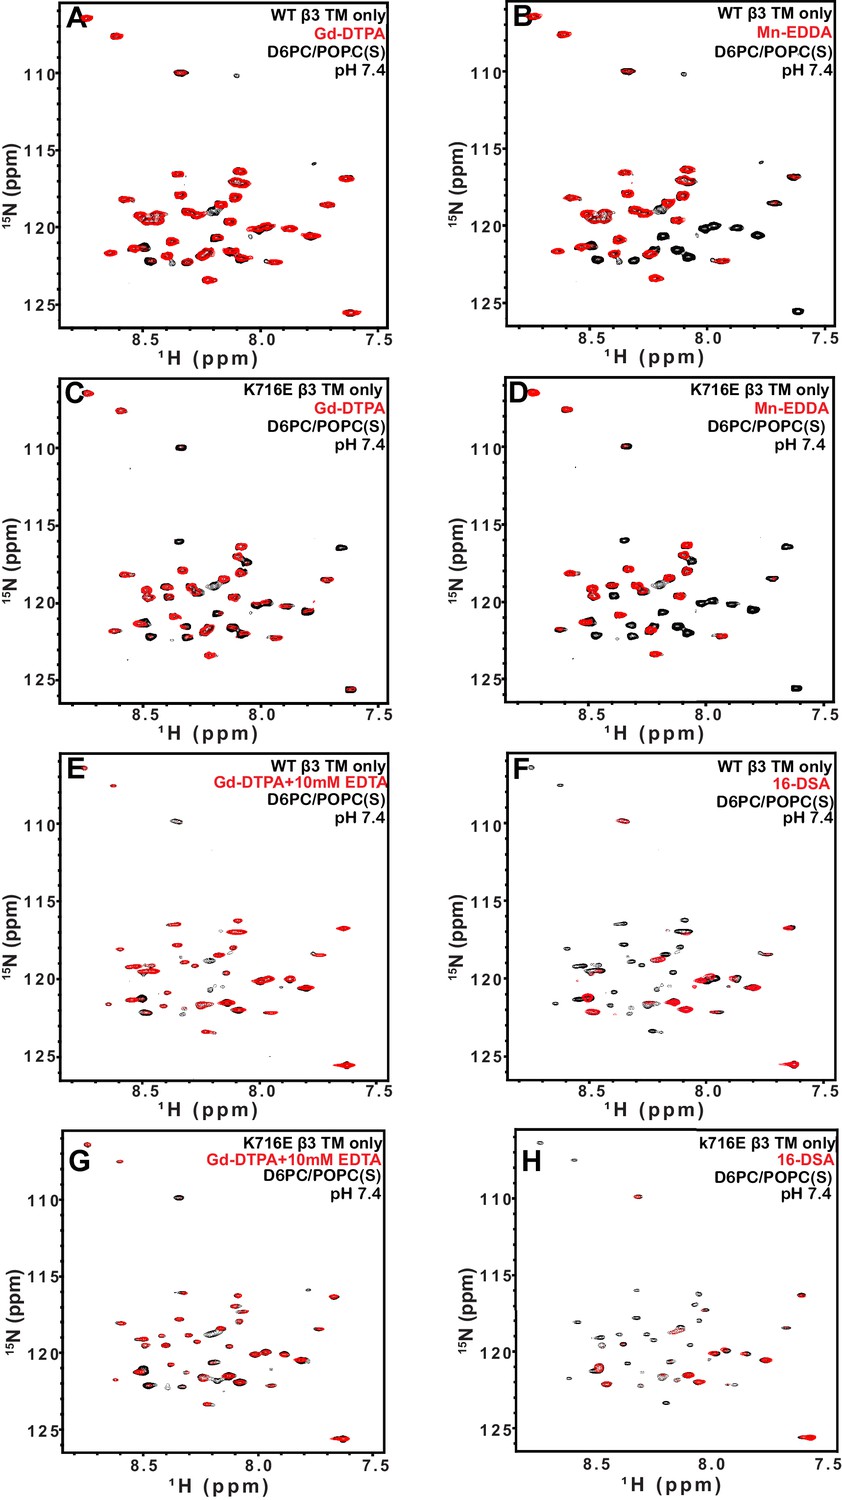
900 MHz 1H,15N-TROSY spectral overlays of WT integrin β3 TM in D6PC/POPC/POPS (2:1) bicelles with no paramagnetic probe (black) and with either 10 mM Gd-DTPA (red) (A), 1 mM Mn-EDDA (red) (B), both 10 mM Gd-DTPA and 10 mM EDTA (red) (E), or with 4 mol% 16-DSA (red) (F).
Panels C–D and G–H are the corresponding overlays for the integrin β3 K716E TM-only. The samples contained ~300 µM β3 TM, 20% q = 0.3 D6PC/POPC/POPS (2:1) bicelles, 1 mM EDTA 250 mM IMD at pH 7.4, with 10% D2O. All the spectra were collected at 900MHz at 35°C.
Figure 5 with 3 supplements
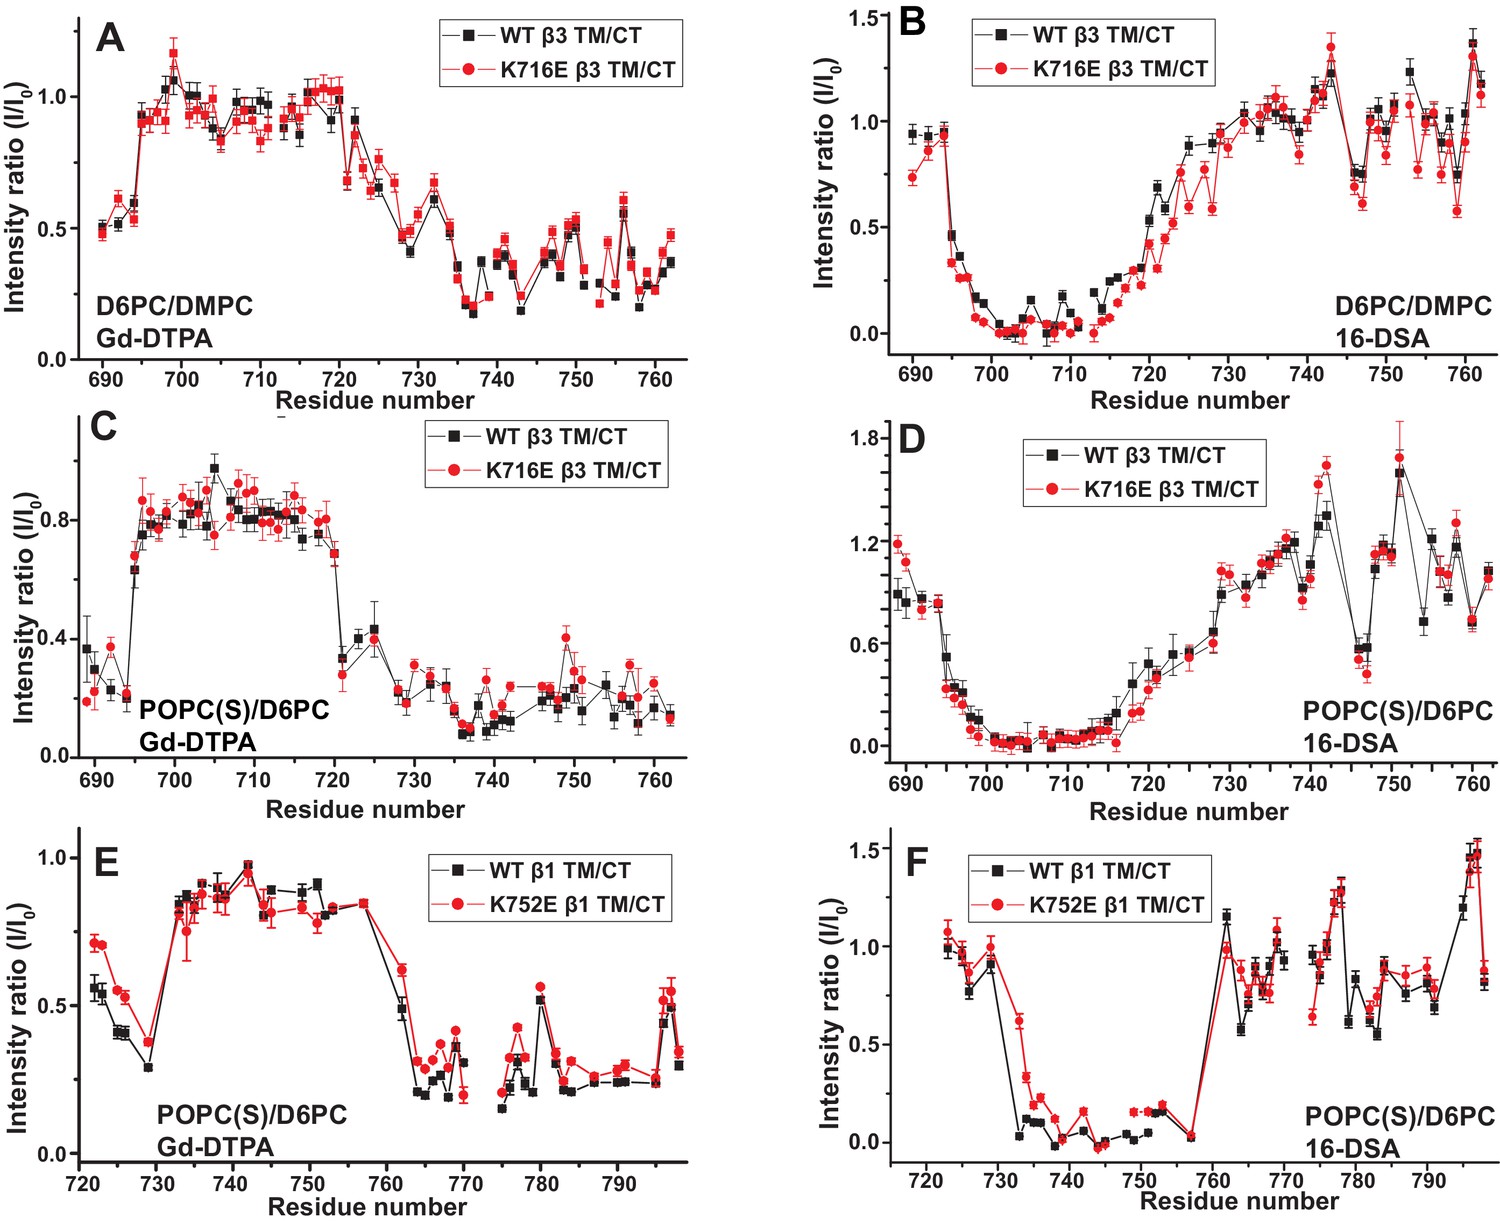
Examination of the bilayer topology of WT integrins in bicelles using NMR and paramagnetic probes.
Peak intensity changes are reported as induced by 10 mM Gd-DTPA (A) or 4% 16-DSA (B) in the 900MHz 1H-15N TROSY spectra of WT integrin β3 TM/CT and of the K716E mutant at 45°C in 20% q = 0.3 D6PC/DMPC bicelles, 1 mM EDTA, 250 mM IMD pH 6.5, with 10% D2O. (C) and (D) are the corresponding plots for integrin β3 TM/CT and for the K716E β3 TM/CT mutant in 20% q = 0.3 D6PC/POPC/POPS bicelles, 25 mM HEPES pH 7.4. In these cases 10 mM EDTA was also included to sequester any free Gd3+ and to cap any open metal ion ligand sites of the Gd-DTPA complex. (E) and (F) are the corresponding plots for WT integrin β1 TM/CT and for the K752E mutant form in 20% q = 0.3 D6PC/POPC/POPS bicelles, 1 mM EDTA, 25 mM HEPES pH 7.4, with 10% D2O. The intensity ratio (I/I0) reported for each TROSY amide resonance is the observed peak intensity in the presence of the paramagnetic probe divided by the intensity of the corresponding peak under probe-free diamagnetic conditions. At least two replicates of these experiments giving consistent results were performed. We show representative examples. The error is estimated from the noise level, or 5% of value, whichever is larger.
Figure 5—figure supplement 1
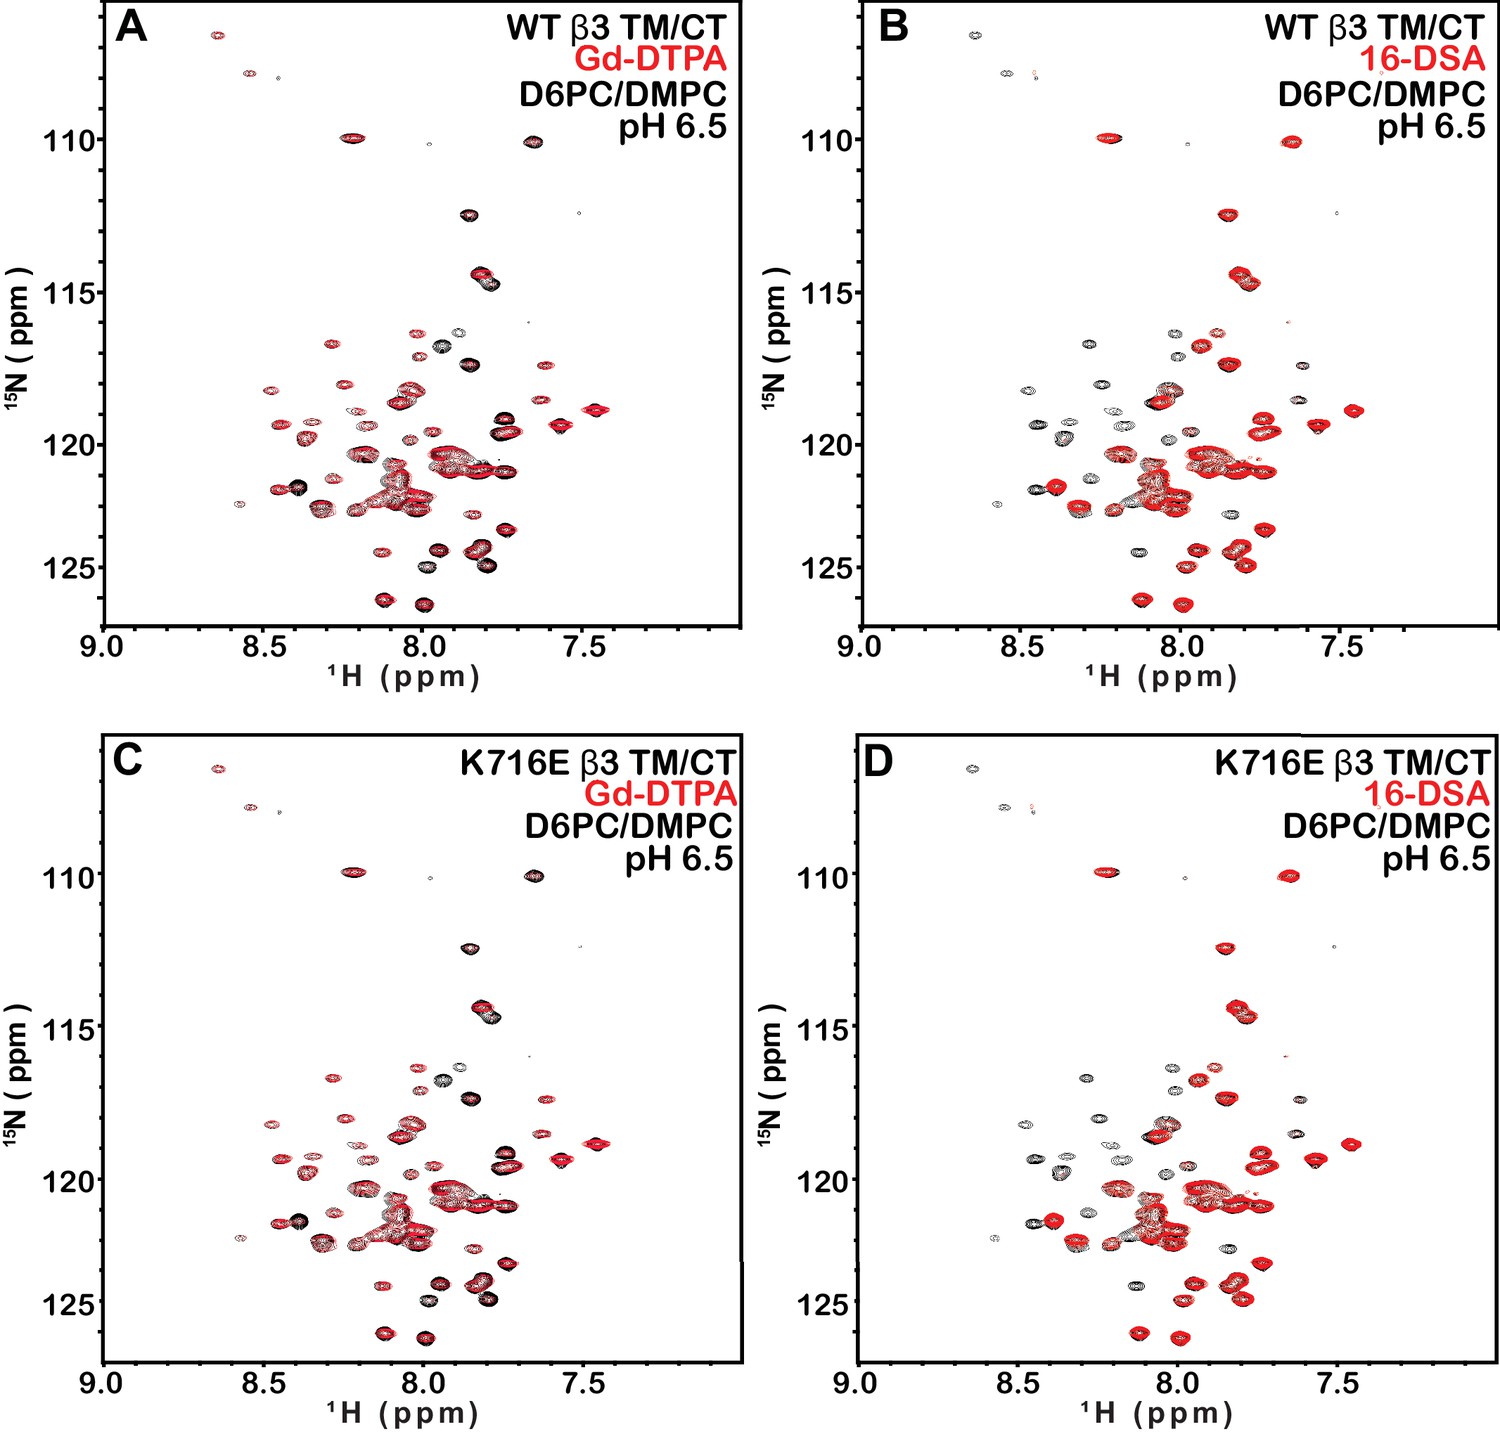
TROSY spectra of β3 TM/CT with and without paramagentic probes.
900MHz 1H,15N-TROSY spectral overlay of integrin β3 TM/CT in D6PC/DMPC bicelles with no paramagnetic probe (black) versus 10 mM Gd-DTPA plus 10 mM EDTA (red) (A). 900MHz 1H,15N-TROSY spectral overlay of integrin β3 TM/CT with no paramagnetic probe (black) versus conditions with 4 mol% 16-DSA (red) (B). (C) and (D) are the corresponding overlays for the integrin β3 K716E TM/CT. All the spectra were collected at 45°C and the NMR samples contained ~300 µM integrin β3 TM/CT, 20% q = 0.3 D6PC/DMPC bicelles, 1 mM EDTA, 25 mM HEPES pH 7.4, with 10% D2O.
Figure 5—figure supplement 2
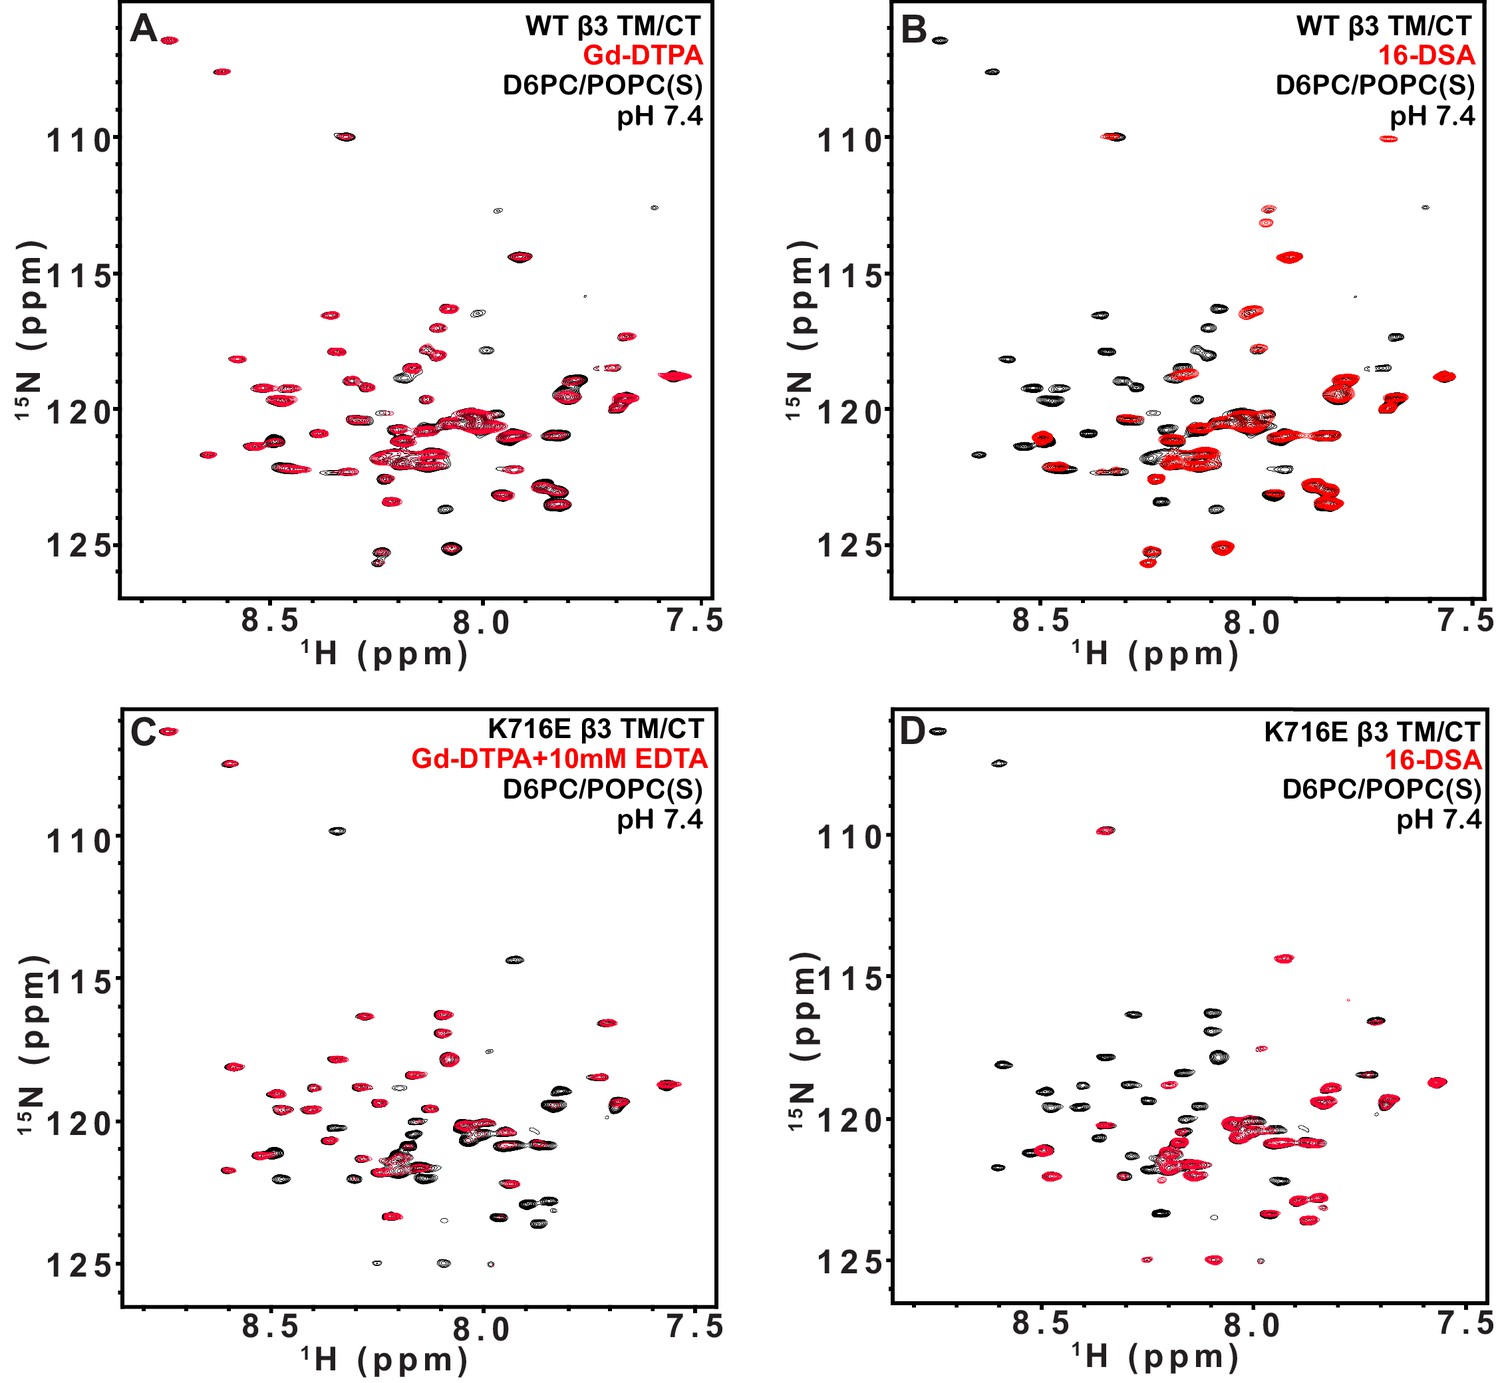
TROSY spectra of β3 TM/CT with and without paramagentic probes.
900MHz 1H,15N-TROSY spectral overlay of integrin β3 TM/CT in D6PC/POPC/POPS (2:1) bicelles with no paramagnetic probe (black) versus conditions with 10 mM Gd-DTPA plus 10 mM EDTA (red) (A). 900MHz 15N-TROSY spectral overlay of integrin β3 TM/CT with no paramagnetic probe (black) versus conditions with 4 mol% 16-DSA (B). (C) and (D) are the corresponding overlays for the integrin β3 K716 TM/CT. The NMR samples for panels A-D contained ~300 µM integrin β3 TM/CT, 20% q = 0.3 D6PC/POPC/POPS (2:1) bicelles, 25 mM HEPES pH 7.4, with 10% D2O. All the spectra were collected at 35°C.
Figure 5—figure supplement 3
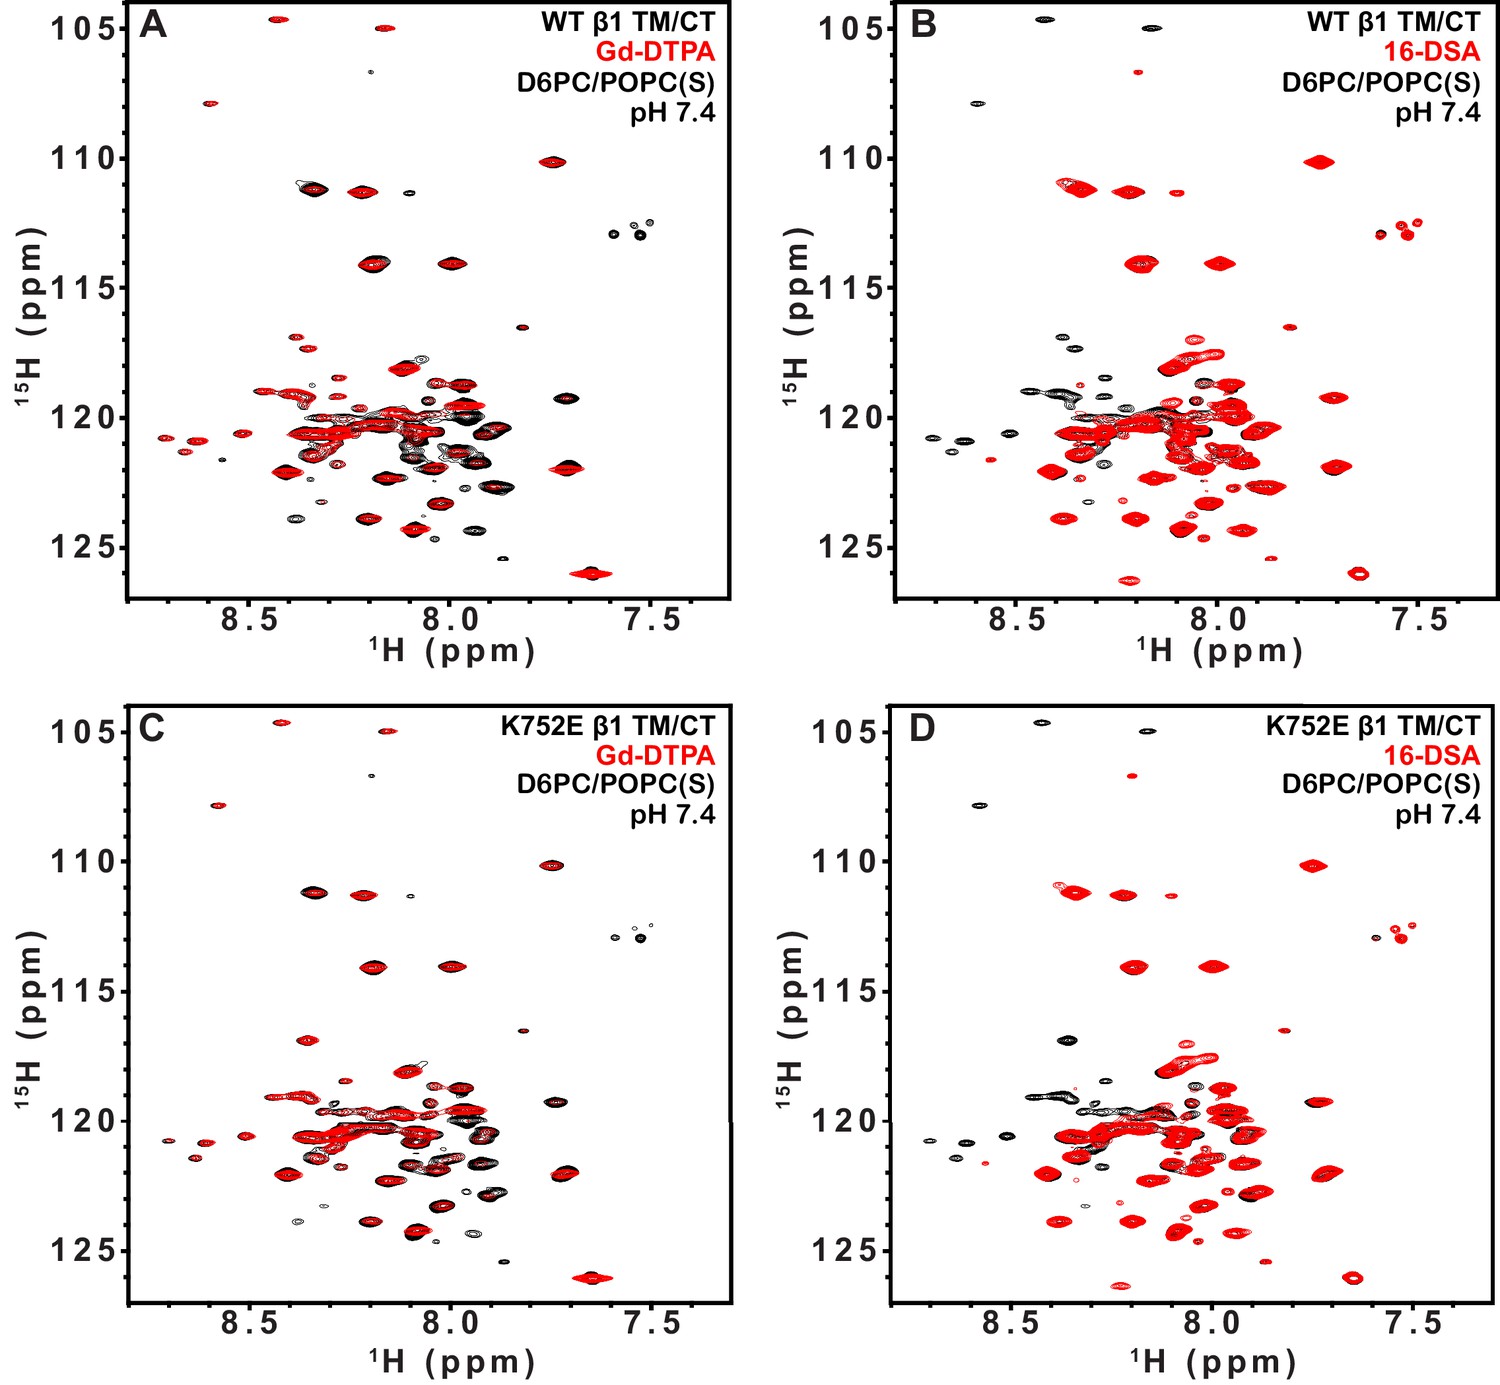
TROSY spectra of of β1 TM/CT with and without paramagentic probes.
900MHz 1H,15N-TROSY spectral overlay of integrin β1 TM/CT in D6PC/POPC/POPS (2:1) bicelle with no paramagnetic probe (black) versus conditions with10mM Gd-DTPA (red) (A). 900MHz 1H,15N-TROSY spectral overlay of integrin β1 TM/CT with no paramagnetic probe (black) versus conditions with 4% 16-DSA (B). (C) and (D) are the corresponding overlays for the integrin β1 K752E TM/CT. The NMR samples contained ~500 µM integrin β1 TM/CT in 20% q = 0.3 D6PC/POPC/POPS (POPC:POPS 2:1) bicelles, 1 mM EDTA, 25 mM HEPES pH 7.4, with 10% D2O. All the spectra were collected at 35°C.
Figure 6 with 2 supplements

Fits of at 1:1 binding model to the data from NMR-monitored titrations of wild type and mutant 15N-labeled integrin β TM/CT subunits by unlabeled wild type α TM/CT subunits, with the best fit Kd determined in each case as shown.
The residue assignments for the TROSY peaks used for these analyses are indicated. In some cases (panels E-H) the binding was so weak that it was only possible to determine a lower limit to the Kd. Measurements were carried out at 45°C in 20% (w/v) D6PC/POPC/POPS (POPC:POPS = 2:1), q = 0.3, 50 mM phosphate buffer with 1 mM EDTA in 10% D2O, pH 6.5.
Figure 6—figure supplement 1
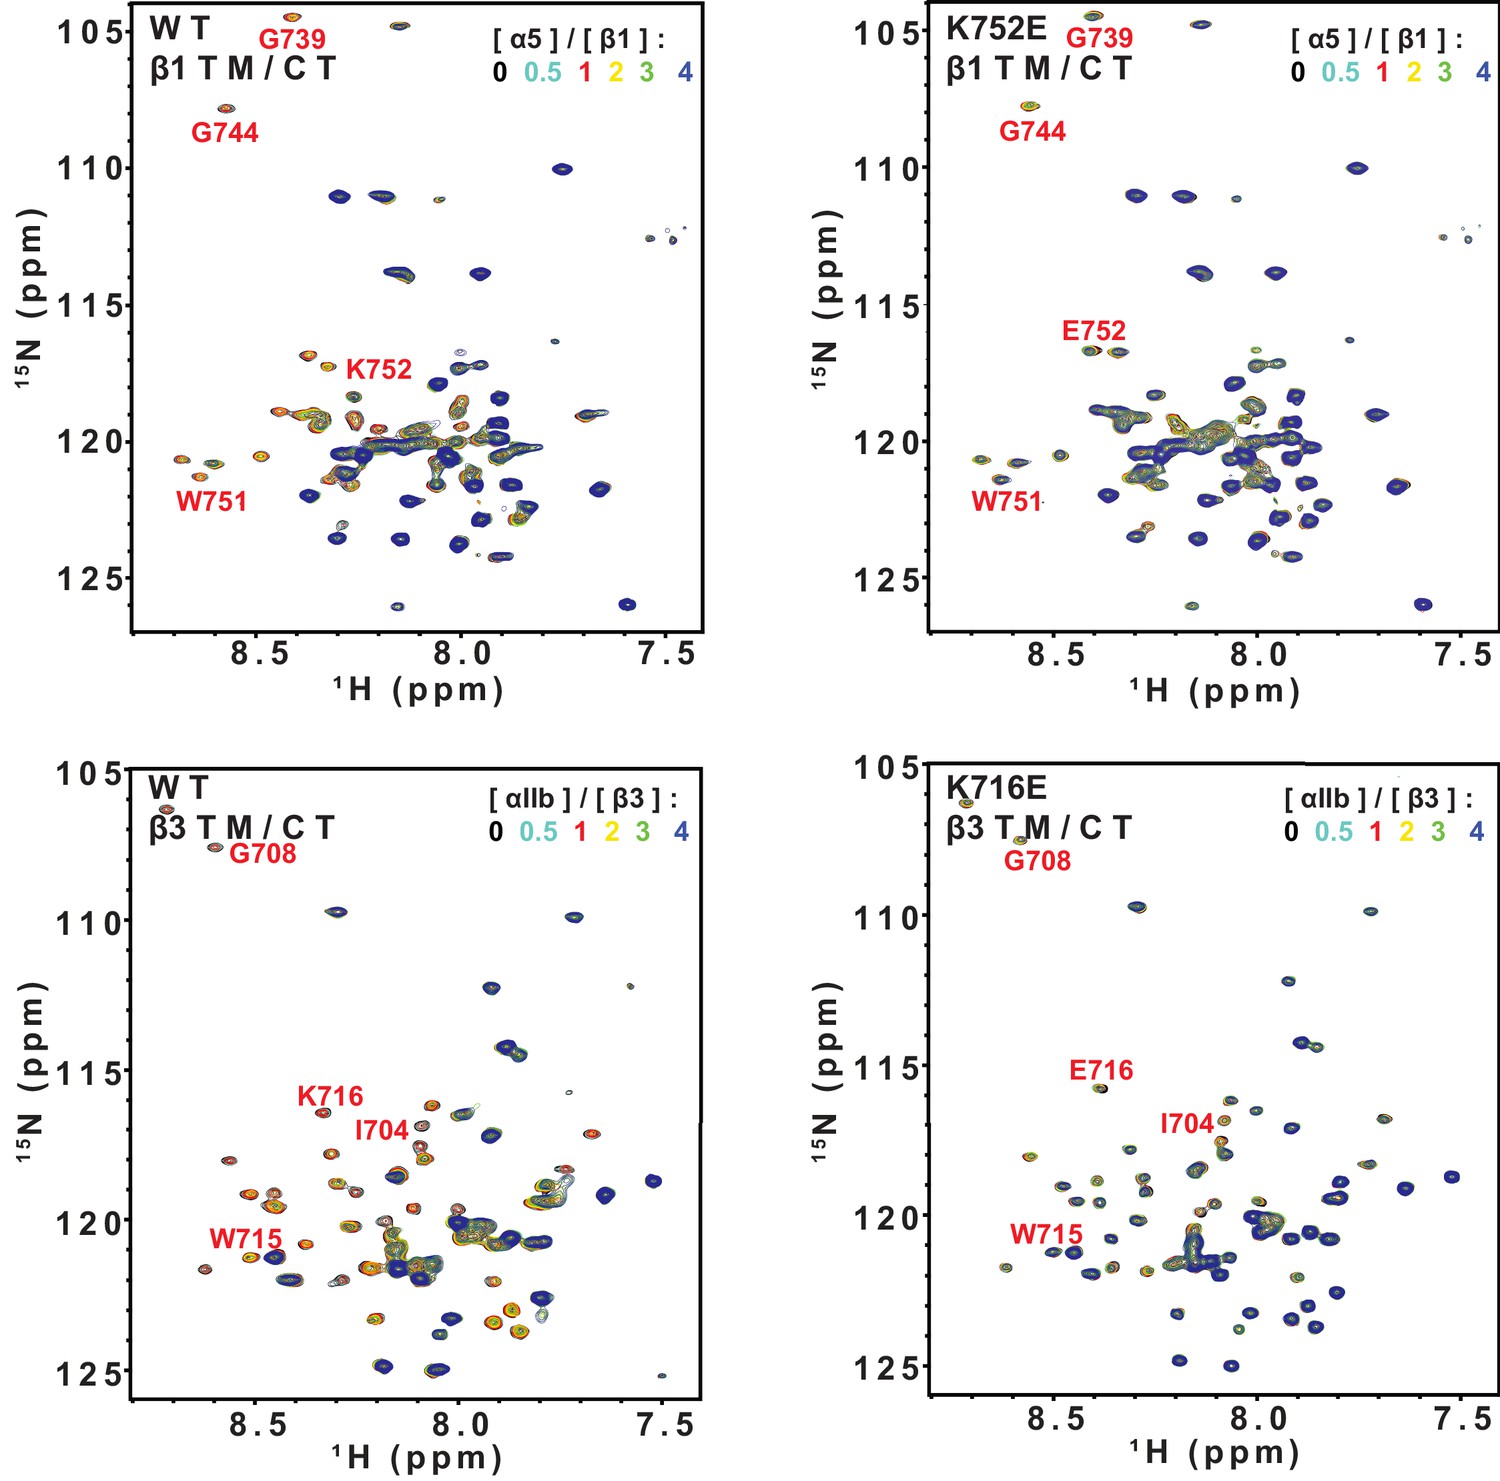
Superimposed 900 MHz 1H-15N-TROSY spectra from titrations of 15N-labeled integrin β TM/CTs with unlabeled α subunit TM/CTs: α5β1(WT), α5β1(K752E) αIIbβ3(WT), and αIIbβ3(K716E).
The concentrations of WT β3, WT β1 and the K752E β1 mutant were fixed at 0.17 mol% (150 µM) for all the samples, while the concentration for the K716E β3 mutant was fixed at 0.10% (90 µM). For these titrations, no peak shifts were observed, but some β1 1H-15N-TROSY peaks disappeared during the course of the titrations, indicating subunit association/dissociation exchange that is slow on the NMR time scale. These spectra were used as the basis for the binding analyses of Figure 6A–D.
Figure 6—figure supplement 2
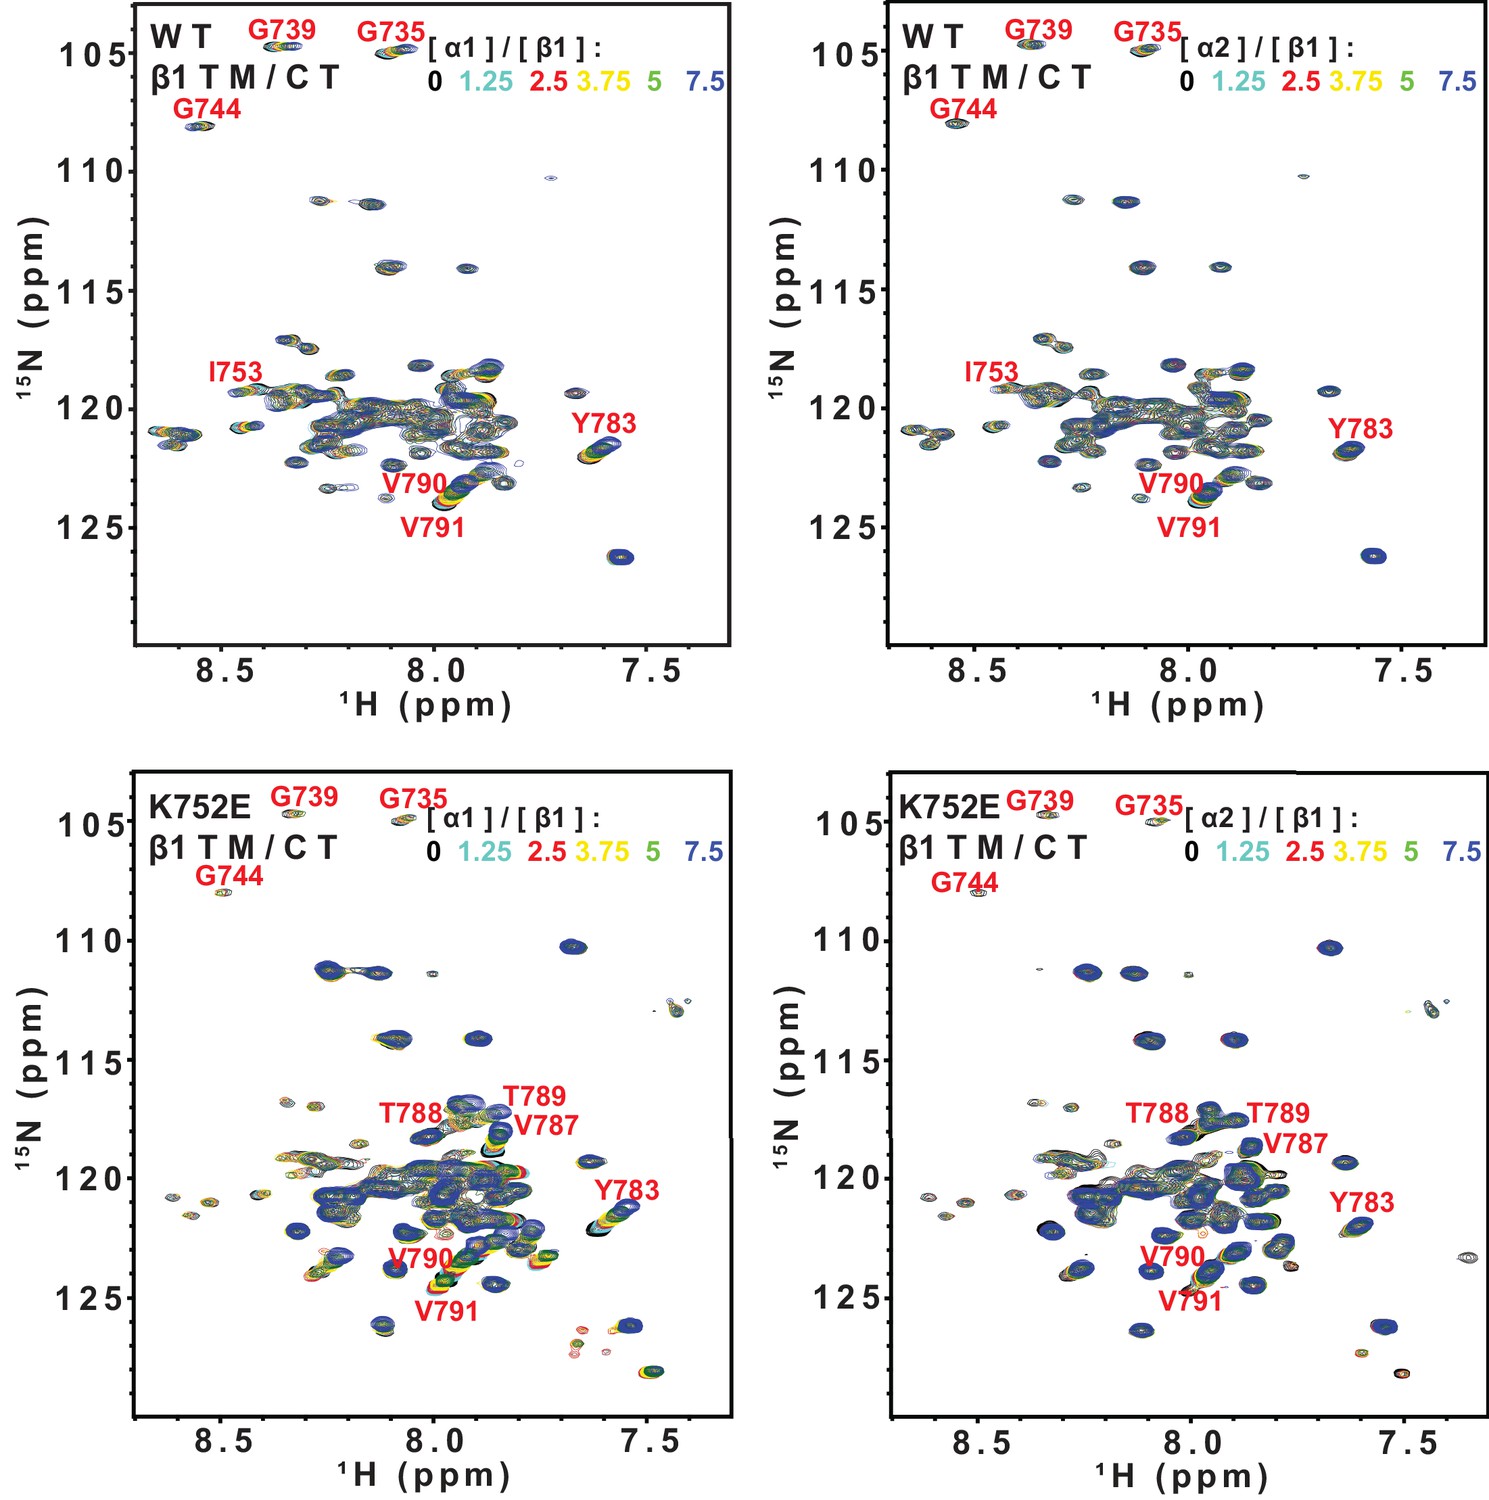
Superimposed 600 MHz 1H-15N-TROSY spectra from titrations of 15N-integrin β TM/CTs with unlabeled α subunit TM/CTs: α1β1(WT), α2β1(WT), α1β1(K752E), and α2K752Eβ1(K752E).
The concentrations of the WT and K752E mutant integrin β1 subunits were fixed at 0.23 mol% (200 µM) for all samples. For these titrations, peak shifts were in some cases observed, indicating subunit association/dissociation exchange that is rapid on the NMR time scale. These spectra were used as the basis for the binding analyses of Figure 6E–H.
Figure 7

Use of fluorescence anisotropy to determine Kd for complex formation between α and β integrin TM/CTs.
Measurements were carried out in D6PC/POPC/POPS bicelles (2% total amphiphile, q = 0.3) in 25 mM HEPES buffer pH 7.4 at 35°C. α subunits were labeled with IAEDAN and titrated by unlabeled β subunits. Dissociation constants were reported in mol% of total protein to total lipid present in the bicelles for: (A) αIIbβ3, (B) α5β1, (C) α1β1, (D) α2β1. At least three independent experiments were carried out. Shown is an example of each experiment where at least five measurements were made at each time point. The error bars depict the standard deviation of these five measurements.
Figure 8
The β1-K752E mutation decreases collecting duct cell adhesion to fibronectin.
(A) The adhesion of CD cells to fibronectin (0.5 μg/ml) for 1 hr was measured. These assays were carried out in the presence or absence of blocking antibodies directed against the αv or β1 subunits. The error bars indicate SD. * indicates a statistically significant difference (p<0.01) between WT and K752E CD cells. These assays were performed at least three times. (B) The spreading of wild type and K752E CD cells on fibronectin at 15, 30 and 45 min was measured on cells stained with rhodamine phalloidin. The area of at least 35 cells per time point were quantified using ImageJ software and expressed graphically. The error bars indicate SD. These assays were performed at least three times. (C–D) The active conformation of integrin β1 on adherent wild type (WT) and K752E expressing CD cells that were allowed to adhere to fibronectin for 1 hr was determined using 12 G10 antibody. Total integrin β1surface expression was determined using AIIB2 antibody (C). (D) The fluorescence intensity was measured as described in the Materials and methods. The error bars indicate SD and * indicates a statistically significant difference (p<0.01) between WT and K752E CD cells. These experiments were performed at least three times each. Intensity measurements were performed on over 40 different fields for each of the samples.
Figure 9

NMR-monitored titrations of integrin β1 TM/CT by the talin-F3 domain.
15N-labeled WT and K752E mutant integrin β1 TM/CT samples were titrated with unlabeled talin1-F3. The concentration of all integrins was 100 µM and the samples contained 5% q = 0.3 D6PC/POPC/POPS (POPC:POPS = 2:1) bicelles in 25 mM HEPES buffer at pH 7.4. The 1H,15N-TROSY NMR spectra were collected at 35°C at 900MHz (upper panels). In each case six titration points were collected in which the mole ratio between talin1-F3 and the integrin was varied: 0, 0.5, 1, 2, 3 and 4. The 1H,15N-TROSY spectra of 15N-labeled integrin from all the titration points were overlaid and plotted. The intensity changes for selected resonances, all thought to be at or in the vicinity of the Talin-F3 binding site, were plotted (bottom panels) versus concentration and the Kd was obtained by a single global fit of all the data. left: integrin β1 TM/CT WT, right: integrin β1 K752E TM/CT.
Figure 10
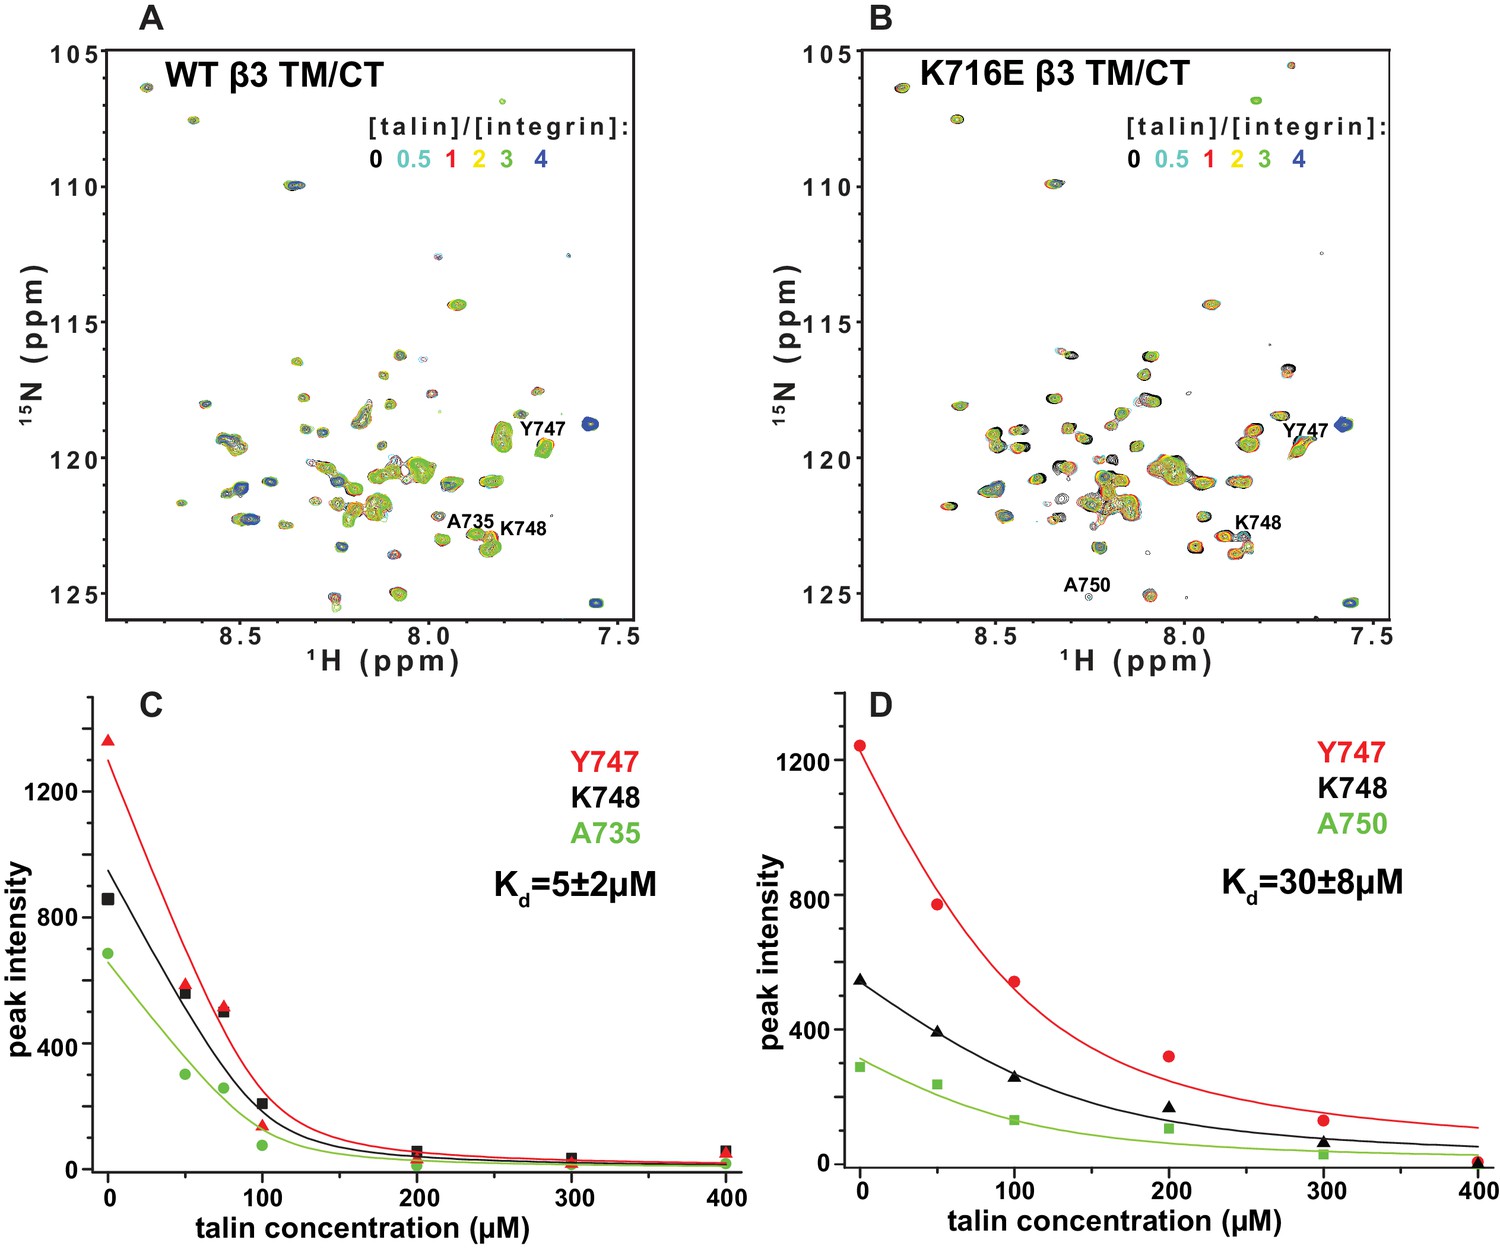
NMR-monitored titrations of integrin β3 TM/CT by talin.
15N-labeled WT/K716E integrin β3 TM/CT was titrated with unlabeled talin1-F3. The concentration of all integrins was 100 µM. The samples contained 5% q = 0.3 D6PC/POPC/POPS (POPC:POPS = 2:1) bicelles in 25 mM HEPES buffer at pH 7.4. The TROSY NMR spectra were collected at 35°C at 900MHz (upper panels). In both cases six titration points were collected in which the molar ratio between talin1-F3 and the integrin was varied: 0, 0.5, 1, 2, 3 and 4. The 1H,15N-TROSY spectra of 15N-labeled integrin from all the titration points were overlaid and plotted. The intensity changes for selected residues, all thought to be at or in the vicinity of the Talin-F3 binding site, were plotted (bottom panels) against concentration and the Kd was obtained by a global fit of all the data. Left: integrin β3 TM/CT WT. Right: integrin β3 K716E TM/CT.
Tables
Table 1
Dissociation constant (Kd) of integrin β1 and β3 subunits (WT and K752E mutant) with α subunits in D6PC/POPC/POPS (POPC:POPS=2:1) q=0.3 bicelles.
Titration | Kd (mol%) | Monitored subunit | Method |
|---|---|---|---|
α5β1 | 0.17±0.1 | 15N-β1 | NMR |
α5β1 | 0.07±0.02 | α5 | Anisotropy |
α5β1KE | 0.63±0.1 | 15N-β1-KE | NMR |
α5β1KE | 0.80±0.27 | α5 | Anisotropy |
αIIbβ3 | 0.15±0.1 | 15N-β3 | NMR |
αIIbβ3 | 0.09±0.03 | αIIb | Anisotropy |
αIIbβ3KE | 0.51±0.1 | 15N-β3-KE | NMR |
αIIbβ3KE | 0.33±0.05 | αIIb | Anisotropy |
α1β1 | >2.48 | 15N-β1 | NMR |
α1β1 | >3.2 | α1 | Anisotropy |
α1β1KE | >2.48 | 15N-β1-KE | NMR |
α1β1KE | >3.2 | α1 | Anisotropy |
α2β1 | >2.48 | 15N-β1 | NMR |
α2β1 | >3.2 | α2 | Anisotropy |
α2β1KE | >2.48 | 15N-β1-KE | NMR |
α2β1KE | >3.2 | α2 | Anisotropy |
Download links
A two-part list of links to download the article, or parts of the article, in various formats.
Downloads (link to download the article as PDF)
Open citations (links to open the citations from this article in various online reference manager services)
Cite this article (links to download the citations from this article in formats compatible with various reference manager tools)
Implications of the differing roles of the β1 and β3 transmembrane and cytoplasmic domains for integrin function
eLife 5:e18633.
https://doi.org/10.7554/eLife.18633


