Cell-wall remodeling drives engulfment during Bacillus subtilis sporulation
- Imperial College London, United Kingdom
- University of California, San Diego, United States
Figures
Figure 1 with 3 supplements
Peptidoglycan (PG) synthesis is essential for leading-edge (LE) migration.
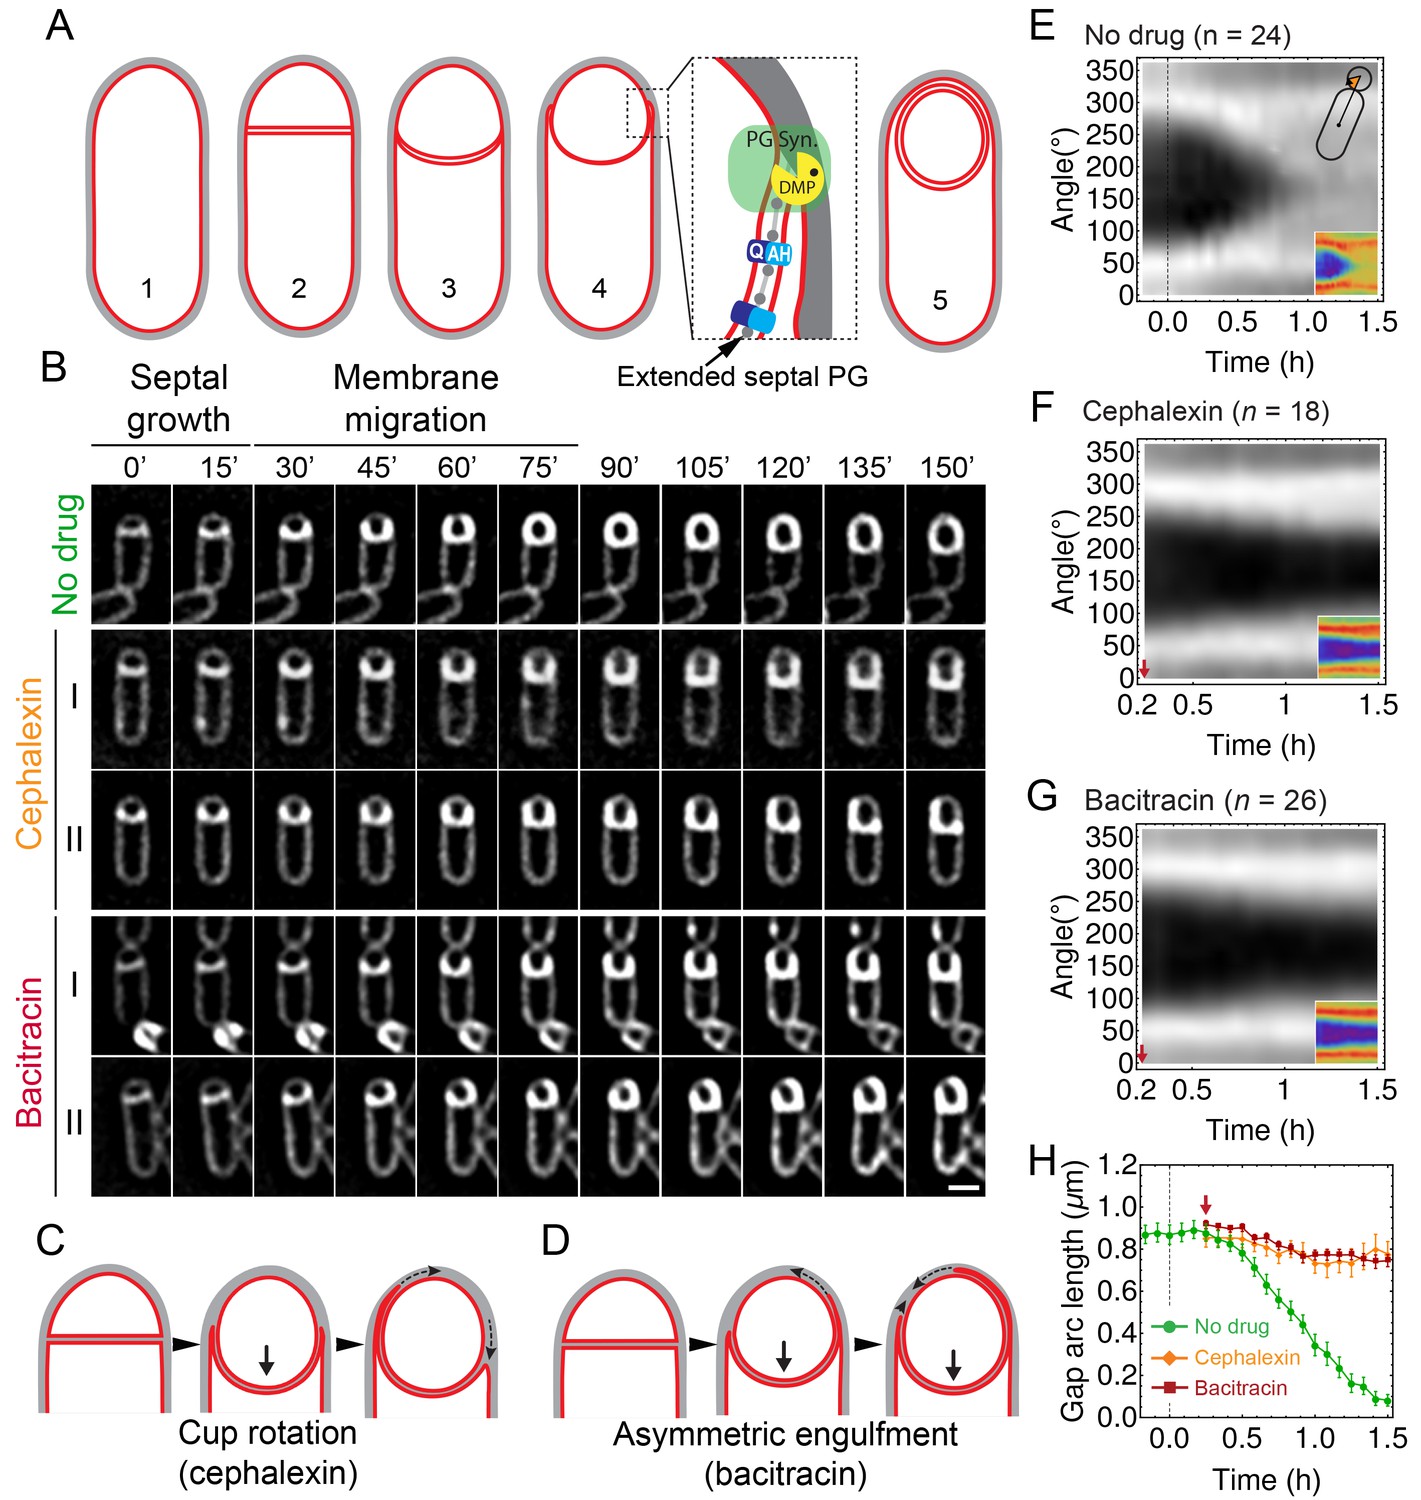
(A) Morphological changes during spore formation. Peptidoglycan shown in grey, membrane in red. (1) Vegetative cell. (2) The first morphological step in sporulation is asymmetric cell division, producing a smaller forespore and a larger mother cell. (3) The septum curves and protrudes towards the mother cell. (4) The mother cell membrane migrates towards the forespore pole. The different modules contributing to membrane migration are shown in the inset (see Introduction for details). During engulfment, the septal PG is extended around the forespore (Tocheva et al., 2013). (5) Fully engulfed forespore surrounded by two membranes sandwiching a thin layer of PG. (B) Snapshots of engulfing sporangia from time-lapse movies in the absence of antibiotics, or in the presence of cephalexin or bacitracin. Cells were stained with fluorescent membrane dye FM 4–64 and imaged in medial focal plane. In the absence of antibiotics (top) the septum curves and grows towards the mother cell without significant forward movement of the engulfing membrane for ∼20 min. After that, the LE of the engulfing membrane starts migrating and reaches the forespore pole in ∼1 hr. When PG precursor delivery system is blocked with bacitracin (50 μg/ml): (I) LE migration is stopped or (II) engulfment proceeds asymmetrically. Similar results are obtained when cells are treated with cephalexin (50 μg/ml). However, in this case the asymmetric engulfment phenotype observed at later time points is due to rotation of the engulfment cup (C) rather than to asymmetric movement forward of the engulfing membrane (D). (E) FM 4–64 average kymograph of = 24 engulfing cells (see Materials and methods, Appendix 1). Average fluorescent intensity along forespore contour vs time in the mother-forespore reference frame as shown in top inset. All cells are aligned in time based on time 0’ (0 min). Time 0’ is assigned to the onset of curving septum (Figure 1—figure supplement 3). Bottom inset is average kymograph represented as heat map. (F–G) Average kymograph for cells treated with cephalexin ( = 18) (F) or bacitracin ( = 26). (G) When drug was added analyzed cells had (55 ± 5)% engulfment (red arrow). The percentage of engulfment is calculated as total angle of forespore covered with mother membrane divided by full angle. All cells had fully curved septum. Non-engulfed part of the forespore is represented as the black regions in kymographs. (H) In untreated sporangia, gap starts to close ∼20 min after onset of membrane curving. In antibiotic-treated cells gap does not close. Sample size as in (F–G). Red arrow points when drug is added. Average ± SEM. Scale bar 1 μm.
Figure 1—figure supplement 1
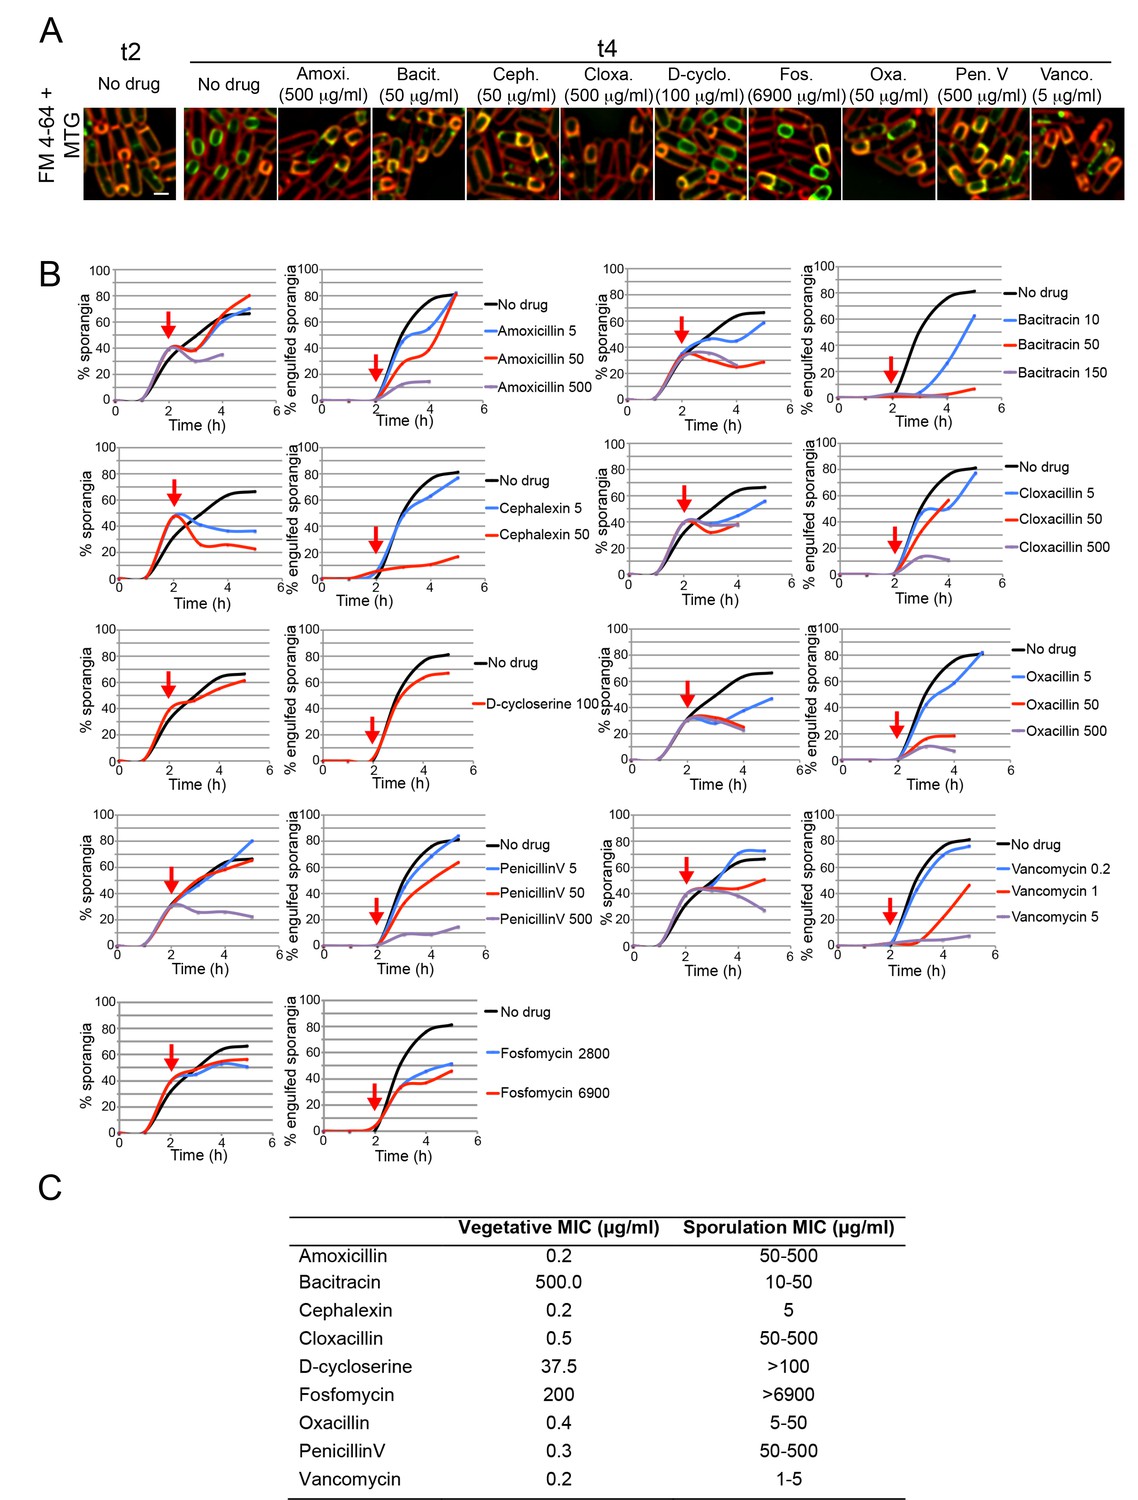
Sporulation minimal inhibitory concentration.
(A) Microscopy pictures of cells sporulating before antibiotic treatment (t2), or 2 hr later (t4) after treatment with antibiotics blocking different steps on the PG biosynthetic pathway: synthesis of cytoplasmic PG intermediates (D-cycloserine), recycling of undecaprenyl-P (bacitracin), cross-linking of the glycan strands (vancomycin), or PBP activity (amoxicillin, cephalexin, cloxacillin, oxacillin and penicillin V). Cells were stained with Mitotracker Green (green, membrane permeable) and FM 4–64 (red, membrane impermeable) to visualize membranes. When engulfment is completed, the forespore membranes are only stained by Mitotracker green, but not by FM 4–64 (Sharp and Pogliano, 1999). (B) Graphs showing the percentage of cells that have undergone polar septation (% sporangia) and the percentage of sporangia that have completed engulfment (% engulfed sporangia) at different time points after sporulation induction, in cultures treated with different antibiotics that block PG synthesis. Antibiotics were added 2 hr after sporulation induction (red arrows). Samples were taken every hour for 5 hr, stained with MTG and FM 4–64 and visualized under the microscope. More than 300 cells were quantified per time point and antibiotic concentration. (C) Table showing the Minimal Inhibitory Concentration (MIC) of antibiotics blocking PG synthesis during vegetative growth (Vegetative MIC), and the estimated MIC during sporulation (Sporulation MIC). The Sporulation MIC was defined as the concentration or concentration interval that block the formation of new polar septa, and was inferred from the graphs in B. Scale bar 1 μm.
Figure 1—figure supplement 2
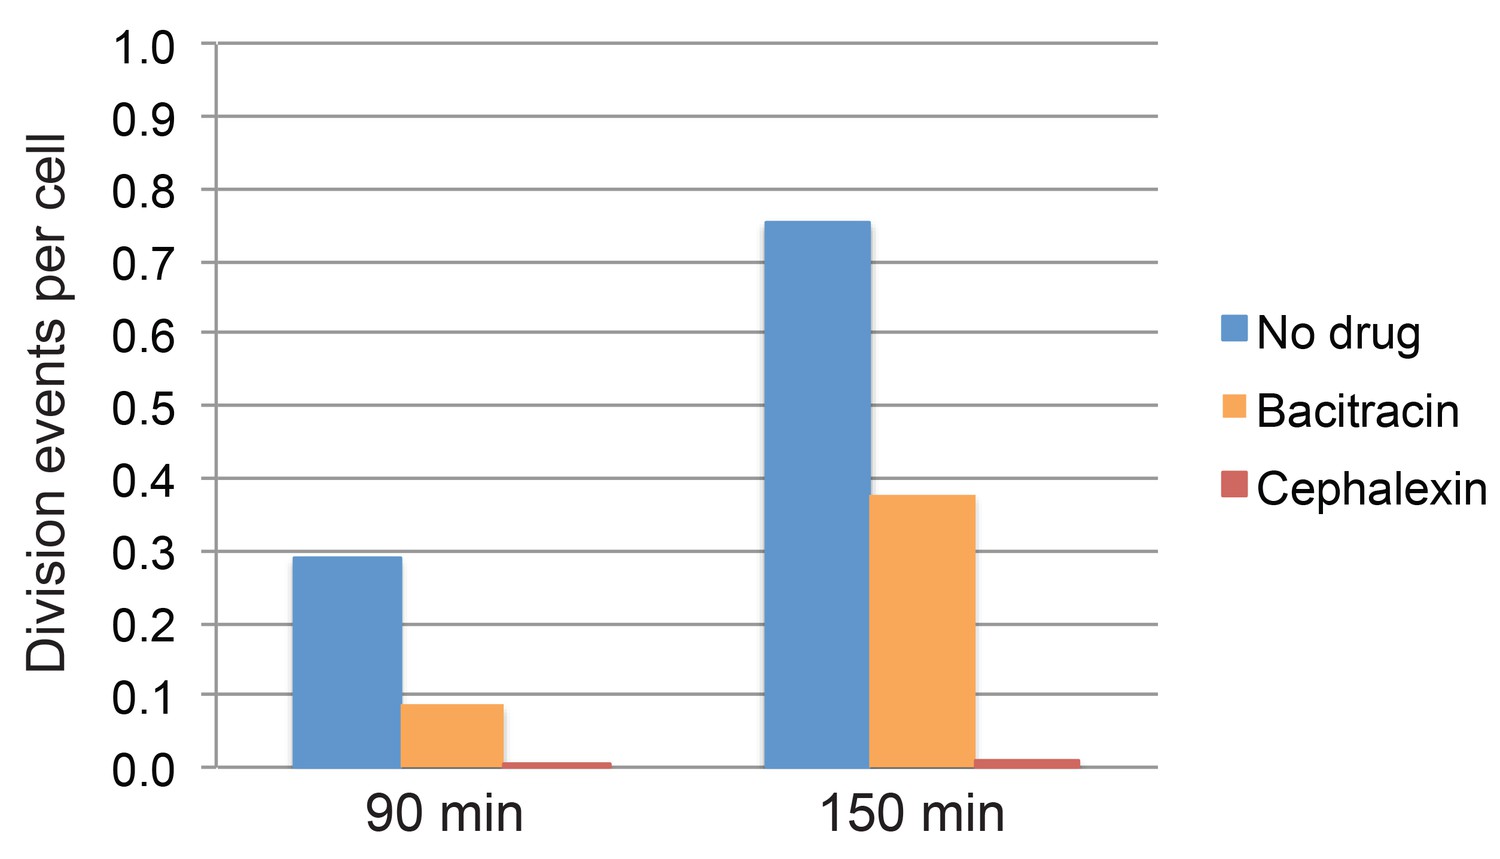
Quantification of cell division events in timelapse movies.
Fraction of cell division events per cell observed during the first 90 min and 150 min of imaging in timelapse movies of sporulating cultures treated with bacitracin (50 μg/ml), cephalexin (50 μg/ml), or untreated. At least 296 vegetative cells were tracked over time for every condition. The total number of division events observed after 90 min or 150 min was divided by the number of cells tracked in each case.
Figure 1—figure supplement 3
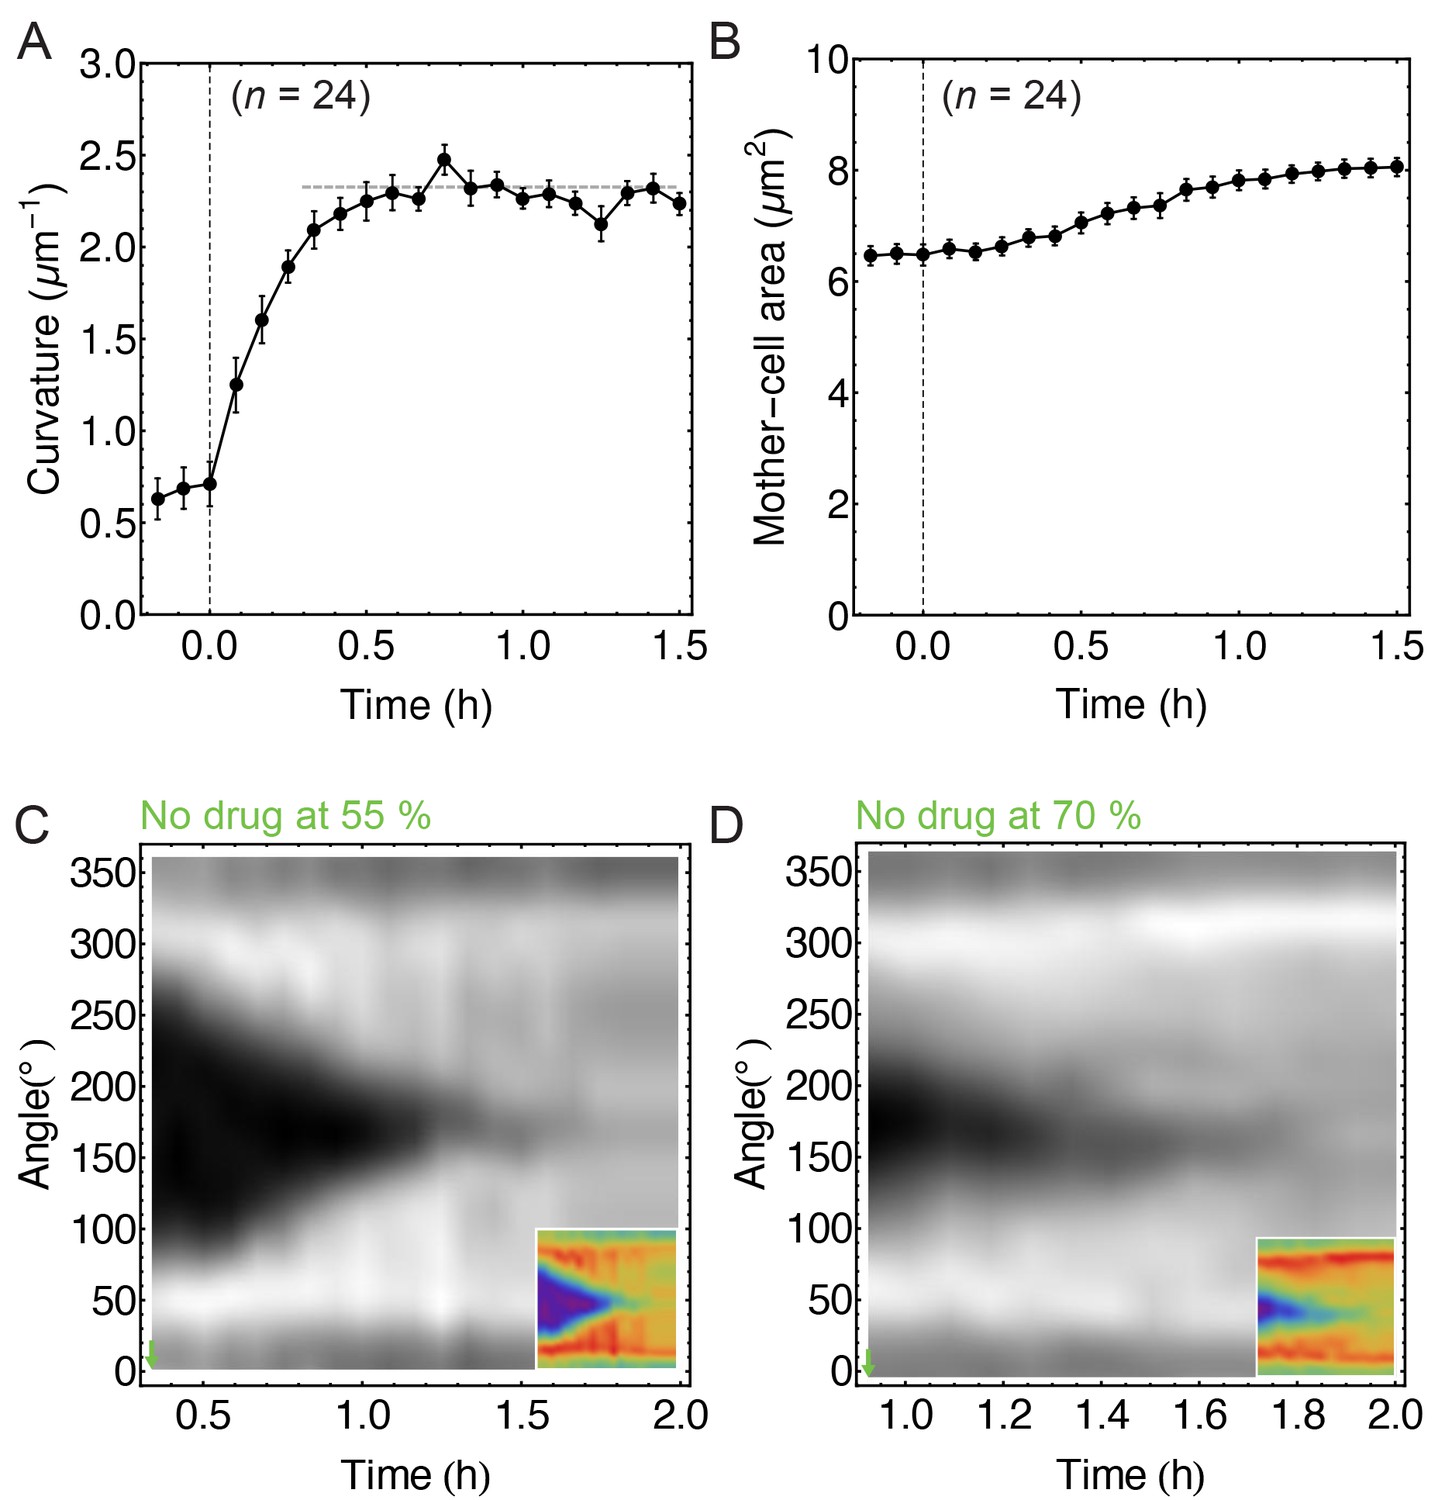
Image analysis of non-treated cells.
(A) Time course of septum curvature. The horizontal dashed grey line corresponds to inverse cell-wall radius (FM 4–64) measured at the cell middle (, 14). (B) Time course of mother-cell area. (C–D) FM 4–64 kymographs of partially engulfed forespores ( = 6 with (55 ± 5)% of engulfment;= 7 with (70 ± 5)% of engulfment, respectively). This is a control analysis of non-treated cells for the experiment when partially engulfed cells treated with drugs stop engulfment (see Figure 1F–G). Average ± SEM.
Figure 2 with 3 supplements
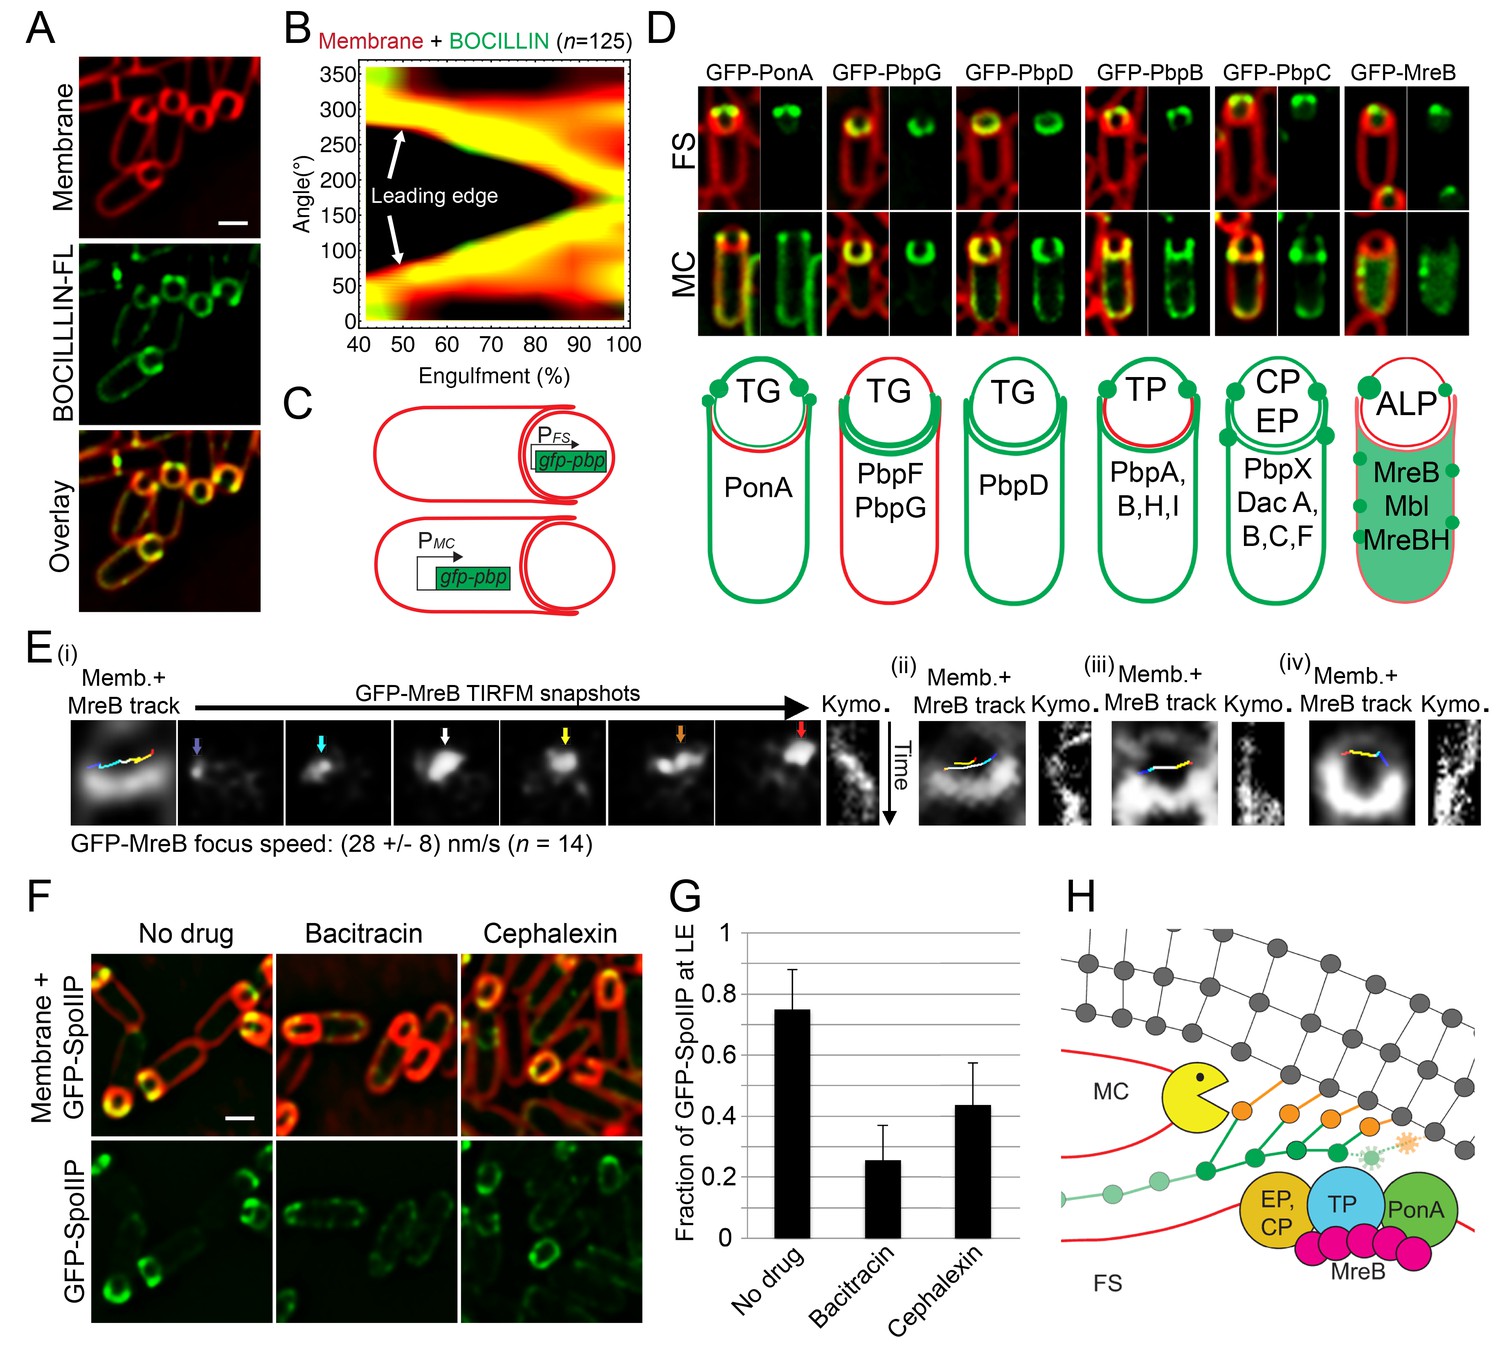
PG synthesis at the LE of the engulfing membrane by forespore PBPs contribute to proper localization of the DMP complex.
(A) Sporulating cells stained with a green fluorescent derivative of penicillin V (BOCILLIN-FL). Bright foci are observed at the LE of the engulfing membrane. Membranes were stained with FM 4–64 (red). (B) Average BOCILLIN-FL (green) and FM 4–64 (red) fluorescence intensities along forespore contours plotted as a function of the degree of engulfment. Cells are binned according to percentage of engulfment. BOCILLIN-FL signal is enriched at the LE throughout engulfment ( = 125). (C) Cell-specific localization of the peptidoglycan biosynthetic machinery. GFP tagged versions of different B. subtilis PBPs and actin-like proteins (ALPs) were produced from mother cell- (MC) or forespore- (FS) specific promoters. (D) Six different localization patterns were observed upon cell-specific localization of PBPs and ALPs. For each pair of images, left panel shows overlay of membrane and GFP fluorescence, while the right panel only shows GFP fluorescence. Pictures of representative cells displaying the different patterns are shown (top, GFP fusion proteins transcribed from spoIIR promoter for forespore-specific expression, and from spoIID promoter for mother cell-specific expression). The six different patterns are depicted in the bottom cartoon and proteins assigned to each one are indicated. Membranes were stained with FM 4–64. See Figure 2—figure supplement 1 for cropped fields of all PBPs we assayed. Transglycosylase (TG), transpetidase (TP), carboxipetidase (CP), endopeptidase (EP), actin-like protein (ALP). (E) TIRF microscopy of forespore-produced GFP-MreB in four different forespores (i to iv). In every case, the leftmost picture is an overlay of the forespore membranes (shown in white) and the tracks followed by individual TIRF images of GFP-MreB (color encodes time, from blue to red). Sporangia are oriented with the forespores up. For the first sporangia (i), snapshots from TIRF timelapse experiments taken 8 s apart are shown. Arrows indicate GFP-MreB foci and are color coded to match the trace shown in the left panel. Rightmost panel for each forespore shows a kymograph representing the fluorescence intensity along the line joining the leading edges of the engulfing membrane over time (from top to bottom; total time 100 s). Average focus speed (n = 14) is indicated at the bottom. Timelapse movies of the examples presented here and additional sporangia are shown in Video 2. (F) Localizaiton of GFP-SpoIIP in untreated sporangia, or in sporangia treated with bacitracin (50 μg/ml) or cephalexin (50 μg/ml). (G) Fraction of GFP-SpoIIP fluorescence at LE of the engulfing membrane. Bars represent the average and standard error of 85 untreated sporangia, 38 sporangia treated with bacitracin (50 μg/ml), and 67 sporangia treated with cephalexin (50 μg/ml). (H) Model for PG synthesis and degradation at the LE of the engulfing membrane. New PG is synthesized ahead of the LE of the engulfing membrane by forespore-associated PG biosynthetic machinery, and is subsequently degraded but the mother-cell DMP complex. We propose that DMP has specificity for the peptide cross-links that join the newly synthesized PG with the lateral cell wall (orange), which leads to the extension of the septal PG around the forespore. Scale bars 1 μm.
Figure 2—figure supplement 1
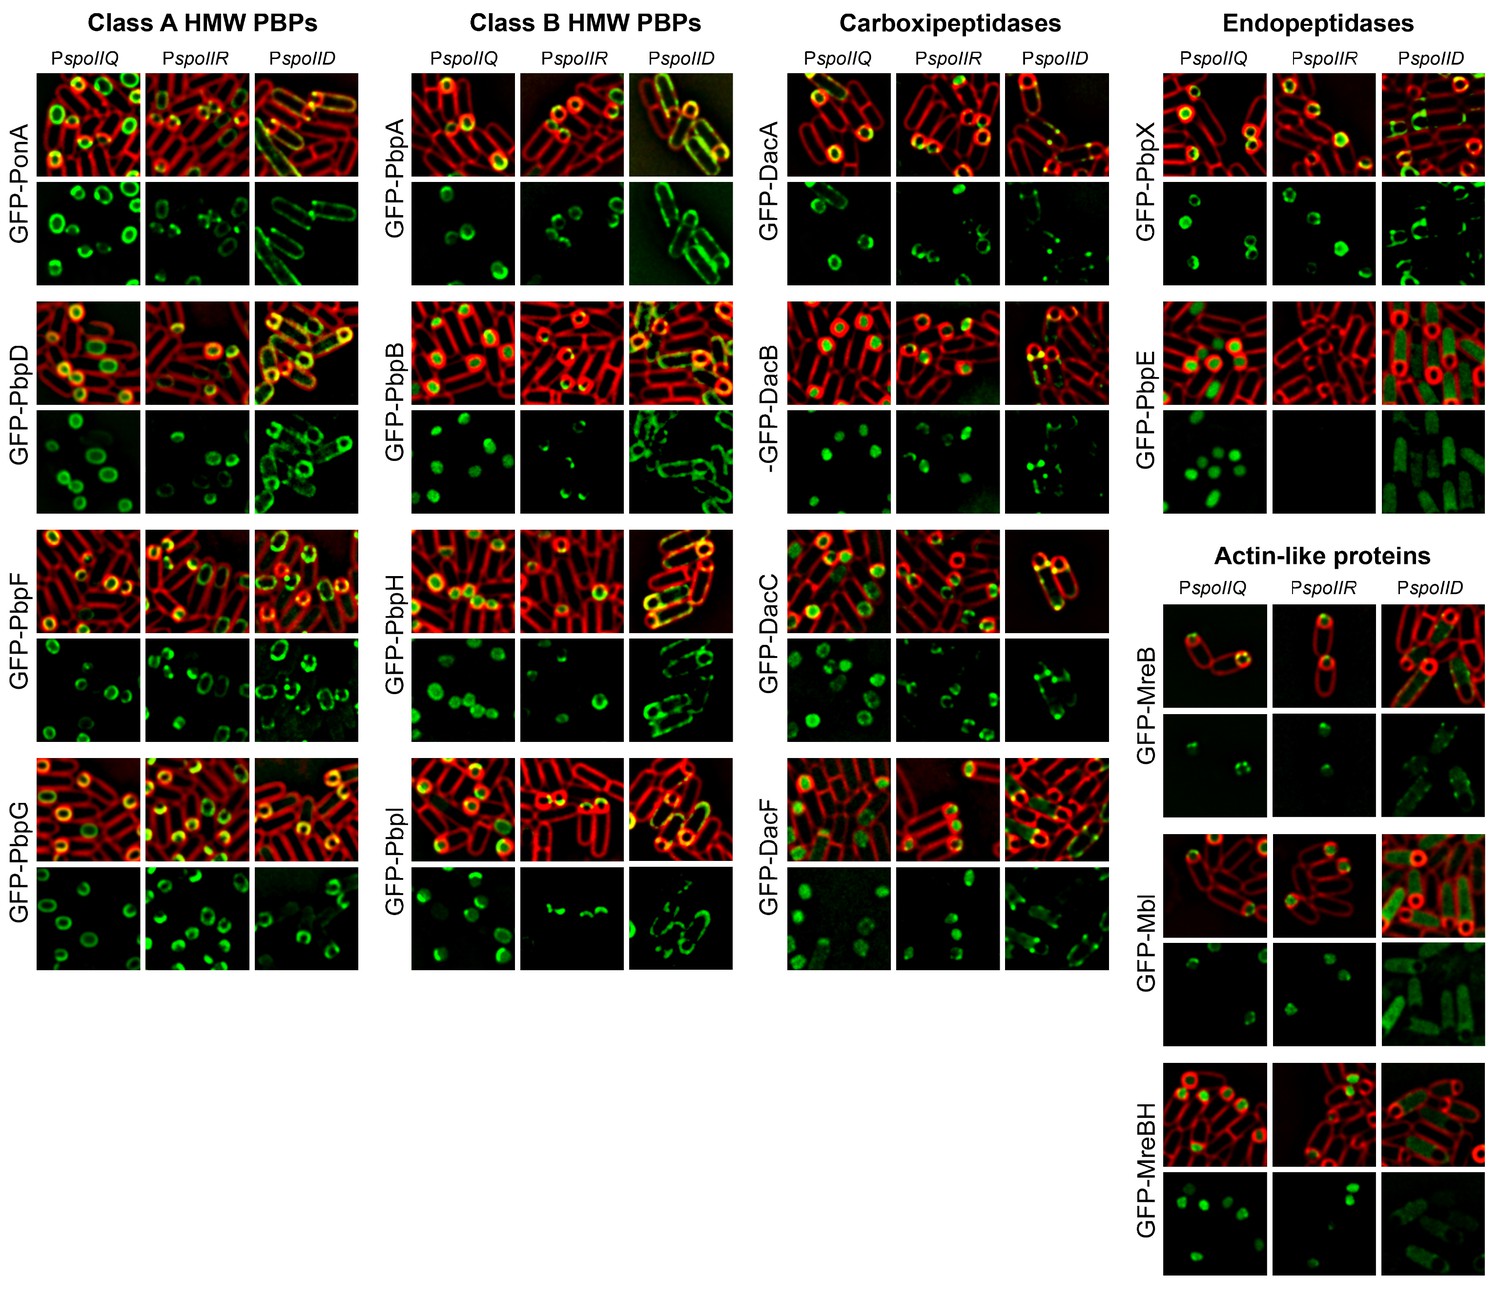
Cell-specific localization of PBPs and actin-like proteins.
GFP was fused to the N-terminus of PBPs and actin-like proteins. The fusion proteins where produced in the forespore or in the mother cell after polar septation by placing the fusion genes under the control of either the forespore specific promoters (PspoIIQ or PspoIIR, for stronger or weaker expression, respectively) or the mother-cell specific promoter PspoIID. With the exception of GFP-PbpE, all the fusions localize to the membrane. GFP-MreB and GFP-Mbl associate to the membrane when produced in the forespore, while GFP-MreBH only shows a week membrane association. When produced in the mother cell, GFP-Mbl and GFP-MreBH remain mostly cytoplasmic, and GFP-MreBH forms some foci distributed around the membrane. Membranes were stained with FM 4–64. The different localization patterns are summarized in Figure 2D.
Figure 2—figure supplement 2
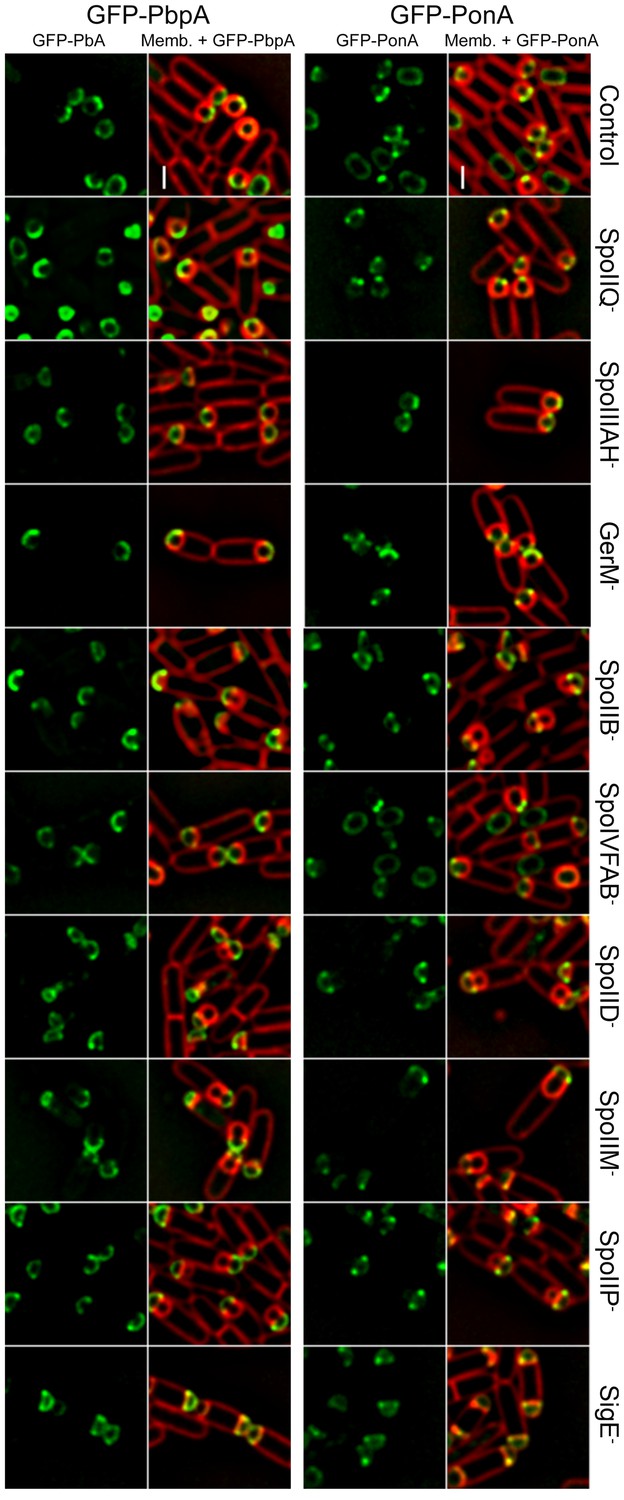
Localization of forespore GFP-PonA and GFP-PbpA in different mutant backgrounds.
GFP-PonA and GFP-PbpA were produced specifically in the forespore after polar septation by placing the fusion genes under the control of PspoIIR. The localization of both proteins was determined in wild-type background and in different mutants lacking specific sporulation proteins. GFP-PonA and GFP-PbpA still track the leading edge of the engulfing membrane or localize to the interception between the septal peptidoglycan and the lateral cell wall in all the mutant backgrounds tested. Membranes were stained with FM 4–64. Scale bar, 1 μm.
Figure 2—figure supplement 3

SpoIIDMP localization upon treatment with different antibiotics blocking PG synthesis.
(A) Localizaiton of GFP-SpoIIP in untreated sporangia, or in sporangia treated with bacitracin (50 μg/ml), amoxicillin (500 μg/ml), cephalexin (50 μg/ml), cloxacillin (500 μg/ml), oxacillin (50 μg/ml), or penicillin V (500 μg/ml). Membranes were stained with FM 4–64. (B) Fraction of GFP-SpoIIP fluorescence at LE of the engulfing membrane. Bars represent the average and standard error of 85 untreated sporangia, 38 sporangia treated with bacitracin (50 μg/ml), 37 treated with amoxicillin (500 μg/ml), 67 treated with cephalexin (50 μg/ml), 43 treated with cloxacillin (500 μg/ml), 36 treated with oxacillin (50 μg/ml), and 39 treated with penicillin V (500 μg/ml). (C,D) Localization of GFP-SpoIID (C) and GFP-SpoIIM (D) in untreated sporangia or in sporangia treated with bacitracin (μg/ml) or cephalexin (50 μg/ml). Membranes were stained with FM 4–64. (E,F) Fraction of GFP-SpoIID (E) or GFP-SpoIIM (F) at LE. Bars represent the average and standard error of 106 untreated sporangia, 110 bacitracin-treated sporangia and 126 cephalexin-treated sporangia for GFP-SpoIID (E), and 86 untreated, 79 bacitracin-treated and 63 cephalexin-treated sporangia for GFP-SpoIIM (F). Scale bars, 1 μm.
Figure 3 with 1 supplement
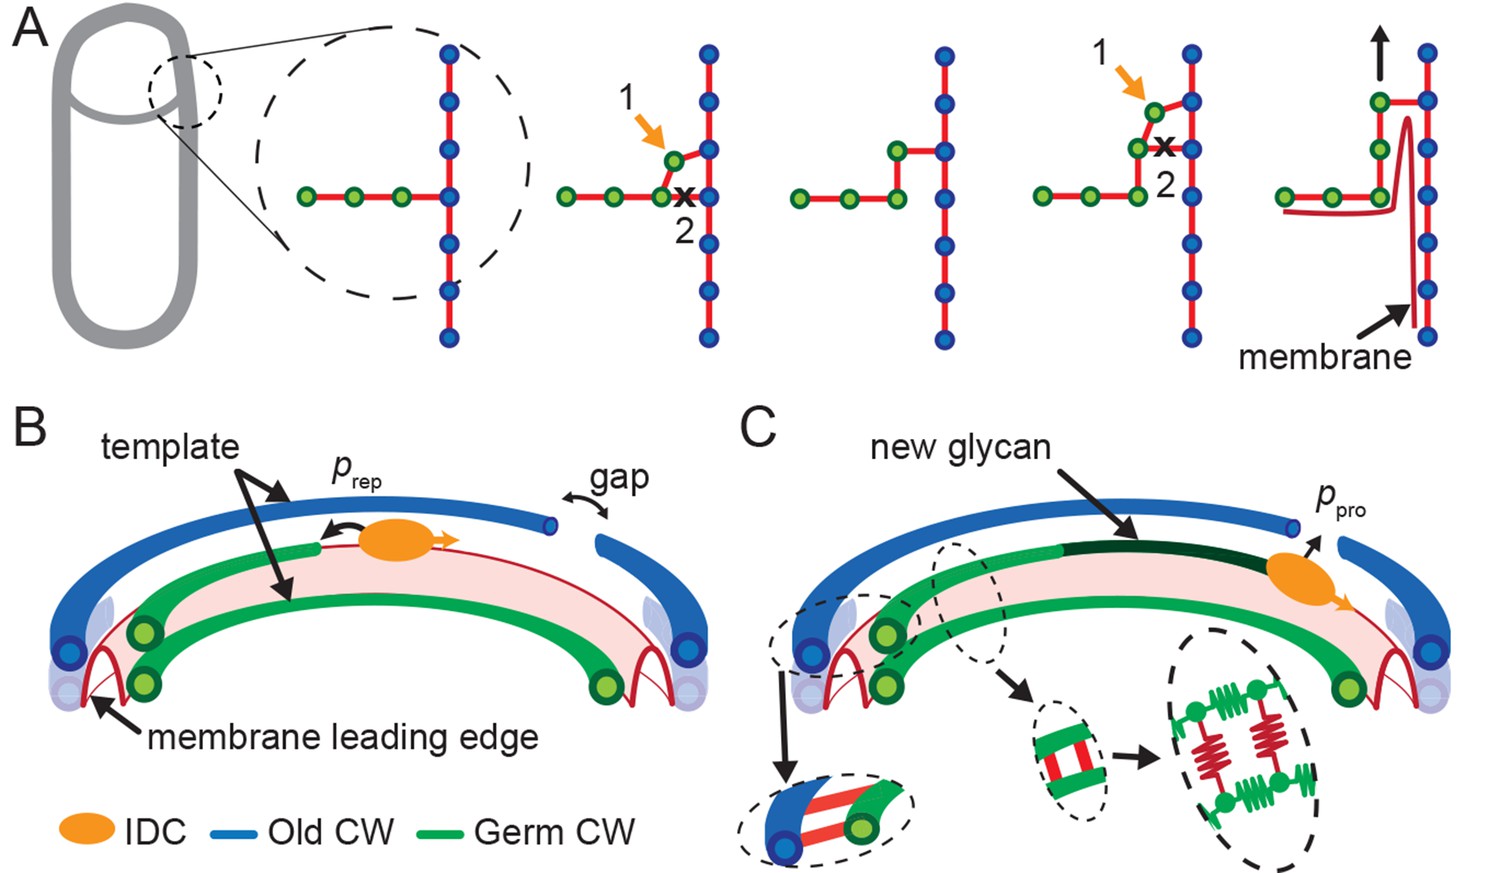
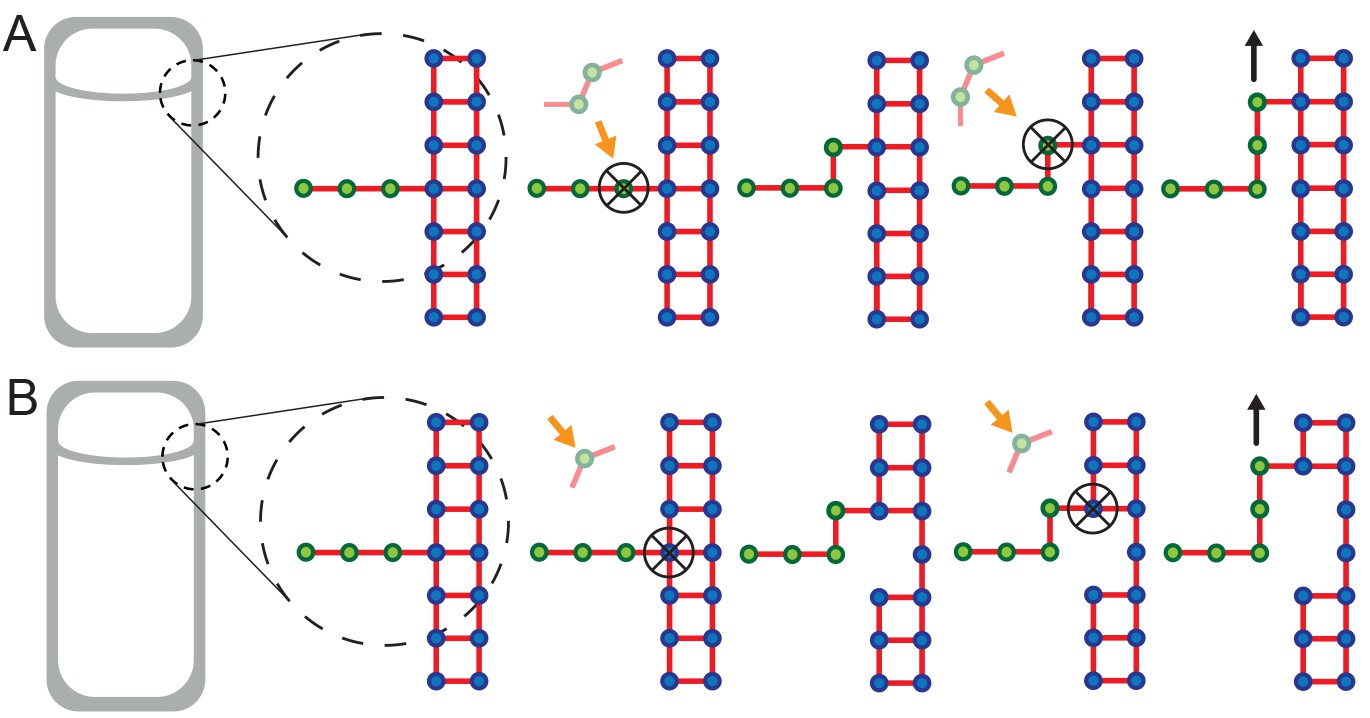
Template model for leading edge (LE) movement.
(A) Cell cross-section with glycan strands in the plane perpendicular to the long axis of the cell. One strand from old cell wall (blue) and one strand from newly synthesized germ-cell wall (green) are used as a template for new glycan insertion. Coordination between glycan insertion (orange arrow) and peptide cross-link degradation (black cross) drives LE forward. (B) 3D model of stochastic glycan insertion by insertion-degradation complex (IDC) with transpeptidase and transglycosylase activity. Probability of IDC to start inserting new glycan from old glycan end and repair end defect is . (C) New inserted glycan shown in dark green. Probability of IDC to continue glycan insertion when it encounters gap in old cell wall is probability of processivity . (Inset) Horizontal (between old and new glycan strands) and vertical (between new glycan strands) peptide links are shown in red. In our coarse-grained model glycans are simulated as semi-flexible filaments consisting of beads (green) connected with springs (green). Peptides are simulated as springs (red) connecting neighboring glycan beads.
Figure 3—figure supplement 1
Extended models that account for glycan-strand degradation.
Here we further explore possible mechanisms considering the fact that SpoIID protein of DMP complex shows transglycosylase activity (Morlot et al., 2010). (A) In the two-for-one mechanism two new glycan strands are added and the newly inserted glycan strand at the LE is degraded (Höltje, 1998). Similarly, the three-for-one mechanism would also work (Scheffers and Pinho, 2005). (B) One new glycan strand is added and the innermost cell-wall glycan of the thick old cell wall is degraded. Similar to images of electron microscopy (Tocheva et al., 2013). However, in these models cell-wall degradation without high level of coordination could affect cell-wall integrity and induce cell lysis. All these models share the ’make-before-break’ strategy promoting robustness of the remodeling process (Koch and Doyle, 1985).
Figure 4 with 5 supplements
Template model reproduces experimentally observed phenotypes.
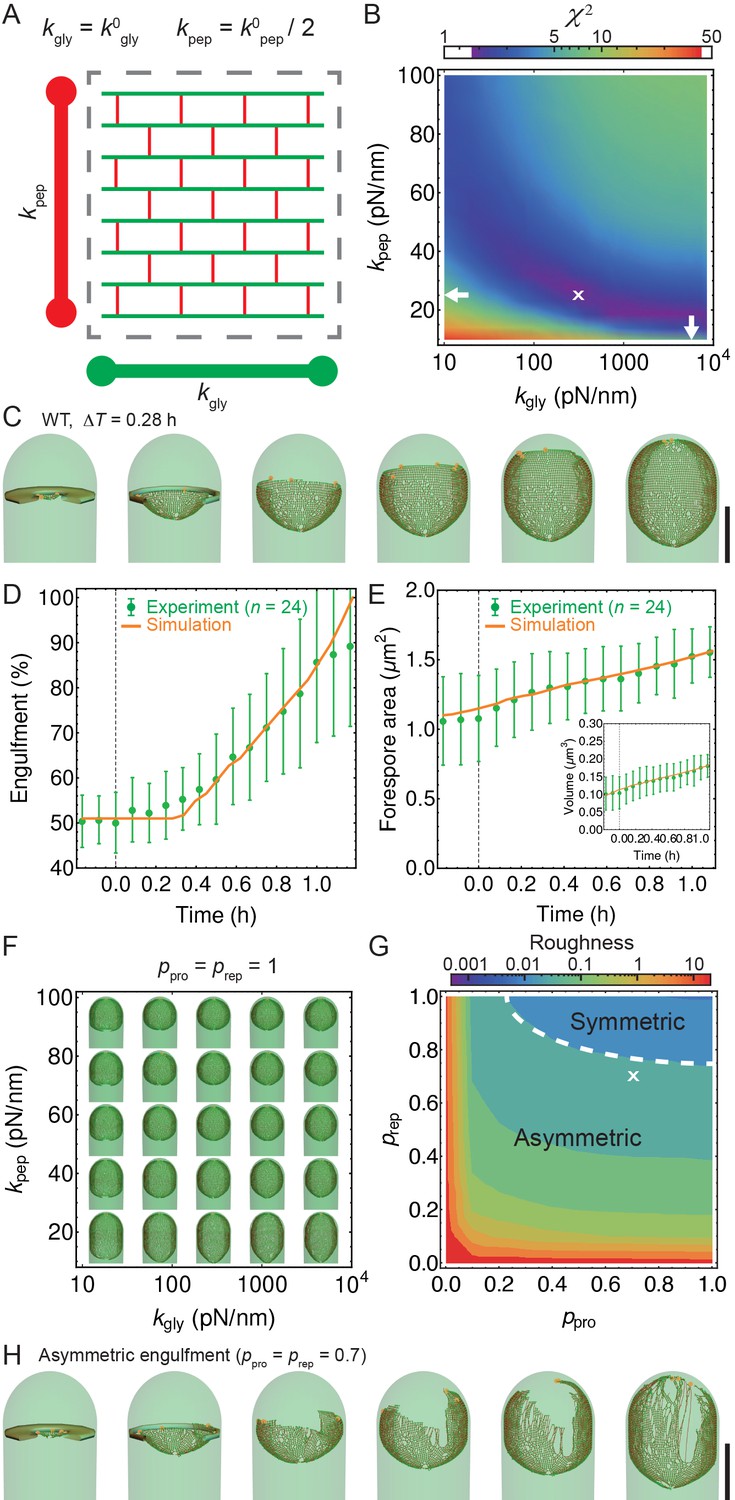
(A) Effective spring constants in our model represent coarse-grained PG network. Here the angle between neighboring stem peptides that belong to a single glycan is assumed to be 90°. Therefore, every other stem peptide is in plane with glycan sheet (Nguyen et al., 2015, Huang et al., 2008). The role of effective glycan persistence length on engulfment is negligible (see Figure 4—figure supplement 3). (B) Simulations for different values of effective peptide and glycan spring constants are compared with experimentally measured forespore surface area, volume and engulfment using mutual statistics (Equation 2). Arrows point to effective literature and (Nguyen et al., 2015). Dark blue region corresponds to simulation parameters that best fit experimental data (Figure 4—figure supplement 4, Video 3). For large enough 200 pN/nm mutual is almost independent of . (C) Snapshots of WT simulations for parameters ( = 200 pN/nm, = 25 pN/nm, = 5) marked with ’’ in panel (B) (Video 2). The thick septum is treated as outer cell wall, and is assumed degraded once IDCs move along. (D–E) Time traces of experimentally measured engulfment, forespore surface area and forespore volume (green) in comparison with results from a single simulation (orange). Parameters used in simulation are marked with ’’ in panel (B). For all other parameters see Appendix 2, Appendix-table 1. (F) Snapshots of fully engulfed forespores for various peptidoglycan elastic constants. (G) For various values of independent parameters and roughness of the LE is calculated at the end of stochastic simulations (see Figure 4—figure supplement 1, and Video 4). Here 0 roughness correspond to perfectly symmetric LE; for high enough 0.8 LE forms symmetric profiles. (H) Simulation for asymmetric engulfment is obtained for same parameter as WT except = 0.7 (marked with ’’ in panel (G)). Average ± SD. Scale bars 1 μm.
Figure 4—figure supplement 1
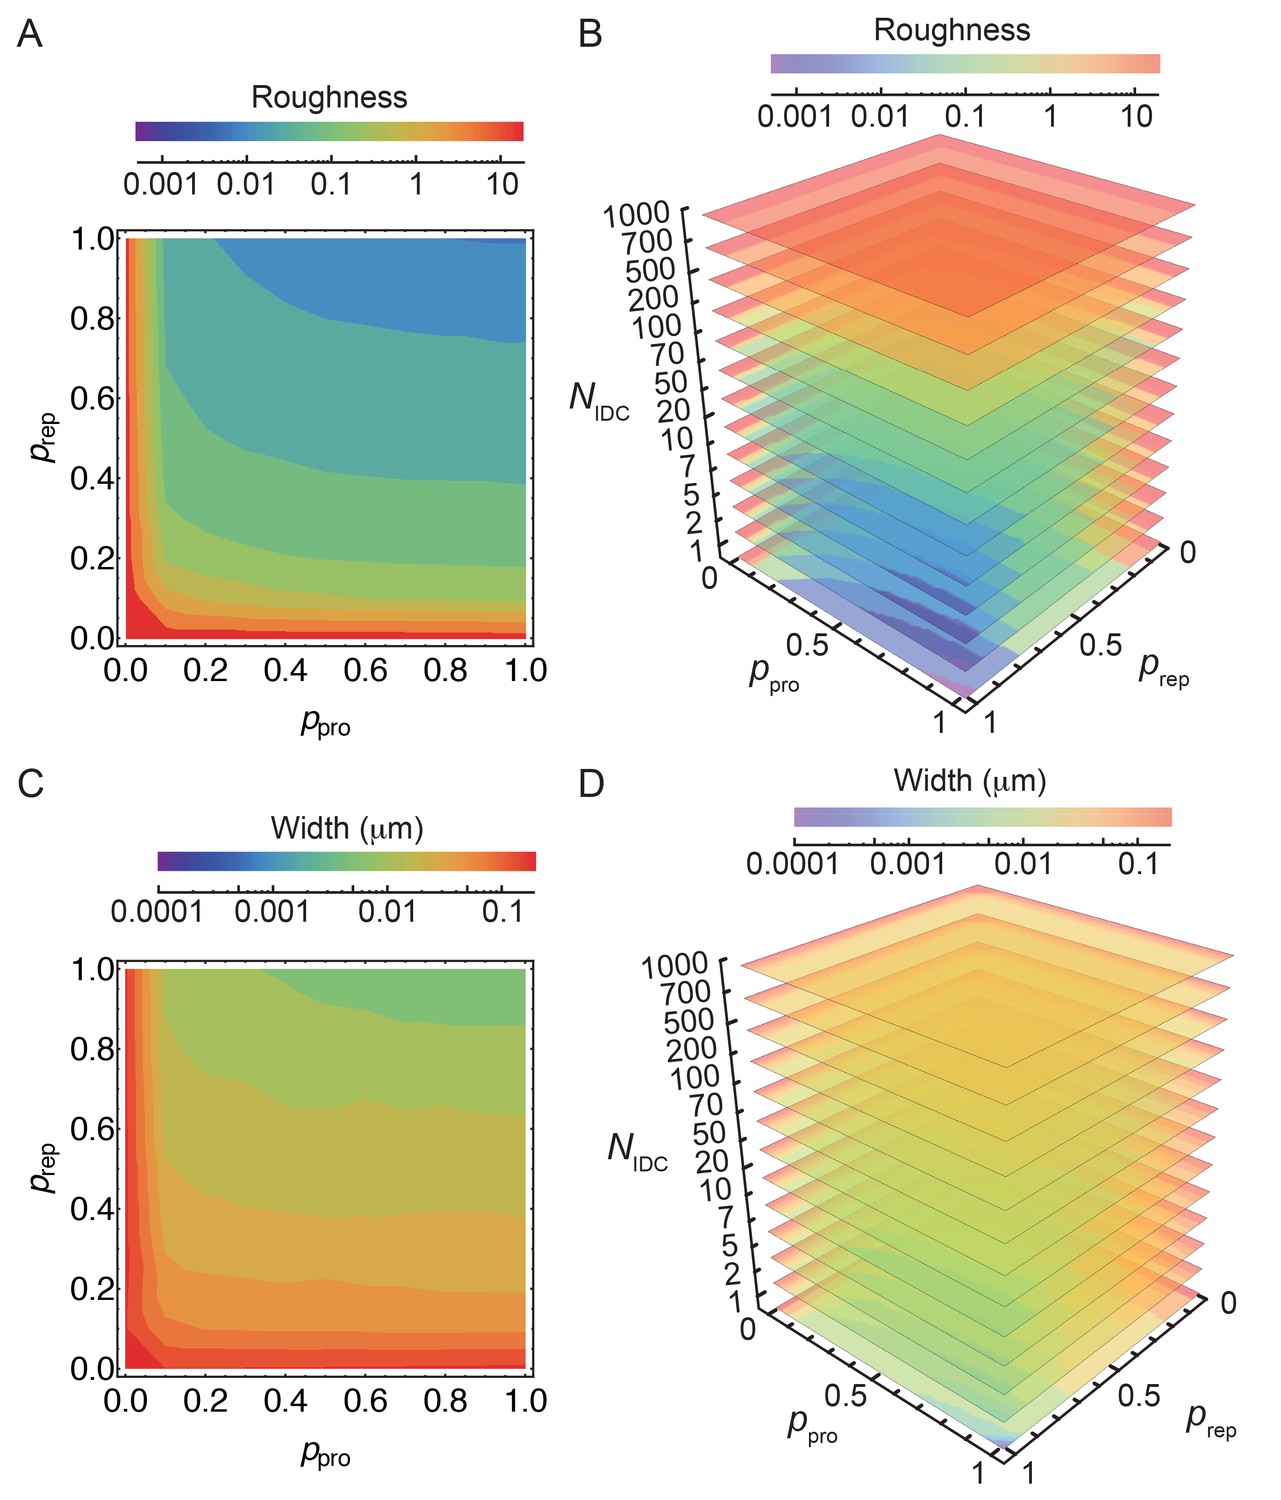
Simulation of the stochastic model of insertion at the leading edge (LE).
(A–D) Stochastic insertion at the LE of discretized cell circumference with 1570 segments. The details are explained in the Materials and Methodes SI section (2.1). Simulations are run until the LE reaches 500 glycans in height. For obtained LE profiles roughness and their widths are calculated. For each set of independent parameters , and we run 100 simulations and plot the average roughness and width. Parameters and are varied in steps of 0.1. (A,C) For = 10 smooth LEs are obtained for and 0.80. For such parameters changing by an order of magnitude marginally affects LE width while keeping LE roughness within 10%.
Figure 4—figure supplement 2
In simulations majority of peptide extensions are in the linear elastic regime.
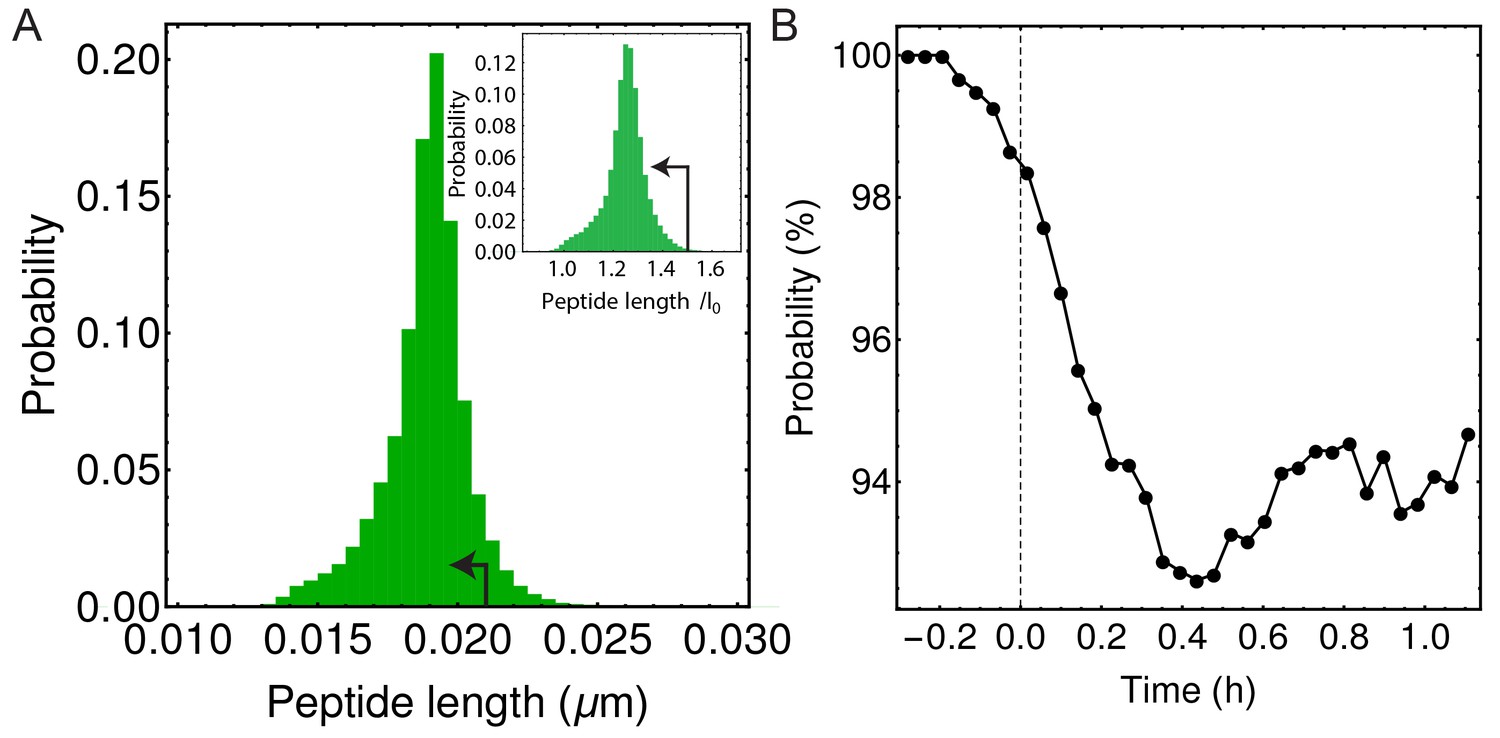
(A) Histogram of all peptide link lengths during one engulfment ( = 25 pN/nm, = 200 pN/nm, = 86.31 kPa). Black arrow points to the linear extension regime (i.e. where each peptide is extended <1 nm or <50% of its equilibrium length of 2 nm) (Nguyen et al., 2015). (B) Percentage of peptide links in simulations that are extended in linear regime as a function of time during the process of engulfment. Dashed vertical line is same as in Figure 4D,E.
Figure 4—figure supplement 3
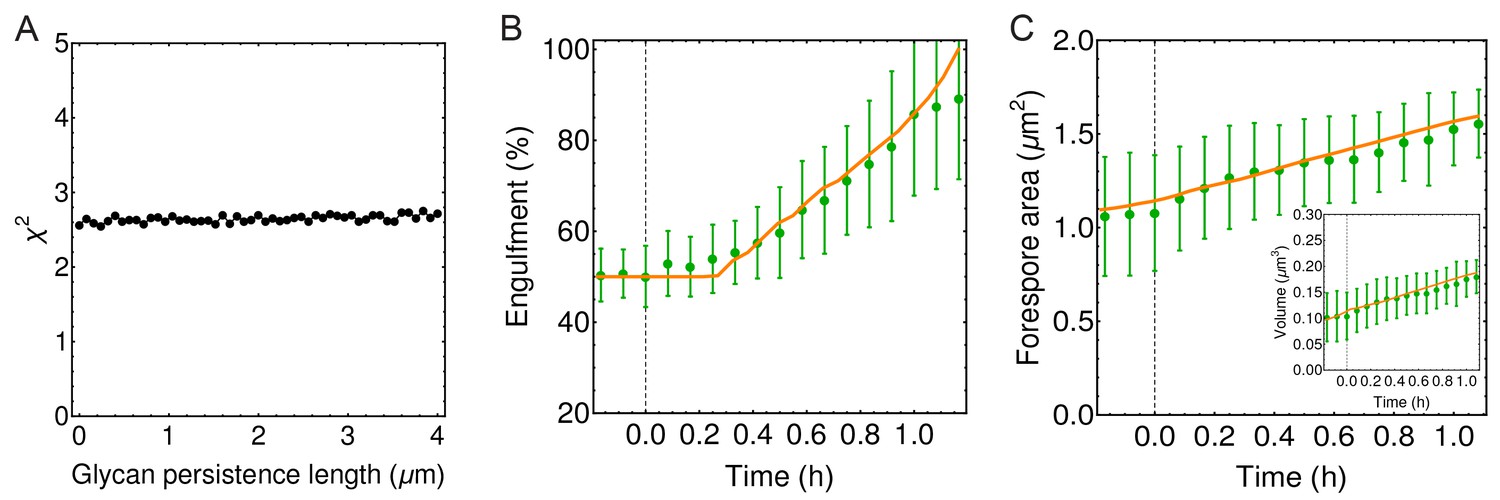
Engulfment is unaffected by glycan persistence length.
(A) (defined in Materials and methods) is used to quantify the impact of effective glycan persistence length () on engulfment dynamics. In weakly crosslinked bundles , where is the number of glycans in the bundle and is the persistence length of a single glycan; in strongly cross-linked bundles (Claessens et al., 2006; Piechocka et al., 2010). Since our simulated filaments represent bundles of seven glycans (Figure 4B), the effective persistence length can reach ∼2 μm ( = 40 nm). (B–C) Engulfment, forespore surface area and forespore volume are not affected even for high values of effective glycan persistence length (m).
Figure 4—figure supplement 4
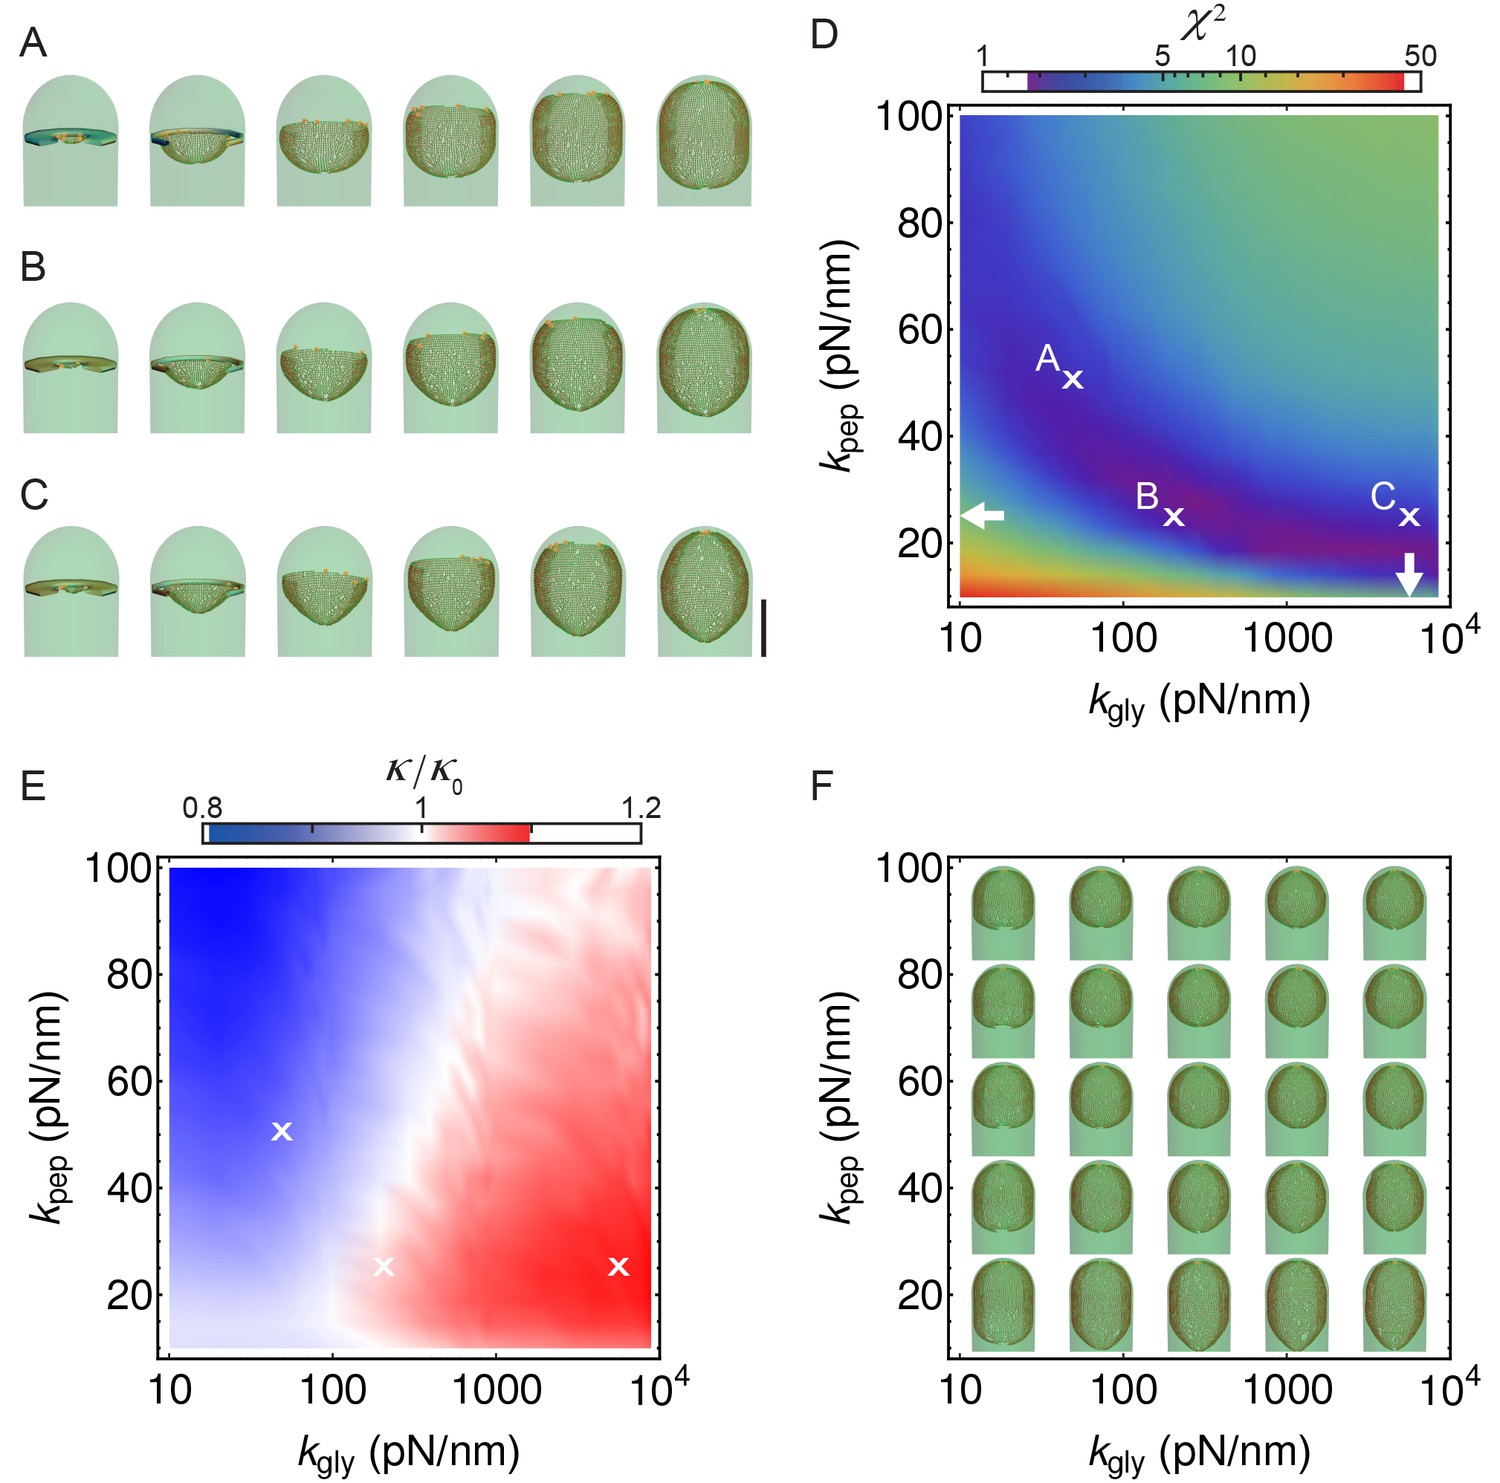
Simulations with different peptidoglycan (PG) elastic constants.
(A–C) Simulation snapshots for three different sets of PG elastic constants marked with ’’ in panel B (A: = = 50 pN/nm; B: = 25 pN/nm, = 200 pN/nm C; = 25 pN/nm, = 5 570 pN/nm ). Elastic constants in C are obtained from molecular dynamic simulations (Nguyen et al., 2015). = 0.28 hr; scale bar 1 μm. (D) Same as Figure 4B, repeated here for clarity. (E) Relative forespore curvature at the end of engulfment where is the curvature of spherical cap. At the end of engulfment curvature was experimentally measured with , where is the standard deviation (see Figure 1—figure supplement 3A). Therefore, curvatures in , B, and C are within the experimentally measured standard deviation. (F) Snapshots of fully engulfed forespores for various PG elastic constants.
Figure 4—figure supplement 5
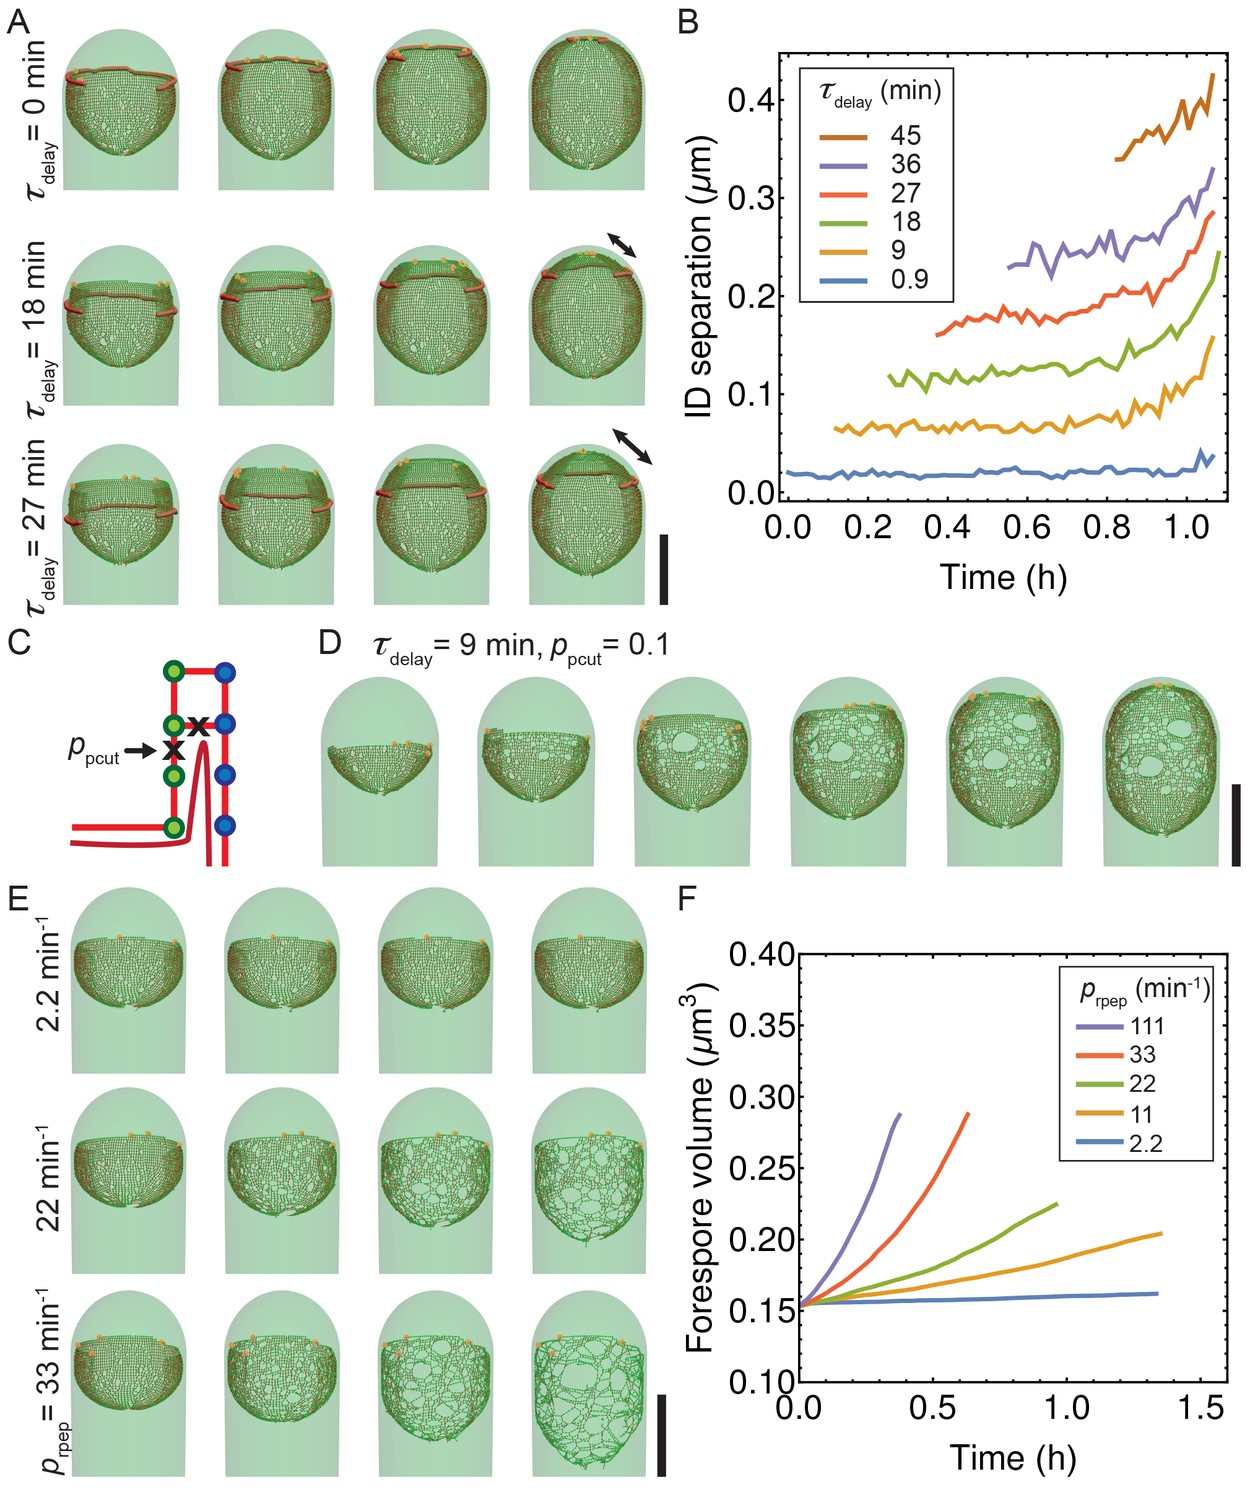
Simulations with decoupled synthesis and degradation.
(A) Simulation snapshots for different values of time delay . Newly inserted glycans are separated from the old cell wall by cutting connecting peptides with typical . Double arrow shows distance between synthesis and membrane leading edge. (B) Euclidian distance between insertion and degradation (ID separation) vs time for different values of . Average over five insertion complexes is plotted vs time. (C) Exploration of delay model when degradation erroneously cuts vertical peptide bonds with probability . (D) For relatively small 0.1, an irregular peptidoglycan meshwork is formed. (E–F) Exploration of role of random peptide degradation when synthesis is stopped. (E) Simulation snapshots for various random peptide degradation rates = 2.2, 22, and 33 min−1. (F) Forespore volume vs time for different peptide degradation rates after synthesis is stopped. Scale bars 1 μm.
Videos
Video 1
Timelapse microscopy of sporulating B. subtilis stained with the membrane dye FM 4–64.
The left panel shows untreated cells, the middle panel cephalexin-treated cells (50 μg/ml), and the right panel bacitracin-treated cells (50 μg/ml). Cells were imaged in agarose pads supplemented with the appropriate antibiotics (see Materials and methods for details). Pictures were taken every 5 min. Total time 2.5 hr.
Video 2
Circumferential movement of forespore GFP-MreB.
The movie shows the movement forespore GFP-MreB in eight different sporangia, determined by TIRF microscopy. A static membrane picture is shown to the left, and the TIRF microscopy of the corresponding GFP-MreB is shown immediately to the right. TIRF pictures were taken every 4 s, and the total duration of the movie is 100 s. The first four sporangia correspond to the examples (i) to (iv) shown in Figure 2.
Video 3
Simulations of WT (left) and asymmetric engulfment (right).
Parameters are the same ( = 25 pN/nm, = 200 pN/nm, = 5) except for WT engulfment = = 1 and for asymmetric engulfment = = 0.7. For full exploration of stochastic insertion parameters see Video 4 and Figure 4—figure supplement 1. Front opening of the forespore is not shown for clarity.
Video 4
Simulations for different values of elastic peptidoglycan (PG) parameters and .
PG spring constants drastically affect forespore morphologies. By decreasing forespores elongate, while by increasing forespores shrink, as measured along the long axis of the cell. Changing has only minor effects on volume and surface area. The main effect is on forespore curvature (see Figure 4—figure supplement 4): high increases the curvature of forespore ends (making them more pointy), while low decreases the curvature of the forespore ends. Septum is not shown for clarity.
Video 5
Simulations for different values of stochastic parameters and .
Decreasing and below 0.8 results in asymmetric engulfment. For full exploration of stochastic insertion parameter see Figure 4—figure supplement 1.
Video 6
Simulations with decoupled synthesis and degradation.
New glycans are released from the old cell wall with typical delay time . Simulations for four different values of 0, 0.9, 9, and 18 min (from left to right). For longer the larger is separation between synthesis and membrane leading edge that is shown as red cylinder.
Tables
Appendix 2—table 1
Model parameters.
| Symbol | Physical quantity | Values used in simulation | Sources / References | Notes |
|---|---|---|---|---|
| Room temperature | 300 K | |||
| Peptide effective spring constant; = / 2 | 25 pN/nm | Figure 4—figure supplement 4, (Nguyen et al., 2015) | for a single peptide | |
| Glycan effective spring constant; = | 5570 pN/nm | Figure 4—figure supplement 4, (Nguyen et al., 2015) | for a single glycan | |
| Glycan persistance length | 40 nm | Figure 4—figure supplement 2,(Nguyen et al., 2015) | ||
| Pressure difference | 86.31 kPa | Apendix (2.2) | ||
| Water viscosity | 0.001 Pa s | |||
| Medium viscosity | 1 Pa s | (Spitzer et al., 2006) | ||
| Mesh size | 0.014 m | Our simulations | ||
| Time step | 2 10s | Our simulations |
Appendix 3—table 1
Strains used in this study.
| Strain | Genotype or description | Reference, source or construction* |
|---|---|---|
| PY79 | Wild type | (Youngman et al., 1984) |
| ABS49 | spoIIP::TetPspoIIP-GFP-spoIIPerm | (Chastanet and Losick, 2007) |
| ABS98 | spoIIM::spcPspoIIM-GFP-spoIIDerm | (Chastanet and Losick, 2007) |
| ABS325 | spoIID::kanPspoIID-GFP-spoIIDerm | (Chastanet and Losick, 2007) |
| JLG626 | spoIIQ::erm | pJLG78 PY79 (Em ) |
| JLG1420 | amyE::PspoIIQ-sfGFP-pbpFcat | pJLG213 PY79 (Cm ) |
| JLG1421 | amyE::PspoIIR-sfGFP-pbpFcat | pJLG214 PY79 (Cm ) |
| JLG1422 | thrC::PspoIID-sfGFP-pbpFspc | pJLG215 PY79 (Sp ) |
| JLG1425 | amyE::PspoIIQ-sfGFP-pbpGcat | pJLG218 PY79 (Cm ) |
| JLG1427 | amyE::PspoIIR-sfGFP-pbpGcat | pJLG219 PY79 (Cm ) |
| JLG1428 | thrC::PspoIID-sfGFP-pbpGspc | pJLG220 PY79 (Sp ) |
| JLG1555 | amyE::PspoIIQ-sfGFP-ponAcat | pJLG222 PY79 (Cm ) |
| JLG1556 | amyE::PspoIIR-sfGFP-ponAcat | pJLG223 PY79 (Cm ) |
| JLG1557 | thrC::PspoIID-sfGFP-ponAspc | pJLG230 PY79 (Sp ) |
| JLG1558 | amyE::PspoIIQ-sfGFP-pbpDcat | pJLG224 PY79 (Cm ) |
| JLG1559 | amyE::PspoIIR-sfGFP-pbpDcat | pJLG225 PY79 (Cm ) |
| JLG1560 | thrC::PspoIID-sfGFP-pbpDspc | pJLG226 PY79 (Sp ) |
| JLG1824 | amyE::PspoIIQ-sfGFP-pbpBcat | pJLG263 PY79 (Cm ) |
| JLG1825 | amyE::PspoIIR-sfGFP-pbpBcat | pJLG264 PY79 (Cm ) |
| JLG1826 | thrC::PspoIID-sfGFP-pbpBspc | pJLG265 PY79 (Sp ) |
| JLG1827 | amyE::PspoIIQ-sfGFP-pbpHcat | pJLG266 PY79 (Cm ) |
| JLG1828 | amyE::PspoIIR-sfGFP-pbpHcat | pJLG267 PY79 (Cm ) |
| JLG1829 | thrC::PspoIID-sfGFP-pbpHspc | pJLG268 PY79 (Sp ) |
| JLG1830 | amyE::PspoIIR-sfGFP-pbpIcat | pJLG270 PY79 (Cm ) |
| JLG1831 | thrC::PspoIID-sfGFP-pbpIspc | pJLG271 PY79 (Sp ) |
| JLG1832 | amyE::PspoIIQ-sfGFP-pbpAcat | pJLG272 PY79 (Cm ) |
| JLG1833 | amyE::PspoIIR-sfGFP-pbpAcat | pJLG273 PY79 (Cm ) |
| JLG1834 | thrC::PspoIID-sfGFP-pbpAspc | pJLG274 PY79 (Sp ) |
| JLG1835 | amyE::PspoIIQ-sfGFP-pbpXcat | pJLG275 PY79 (Cm ) |
| JLG1836 | amyE::PspoIIR-sfGFP-pbpXcat | pJLG276 PY79 (Cm ) |
| JLG1837 | thrC::PspoIID-sfGFP-pbpXspc | pJLG277 PY79 (Sp ) |
| JLG1838 | amyE::PspoIIQ-sfGFP-dacAcat | pJLG278 PY79 (Cm ) |
| JLG1839 | amyE::PspoIIR-sfGFP-dacAcat | pJLG279 PY79 (Cm ) |
| JLG1840 | thrC::PspoIID-sfGFP-dacAspc | pJLG280 PY79 (Sp ) |
| JLG1851 | amyE::PspoIIQ-sfGFP-dacBcat | pJLG281 PY79 (Cm ) |
| JLG1852 | amyE::PspoIIR-sfGFP-dacBcat | pJLG282 PY79 (Cm ) |
| JLG1853 | thrC::PspoIID-sfGFP-dacBspc | pJLG283 PY79 (Sp ) |
| JLG1854 | amyE::PspoIIQ-sfGFP-dacCcat | pJLG284 PY79 (Cm ) |
| JLG1855 | amyE::PspoIIR-sfGFP-dacCcat | pJLG285 PY79 (Cm ) |
| JLG1856 | thrC::PspoIID-sfGFP-dacCspc | pJLG286 PY79 (Sp ) |
| JLG1857 | amyE::PspoIIQ-sfGFP-dacFcat | pJLG287 PY79 (Cm ) |
| JLG1858 | thrC::PspoIID-sfGFP-dacFspc | pJLG289 PY79 (Sp ) |
| JLG1859 | amyE::PspoIIQ-sfGFP-pbpIcat | pJLG269 PY79 (Cm ) |
| JLG1860 | amyE::PspoIIR-sfGFP-dacFcat | pJLG288 PY79 (Cm ) |
| JLG1861 | amyE::PspoIIQ-sfGFP-pbpEcat | pJLG296 PY79 (Cm ) |
| JLG1863 | amyE::PspoIIR-sfGFP-pbpEcat | pJLG298 PY79 (Cm ) |
| JLG1864 | thrC::PspoIID-sfGFP-pbpEspc | pJLG299 PY79 (Sp ) |
| JLG2248 | amyE::PspoIIR-sfGFP-ponAcat spoIIQ::erm | JLG626 JLG1556 (Em ) |
| JLG2356 | gerM::kan | pJLG361 PY79 (Km ) |
| JLG2359 | amyE::PspoIIR-sfGFP-pbpAcat spoIIQ::erm | JLG626 JLG1833 (Em ) |
| JLG2360 | amyE::PspoIIR-sfGFP-pbpAcat spoIIB::erm | KP343 JLG1833 (Em ) |
| JLG2366 | amyE::PspoIIR-sfGFP-ponAcat spoIIB::erm | KP343 JLG1556 (Em ) |
| JLG2367 | amyE::PspoIIR-sfGFP-ponAcat gerM::kan | JLG2356 JLG1556 (Km ) |
| JLG2368 | amyE::PspoIIR-sfGFP-ponAcat spoIIIAG-AH::kan | KP896 JLG1556 (Km ) |
| JLG2369 | amyE::PspoIIR-sfGFP-ponAcat spoIVFAB::cat::tet | KP1013 JLG1556 (Tet ) |
| JLG2370 | amyE::PspoIIR-sfGFP-ponAcat sigE::erm | KP161 JLG1556 (Em ) |
| JLG2371 | amyE::PspoIIR-sfGFP-ponAcat spoIID::Tn917erm | KP8 JLG1556 (Em ) |
| JLG2372 | amyE::PspoIIR-sfGFP-ponAcat spoIIP::tet | KP513 JLG1556 (Tet ) |
| JLG2373 | amyE::PspoIIR-sfGFP-ponAcat spoIIM::Tn917erm | KP519 JLG1556 (Em ) |
| JLG2374 | amyE::PspoIIR-sfGFP-pbpAcat gerM::kan | JLG2356 JLG1833 (Km ) |
| JLG2375 | amyE::PspoIIR-sfGFP-pbpAcat spoIIIAG-AH::kan | KP896 JLG1833 (Km ) |
| JLG2376 | amyE::PspoIIR-sfGFP-pbpAcat spoIVFAB::cat::tet | KP1013 JLG1833 (Tet ) |
| JLG2377 | amyE::PspoIIR-sfGFP-pbpAcat sigE::erm | KP161 JLG1833 (Em ) |
| JLG2378 | amyE::PspoIIR-sfGFP-pbpAcat spoIID::Tn917erm | KP8 JLG1833 (Em ) |
| JLG2379 | amyE::PspoIIR-sfGFP-pbpAcat spoIIP::tet | KP513 JLG1833 (Tet ) |
| JLG2380 | amyE::PspoIIR-sfGFP-pbpAcat spoIIM::Tn917erm | KP519 JLG1833 (Em ) |
| JLG2411 | amyE::PspoIIQ-sfGFP-mreBcat | pJLG363 PY79 (Cm ) |
| JLG2412 | amyE::PspoIIR-sfGFP-mreBcat | pJLG364 PY79 (Cm ) |
| JLG2413 | thrC::PspoIID-sfGFP-mreBspc | pJLG365 PY79 (Sp ) |
| JLG2414 | amyE::PspoIIQ-sfGFP-mblcat | pJLG371 PY79 (Cm ) |
| JLG2415 | amyE::PspoIIR-sfGFP-mblcat | pJLG366 PY79 (Cm ) |
| JLG2416 | thrC::PspoIID-sfGFP-mblspc | pJLG367 PY79 (Sp ) |
| JLG2417 | amyE::PspoIIQ-sfGFP-mreBHcat | pJLG368 PY79 (Cm ) |
| JLG2418 | amyE::PspoIIR-sfGFP-mreBHcat | pJLG369 PY79 (Cm ) |
| JLG2419 | thrC::PspoIID-sfGFP-mreBHspc | pJLG370 PY79 (Sp ) |
| KP8 | spoIID::Tn917erm | (Sandman et al., 1987) |
| KP161 | sigE::erm | (Kenney and Moran, 1987) |
| KP343 | spoIIB::erm | (Margolis et al., 1993) |
| KP513 | spoIIP::tet | (Frandsen and Stragier, 1995) |
| KP519 | spoIIM::Tn917erm | (Sandman et al., 1987) |
| KP896 | spoIIIAG-AH::kan | (Blaylock et al., 2004) |
| KP1013 | spoIVFAB::cat::tet | (Aung et al., 2007) |
-
*Plasmid or genomic DNA employed (right side the arrow) to transform an existing strain (left side the arrow) into a new strain are listed. The drug resistance is noted in parentheses.
Appendix 3—table 2
Plasmids used in this study.
| Plasmid | Description |
|---|---|
| pJLG78 | spoIIQ::erm |
| pJLG88 | amyE::PspoIIQ-pbpFcat |
| pJLG89 | amyE::PspoIIR-pbpFcat |
| pJLG90 | thrC::PspoIID-pbpFspc |
| pJLG91 | amyE::PspoIIQ-pbpGcat |
| pJLG92 | amyE::PspoIIR-pbpGcat |
| pJLG93 | thrC::PspoIID-pbpGspc |
| pJLG213 | amyE::PspoIIQ-sfGFP-pbpFcat |
| pJLG214 | amyE::PspoIIR-sfGFP-pbpFcat |
| pJLG215 | thrC::PspoIID-sfGFP-pbpFspc |
| pJLG218 | amyE::PspoIIQ-sfGFP-pbpGcat |
| pJLG219 | amyE::PspoIIR-sfGFP-pbpGcat |
| pJLG220 | thrC::PspoIID-sfGFP-pbpGspc |
| pJLG222 | amyE::PspoIIQ-sfGFP-ponAcat |
| pJLG223 | amyE::PspoIIR-sfGFP-ponAcat |
| pJLG224 | amyE::PspoIIQ-sfGFP-pbpDcat |
| pJLG225 | amyE::PspoIIR-sfGFP-pbpDcat |
| pJLG226 | thrC::PspoIID-sfGFP-pbpDspc |
| pJLG230 | amyE::PspoIIR-sfGFP-ponAcat |
| pJLG263 | amyE::PspoIIQ-sfGFP-pbpBcat |
| pJLG264 | amyE::PspoIIR-sfGFP-pbpBcat |
| pJLG265 | thrC::PspoIID-sfGFP-pbpBspc |
| pJLG266 | amyE::PspoIIQ-sfGFP-pbpHcat |
| pJLG267 | amyE::PspoIIR-sfGFP-pbpHcat |
| pJLG268 | thrC::PspoIID-sfGFP-pbpHspc |
| pJLG269 | amyE::PspoIIQ-sfGFP-pbpIcat |
| pJLG270 | amyE::PspoIIR-sfGFP-pbpIcat |
| pJLG271 | thrC::PspoIID-sfGFP-pbpIspc |
| pJLG272 | amyE::PspoIIQ-sfGFP-pbpAcat |
| pJLG273 | amyE::PspoIIR-sfGFP-pbpAcat |
| pJLG274 | thrC::PspoIID-sfGFP-pbpAspc |
| pJLG275 | amyE::PspoIIQ-sfGFP-pbpXcat |
| pJLG276 | amyE::PspoIIR-sfGFP-pbpXcat |
| pJLG277 | thrC::PspoIID-sfGFP-pbpXspc |
| pJLG278 | amyE::PspoIIQ-sfGFP-dacAcat |
| pJLG279 | amyE::PspoIIR-sfGFP-dacAcat |
| pJLG280 | thrC::PspoIID-sfGFP-dacAspc |
| pJLG281 | amyE::PspoIIQ-sfGFP-dacBcat |
| pJLG282 | amyE::PspoIIR-sfGFP-dacBcat |
| pJLG283 | thrC::PspoIID-sfGFP-dacBspc |
| pJLG284 | amyE::PspoIIQ-sfGFP-dacCcat |
| pJLG285 | amyE::PspoIIR-sfGFP-dacCcat |
| pJLG286 | thrC::PspoIID-sfGFP-dacCspc |
| pJLG287 | amyE::PspoIIQ-sfGFP-dacFcat |
| pJLG288 | amyE::PspoIIR-sfGFP-dacFcat |
| pJLG289 | thrC::PspoIID-sfGFP-dacFspc |
| pJLG296 | amyE::PspoIIQ-sfGFP-pbpEcat |
| pJLG298 | amyE::PspoIIR-sfGFP-pbpEcat |
| pJLG299 | thrC::PspoIID-sfGFP-pbpEspc |
| pJLG361 | gerM::kan |
| pJLG363 | amyE::PspoIIQ-sfGFP-mreBcat |
| pJLG364 | amyE::PspoIIR-sfGFP-mreBcat |
| pJLG365 | thrC::PspoIID-sfGFP-mreBspc |
| pJLG366 | amyE::PspoIIR-sfGFP-mblcat |
| pJLG367 | thrC::PspoIID-sfGFP-mblspc |
| pJLG368 | amyE::PspoIIQ-sfGFP-mreBHcat |
| pJLG369 | amyE::PspoIIR-sfGFP-mreBHcat |
| pJLG370 | thrC::PspoIID-sfGFP-mreBHspc |
| pJLG371 | amyE::PspoIIQ-sfGFP-mblcat |
Appendix 3—table 3
Oligonucleotides used in this sudy.
| Primer | Sequence† |
|---|---|
| JLG-95 | CATGGATTACGCGTTAACCC |
| JLG-96 | GCACTTTTCGGGGAAATGTG |
| JLG-249 | catacgccgagttatcacatGATGATTCAACTGACAAATCTGG |
| JLG-250 | cacatttccccgaaaagtgcCCAAGTGACCATACGACAGG |
| JLG-251 | gggttaacgcgtaatccatgGACAGAGTGACAAGCGATCC |
| JLG-252 | gggttgccagagttaaaggaAAGTAAATTGCAGGGAACACC |
| JLG-253 | TCCTTTAACTCTGGCAACCC |
| JLG-254 | ATGTGATAACTCGGCGTATG |
| JLG-138 | CGAAGGCAGCAGTTTTTTGG |
| JLG-139 | ATAGAGATCCGATCAGACCAG |
| JLG-152 | TGCGAATTGTTTCATATTCAG |
| JLG-153 | GTTTTCTTCCTCTCTCATTGTTTC |
| JLG-297 | TACTGTTTTTTTCATCGGTCC |
| JLG-299 | gaaacaatgagagaggaagaaaac ATGTTTAAGATAAAGAAAAAGAAACTTTTTATAC |
| JLG-300 | ctggtctgatcggatctctat ACCTTGTTTTAGGCAAATGG |
| JLG-301 | ggaccgatgaaaaaaacagta ATGTTTAAGATAAAGAAAAAGAAACTTTTTATAC |
| JLG-302 | ctgaatatgaaacaattcgca ATGTTTAAGATAAAGAAAAAGAAACTTTTTATAC |
| JLG-303 | ccaaaaaactgctgccttcg ACCTTGTTTTAGGCAAATGG |
| JLG-304 | gaaacaatgagagaggaagaaaac GTGGATGCAATGACAAATAAAC |
| JLG-306 | ctggtctgatcggatctctat GGAACCATACGAATAACCCG |
| JLG-306 | ggaccgatgaaaaaaacagta GTGGATGCAATGACAAATAAAC |
| JLG-307 | ctgaatatgaaacaattcgca GTGGATGCAATGACAAATAAAC |
| JLG-308 | ccaaaaaactgctgccttcg GGAACCATACGAATAACCCG |
| JLG-453 | TGCGCTTGCGCTTGCGCTG |
| JLG-889 | gctagcagcgcaagcgcaagcgca ATGTTTAAGATAAAGAAAAAGAAACTTTTTATAC |
| JLG-890 | gctagcagcgcaagcgcaagcgca GTGGATGCAATGACAAATAAAC |
| JLG-891 | gaaacaatgagagaggaagaaaac GCTAAAGGCGAAGAACTGTTTAC |
| JLG-892 | ggaccgatgaaaaaaacagta GCTAAAGGCGAAGAACTGTTTAC |
| JLG-893 | ctgaatatgaaacaattcgca GCTAAAGGCGAAGAACTGTTTAC |
| JLG-894 | tgcgcttgcgcttgcgctgctagc TTTATACAGTTCATCCATGCC |
| JLG-977 | cagcgcaagcgcaagcgca ATGTCAGATCAATTTAACAGCC |
| JLG-978 | ctggtctgatcggatctctat TACCAAAAAAGCCATCACCC |
| JLG-979 | ccaaaaaactgctgccttcg TACCAAAAAAGCCATCACCC |
| JLG-980 | cagcgcaagcgcaagcgca GTGACCATGTTACGAAAAATAATC |
| JLG-981 | ctggtctgatcggatctctat TCTGAAGTCACTCCATATCCC |
| JLG-982 | ccaaaaaactgctgccttcg TCTGAAGTCACTCCATATCCC |
| JLG-1021 | cagcgcaagcgcaagcgca ATGATTCAAATGCCAAAAAAG |
| JLG-1022 | ctggtctgatcggatctctat TTTGGACAGGTAGAACGATG |
| JLG-1023 | ccaaaaaactgctgccttcg TTTGGACAGGTAGAACGATG |
| JLG-1024 | cagcgcaagcgcaagcgca ATGAAGCAGAATAAAAGAAAGCATC |
| JLG-1025 | ctggtctgatcggatctctat CATTCCTTTCTACTTCGTACGG |
| JLG-1026 | ccaaaaaactgctgccttcg CATTCCTTTCTACTTCGTACGG |
| JLG-1027 | cagcgcaagcgcaagcgca ATGAACCTTTTTTTCCTAGCTG |
| JLG-1028 | ctggtctgatcggatctctat CGCTAGAAAATGAGTATTCTCCTTC |
| JLG-1029 | ccaaaaaactgctgccttcg CGCTAGAAAATGAGTATTCTCCTTC |
| JLG-1030 | cagcgcaagcgcaagcgca ATGAAGATATCGAAACGAATGAAG |
| JLG-1031 | ctggtctgatcggatctctat TCTGCACTCCTTTATCCCTC |
| JLG-1032 | ccaaaaaactgctgccttcg TCTGCACTCCTTTATCCCTC |
| JLG-1033 | cagcgcaagcgcaagcgca ATGACAAGCCCAACCCGCAG |
| JLG-1034 | ctggtctgatcggatctctat CCATCTTAACGTTTGCAGGC |
| JLG-1035 | ccaaaaaactgctgccttcg CCATCTTAACGTTTGCAGGC |
| JLG-1036 | cagcgcaagcgcaagcgca ATGAGGAGAAATAAACCAAAAAAG |
| JLG-1037 | ctggtctgatcggatctctat AAGGTTTTGTAAATCAGTGCG |
| JLG-1038 | ccaaaaaactgctgccttcg AAGGTTTTGTAAATCAGTGCG |
| JLG-1039 | cagcgcaagcgcaagcgca TTGAACATCAAGAAATGTAAACAG |
| JLG-1040 | ctggtctgatcggatctctat TGGGTTTTTTCAGTATATTACGC |
| JLG-1041 | ccaaaaaactgctgccttcg TGGGTTTTTTCAGTATATTACGC |
| JLG-1042 | cagcgcaagcgcaagcgca ATGCGCATTTTCAAAAAAGCAG |
| JLG-1043 | ctggtctgatcggatctctat GATCACGGTTAAACTGACCC |
| JLG-1044 | ccaaaaaactgctgccttcg GATCACGGTTAAACTGACCC |
| JLG-1045 | cagcgcaagcgcaagcgca ATGAAAAAAAGCATAAAGCTTTATG |
| JLG-1046 | ctggtctgatcggatctctat CTAATTGTTGGAAGGTTCGAC |
| JLG-1047 | ccaaaaaactgctgccttcg CTAATTGTTGGAAGGTTCGAC |
| JLG-1048 | cagcgcaagcgcaagcgca ATGAAACGTCTTTTATCCACTTTG |
| JLG-1049 | ctggtctgatcggatctctat ATGAATTCCTTCACCGTGAC |
| JLG-1050 | ccaaaaaactgctgccttcg ATGAATTCCTTCACCGTGAC |
| JLG-1312 | gggttaacgcgtaatccatgACGGATAATCAGCATATCGG |
| JLG-1313 | gcctgagcgagggagcagaaGCAGAGGTGAGACAAGTGG |
| JLG-1314 | gcgttgaccagtgctccctgcTCTCCAGACCATCTCAAGTG |
| JLG-1315 | cacatttccccgaaaagtgcTCAATTCCAACAGAGATTGC |
| JLG-1330 | cagcgcaagcgcaagcgcaATGTTTGGAATTGGTGCTAG |
| JLG-1331 | ctggtctgatcggatctctatCACCTCTTCTATTGAACTCCC |
| JLG-1332 | ccaaaaaactgctgccttcgCACCTCTTCTATTGAACTCCC |
| JLG-1333 | cagcgcaagcgcaagcgcaATGTTTGCAAGGGATATTGG |
| JLG-1334 | ctggtctgatcggatctctatCCAGTTGTCATATAGGAACGTTC |
| JLG-1335 | ccaaaaaactgctgccttcgCCAGTTGTCATATAGGAACGTTC |
| JLG-1336 | cagcgcaagcgcaagcgcaATGTTTCAATCAACTGAAATCG |
| JLG-1337 | ctggtctgatcggatctctatCTCTTAGCATCTGTTTCCTCC |
| JLG-1338 | ccaaaaaactgctgccttcgCTCTTAGCATCTGTTTCCTCC |
| oER421 | ttctgctccctcgctcaggcggccgcATGAGAGAGGAAGAAAACGG |
| oER422 | cagggagcactggtcaacgctagcAATTGGGACAACTCCAGTG |
-
†In capital letters are shown the regions of the primer that anneal to the template. Homology regions for Gibson assembly are shown in italics.
Additional files
-
Supplementary file 1
Plasmid construction.
- https://doi.org/10.7554/eLife.18657.025
-
Supplementary file 2
Image analysis example with code.
- https://doi.org/10.7554/eLife.18657.026
Download links
A two-part list of links to download the article, or parts of the article, in various formats.
Downloads (link to download the article as PDF)
Open citations (links to open the citations from this article in various online reference manager services)
Cite this article (links to download the citations from this article in formats compatible with various reference manager tools)
Cell-wall remodeling drives engulfment during Bacillus subtilis sporulation
eLife 5:e18657.
https://doi.org/10.7554/eLife.18657


