ATPase activity of the DEAD-box protein Dhh1 controls processing body formation
- University of California, Berkeley, United States
- ETH Zurich, Switzerland
Figures
Figure 1 with 1 supplement
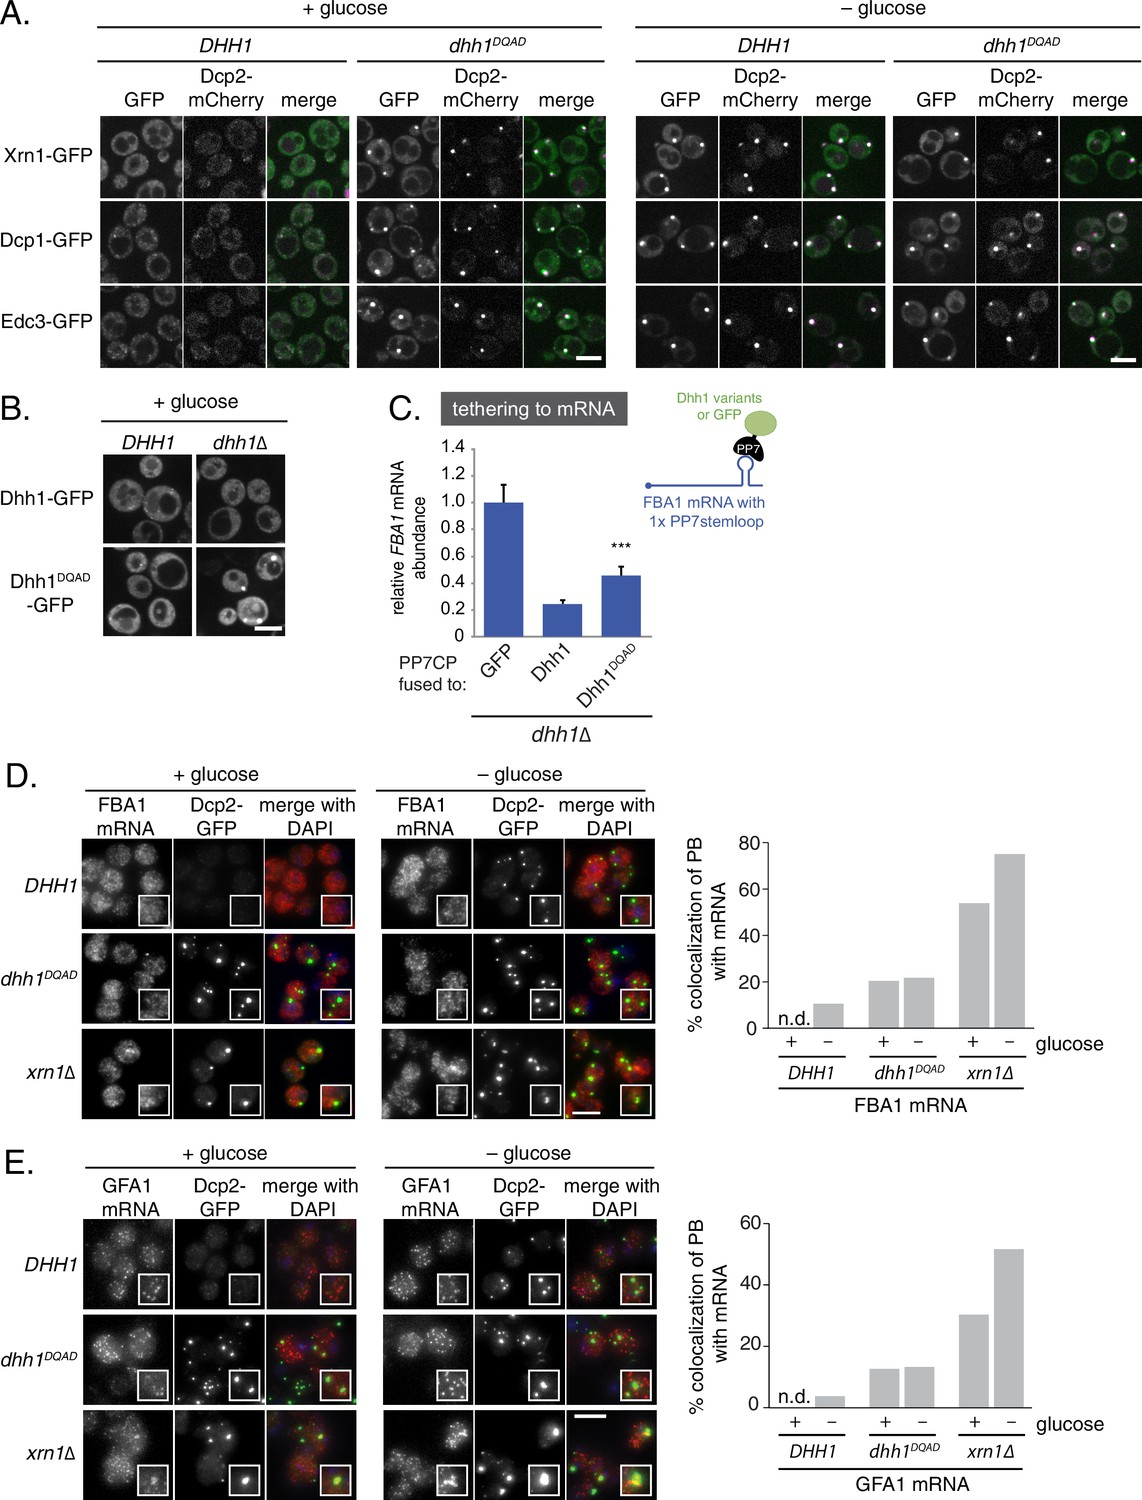
Loss of the ATPase activity of Dhh1 triggers bona fide processing body (PB) formation.
(A) Known PB components localize to Dhh1DQAD foci. Cells co-expressing the indicated PB component were grown to exponential growth phase, then shifted to glucose-rich or glucose starvation conditions for 20 min and observed by confocal microscopy. Scale bar: 5 μm (B) Constitutive PB formation by Dhh1DQAD is rescued by the presence of wild-type Dhh1. Dhh1-GFP or Dhh1DQAD-GFP was expressed from a CEN plasmid in DHH1 or dhh1∆ cells and were treated as in (A). Scale bar: 5 μm (C) Loss of ATPase activity mildly disrupts degradation of a Dhh1-tethered mRNA. Dhh1 or Dhh1DQAD was co-expressed as a PP7CP fusion protein in dhh1∆ cells expressing FBA1-PP7L. FBA1 mRNA levels were measured by qPCR and normalized to ACT1 mRNA. Graphs show mean mRNA levels from three independent experiments of biological triplicate samples. Error bars represent SD. A student’s t-test comparing Dhh1 and Dhh1DQAD is shown. Asterisks indicate p<0.005. (D) FBA1 mRNAs do not colocalize with PBs in Dhh1 or Dhh1DQAD-expressing cells, suggesting functional mRNA decay, but enrich in PBs in xrn1∆ cells. The indicated strains were grown to exponential growth phase, shifted to either glucose-rich (2% glucose) or glucose starvation conditions for 20 min, fixed with paraformaldehyde and processed for smFISH. Depicted is a maximum projection of the central 10 planes of a 3D image. Insets show representative cells (1.67X magnification). The graph shows the quantification of a representative experiment (n = 2 biological replicates). Scale bar: 5 µm. (E) GFA1 mRNAs do not colocalize with PBs in Dhh1 or Dhh1DQAD-expressing cells, suggesting functional mRNA decay, but enrich in PBs in xrn1∆ cells. The indicated strains were grown to exponential growth phase, shifted to either glucose-rich (2% glucose) or glucose starvation conditions for 20 min, fixed with paraformaldehyde and processed for smFISH as in (D). Insets show representative cells (1.67X magnification). The graph shows the quantification of a representative experiment (n = 2 biological replicates). Scale bar: 5 µm.
Figure 1—figure supplement 1
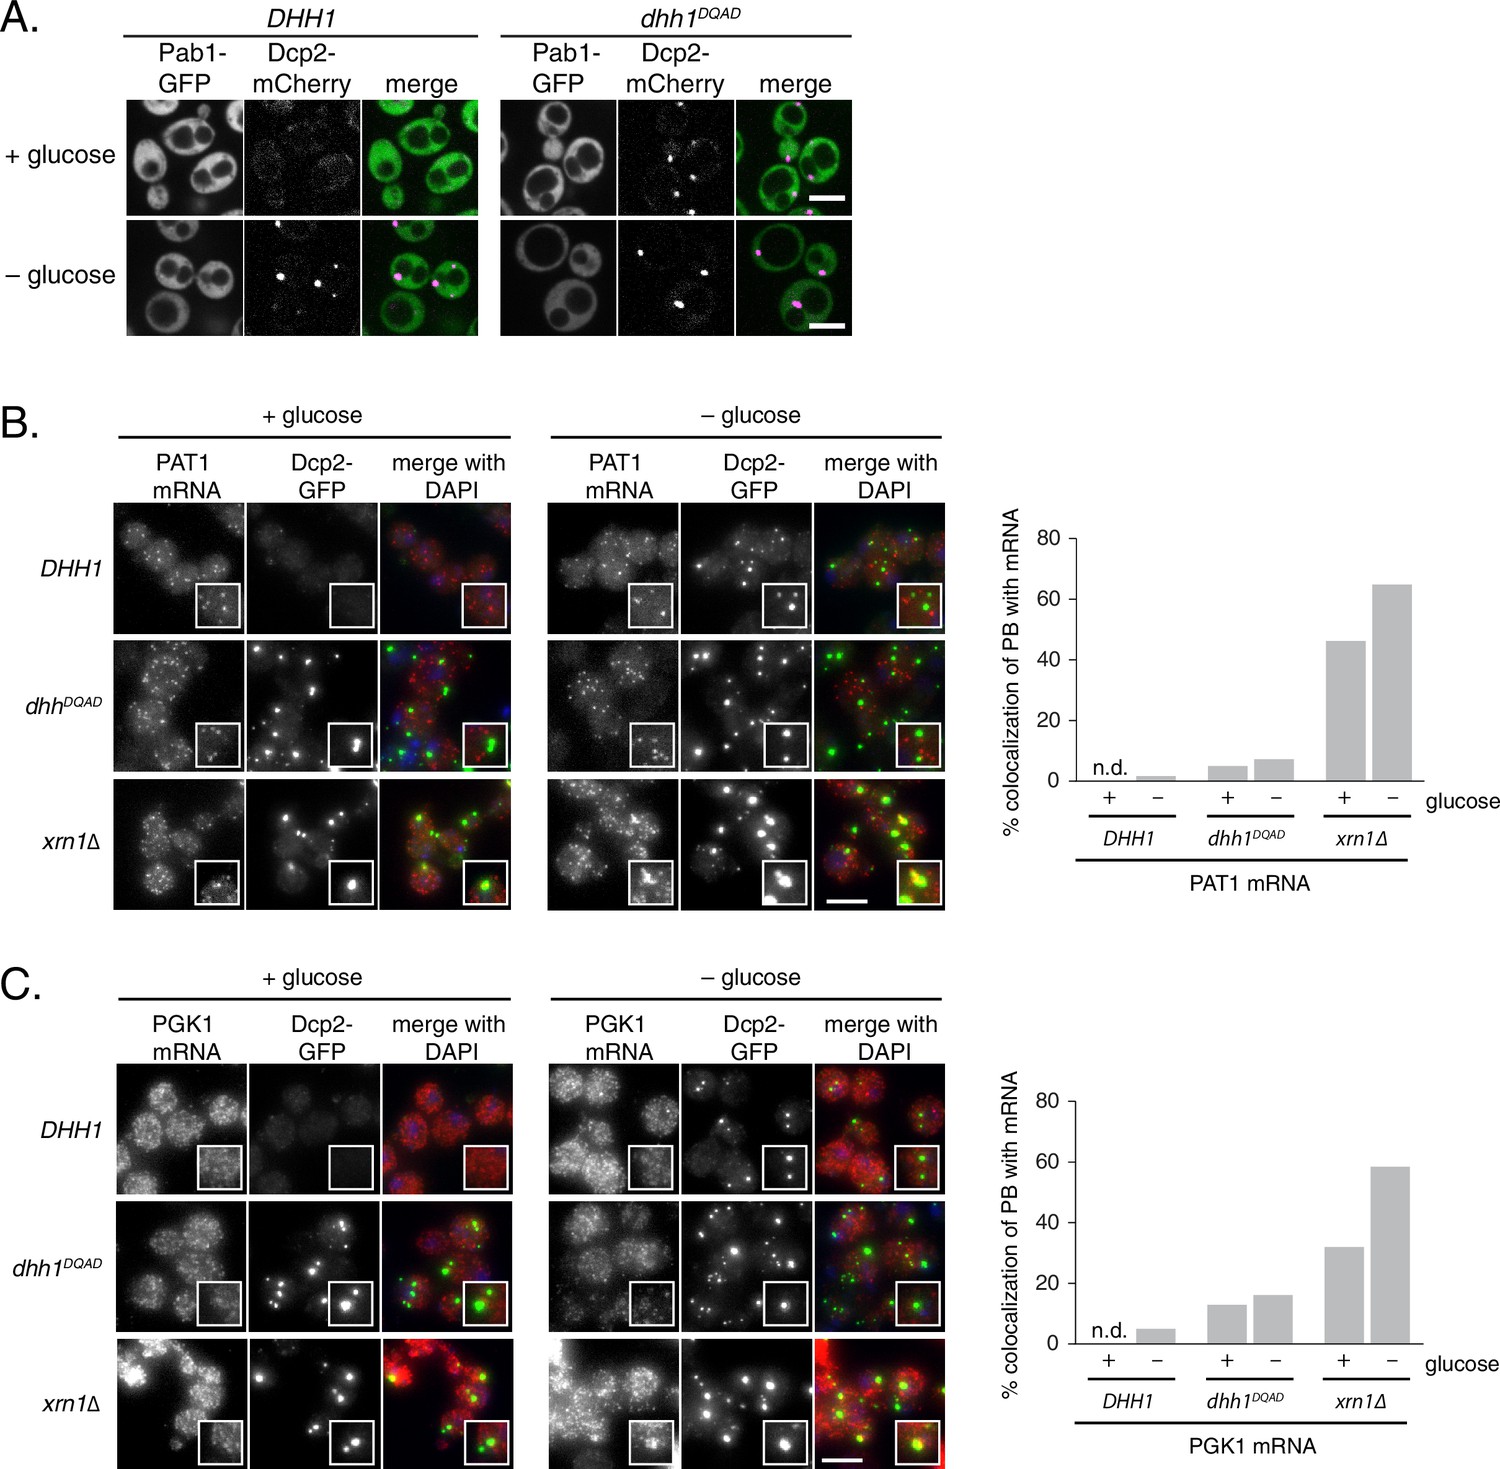
Loss of ATPase activity of Dhh1 does not trigger stress granule formation.
(A) Dhh1DQAD does not trigger constitutive stress granule formation. Cells co-expressing Pab1-GFP were grown to exponential growth phase, then shifted to glucose-rich or glucose starvation conditions for 20 min and observed by confocal microscopy. Scale bar: 5 μm (B) PAT1 mRNAs do not colocalize with PBs in Dhh1 or Dhh1DQAD-expressing cells, suggesting functional mRNA decay, but enrich in PBs in xrn1∆ cells. The indicated strains were grown to exponential growth phase, shifted to either glucose-rich or glucose starvation conditions for 20 min, fixed with paraformaldehyde and processed for smFISH. Depicted is a maximum projection of the central 10 planes of a 3D image. Insets show representative cells (1.67X magnification). Scale bar: 5 µm. (C) PGK1 mRNAs do not colocalize with PBs in Dhh1 or Dhh1DQAD-expressing cells, suggesting functional mRNA decay, but enrich in PBs in xrn1∆ cells. The indicated strains were grown to exponential growth phase, shifted to either glucose-rich or glucose starvation conditions for 20 min, fixed with paraformaldehyde and processed for smFISH as in (A). Insets show representative cells (1.67X magnification). ale bar: 5 µm.
Figure 2 with 2 supplements
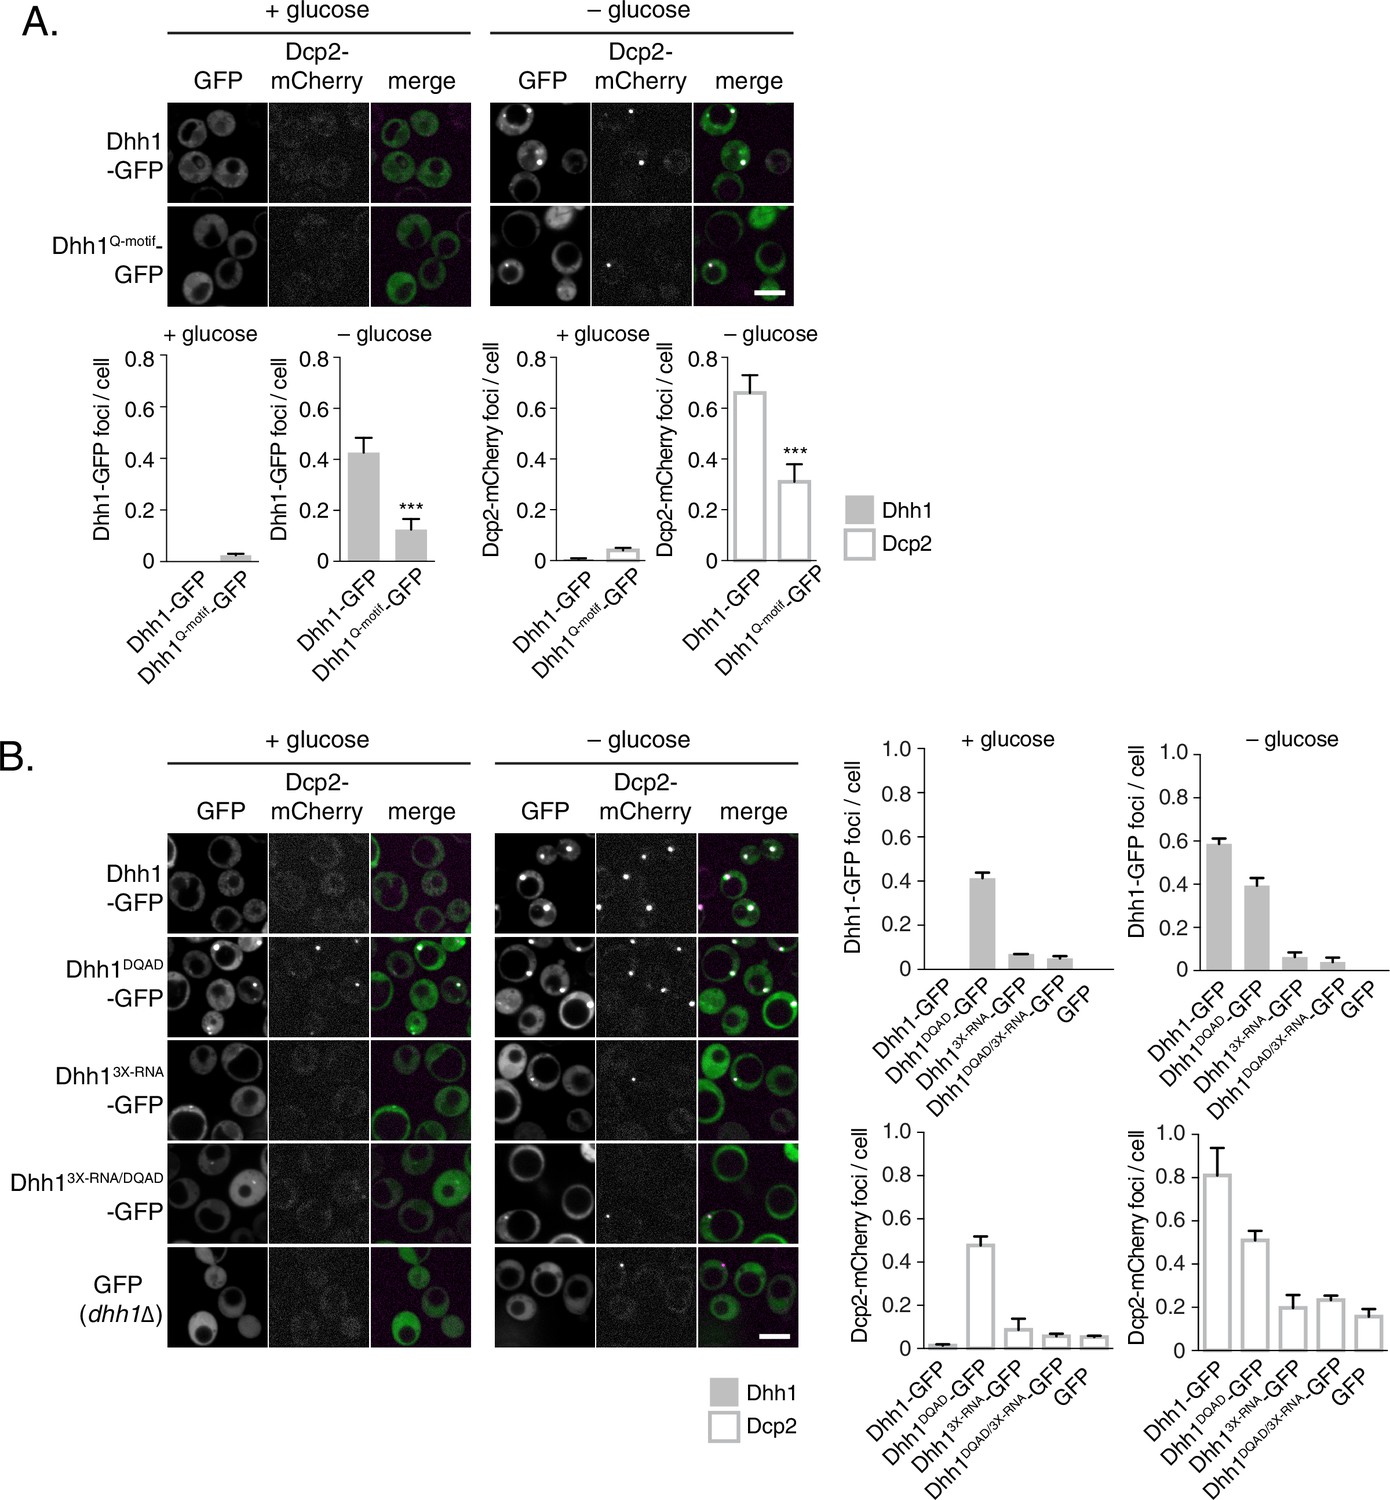
ATP-bound, RNA-bound Dhh1 is required for robust PB formation.
(A) Disruption of ATP-binding activity of Dhh1 interferes with PB formation. Wild-type Dhh1 or Dhh1Q-motif was co-expressed from a plasmid as a GFP fusion protein in dhh1∆ cells along with Dcp2-mCherry as a PB marker and grown to exponential growth phase, then shifted to either glucose-rich or glucose starvation conditions for 20 min and observed by confocal microscopy. Images were also acquired using wide-field microscopy and PB formation was quantified using Diatrack 3.5 particle tracking software (see Materials and methods). Graphs represent average Dhh1-GFP or Dcp2-mCherry foci number per cell (n=3 biological replicates, >800 cells per experiment). Error bars represent SD. A student’s t-test comparing Dhh1 and Dhh1Q-motif is shown. Asterisks indicate p<0.005. Scale bar: 5 µm. (B) Disruption of RNA binding activity of Dhh1 interferes with PB formation. Wild-type or mutant Dhh1 was co-expressed from a plasmid as a GFP fusion protein in dhh1∆ cells along with Dcp2-mCherry as a PB marker and treated as in (A). Scale bar: 5 µm.
Figure 2—figure supplement 1
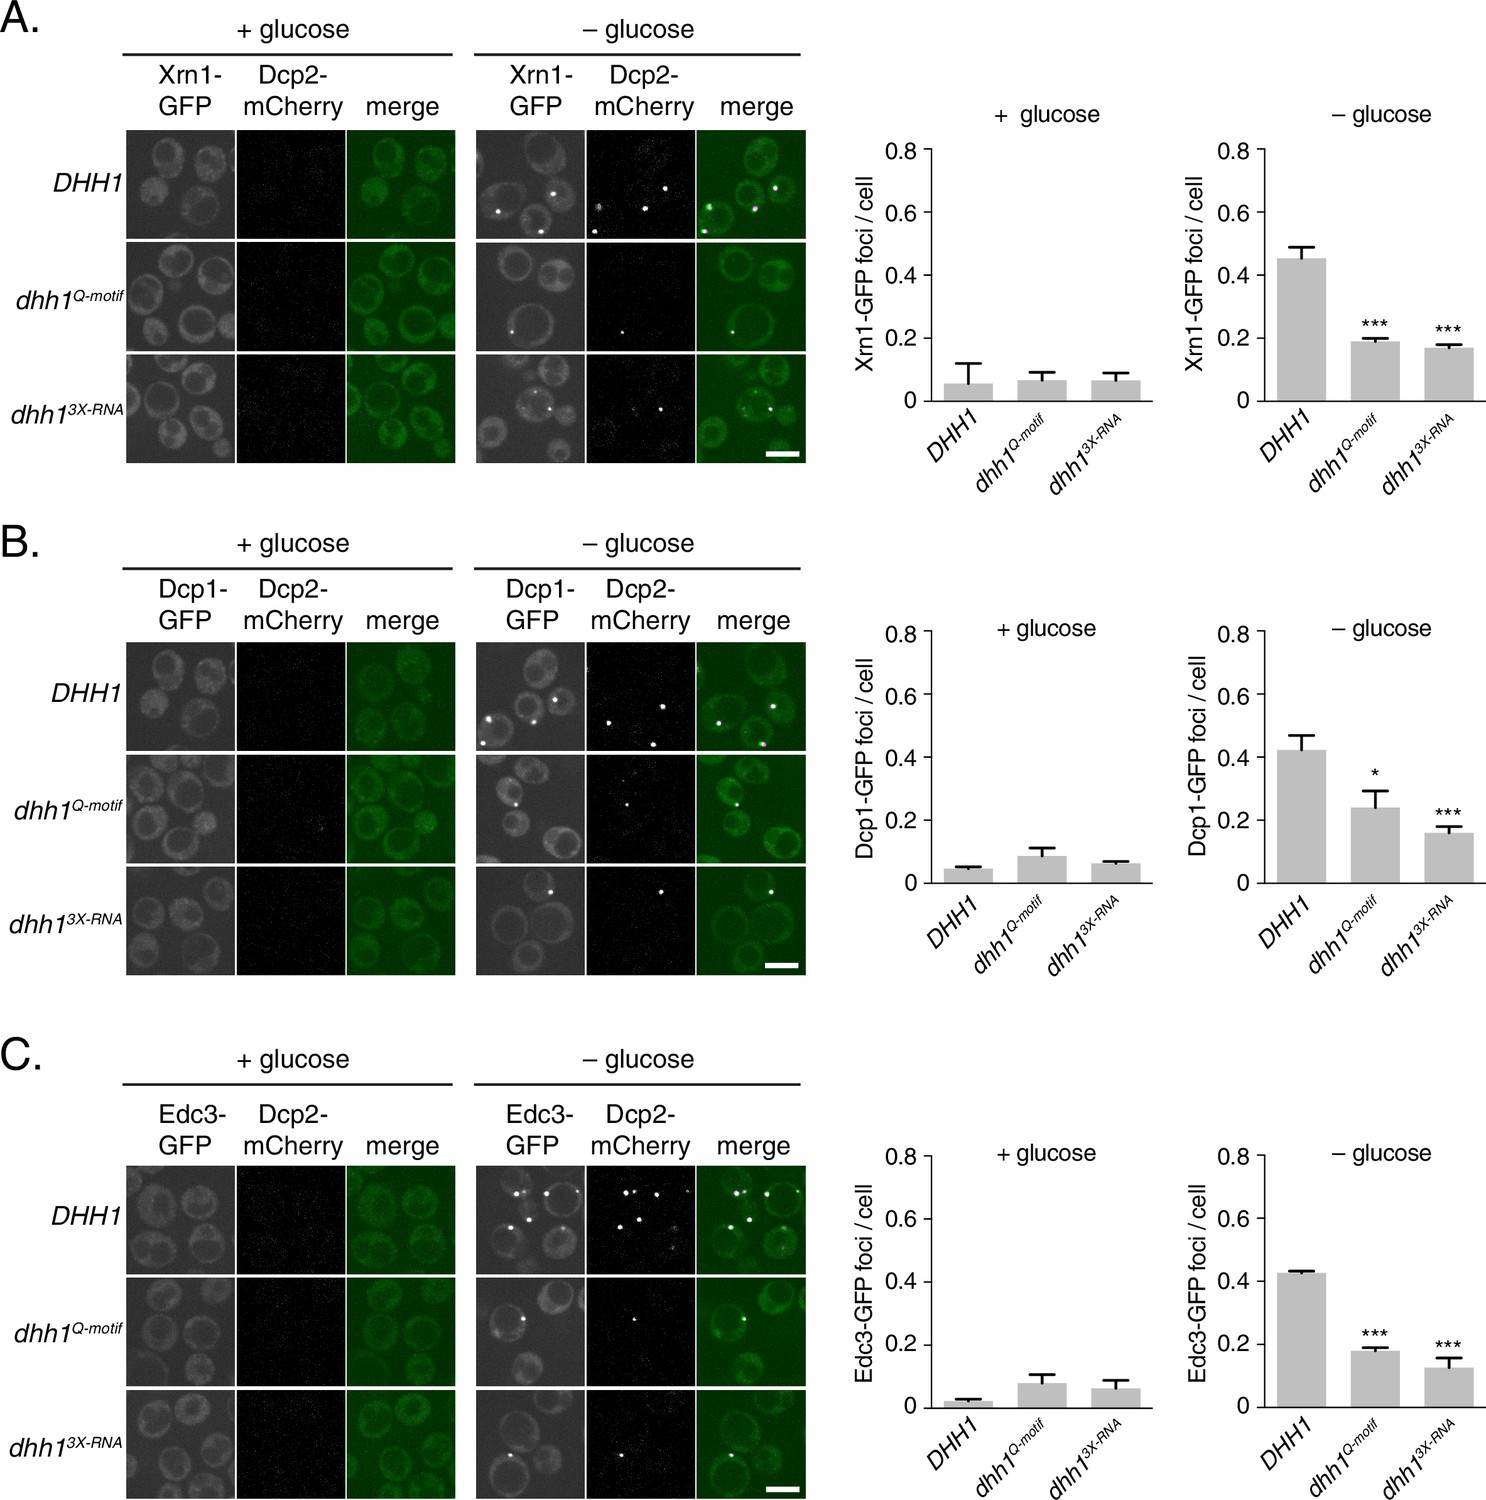
Loss of ATP binding and RNA binding by Dhh1 disrupts PB localization of other PB factors.
Xrn1-GFP (A), Dcp1-GFP (B), or Edc3-GFP (C) was co-expressed in dhh1∆ cells along with pDHH1-TAP, pDHH1Q-motif-TAP, or pDHH13X-RNA-TAP and Dcp2-mCherry as a PB marker and treated as in Figure 2A. A student’s t-test comparing DHH1 and either dhh1Q-motif or dhh13X-RNA is shown. Asterisks indicate p<0.005 (***), or p<0.05 (*). Scale bar: 5 µm.
Figure 2—figure supplement 2
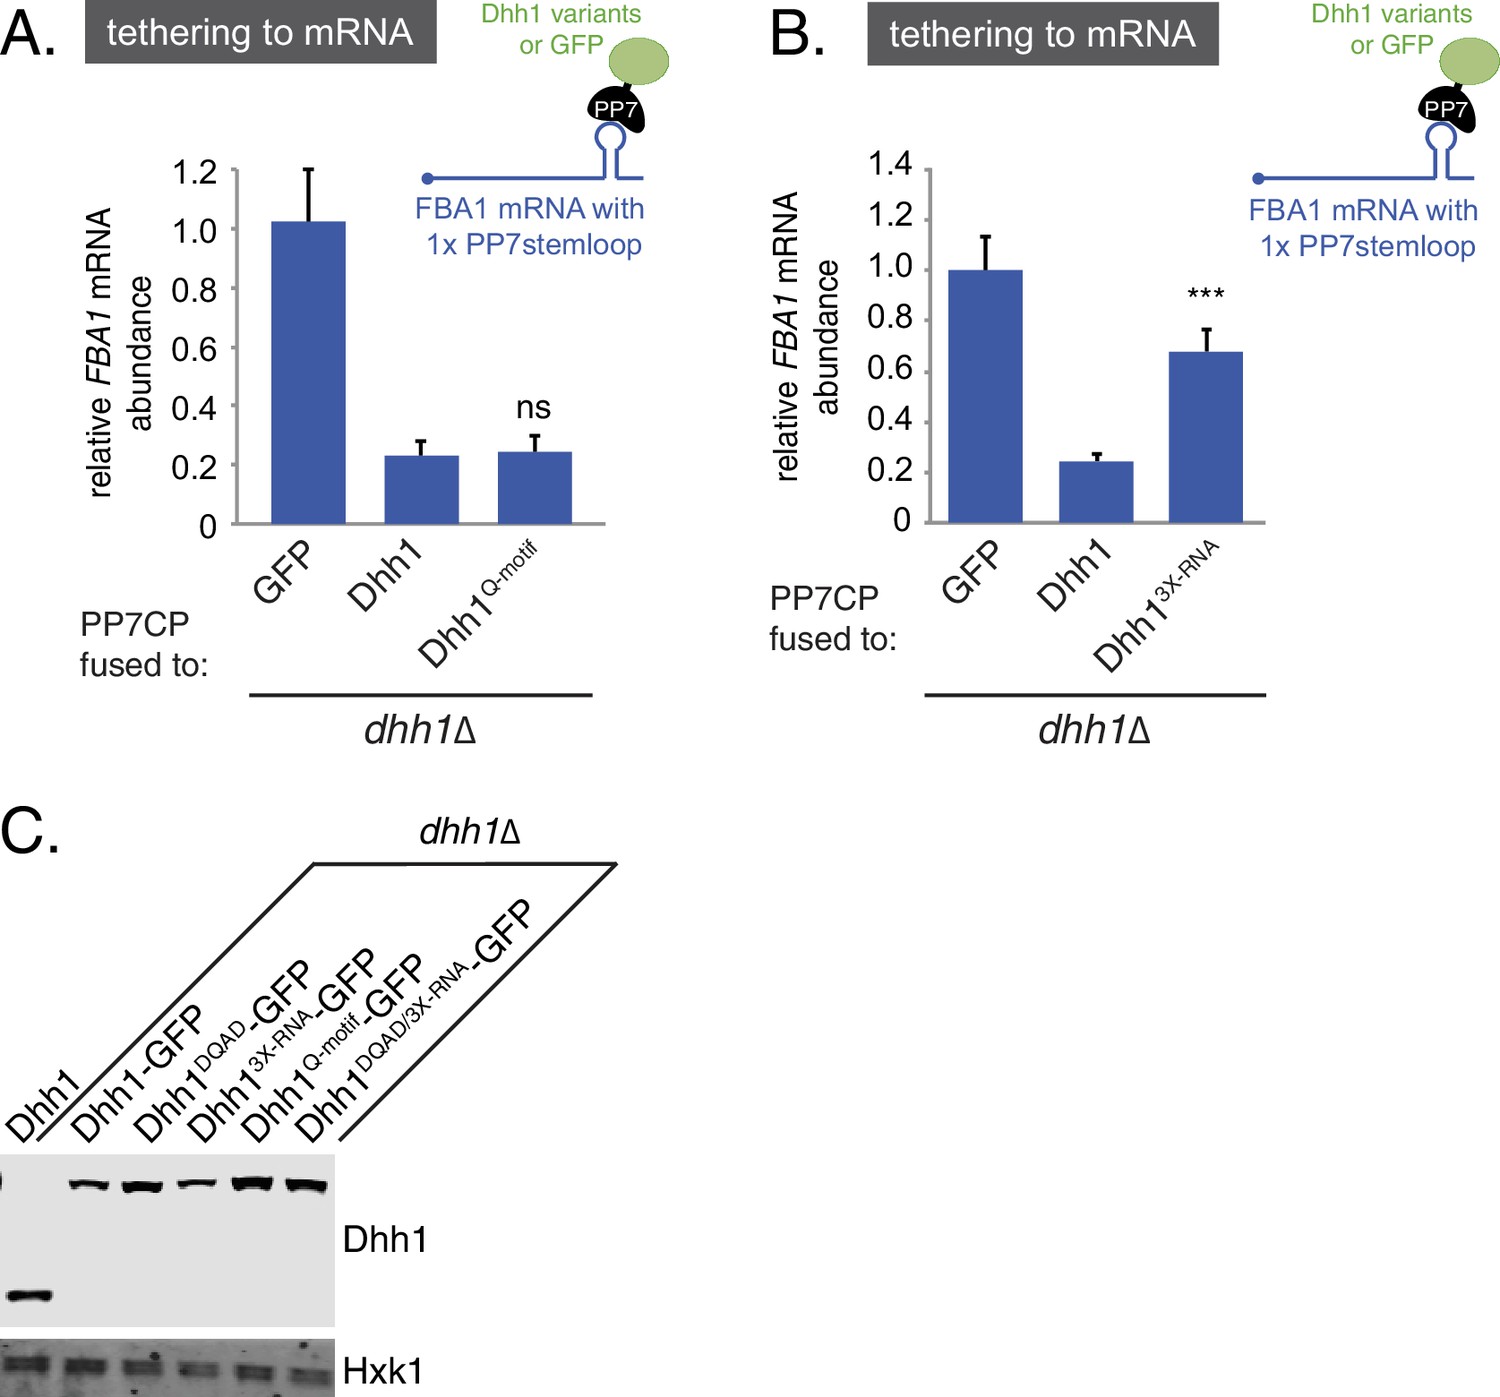
Disruption of RNA-binding, but not ATP-binding, affects the ability of tethered Dhh1 to promote mRNA decay.
(A) Dhh1Q-motif is functional in mRNA decay when tethered to an mRNA. Dhh1 or Dhh1Q-motif was co-expressed as a PP7CP fusion protein in dhh1∆ cells expressing FBA1-PP7L. FBA1 mRNA levels were measured by qPCR and normalized to ACT1 mRNA. Graphs show mean mRNA levels from three independent experiments of biological triplicate samples. Error bars represent SD. A student's t-test comparing Dhh1 and Dhh1Q-motif is shown. (B) Loss of RNA-binding activity disrupts degradation of a Dhh1-tethered mRNA. Dhh1 or Dhh13X-RNA was co-expressed as a PP7CP fusion protein in dhh1∆ cells expressing FBA1-PP7L. FBA1 mRNA levels were measured by qPCR and normalized to ACT1 mRNA. Graphs show mean mRNA levels from three independent experiments of biological triplicate samples. Error bars represent SD. A student’s t-test comparing Dhh1 and Dhh13X-RNA is shown. Asterisks indicate p<0.005. (C) Wild-type and Dhh1 mutant proteins are expressed to similar levels. Western blot of Dhh1 and Dhh1 mutant protein expression from cells in exponential growth phase from Figure 2A and B. Dhh1 was detected using an anti-Dhh1 antibody. Hxk1 was used as a loading control.
Figure 3 with 1 supplement
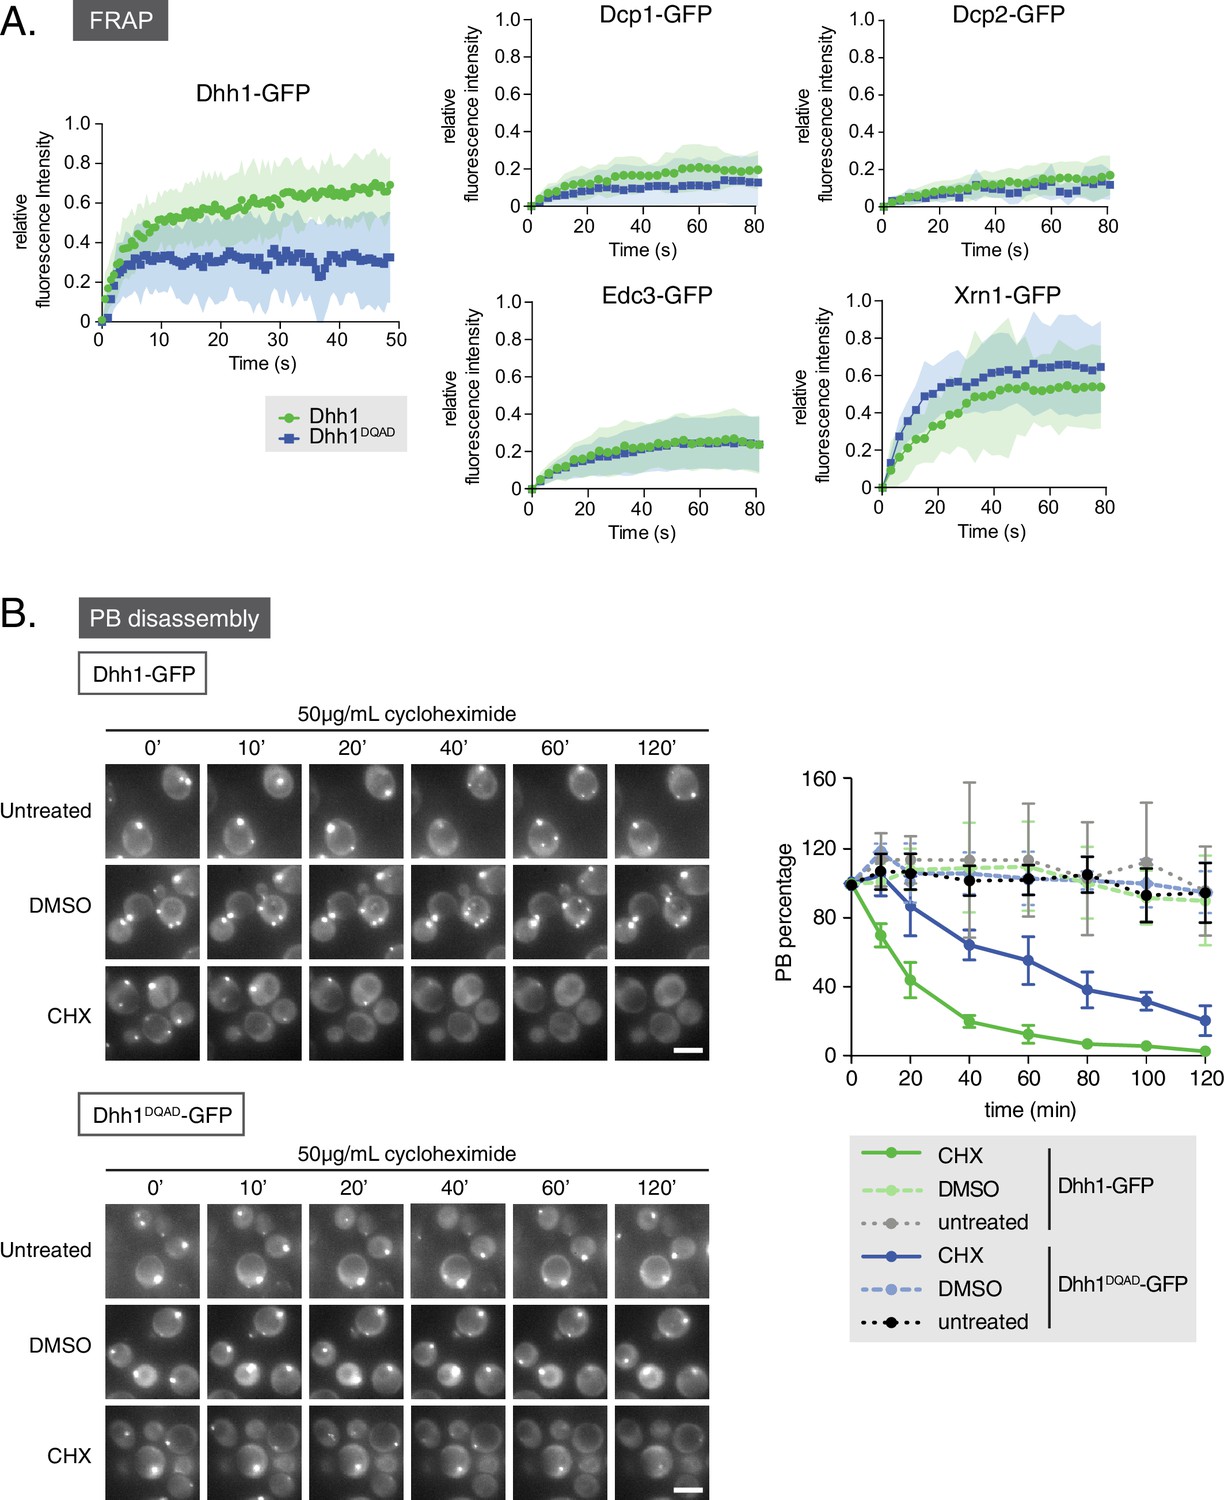
Loss of the ATPase activity of Dhh1 disrupts PB dynamics.
(A) Loss of the ATPase activity of Dhh1 does not alter the dynamics of known PB components. Fluorescence recovery after photobleaching experiments (FRAP) were performed on cells expressing the indicated GFP-tagged PB component. Cells were glucose starved for 20 min to allow PBs to form, then PBs were bleached and recovery of GFP fluorescence to the PB was followed over time. Recovery of PB components is presented as an averaged data plot of FRAP recovery curves from three independent experiments (n > 8 PBs per experiment, typically ~12 PBs per experiment). Error bars represent SD. (B) The ATPase activity of Dhh1 is required for proper PB disassembly. dhh1∆ cells expressing Dhh1-GFP or Dhh1DQAD-GFP were glucose starved for 30 min to allow PBs to form and then treated with either 50 μg/mL cycloheximide or solvent only (DMSO) for 2 hr and disappearance of Dhh1-GFP or Dhh1DQAD-GFP foci per cell was monitored for 2 hr. Each time point image is a maximum-projection of 8 z-stacks at a distance of 0.4 µm. The graph shows foci number per cell measurements for Dhh1 and Dhh1DQAD normalized to 1 to account for differences in PB formation between Dhh1 and Dhh1DQAD (n = 3 biological replicates, >100 cells). Error bars represent SEM. Scale bar: 5 µm.
Figure 3—figure supplement 1

Loss of ATPase activity of Dhh1 disrupts the PB dynamics of other PB components.
(A) Loss of ATPase activity of Dhh1 affects disassembly of Dcp2 foci. Dcp2-mCherry was expressed in dhh1∆ cells co-expressing Dhh1-GFP or Dhh1DQAD-GFP from a plasmid, and cells were glucose starved for 30 min to allow PBs to form, followed by treatment with either 50 μg/mL cycloheximide or solvent only (DMSO) for 2 hr. Disappearance of Dcp2-mCherry foci over time is monitored (n = 3 biological replicates). Each time point image is a maximum-projection of 8 z-stacks at a distance of 0.4 µm. Scale bar: 5 µm (B) Two-hour cycloheximide treatment does not disrupt cell viability. The indicated cells were glucose starved for 30 min, and then treated with or without 50 μg/mL cycloheximide and 5-fold serial dilutions were plated on SD (-URA) + 2% dextrose media.
Figure 4 with 2 supplements
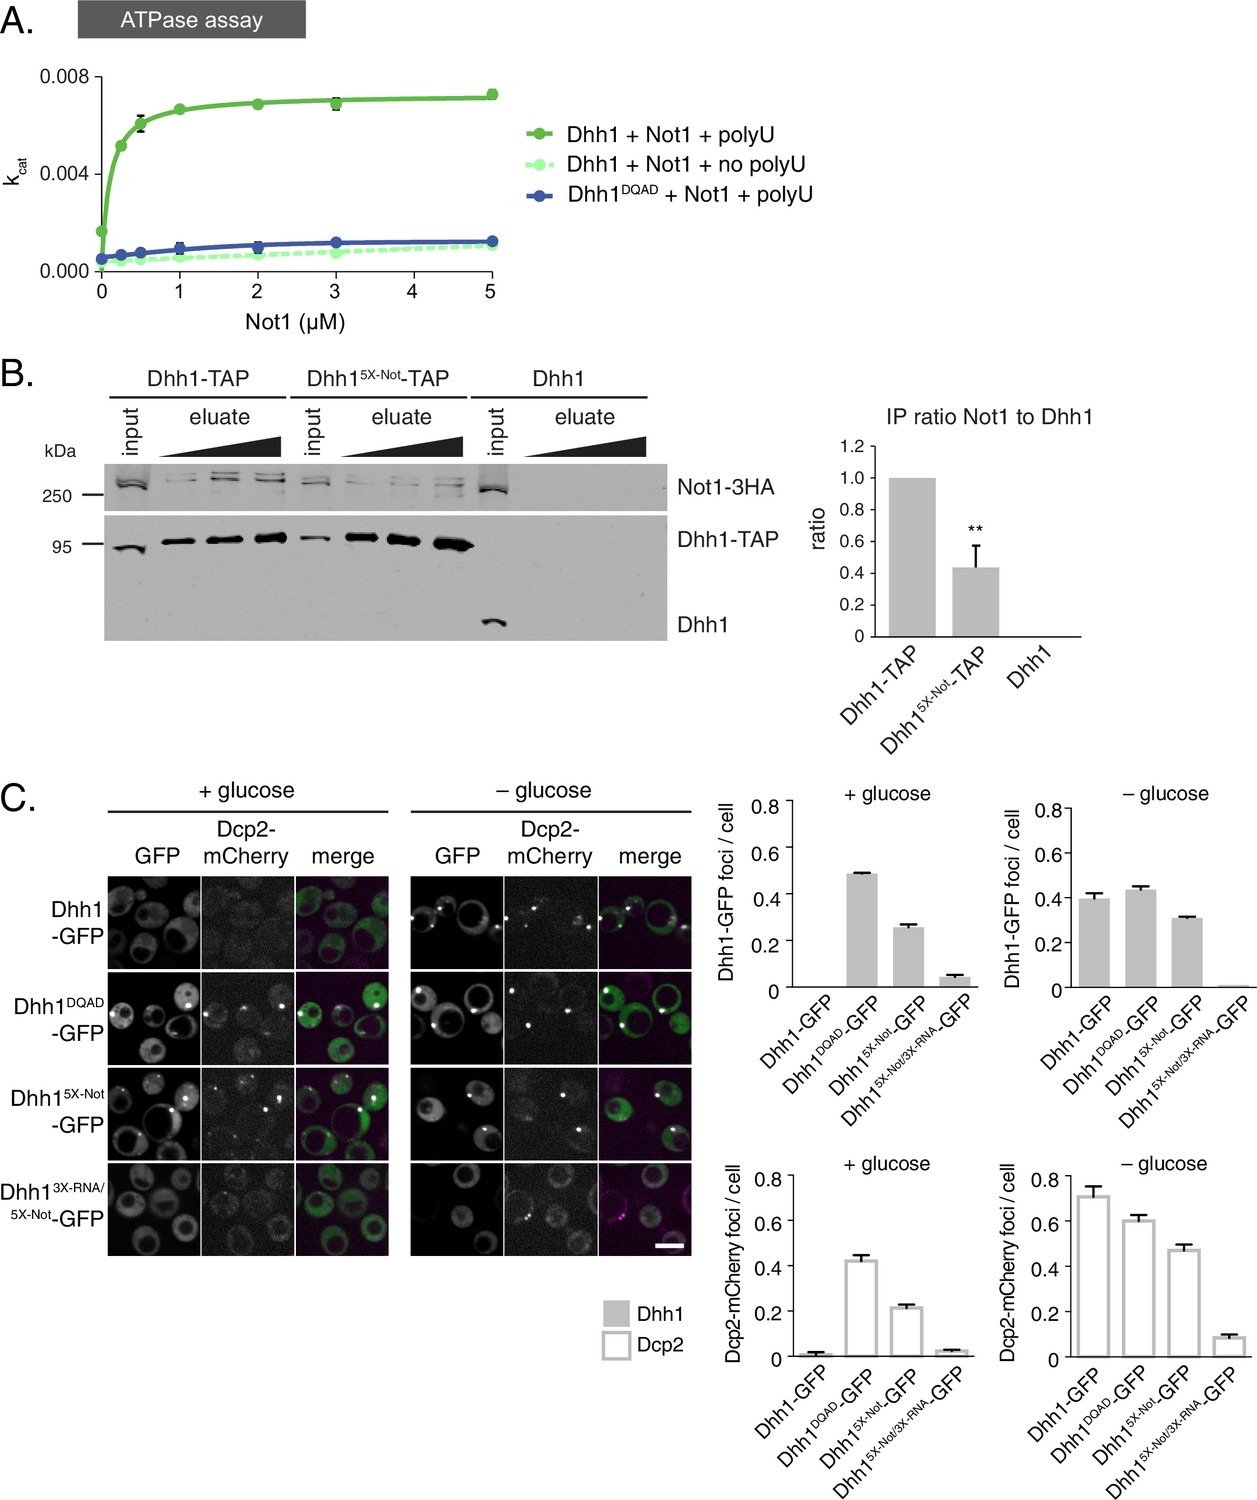
The ATPase activity of Dhh1 is stimulated in vitro and in vivo by Not1.
(A) ATPase activity of Dhh1 is stimulated by Not1. The ATPase activity of full-length Dhh1 or Dhh1DQAD was measured with increasing concentrations of Not1MIF4G. Graphs represent average ATPase activity (n=3). Error bars represent SD. (B) Disruption of Dhh1 interaction with the MIF4G region of Not1 by mutation of conserved residues in Dhh1. TAP-tagged Dhh1, Dhh15X-Not, or untagged Dhh1 were purified from cells in exponential growth phase using IgG-coupled magnetic beads and co-purifying Not1-3HA was detected by Western blot. Quantification of Not1 to Dhh1 ratio is plotted with SEM (n=5 biological replicates). A representative Western blot is shown. A student’s t-test comparing Dhh1 and Dhh15X-Not is shown. Asterisks indicate p<0.01. (C) Mutations in the Not1-binding surface of Dhh1 trigger constitutive PB assembly. Wild-type or mutant Dhh1 was co-expressed from a plasmid as a GFP fusion protein in dhh1∆ cells along with Dcp2-mCherry as a PB marker and grown to exponential growth phase, then shifted to either glucose-rich or glucose starvation conditions for 20 min and observed by confocal microscopy. Images were also acquired using wide-field microscopy and PB formation was quantified using Diatrack 3.5 particle tracking software. Graphs represent the average Dhh1-GFP foci or Dcp2-mCherry foci number per cell (n=3 biological replicates, >800 cells per experiment). Error bars represent SD. Scale bar: 5 µm.
Figure 4—figure supplement 1

Not1 is a specific activator of the ATPase activity of Dhh1.
(A) ATPase activity of Dhh1 is weakly stimulated by RNA. ATPase activity of full-length Dhh1 was measured with increasing concentrations of polyU RNA. Graphs represent average ATPase activity (n=3 biological replicates). Error bars represent SD.(B) Not1 is a specific activator of Dhh1. ATPase activity of full-length Dhh1 or Dbp5 was measured in the presence of the indicated protein. Graphs represent average ATPase activity (n=3 biological replicates). Error bars represent SD. (C) Not1 binding is diminished in a ATP-binding mutant of Dhh1. TAP-tagged Dhh1 or Dhh1Q-motif were purified from cells in exponential growth phase using IgG-coupled magnetic beads and co-purifying Not1-3HA was detected by Western blot. Quantification of Not1 to Dhh1 ratio is plotted with SEM (n=4 biological replicates). A representative Western blot is shown. A student’s t-test comparing Dhh1 and Dhh1Q-motif is shown. Asterisks indicate p<0.01. (D–F) Known PB components localize to Dhh15X-Not foci. Xrn1-GFP (D), Dcp1-GFP (E), or Edc3-GFP (F) was co-expressed in DHH1 or dhh15X-Notcells, along with Dcp2-mCherry as a PB marker. Cells were grown to exponential growth phase, then shifted to glucose-rich or glucose starvation conditions for 20 min and observed by confocal microscopy. Images were also acquired using wide-field microscopy and PB formation was quantified using Diatrack 3.5 particle tracking software. Graphs represent the average foci number per cell (n = 3 biological replicates, >800 cells per experiment). Error bars represent SD. Scale bar: 5 μm.
Figure 4—figure supplement 2
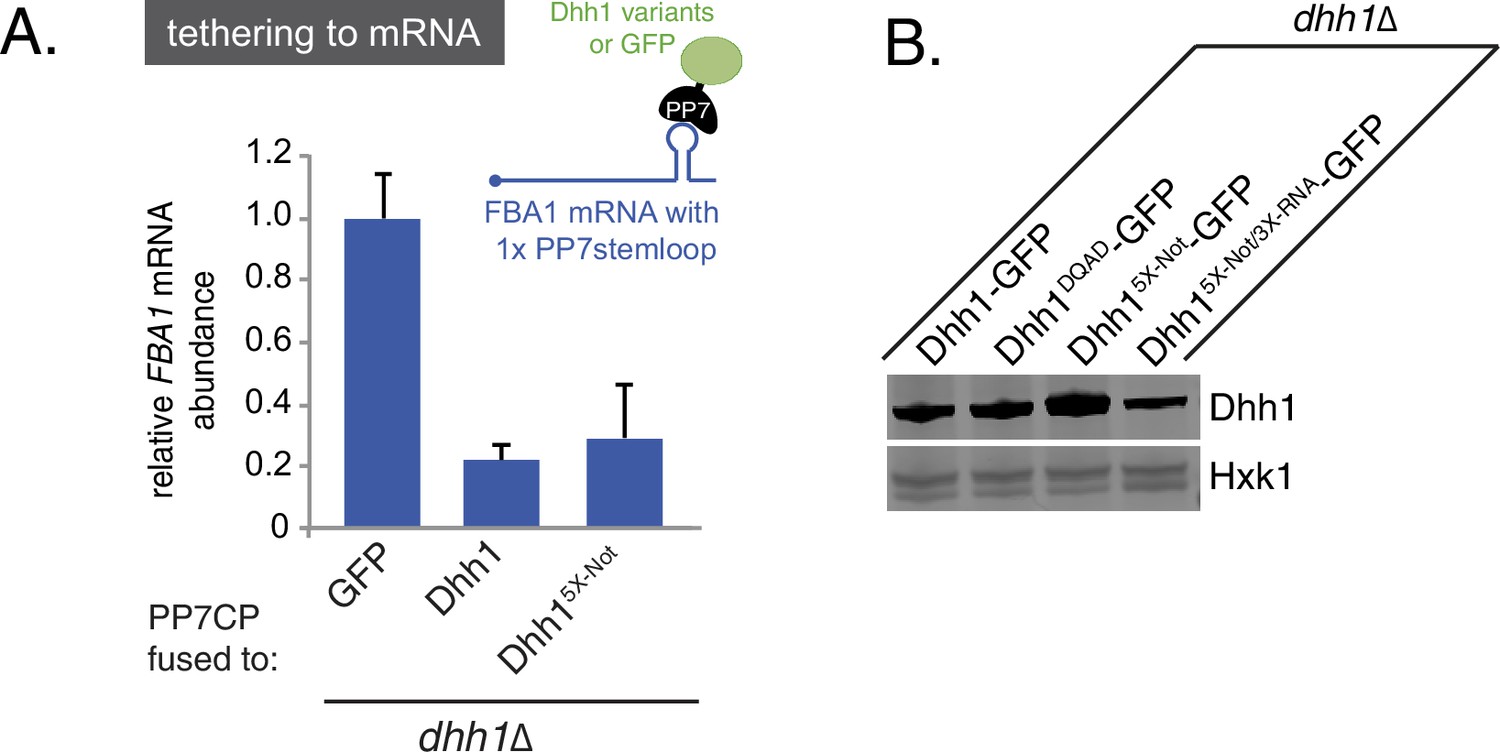
Tethered Dhh1 does not require ATPase activation by Not1 to promote mRNA decay.
(A) Dhh15X-Not does not show a significant defect in mRNA decay when tethered to an mRNA. Dhh1 or Dhh15X-Not was co-expressed as a PP7CP fusion protein in dhh1∆ cells expressing FBA1-PP7L. FBA1 levels were measured by qPCR and normalized to ACT1 mRNA. Graphs show mean mRNA levels from three independent experiments of biological triplicate samples. Error bars represent SD. (B) Wild-type and Dhh1 mutant proteins are expressed to similar levels. Western blot of Dhh1 and Dhh1 mutant protein expression from cells in exponential growth phase. Dhh1 was detected using an anti-GFP antibody. Hxk1 was used as a loading control.
Figure 5 with 1 supplement
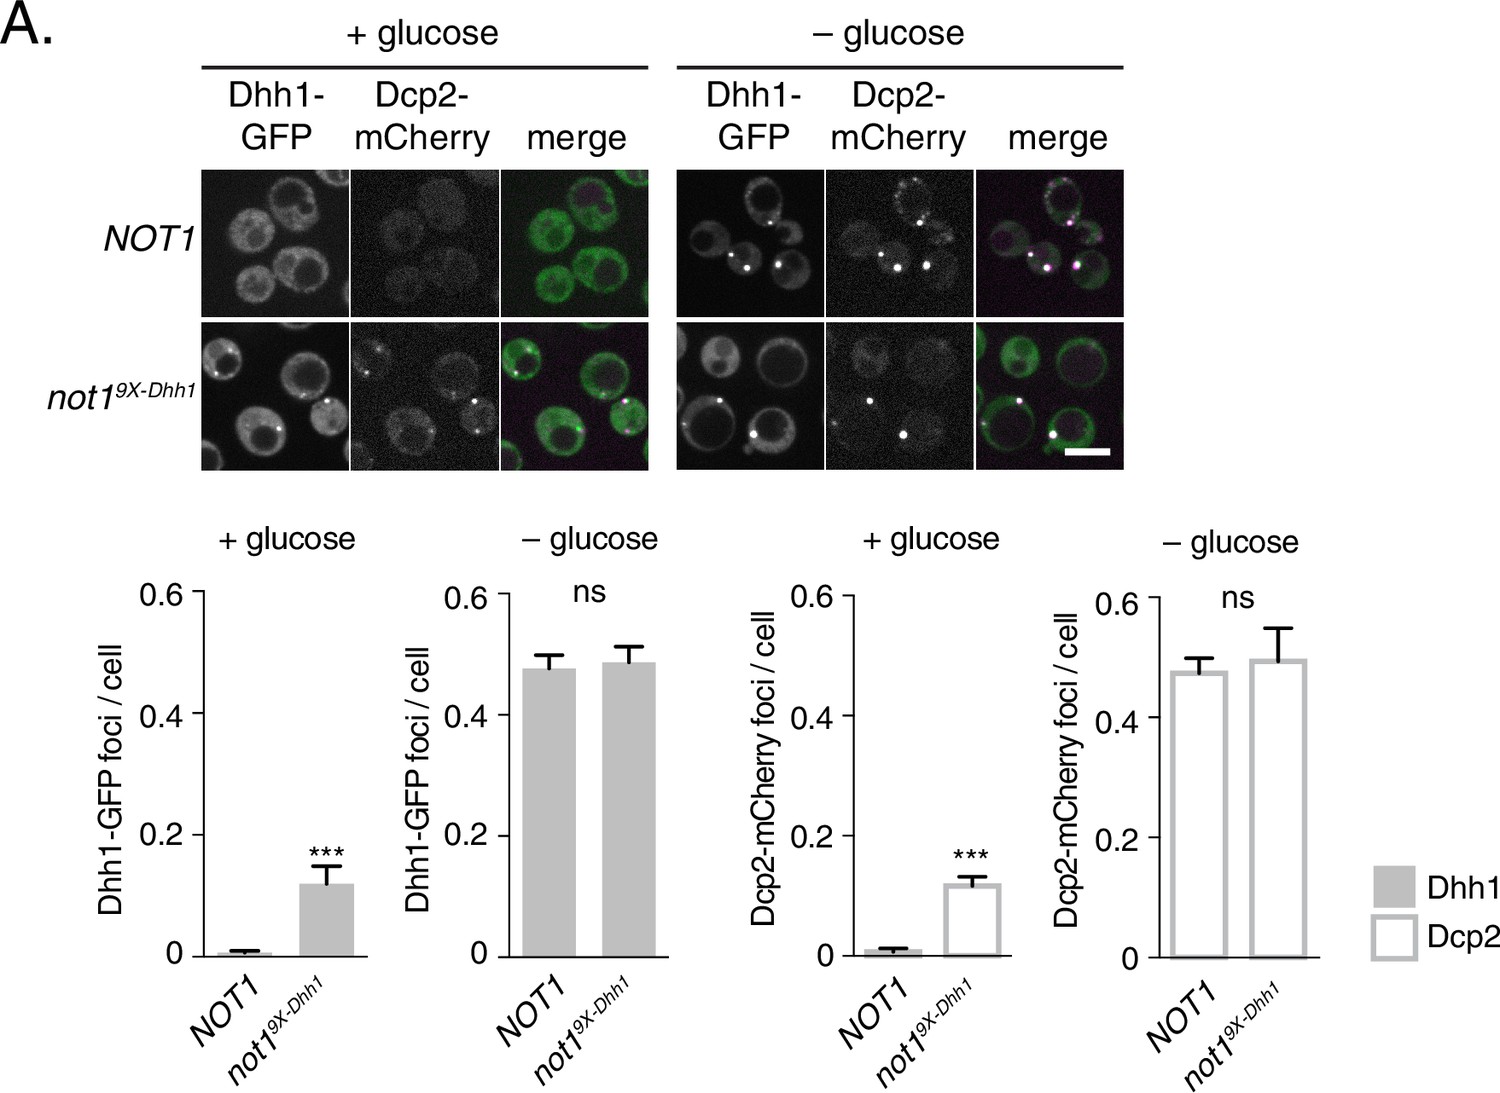
Mutations in Dhh1-binding surface of Not1 trigger constitutive PB assembly.
Not1 or Not19X-Dhh1 was co-expressed with Dhh1-GFP and Dcp2-mCherry and grown to exponential growth phase, then shifted to either glucose-rich or glucose starvation conditions for 20 min and observed by confocal microscopy. Images were also acquired using wide-field microscopy and PB formation was quantified using Diatrack 3.5 particle tracking software (see Materials and methods). Graphs represent average Dhh1-GFP foci or Dcp2-mCherry foci number per cell (n=3 biological replicates, >800 cells per experiment). Error bars represent SD. Scale bar: 5 µm.
Figure 5—figure supplement 1
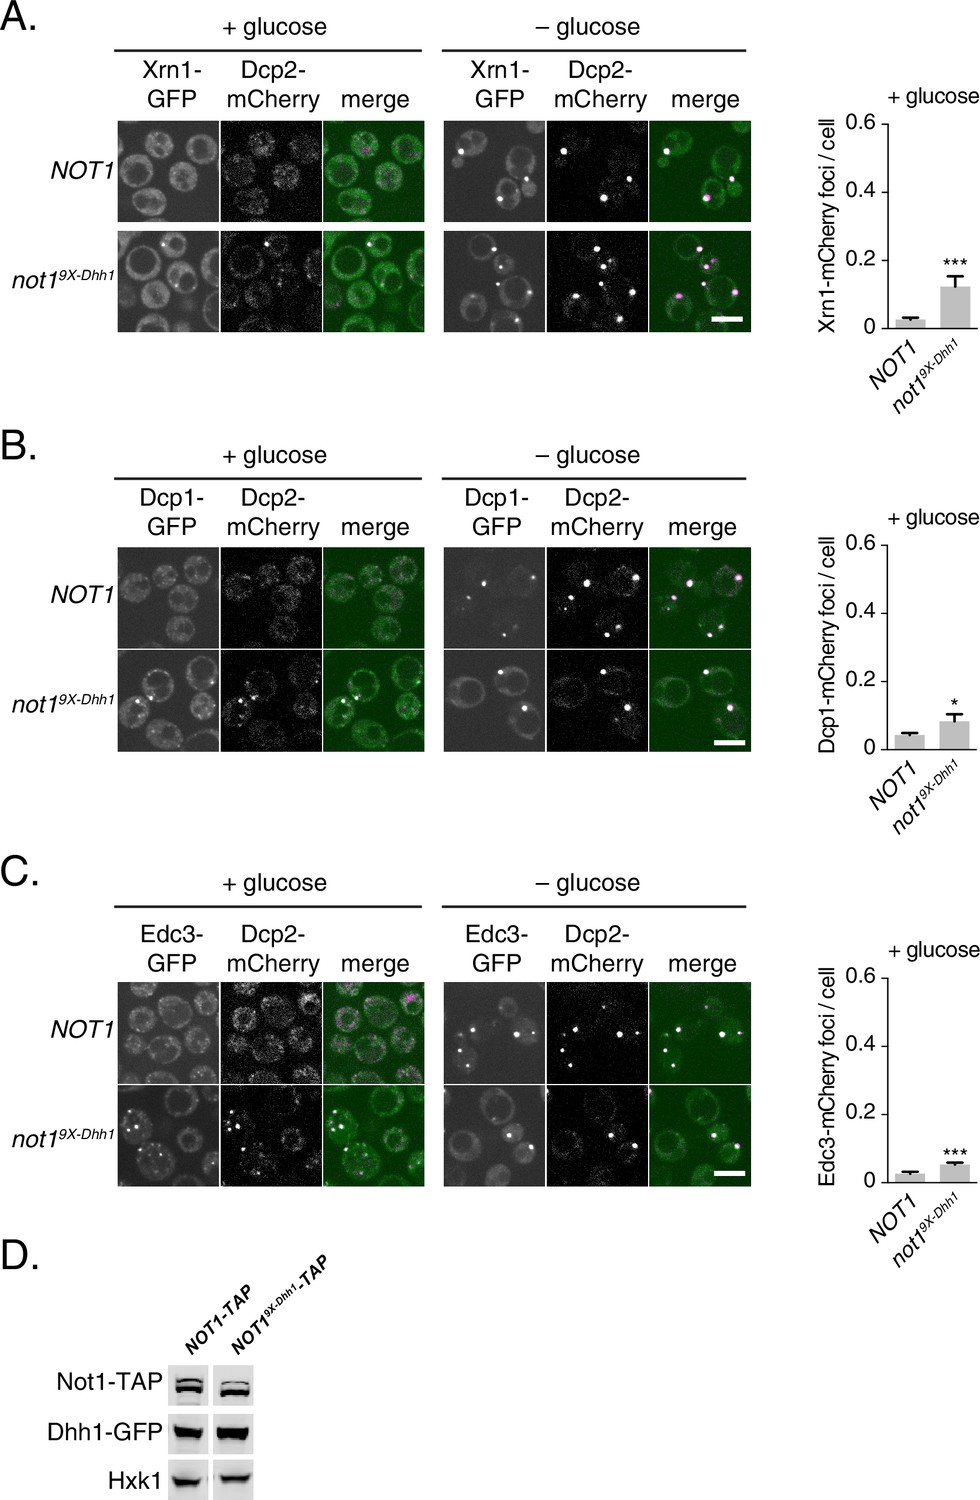
Not19X-Dhh1 triggers PB assembly.
(A–C) Known PB components localize to Not19X-Dhh1 foci. Xrn1-GFP (A), Dcp1-GFP (B), or Edc3-GFP (C) was co-expressed in NOT1, or not19X-Dhh1cells, along with Dcp2-mCherry as a PB marker. Cells were grown to exponential growth phase, then shifted to glucose-rich or glucose starvation conditions for 20 min and observed by confocal microscopy. Images were also acquired using wide-field microscopy and PB formation was quantified using Diatrack 3.5 particle tracking software. Graphs represent average foci number per cell (n=3 biological replicates, >800 cells per experiment). Error bars represent SD. A student's t-test comparing localization between Not1 and Not19x-Dhh1 is shown. Asterisks indicate p<0.005 (***), or p<0.05 (*). Scale bar: 5 μm (D) Not19X-Dhh1 mutant is expressed to wild-type Not1 levels. Western blot of Not1 or Not19X-Dhh1 mutant protein expression from cells in exponential growth phase. Not1 was detected using Rabbit IgG, and Dhh1 was detected using an anti-Dhh1 antibody. Hxk1 was used as a loading control.
Figure 6 with 1 supplement
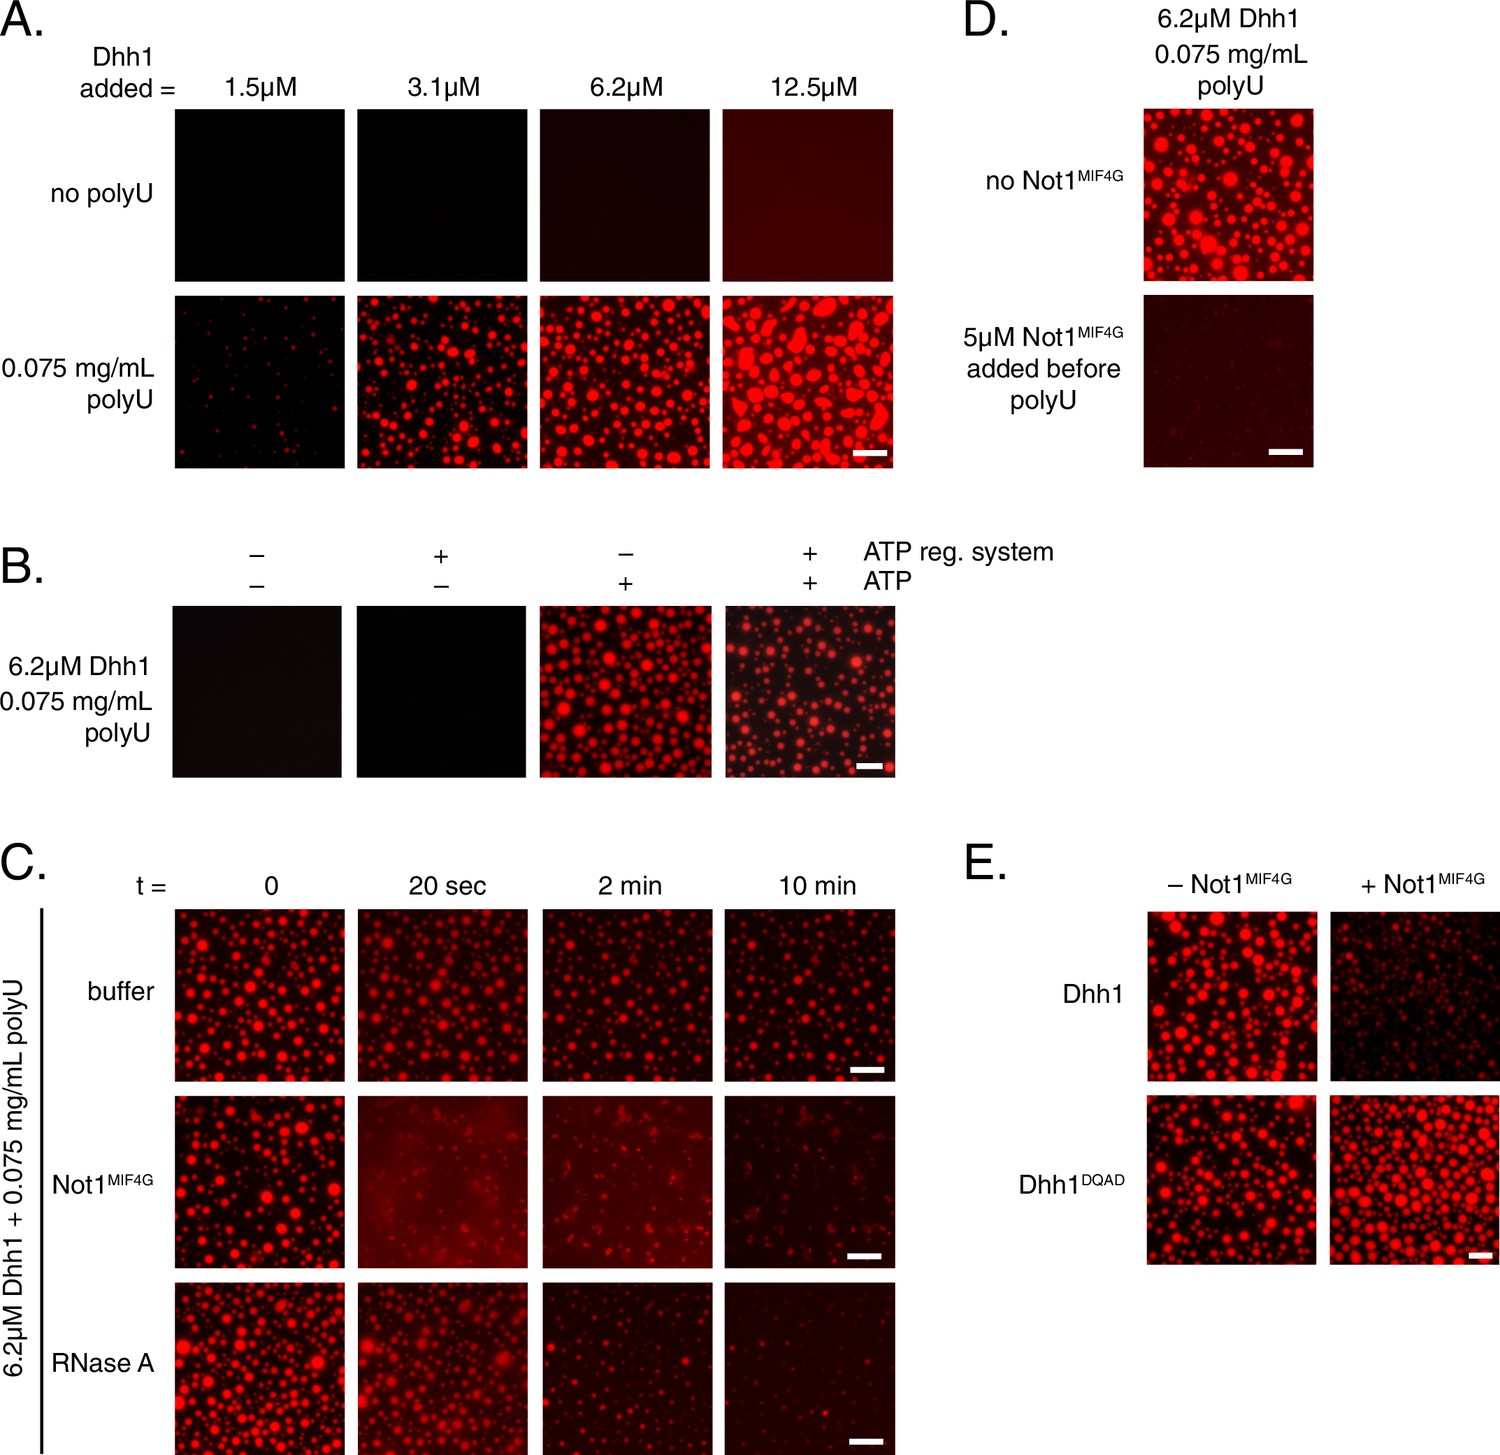
Dhh1 PB dynamics can be recapitulated in vitro.
(A) Formation of liquid Dhh1-droplets depends on the presence of the RNA analog polyuridylic acid (polyU) and increases with increasing protein concentration. Recombinant mCherry-tagged Dhh1 was diluted into a low salt buffer and incubated at 4°C for 1 hr. Formation of liquid droplets was observed by fluorescence microscopy. Scale bar: 10 μm. (B) Dhh1 liquid droplet formation requires ATP. Dhh1 liquid droplets were formed as in (A), in the presence or absence of ATP and the creatine kinase ATP regeneration system. Scale bar: 20 μm. (C) Addition of Not1MIF4G or RNase A, but not buffer alone, dissolves pre-formed Dhh1 liquid droplets. Dhh1 liquid droplets were pre-formed for 20 min at 4°C, followed by the addition of 5 µM Not1MIF4G or RNase A. Scale bar: 10 μm. (D, E) Pre-incubation with Not1MIF4Gprevents formation of Dhh1, but not Dhh1DQAD liquid droplets. Reactions were imaged after 1h incubation at 4°C. Scale bar: 10 μm.
Figure 6—figure supplement 1
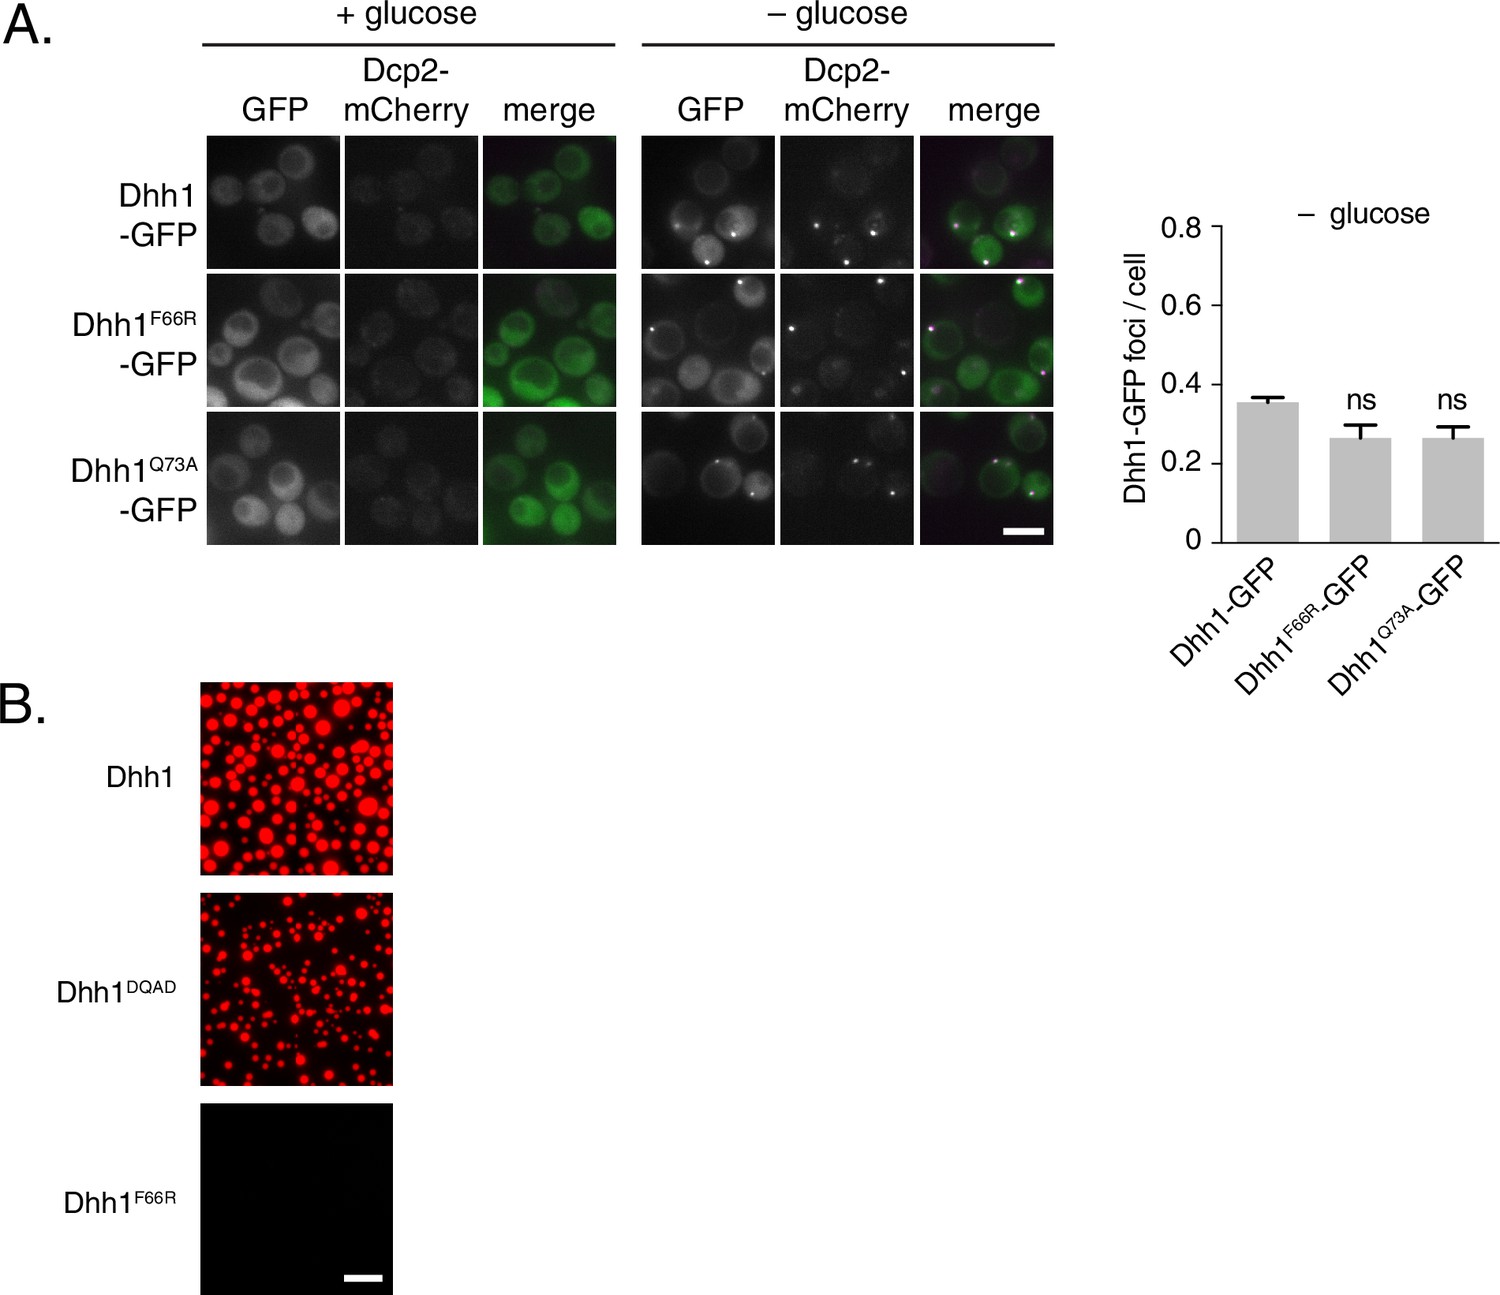
Single point mutants in the ATP binding site of Dhh1 affect PB assembly and liquid droplet formation.
(A) Single mutations in the Q-motif of Dhh1 show minor defects in PB formation. Wild-type Dhh1, Dhh1F66R or Dhh1Q73A were expressed from a plasmid as a GFP fusion protein in dhh1∆ cells along with Dcp2-mCherry as a PB marker and grown to exponential growth phase, then shifted to either glucose-rich or glucose starvation conditions for 20 min and observed by wide-field microscopy. PB formation was quantified using Diatrack 3.5 particle tracking software. Graphs represent average Dhh1-GFP or Dcp2-mCherry foci number per cell (n=3 biological replicates, >300 cells per experiment). Error bars represent SD. A student’s t-test comparing Dhh1F66R or Dhh1Q73A with Dhh1 is shown. Scale bar: 5 µm (B) Dhh1 liquid droplet formation requires ATP binding. Recombinant mCherry-tagged Dhh1, Dhh1DQAD or Dhh1F66R were diluted into a low salt buffer and incubated at 4°C for 1 hr in the presence of ATP and 0.075 mg/mL polyU. Formation of liquid droplets was observed by fluorescence microscopy. Scale bar: 10 μm
Figure 7
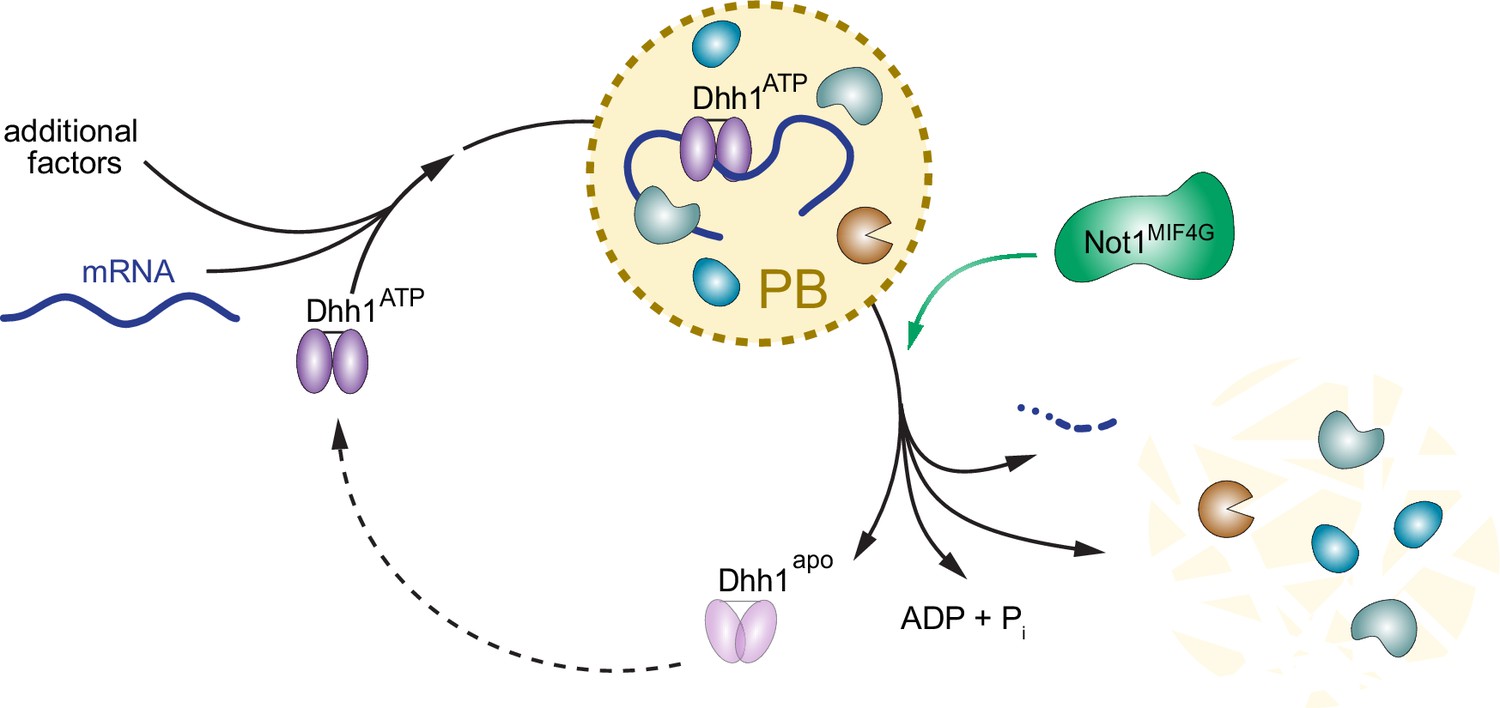
Model: The ATPase cycle of Dhh1 controls PB assembly and disassembly.
An ATP- and RNA-bound conformation of Dhh1 nucleates PB formation, while stimulation of Dhh1’s ATPase activity by Not1 promotes granule disassembly.
Videos
Video 1
Cycloheximide treatment causes wild-type PB disassembly.
dhh1∆ cells expressing Dhh1-GFP from a plasmid were glucose starved for 30 min to allow PBs to form, and were then treated with 50 µg/mL cycloheximide and disappearance of Dhh1-GFP foci was monitored (5 min intervals; movie played at 5 fps). Each frame represents a maximum-projection of 8 z-stacks at a distance of 0.4 µm.
Video 2
DMSO treatment does not trigger wild-type PB disassembly.
dhh1∆ cells expressing Dhh1-GFP from a plasmid were glucose starved for 30 min to allow PBs to form, and were then mock treated with DMSO and disappearance of Dhh1-GFP foci was monitored (5 min intervals; movie played at 5 fps). Each frame represents a maximum-projection of 8 z-stacks at a distance of 0.4 µm.
Video 3
Dhh1DQAD PBs disassemble more slowly than wild-type PBs following cycloheximide treatment.
dhh1∆ cells expressing Dhh1DQAD-GFP from a plasmid were glucose starved for 30 min to allow PBs to form, and were then treated with 50 µg/mL cycloheximide and disappearance of Dhh1DQAD-GFP foci was monitored (5 min intervals; movie played at 5 fps). Each frame represents a maximum projection of 8 z-stacks at a distance of 0.4 µm.
Video 4
DMSO treatment does not trigger Dhh1DQAD PB disassembly.
dhh1∆ cells expressing Dhh1DQAD-GFP from a plasmid were glucose starved for 30 min to allow PBs to form, and were then mock treated with DMSO and disappearance of Dhh1DQAD-GFP foci was monitored (5 min intervals; movie played at 5 fps). Each frame represents a maximum projection of 8 z-stacks at a distance of 0.4 µm.
Video 5
Purified Dhh1, ATP, and RNA form liquid-like droplets in vitro.
Droplets were formed for 2 min with 6.25 µM Dhh1-mCherry and 0.075 mg/mL polyU in a final volume of 20 µL and imaged live in a time course (5 s intervals; movie played at 7 fps). Fusion events can be observed that lead to rounding up of the new droplet to assume a spherical shape.
Video 6
RNase A treatment dissolves Dhh1 liquid droplets.
Droplets were formed for 20 min from 6.25 µM Dhh1-mCherry and 0.075 mg/mL polyU in a final volume of 20 µL. The imaging time course started (10 s intervals; movie played at 3 fps). After few frames, RNase A was added (1.5 µL of a 0.04 µg/mL stock solution, which was prepared by dilution of a 10 mg/mL stock solution in Not1MIF4G storage buffer) to the pre-formed Dhh1 droplets.
Video 7
Addition of Not1MIF4G storage buffer does not affect Dhh1 liquid droplet formation.
Droplets were formed for 20 min from 6.25 µM Dhh1-mCherry and 0.075 mg/mL polyU in a final volume of 20 µL. The imaging time course was started (10 s intervals; movie played at 3 fps). After a few frames, 1.5 µL Not1MIF4G storage buffer was added to the pre-formed Dhh1 droplets.
Video 8
Addition of Not1MIF4G dissolves Dhh1 liquid droplets.
Droplets were formed for 20 min with 6.25 µM Dhh1-mCherry and 0.075 mg/mL polyU in a final volume of 20 µL. The imaging time course was started (10 s intervals; movie played at 3 fps). After a few frames, Not1MIF4G (1.5 µl of a 150 µM stock solution) was added to the pre-formed Dhh1 droplets.
Additional files
-
Supplementary file 1
List of yeast strains used in this study.
- https://doi.org/10.7554/eLife.18746.026
-
Supplementary file 2
List of plasmids and oligonucleotides used in this study.
(A) List of plasmids used in this study. (B) List of oligos used in this study. Bold text denotes region of homology between genome and oligonucleotide. Italicized text denotes homology between plasmid and oligonucleotide. (C) List of Dhh1 and Not1 mutants used in this study.
- https://doi.org/10.7554/eLife.18746.027
-
Supplementray file 3
List of Cal Fluor Red 590 labeled oligos used for smFISH.
- https://doi.org/10.7554/eLife.18746.028
Download links
A two-part list of links to download the article, or parts of the article, in various formats.
Downloads (link to download the article as PDF)
Open citations (links to open the citations from this article in various online reference manager services)
Cite this article (links to download the citations from this article in formats compatible with various reference manager tools)
ATPase activity of the DEAD-box protein Dhh1 controls processing body formation
eLife 5:e18746.
https://doi.org/10.7554/eLife.18746


