An evidence based hypothesis on the existence of two pathways of mitochondrial crista formation
- Max Planck Institute of Biochemistry, Germany
- Ludwig-Maximilians-Universität München, Germany
- Universität Bayreuth, Germany
- Universiteit Utrecht, Netherlands
- University of Groningen, Netherlands
- Biomedical Center, Ludwig-Maximilians Universität München, Germany
Figures
Figure 1
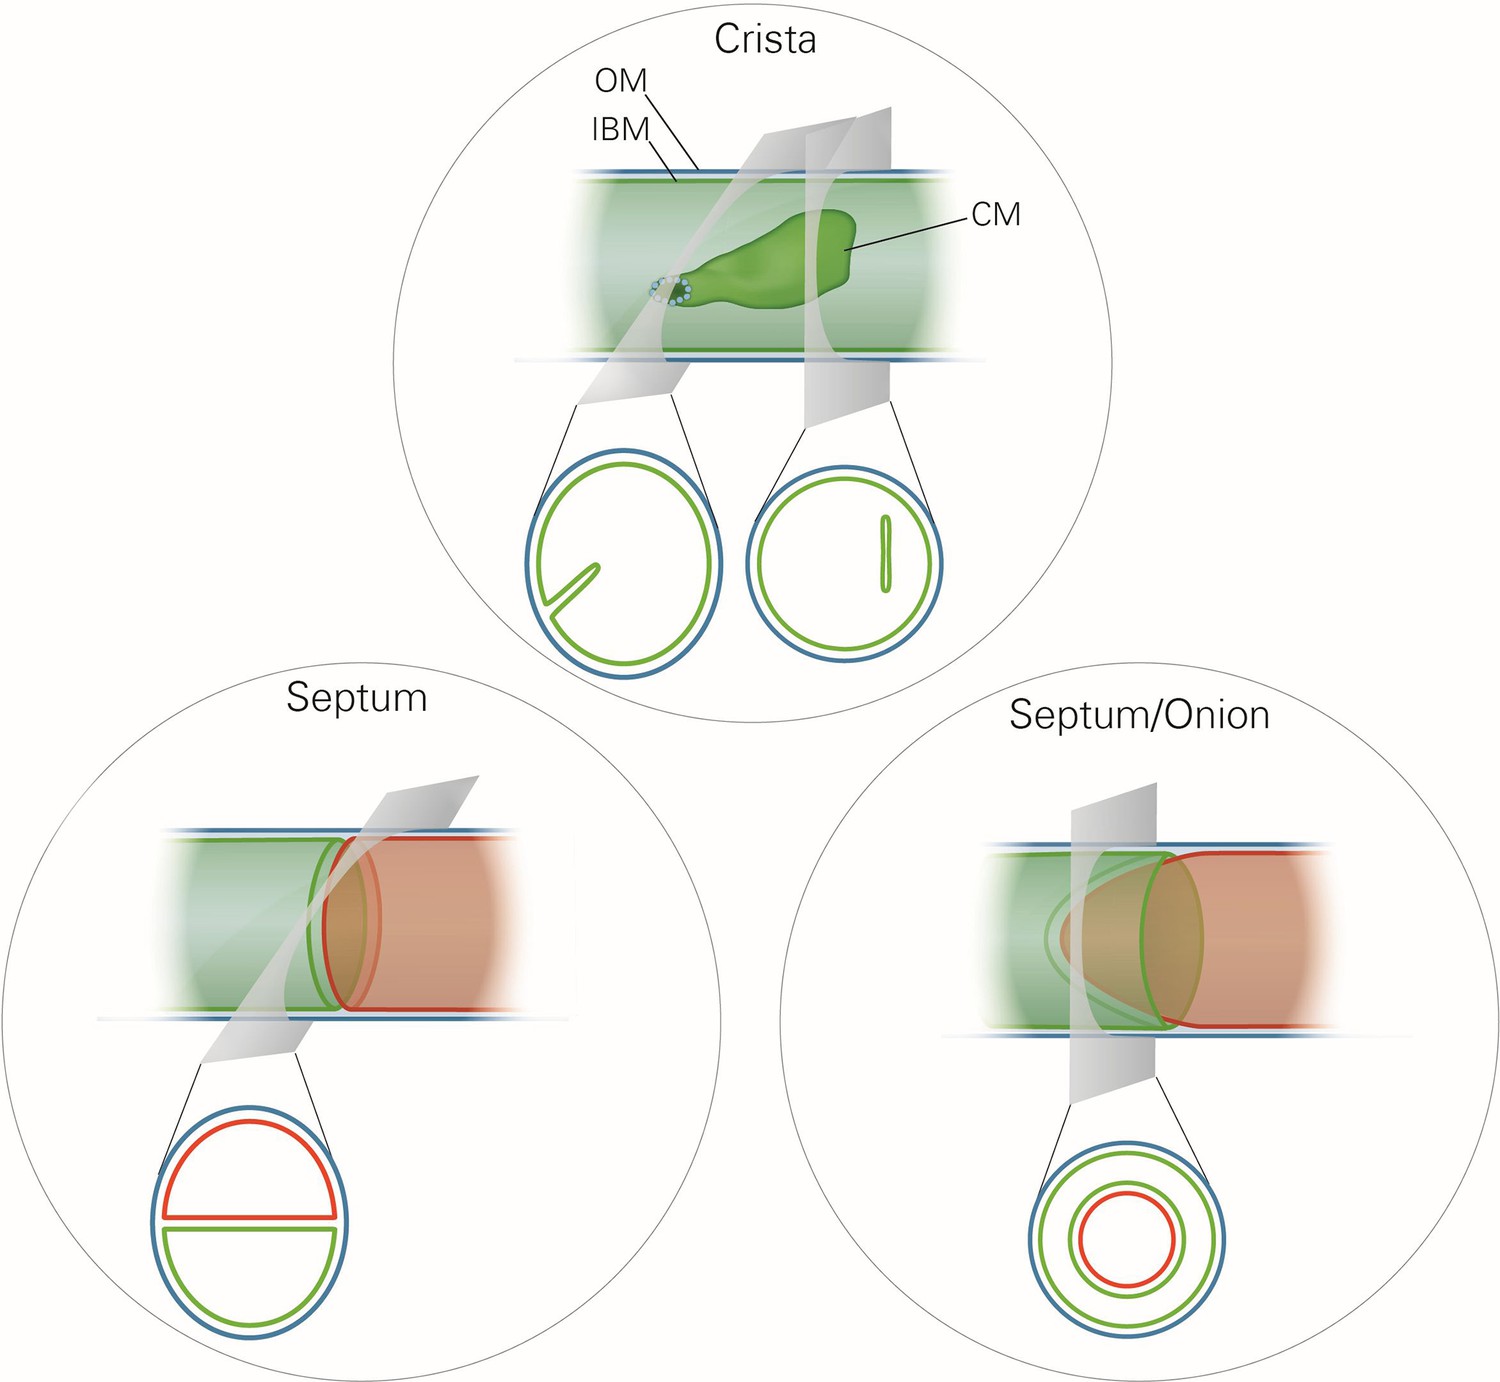
Schematic representation of the ultrastructure of the mitochondria.
Upper panel, a wild type mitochondrion containing a crista. Lower left panel, a mitochondrion containing a septum. A septum separates the matrix into two discontinuous subcompartments. Lower right panel, a mitochondrion containing an extended curved septum, appearing as an onion-like profile in EM. The drawings illustrate the reconstruction of the 3D structures from the 2D EM sections whose directions are indicated by the grey planes. Blue line, outer membrane (OM); green line, inner membrane (inner boundary membrane (IBM), crista membrane (CM) and septa membranes); small light rings, assembled MICOS complex forming a crista junction. In the lower panels, the inner boundary membranes of two matrix subcompartments are drawn in red and green to point out that the matrix is divided by a septum.
Figure 2 with 4 supplements
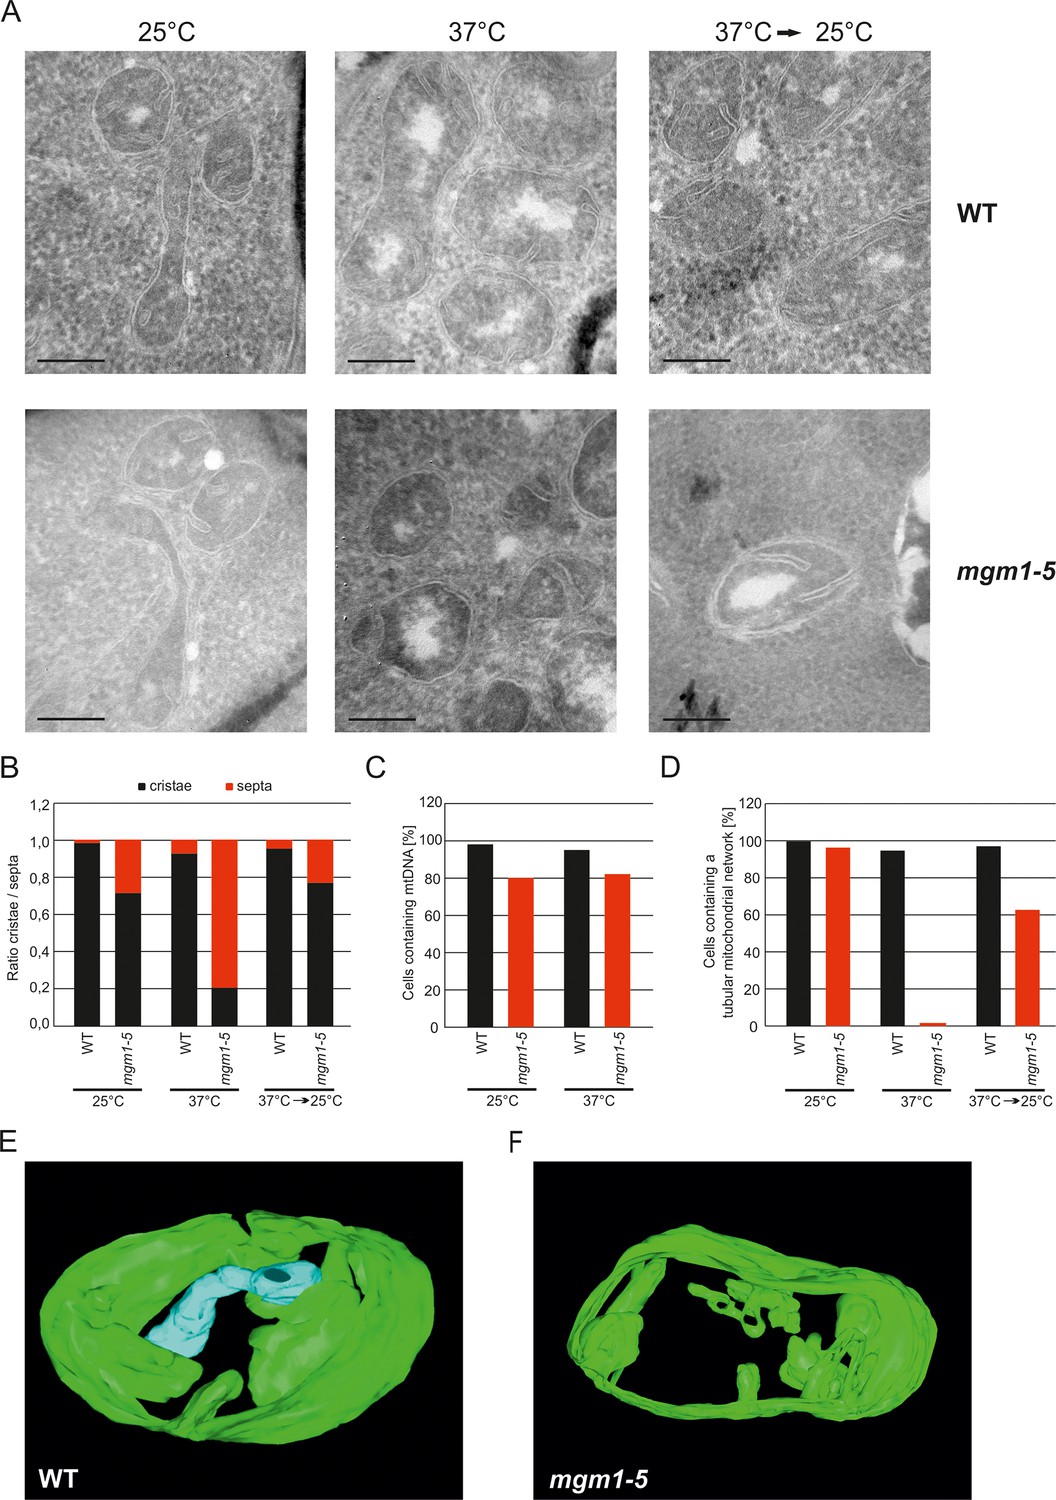
Mgm1 controls mitochondrial ultrastructure.
(A) Inactivation of Mgm1 leads to rapid loss, and reactivation to the rapid regeneration of cristae. WT cells and cells expressing the temperature sensitive mgm1-5 mutant were grown in YPD medium at 25°C to logarithmic phase. Aliquots of the cultures were incubated for 25 min at either 25°C or 37°C; further aliquots were incubated for 25 min at 37°C and shifted back to 25°C for 30 min. Cells were analyzed by EM. Scale bars, 0.2 µm. (B) Quantitative evaluation. 150–200 mitochondrial profiles were analyzed for each sample. (C) Maintenance of mtDNA in the mgm1-5 mutant upon exposure to 37°C. WT and mgm1-5 cells were grown in YPD medium at 25°C and incubated at 37°C for 25 min. The percentage of cells containing mtDNA was determined by DAPI staining. (D), Mitochondrial morphology in WT and in the mgm1-5 cells expressing mitochondrially targeted GFP. Cells were treated as described in (A). The morphology of the mitochondrial network in 100 cells per sample was analyzed by fluorescence microscopy. (E) EM tomographic reconstruction of a mitochondrion of a WT yeast cell. Green, IBM and lamellar cristae connected to the IBM; blue, tubular crista. (F) Tomographic reconstruction of a mitochondrion of a mgm1-5 cell grown at 25°C and shifted to 37°C for 25 min. Green, IBM and cristae connected to the IBM.
Figure 2—figure supplement 1
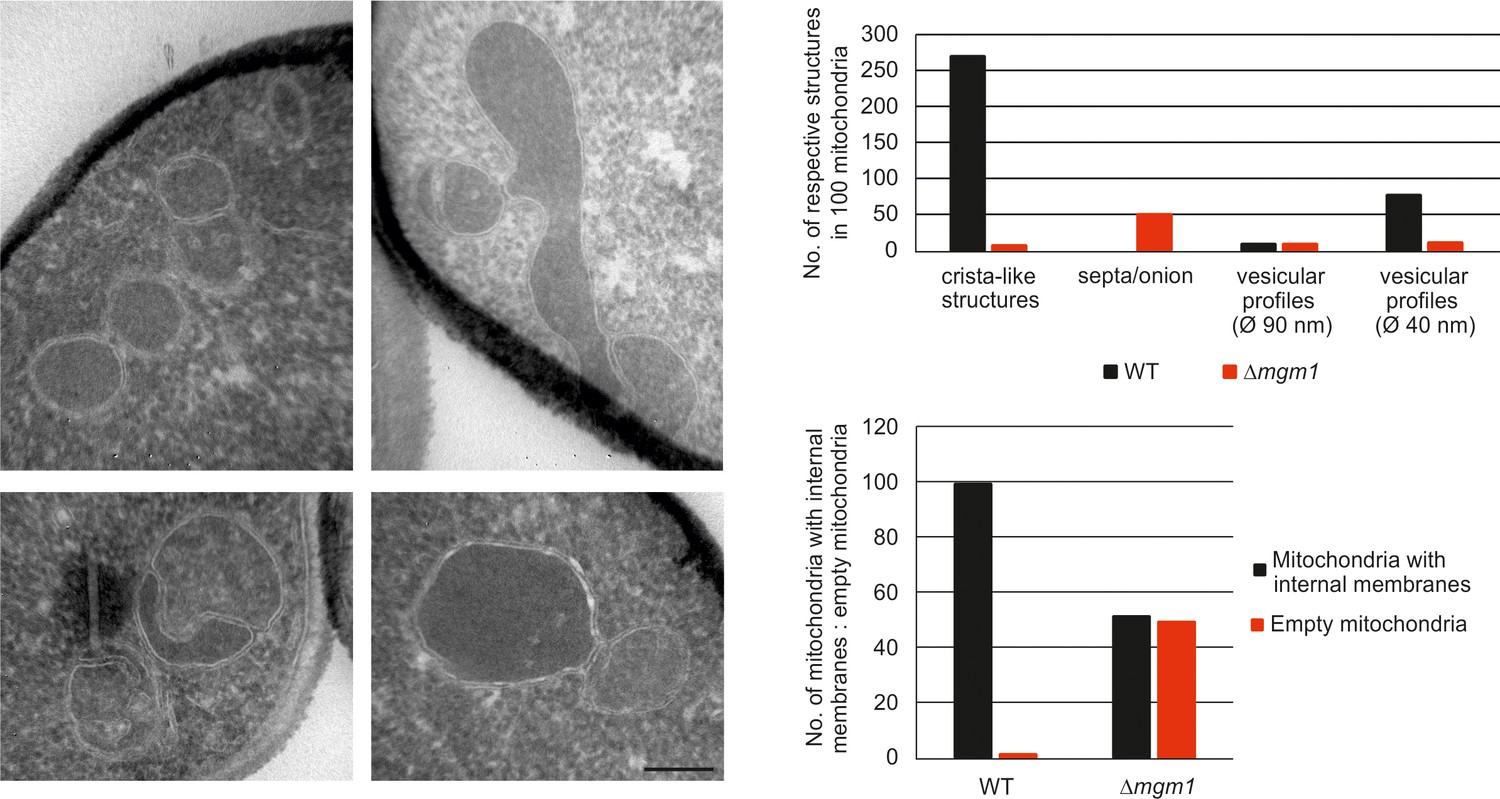
Mgm1 is required for wild type inner membrane structure.
EM analysis of mitochondria in cells lacking Mgm1. Left panel, EM images of Δmgm1 cells (scale bar, 0.2 µm). Right panel, quantitative evaluation of the EM analysis.
Figure 2—figure supplement 2
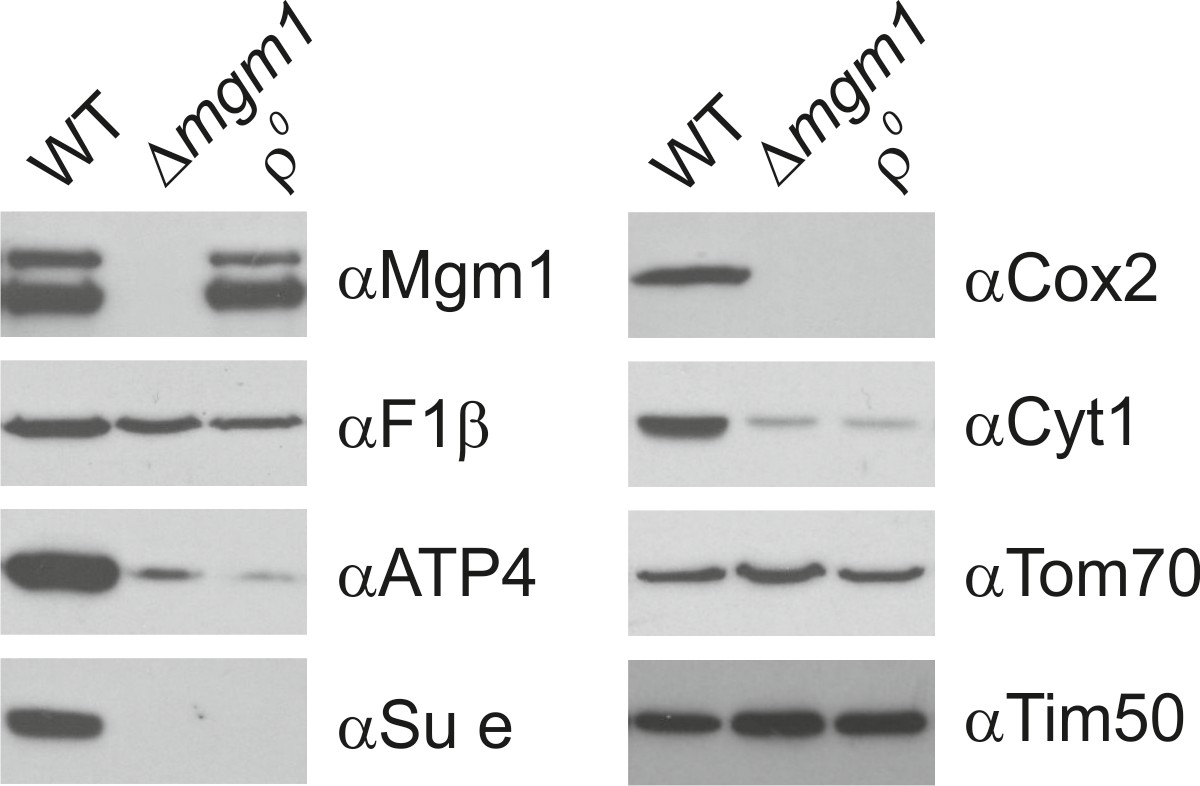
Mgm1 is required for wild type protein composition.
Steady state levels of mitochondrial proteins of ∆mgm1 cells. WT, Δmgm1 and rho0 cells were grown on YPGal. Aliquots of isolated mitochondria were analyzed by SDS-PAGE and immunoblotting. Arrow head, l-Mgm1; arrow, s-Mgm1.
Figure 2—figure supplement 3

Incubation of mgm1-5 cells for 25 min at non-permissive temperature does not lead to loss of functional mtDNA.
WT and mgm1-5 cells were grown in YPD medium at 25°C and incubated at 37°C for 25 min. Aliquots were plated on either YPD or YPG and incubated at 25°C or 37°C. Colonies were counted and the relative numbers of respiratory competent cells (YPG/YPD) were calculated. Mean values of three experiments. Error bars, standard deviation.
Figure 2—figure supplement 4
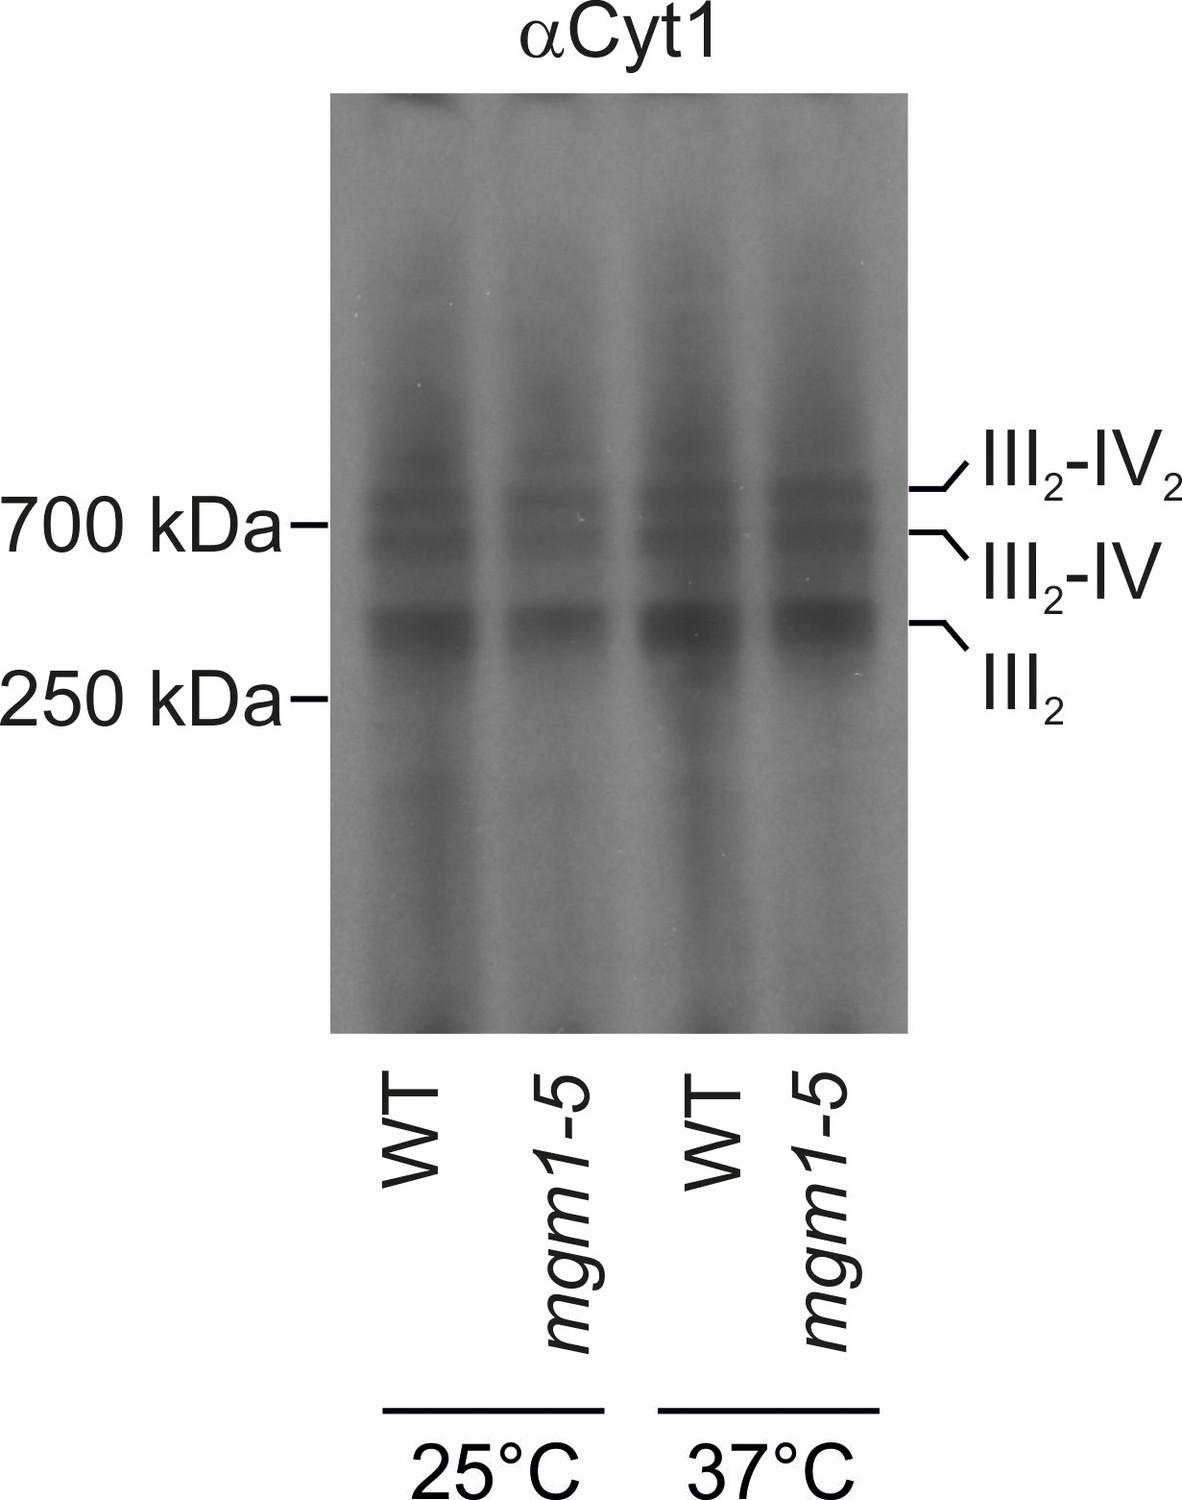
Changes of mitochondrial ultrastructure upon inactivation of Mgm1 do not affect the assembly state of respiratory chain supercomplexes.
WT and mgm1-5 cells were grown in YPG medium at 25°C. The cultures were divided and either further incubated at 25°C or transferred to pre-heated YPG medium and incubated for 25 min at 37°C. Mitochondria were isolated, lysed using 3% digitonin and subjected to BN-PAGE. The assembly state of the respiratory chain supercomplexes was analyzed by immunoblotting using an antibody directed against cytochrome c1 (αCyt1). III2, dimeric complex III; IV, complex IV; IV2, dimeric complex IV.
Figure 3
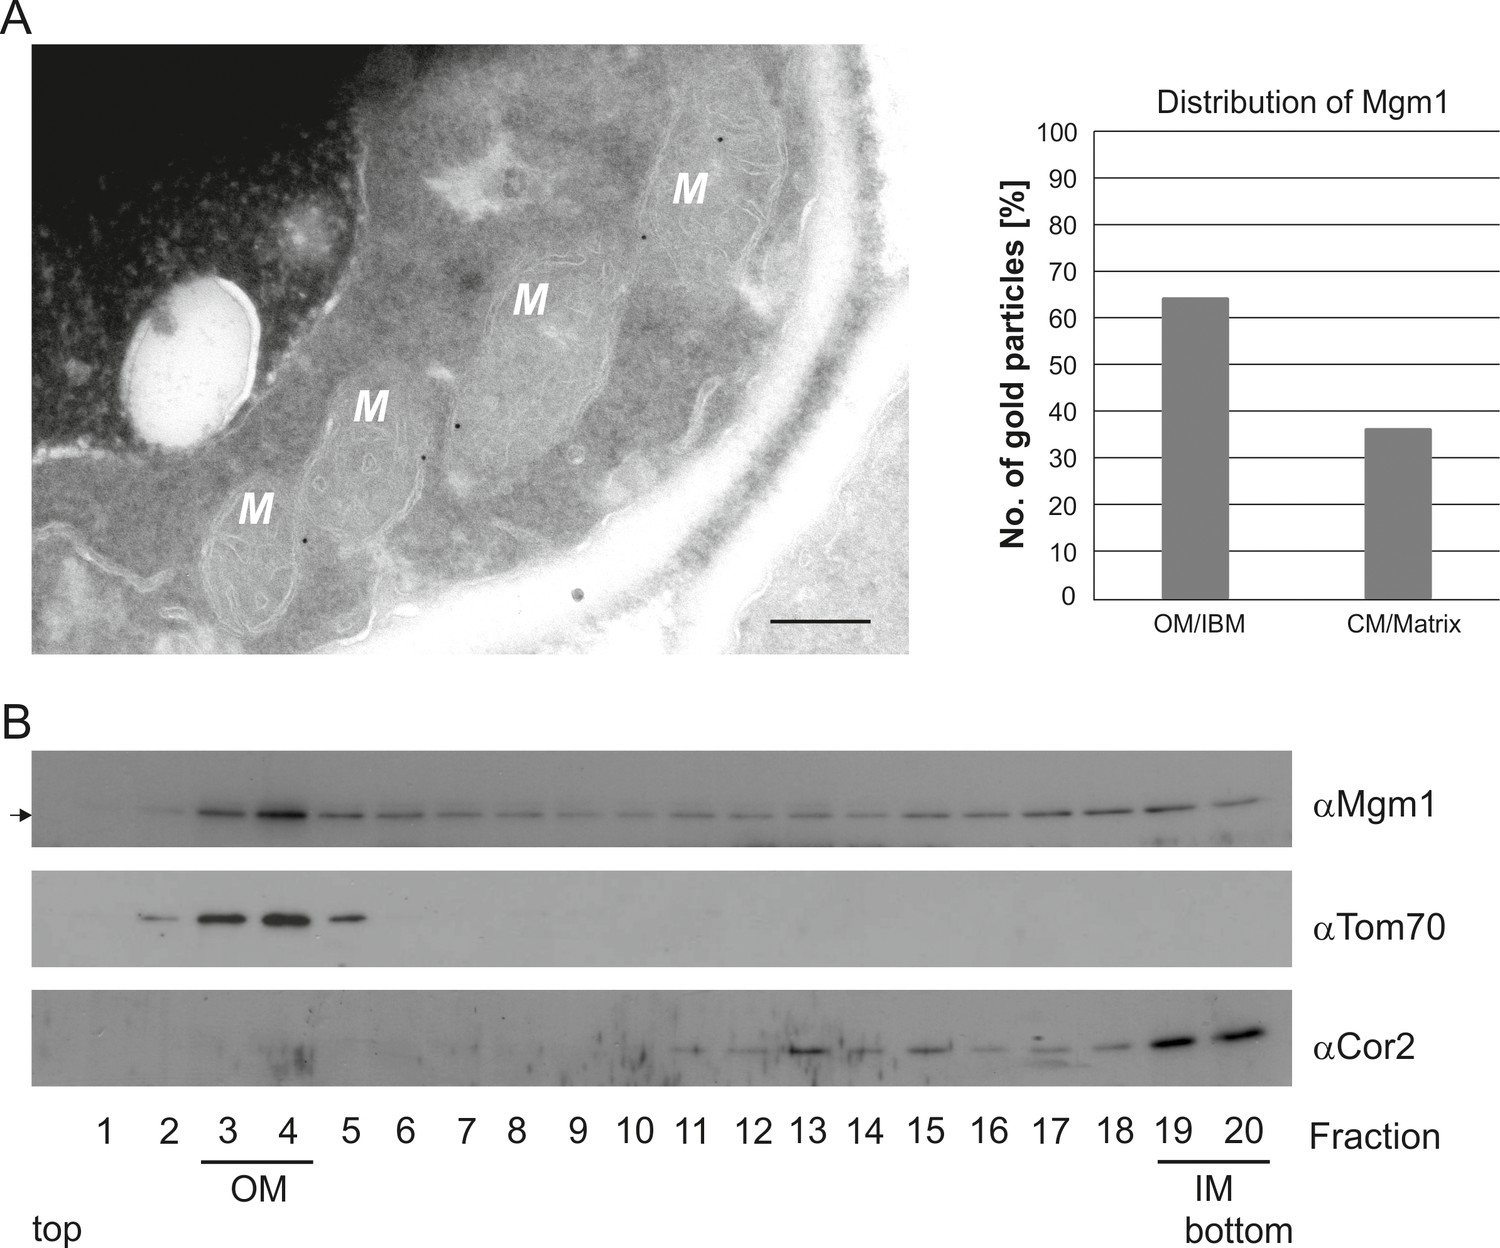
Mgm1 is present at the mitochondrial inner and outer membranes.
(A) Distribution of Mgm1 between OM/IBM and cristae. Cells expressing 3xHA tagged Mgm1 were analyzed by immuno-EM. Left panel, four mitochondrial profiles (M) showing gold particles at the IBM. Scale bar, 0.2 µm. Right panel, quantification of gold particles. (B) Distribution of Mgm1 between OM and IM. Mitochondrial vesicles generated by sonication were subjected to sucrose density gradient centrifugation followed by fractionation, SDS-PAGE and immunoblotting. Arrow, s-Mgm1. The membrane anchor of l-Mgm1 is notorious for being clipped off during isolation of mitochondria (c.f. Figures 5C and 7C). Therefore, l-Mgm1 was not detected after mitochondrial subfractionation. Cor2, subunit two of respiratory chain complex III.
Figure 4
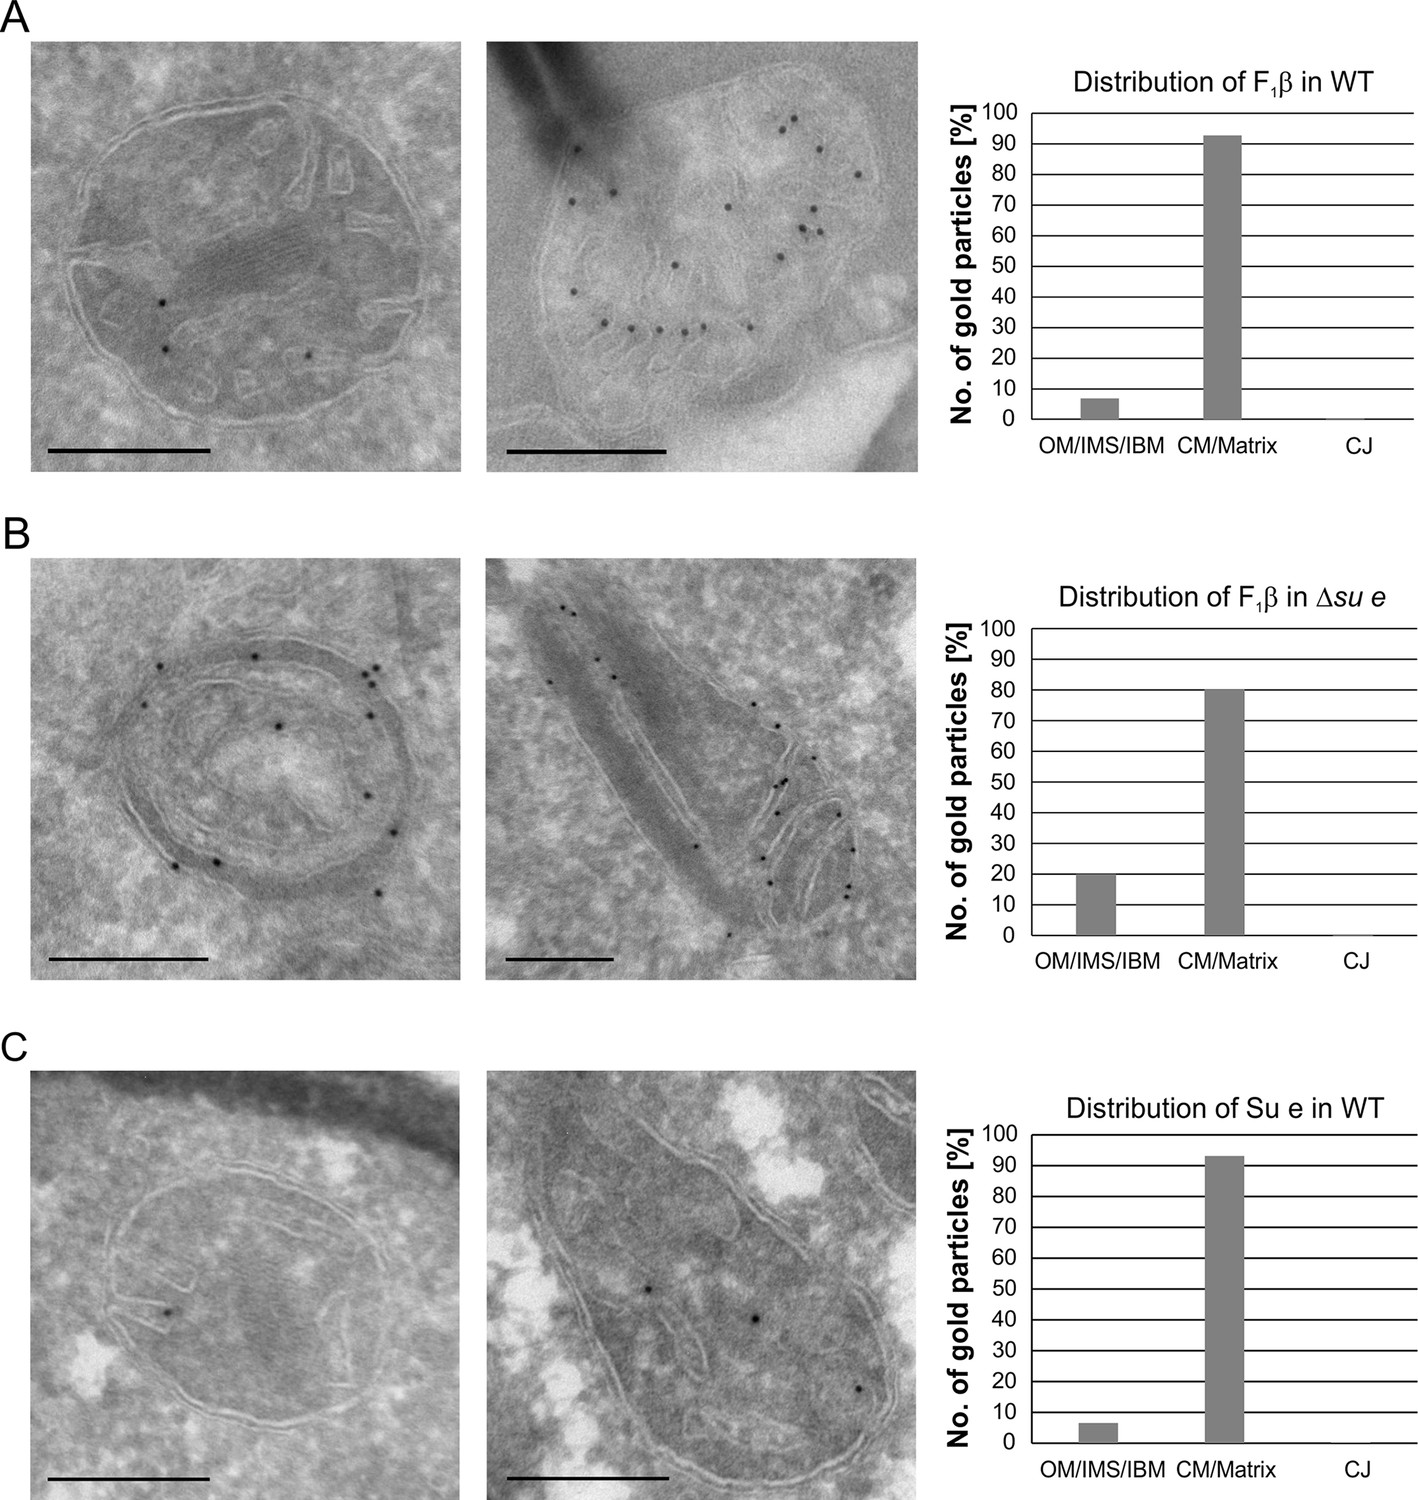
Localization and dimerization of F1FO are relevant to mitochondrial architecture.
(A) Distribution of F1FO between IBM and cristae in WT cells. WT cells expressing 3xHA tagged F1β were subjected to immuno-EM and quantified. (B) Distribution of F1FO between IBM and cristae/septa in Δsu e cells. Δsu e cells expressing 3xHA tagged F1β were analyzed as in (A). (C) Distribution of Su e between IBM and cristae in WT. WT cells expressing 3xHA tagged Su e were analyzed as in (A). Scale bars, 0.2 µm.
Figure 5
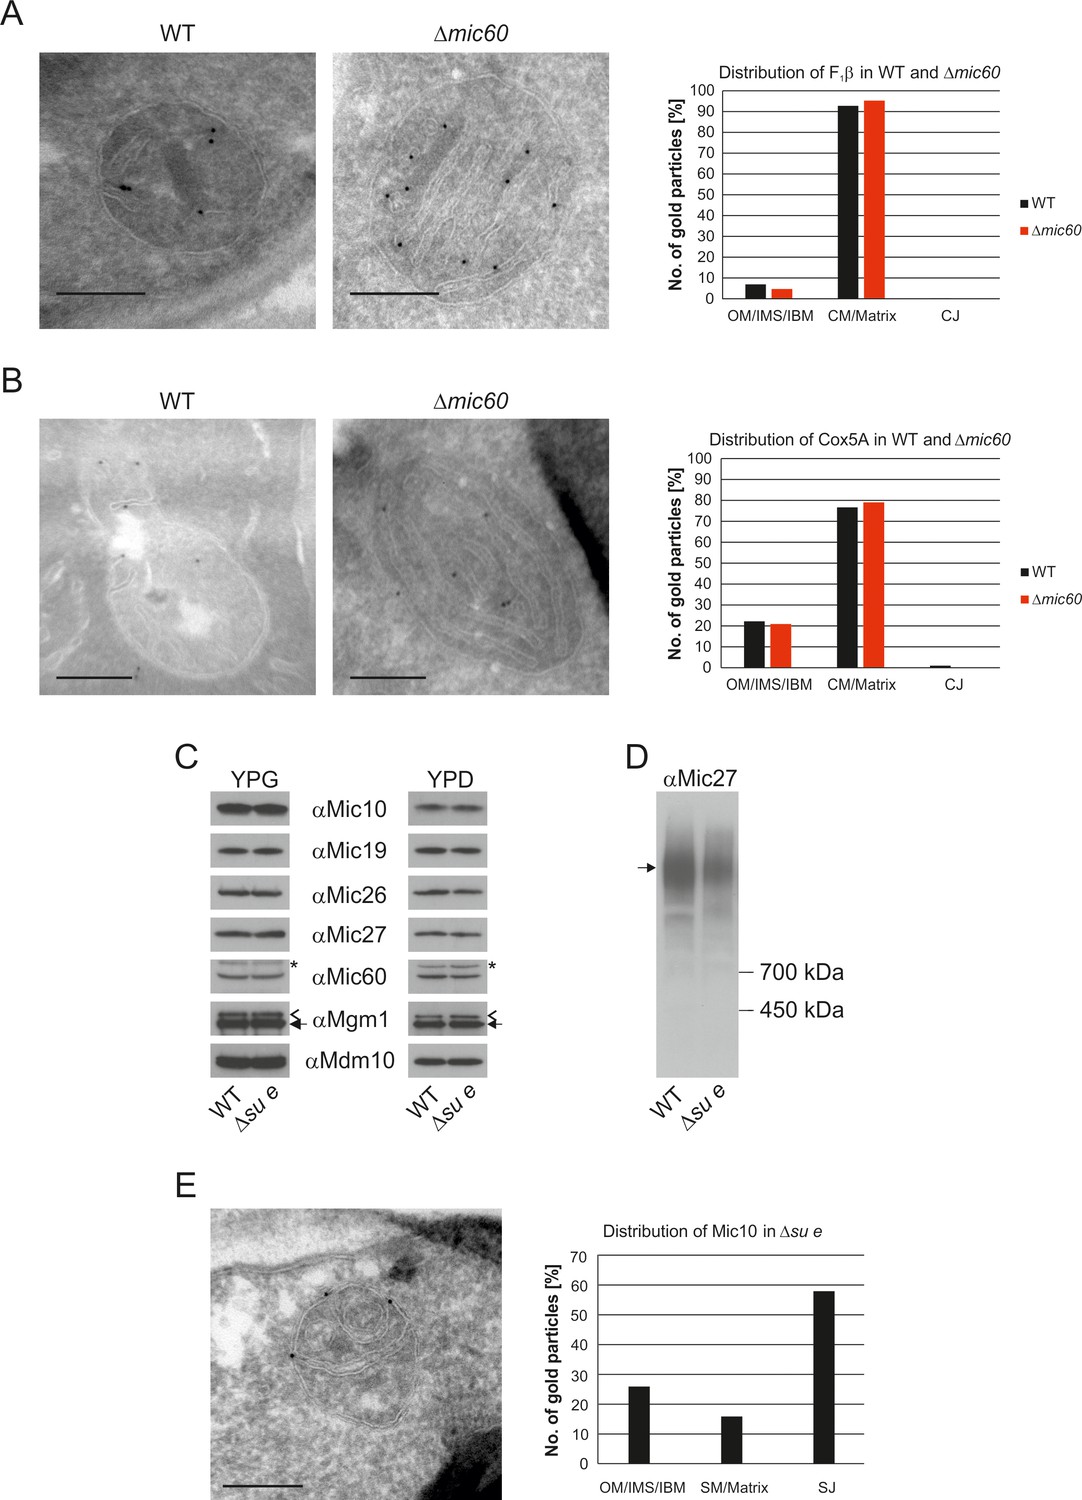
The stacked membrane sheets in mitochondria lacking Mic60 are functionally similar to crista membranes.
(A) Distribution of F1β in ∆mic60 cells. Δmic60 cells expressing 3xHA tagged F1β were analyzed by immuno-EM and quantified. (B) Distribution of Cox5A in ∆mic60 cells. Δmic60 cells expressing 3xHA tagged Cox5A were analyzed as in (A). (C) Levels of MICOS subunits in ∆su e cells. WT cells and cells lacking Su e were grown on YPG (left) or YPD (right). Aliquots of mitochondrial protein were analyzed by SDS-PAGE and immunoblotting. Arrow head, l-Mgm1; arrow, s-Mgm1; asterisk, cross-reaction of the Mic60 antibody. (D) Assembly state of MICOS subunits in ∆su e cells. Mitochondria were isolated and lysed using digitonin. MICOS complex was analyzed by BN-PAGE and immunoblotting. Arrow, assembled MICOS complex. The result of one of four independently performed experiments is shown. (E) Distribution of Mic10 in ∆su e cells. Δsu e cells expressing 3xHA tagged Mic10 were analyzed as in (A). SM, septum membrane; SJ, septum junction. Scale bars, 0.2 µm.
Figure 6
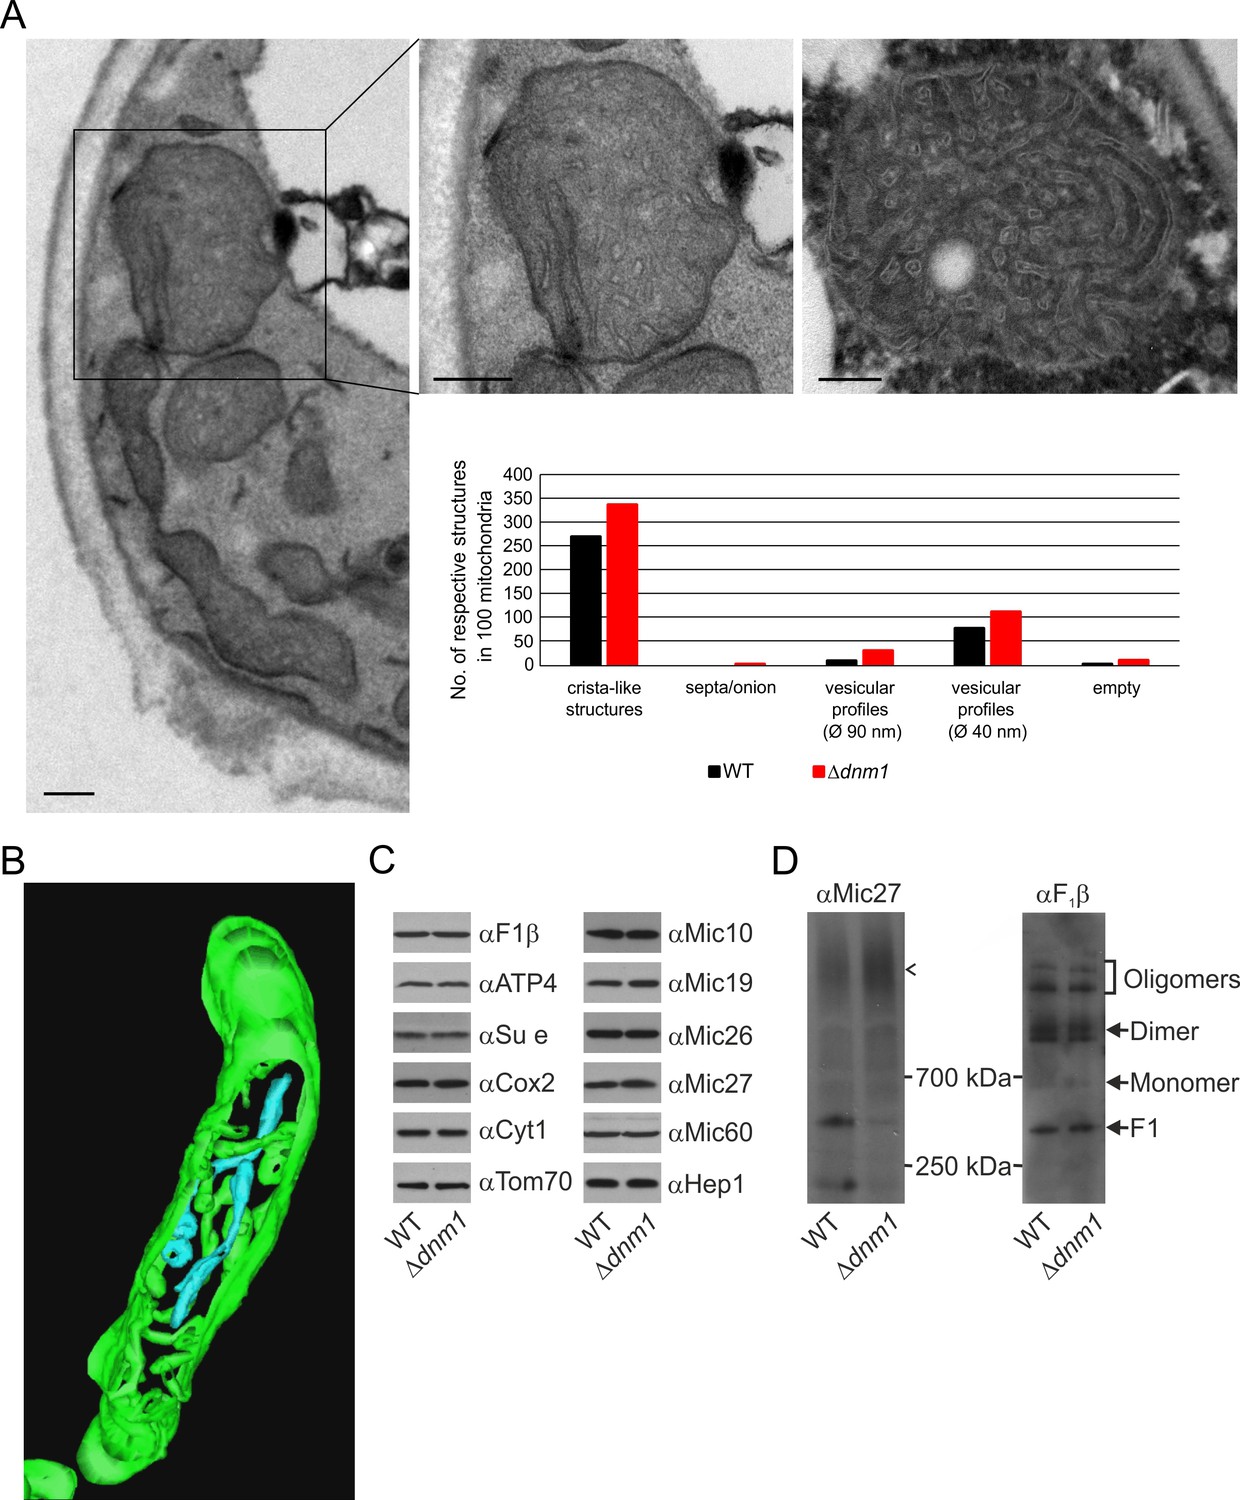
Structure and protein composition of cristae in cells deficient in Dnm1.
(A) Ultrastructure and quantitative evaluation of mitochondria in Δdnm1 cells grown on YPG (scale bars, 0.2 µm). (B) Tomographic reconstruction of a mitochondrion of a Δdnm1 cell. Green, IBM and cristae connected to the IBM; blue, tubular cristae without visible connection to the IBM. (C) Steady state levels of mitochondrial proteins of Δdnm1 cells. WT and Δdnm1 cells were grown on YPG, aliquots of mitochondrial protein were analyzed by SDS-PAGE and immunoblotting. (D) Assembly state of MICOS and of F1FO in Δdnm1 cells. Analysis as in Figure 4D. Arrow head, assembled MICOS complex.
Figure 7 with 1 supplement
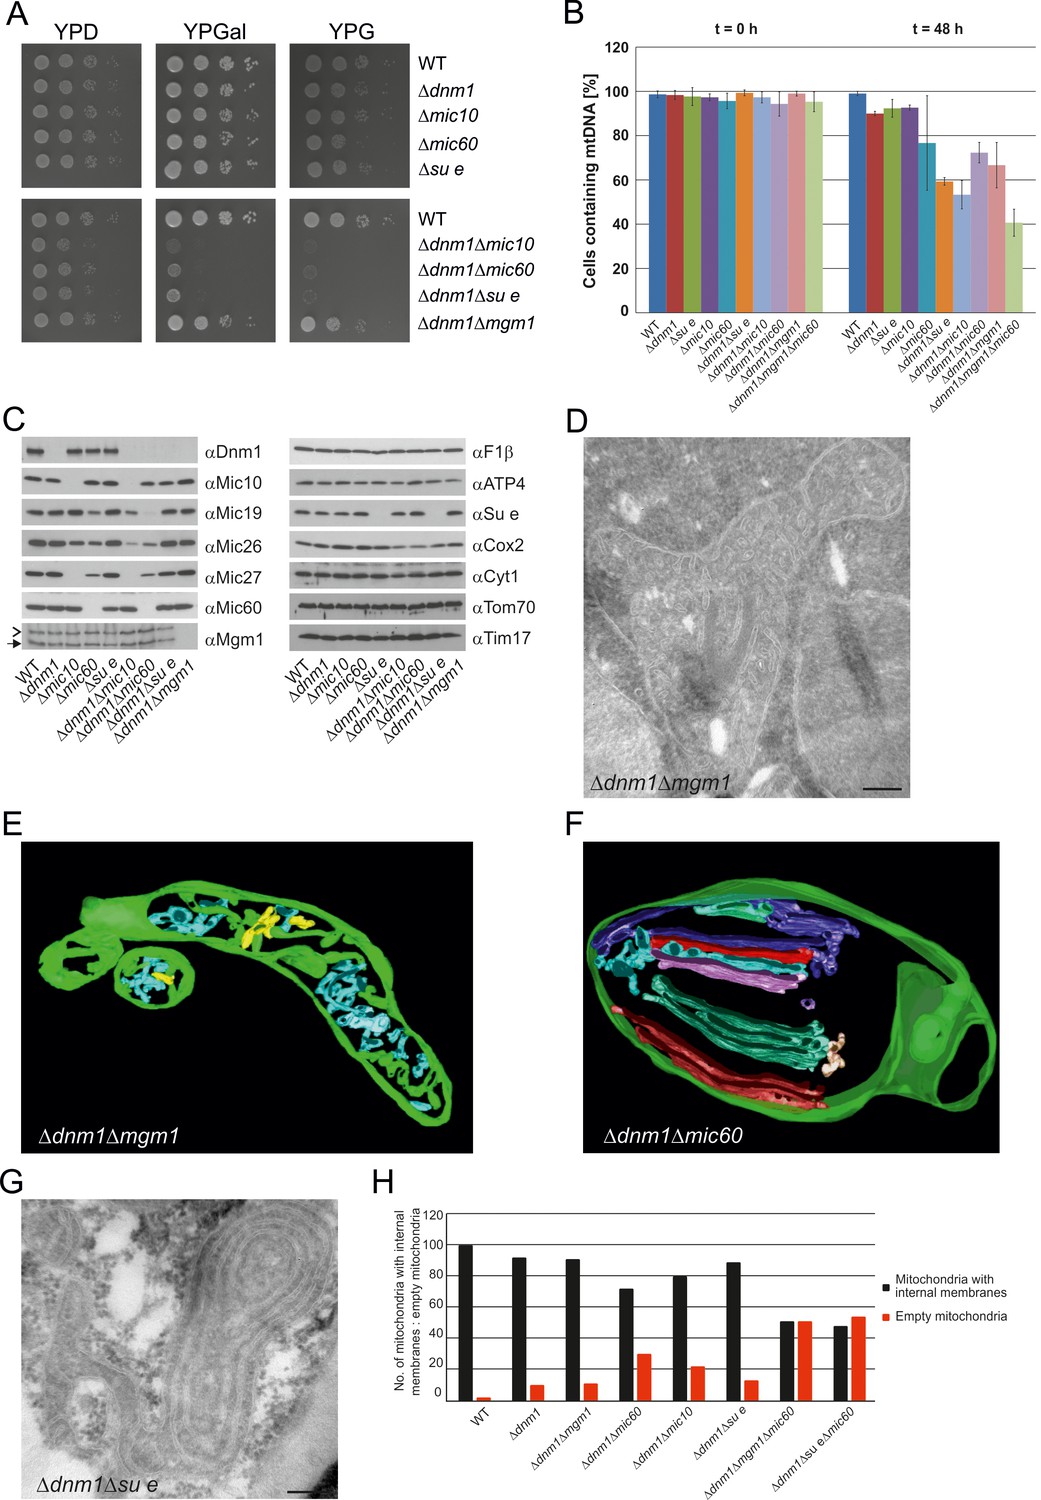
Growth, structure and protein composition of cristae in mutants lacking either Mgm1, Mic10, Mic60 or Su e in the Dnm1 deletion background.
(A) Growth of double mutant strains deficient in Dnm1 and Mgm1, Mic10, Mic60 or Su e. The strains were cultured on YPG medium to logarithmic phase followed by growth analysis on the indicated media by drop dilution assay. (B) mtDNA maintenance in cells lacking either Mgm1, dimeric F1FO or MICOS in the Δdnm1 background. Strains were grown on YPG and transferred to YPD medium. At time 0 hr and after 48 hr the percentage of cells containing mtDNA was determined by DAPI staining. Mean values of three independent experiments. Error bars, standard deviation. (C), Steady state levels of mitochondrial proteins in the Δdnm1 double mutant cells. Cells were grown on YPG medium, proteins were extracted and their levels were analyzed by SDS-PAGE and immunoblotting. Arrow head, l-Mgm1; arrow, s-Mgm1. (D) Mitochondrial ultrastructure of Δdnm1Δmgm1 cells analyzed by EM. (E) Tomographic reconstruction of a mitochondrion of a Δdnm1Δmgm1 cell. Green, IBM and cristae connected to the IBM; blue, tubular cristae without visible connection to the IBM; yellow, tubular cristae without connection to the IBM. (F) Tomographic reconstruction of a mitochondrion of a Δdnm1Δmic60 cell. Green, IBM; other colors, perforated tubular-sheet like membrane structures in the matrix without connections to the IBM. To be able to discriminate between the different tubular elements they are shown in different colors. (G) Ultrastructure of mitochondria in Δdnm1Δsu e cells. (H) Quantitative evaluation of the EM analysis of the indicated mutant strains. Scale bars, 0.2 µm.
Figure 7—figure supplement 1
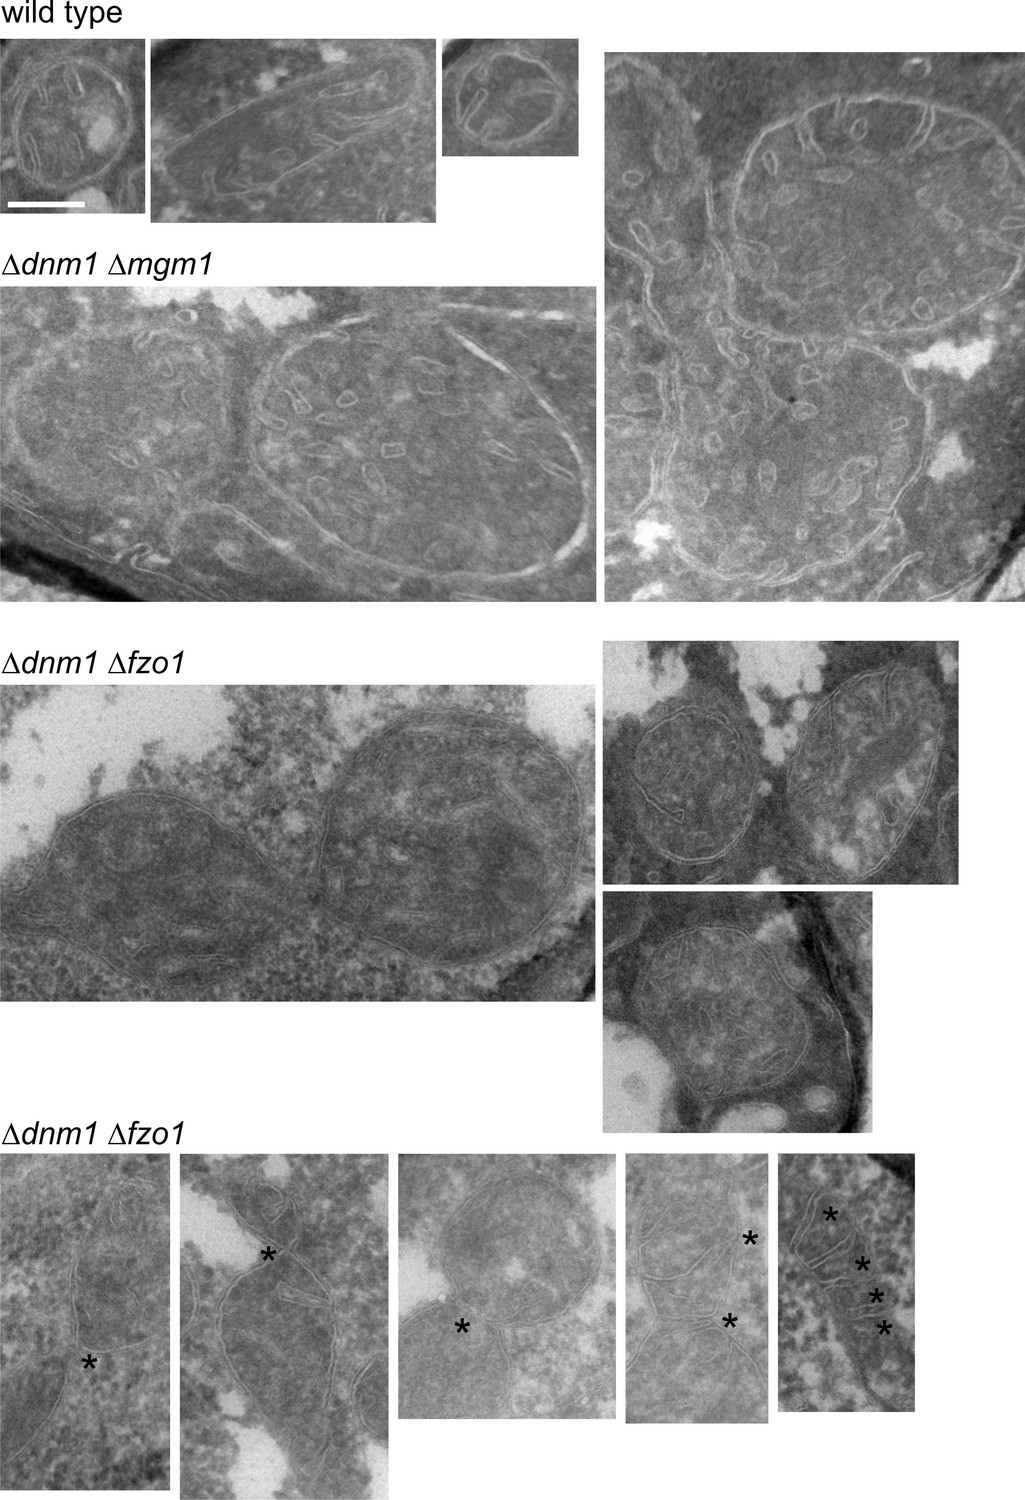
Mitochondrial outer membrane fusion is important but not essential for the formation of lamellar cristae.
WT cells, Δdnm1Δmgm1 cells and Δdnm1Δfzo1 cells were grown in YPG medium to logarithmic phase. Cells were prepared for EM and the mitochondrial ultrastructure was analyzed. Constriction sites are marked with an arrow and septa with an asterisk. Scale bar, 0.2 µm.
Figure 8
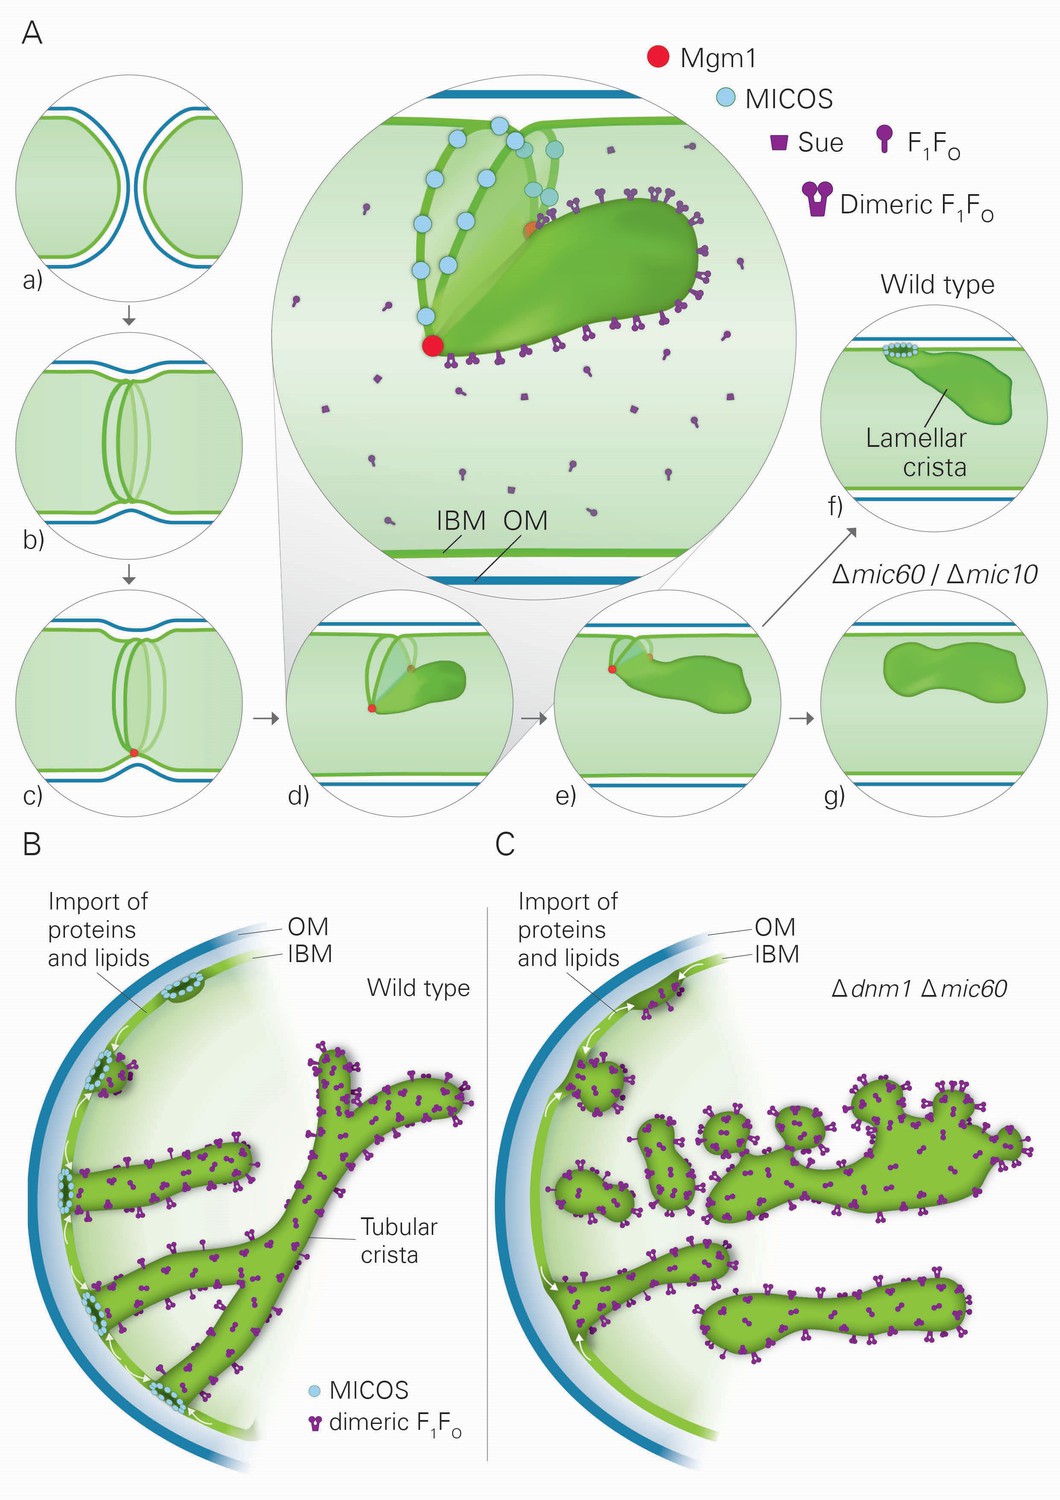
Model of the formation of cristae by the fusion dependent and independent pathways.
(A) Formation of lamellar cristae by the fusion dependent pathway. Steps in the conversion of the septa membranes of two fusing mitochondria into a crista membrane. (a) Two mitochondria before fusion; (b) after fusion of OM and before fusion of IM; (c) tethering of the two septa membranes; (d–e) progressing fusion intermediates; (f) final stage of fusion after formation of a crista junction; (g) formation of a closed crista-like membrane vesicle without connection to the IBM in mutants deficient in Mic60 or Mic10. (B) Formation of tubular cristae by the fusion independent pathway. (C) Formation of bizarre membrane assemblies in mitochondria of MICOS deficient cells by the fusion independent pathway. Blue lines, OM; green lines, IBM, septa membrane and crista membrane; light green, matrix space.
Videos
Video 1
3D reconstruction with modelling of a mitochondrion in wild type cells.
Grey, OM; green, IBM and cristae connected to the IBM; blue, tubular cristae without visible connection to the IBM.
Video 2
3D reconstruction with modelling of a mitochondrion in mgm1-5 cells incubated for 25 min at 37°C.
Grey, OM; green, IBM and cristae connected to the IBM.
Video 3
3D reconstruction with modelling of a mitochondrion in the ∆dnm1 mutant.
Green, IBM and cristae connected to the IBM; blue, tubular cristae without visible connection to the IBM; yellow, tubular cristae without connection to the IBM.
Video 4
3D reconstruction with modelling of a mitochondrion in the ∆dnm1∆mgm1 double deletion mutant.
Green, IBM and cristae connected to the IBM; blue, tubular cristae without visible connection to the IBM; yellow, tubular cristae without connection to the IBM.
Video 5
3D reconstruction with modelling of a mitochondrion in the ∆dnm1∆mic60 double deletion mutant.
Green, IBM and cristae connected to the IBM; blue and red, fused tubular structures and perforated tubular-sheet like membrane structures in the matrix without connections to the IBM; yellow, ER-type tubules.
Tables
Table 1
Genotypes of the strains used in the study. Left column, names of the stains. Right column, genotypes of the strains.
Strain | Genotype |
|---|---|
W303 WT | MATa or MATa, ade2-1, leu2-3, his3-11,15, trp1-1, ura3-1, can1-100 |
W303 mgm1-5 | MATa, ade2-1, leu2-3, his3-11,15, trp1-1, ura3-1, can1-100, mgm1-5 (G408 to D408) (Wong et al., 2000) |
YPH499 WT | MATa; ura3-52, lys2-801amber, ade2-101ocre, trp1-Δ63, his3-Δ200, leu2-Δ1} or BY4724 {MATα; his3Δ1; leu2Δ0; lys2Δ0; ura3Δ0 |
∆su e | MATa; ura3-52, lys2-801amber, ade2-101ocre, trp1-Δ63, his3-Δ200, leu2-Δ1, su e::HISI3 |
F1β-3xHA | MATa; ura3-52, lys2-801amber, ade2-101ocre, trp1-Δ63, his3-Δ200, leu2-Δ1, F1β-3xHA::HISI3 |
∆su e F1β-3xHA | MATa; ura3-52, lys2-801amber, ade2-101ocre, trp1-Δ63, his3-Δ200, leu2-Δ1, su e::HISI3, F1β-3xHA::TRP1 |
Su e-3xHA | MATa; ura3-52, lys2-801amber, ade2-101ocre, trp1-Δ63, his3-Δ200, leu2-Δ1} or BY4724 {MATα; his3Δ1; leu2Δ0; lys2Δ0; ura3Δ0; Su e-3xHA::HIS3 |
∆mgm1 | MATa; ura3-52, lys2-801amber, ade2-101ocre, trp1-Δ63, his3-Δ200, leu2-Δ1, mgm1::KAN |
Mgm1-3xHA | MATa; ura3-52, lys2-801amber, ade2-101ocre, trp1-Δ63, his3-Δ200, leu2-Δ1, MGM1-3xHA::TRP1 |
∆mic60 F1β-3xHA | MATa; ura3-52, lys2-801amber, ade2-101ocre, trp1-Δ63, his3-Δ200, leu2-Δ1, mic60::His3, F1β-3xHA::TRP1 |
Cox5A-3xHA | MATa; ura3-52, lys2-801amber, ade2-101ocre, trp1-Δ63, his3-Δ200, leu2-Δ1} or BY4724 {MATα; his3Δ1; leu2Δ0; lys2Δ0; ura3Δ0; COX5A-3xHA::KAN |
∆mic60 Cox5A-3xHA | MATa; ura3-52, lys2-801amber, ade2-101ocre, trp1-Δ63, his3-Δ200, leu2-Δ1, mic60::His3, COX5A-3xHA::KAN |
∆dnm1 | MATa; ura3-52, lys2-801amber, ade2-101ocre, trp1-Δ63, his3-Δ200, leu2-Δ1, dnm1::KAN |
∆mic10 | MATa; ura3-52, lys2-801amber, ade2-101ocre, trp1-Δ63, his3-Δ200, leu2-Δ1} or BY4724 {MATα; his3Δ1; leu2Δ0; lys2Δ0; ura3Δ0; mic10::KAN |
∆mic60 | MATa; ura3-52, lys2-801amber, ade2-101ocre, trp1-Δ63, his3-Δ200, leu2-Δ1} or BY4724 {MATα; his3Δ1; leu2Δ0; lys2Δ0; ura3Δ0; mic60::HIS3 |
∆dnm1 ∆mgm1 | MATa; ura3-52, lys2-801amber, ade2-101ocre, trp1-Δ63, his3-Δ200, leu2-Δ1, dnm1::KAN, mgm1::hphNT1 |
∆dnm1 ∆fzo1 | MATa, ura3-52, lys2-801amber, ade2-101ocre, trp1-Δ63, his3-Δ200, leu2-Δ1, dnm1::HIS3, fzo1::KAN, rho+ |
∆dnm1 ∆mic10 | MATa; ura3-52, lys2-801amber, ade2-101ocre, trp1-Δ63, his3-Δ200, leu2-Δ1, dnm1::KAN, mic10::hphNT1 |
∆dnm1 ∆mic60 | MATa; ura3-52, lys2-801amber, ade2-101ocre, trp1-Δ63, his3-Δ200, leu2-Δ1, dnm1::KAN, mic60::HIS3 |
∆dnm1 ∆su e | MATa; ura3-52, lys2-801amber, ade2-101ocre, trp1-Δ63, his3-Δ200, leu2-Δ1, dnm1::KAN, su e::HIS3 |
∆dnm1 ∆mgm1 ∆mic60 | MATa; ura3-52, lys2-801amber, ade2-101ocre, trp1-Δ63, his3-Δ200, leu2-Δ1} or BY4724 {MATα; his3Δ1; leu2Δ0; lys2Δ0; ura3Δ0; dnm1::KAN, mic60::HIS3; mgm1::hphNT1 |
∆dnm1 ∆su e ∆mic60 | MATa; ura3-52, lys2-801amber, ade2-101ocre, trp1-Δ63, his3-Δ200, leu2-Δ1} or BY4724 {MATα; his3Δ1; leu2Δ0; lys2Δ0; ura3Δ0; dnm1::KAN, mic60::HIS3; su e::HIS3 |
Download links
A two-part list of links to download the article, or parts of the article, in various formats.
Downloads (link to download the article as PDF)
Open citations (links to open the citations from this article in various online reference manager services)
Cite this article (links to download the citations from this article in formats compatible with various reference manager tools)
An evidence based hypothesis on the existence of two pathways of mitochondrial crista formation
eLife 5:e18853.
https://doi.org/10.7554/eLife.18853


