Cells must express components of the planar cell polarity system and extracellular matrix to support cytonemes
- University of California, San Francisco, United States
Figures
Figure 1 with 1 supplement

ASP cytonemes depend on Prickle and Van Gogh.
(A) The drawing of a wing disc of a wandering stage third instar larva showing branches of disc-associated trachea (white, outlined in blue) with transverse connective (TC) and air sac primordium (ASP) indicated, and with the Dpp- (green) and FGF-expressing cells (blue) indicated. Sagittal section with ECM also indicated, below. (B,C) Unfixed preparations of wing disc expressing CD2:GFP driven by btl-LHG, and mCherry driven by bnl-Gal4 (B) and mCherry driven by dpp-Gal4 (C). (D–F) ASPs marked by Cherry-CAAX (driven by btl-LHG) in control (D) and pk (E) and Vang (F) mutants typify normal ASPs with many cytonemes extending from the entire periphery (D) and morphologically abnormal ASPs with few cytonemes in the mutants. Bottom panels show extreme examples of duplicated ASPs in the mutants. Scale bar: 30 µm.
-
Figure 1—source data 1
Numbers of ASP cytonemes in control, pk mutants and Vang mutants.
- https://doi.org/10.7554/eLife.18979.004
Figure 1—figure supplement 1
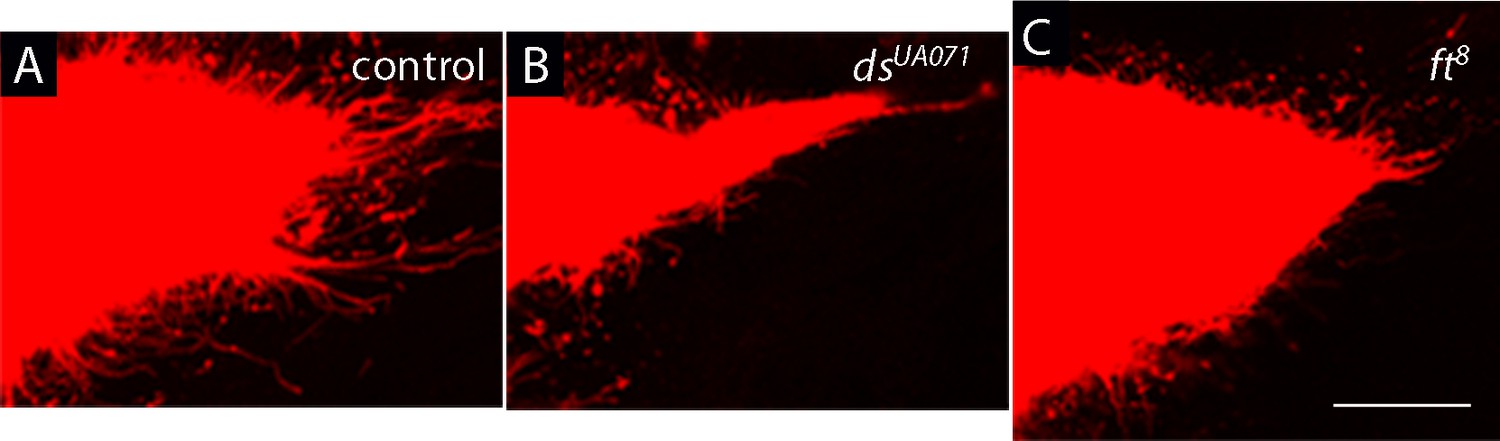
Components of planar cell polarity modulate the activity of cytoneme-mediated signaling.
(A–C) Compared to control (A), ASPs of dachsous (ds) mutants were reduced (B), and ASPs of fat (ft) mutants were enlarged (C), and neither had normal cytonemes. Genotypes: (A) btl-LHG lexO-Cherry-CAAX/+; (B) dsUAO71/dsUAO71; btl-LHG lexO-Cherry-CAAX/+; (C) ft8/ft8; btl-LHG lexO-Cherry-CAAX/+. Scale bar: 30 µm.
-
Figure 1—figure supplement 1—source data 1
Numbers of ASP cytonemes in ds and ft mutants.
- https://doi.org/10.7554/eLife.18979.006
Figure 2 with 1 supplement
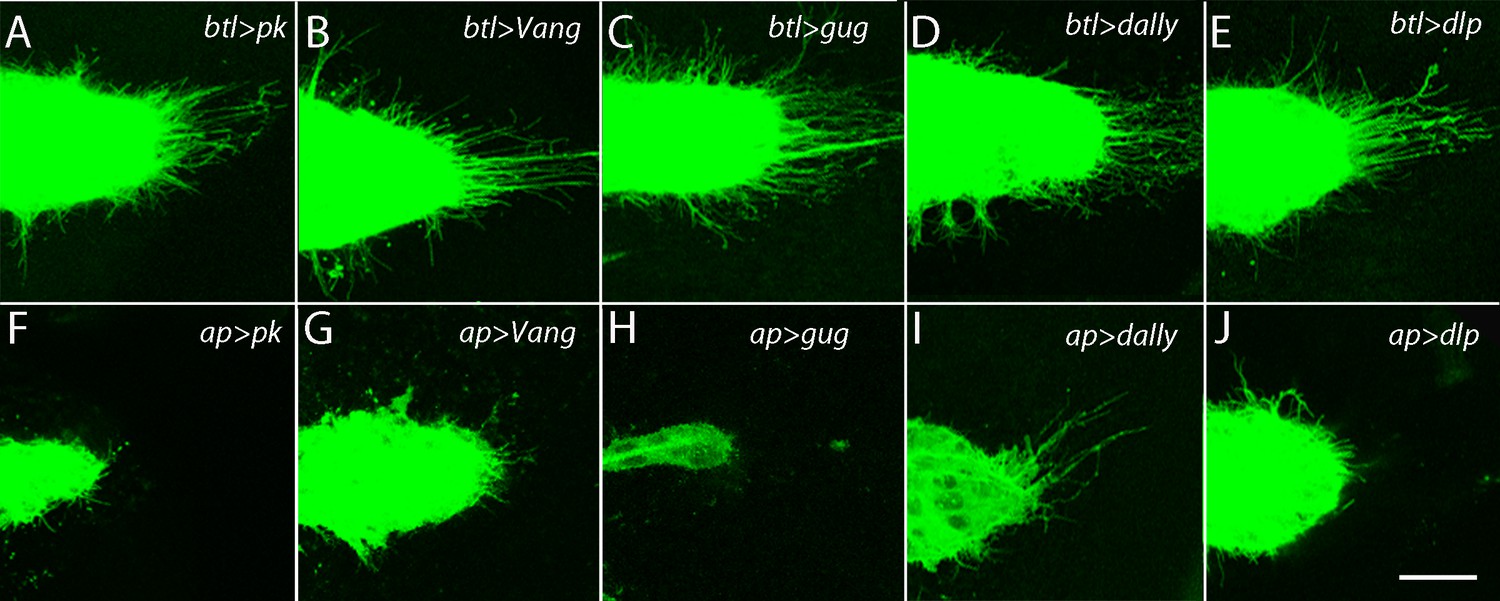
The ASP depends on the components of the PCP system in the wing disc and not in the ASP.
ASPs marked by membrane-tethered GFP and expressing RNAi constructs in either the ASP (driven by btl-Gal4) or the dorsal compartment of the wing disc (driven by ap-Gal4) and directed against the indicated genes. Genotypes: (A) btl-Gal4 UAS-CD8:GFP/+; UAS-pkRNAi/+; (B) btl-Gal4 UAS-CD8:GFP/UAS-VangRNAi; (C) btl-Gal4 UAS-CD8:GFP/+; UAS-gugRNAi/+; (D) btl-Gal4 UAS-CD8:GFP/UAS-dallyRNAi; UAS-dallyRNAi/+; (E) btl-Gal4 UAS-CD8:GFP/+; UAS-dlpRNAi/+; (F) ap-Gal4/+; btl-LHG lexO-CD2:GFP/UAS-pkRNAi; (G) ap-Gal4/UAS-VangRNAi; btl-LHG lexO-CD2:GFP/+; (H) ap-Gal4/+; UAS-gugRNAi/btl-LHG lexO-CD2:GFP; (I) ap-Gal4/UAS-dallyRNAi; btl-LHG lexO-CD2:GFP/UAS-dallyRNAi; (J) ap-Gal4/+; btl-LHG lexO-CD2:GFP/UAS-dlpRNAi. Scale bar: 25 µm.
Figure 2—figure supplement 1
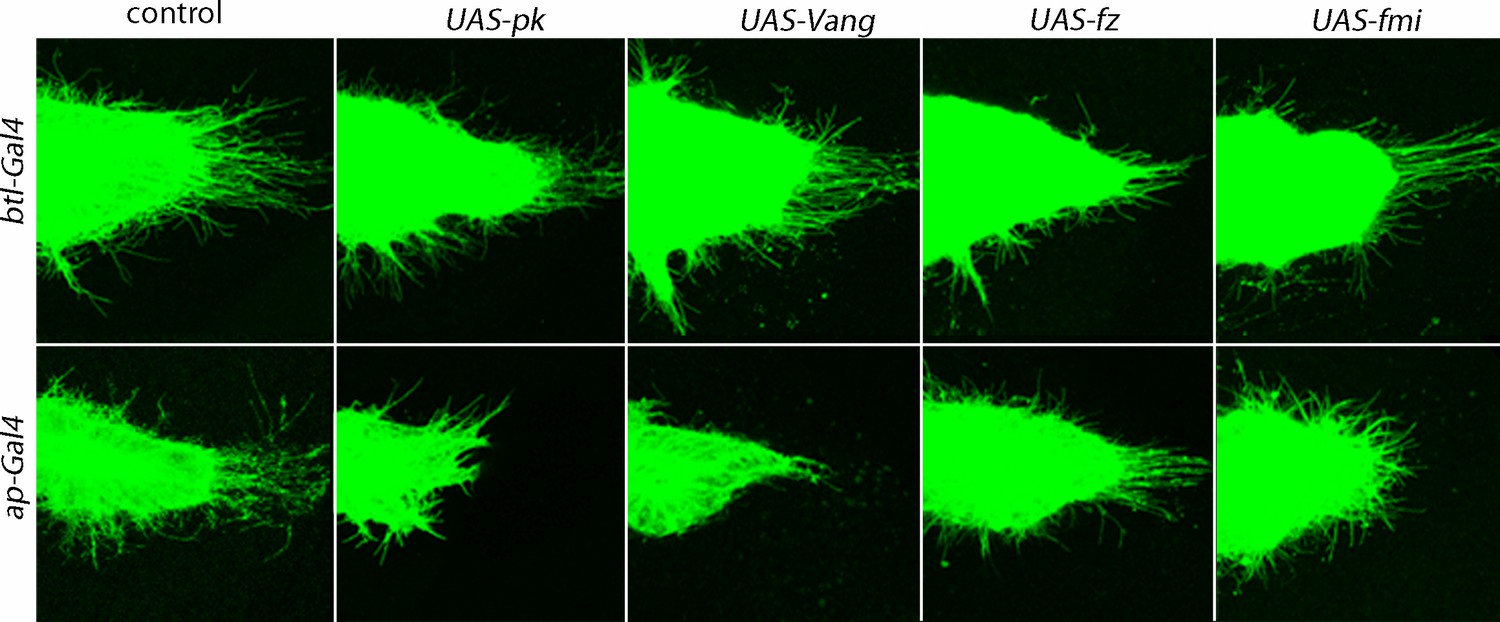
Dependence of ASP cytonemes on Prickle and Van Gogh expression.
Over-expression of pk or Vang in the ASP (btl-Gal4 UAS-pk and btl-Gal4 UAS-Vang) had no effect on the number of ASP cytonemes (p value from student t test 0.51 and 0.42, respectively, compared to control) or on ASP morphology. Over-expression in the disc (ap-Gal4 UAS-pk and ap-Gal4 UAS-Vang) decreased the number of ASP cytonemes (p value from student t test 0.0022 and 0.0020, respectively, compared to control, and 0.0046 and 0.0012 compared to btl-Gal4 UAS-pk and btl-Gal4 UAS-Vang, respectively) and affected ASP morphology. Over-expression of fz and fmi in either the ASP or disc was without apparent consequence (p values from student t tests 0.20–0.9).
-
Figure 2—figure supplement 1—source data 1
Numbers of ASP cytonemes in flies over-expressing the PCP components.
- https://doi.org/10.7554/eLife.18979.011
Figure 3
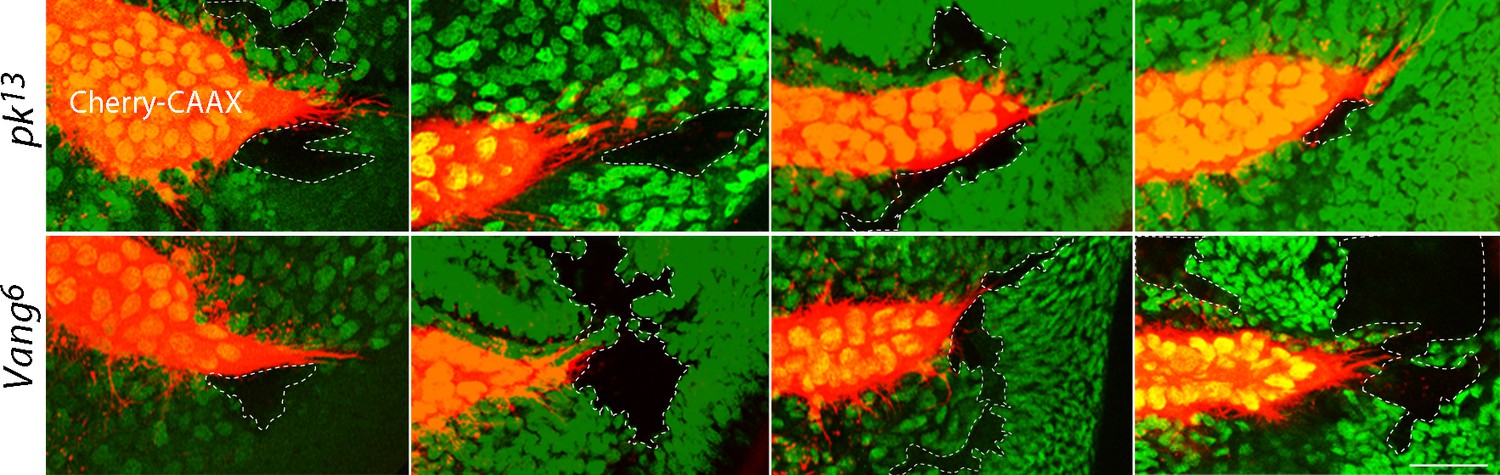
Extension of ASP cytonemes depends on Prickle and Van Gogh in underlying wing disc cells.
pk13 (upper panels) and Vang6 (lower panels) mutant clones in wing discs with ASPs marked with Cherry-CAAX. The mutant clones are outlined with dotted lines and do not express GFP. Scale bar: 25 µm.
Figure 4
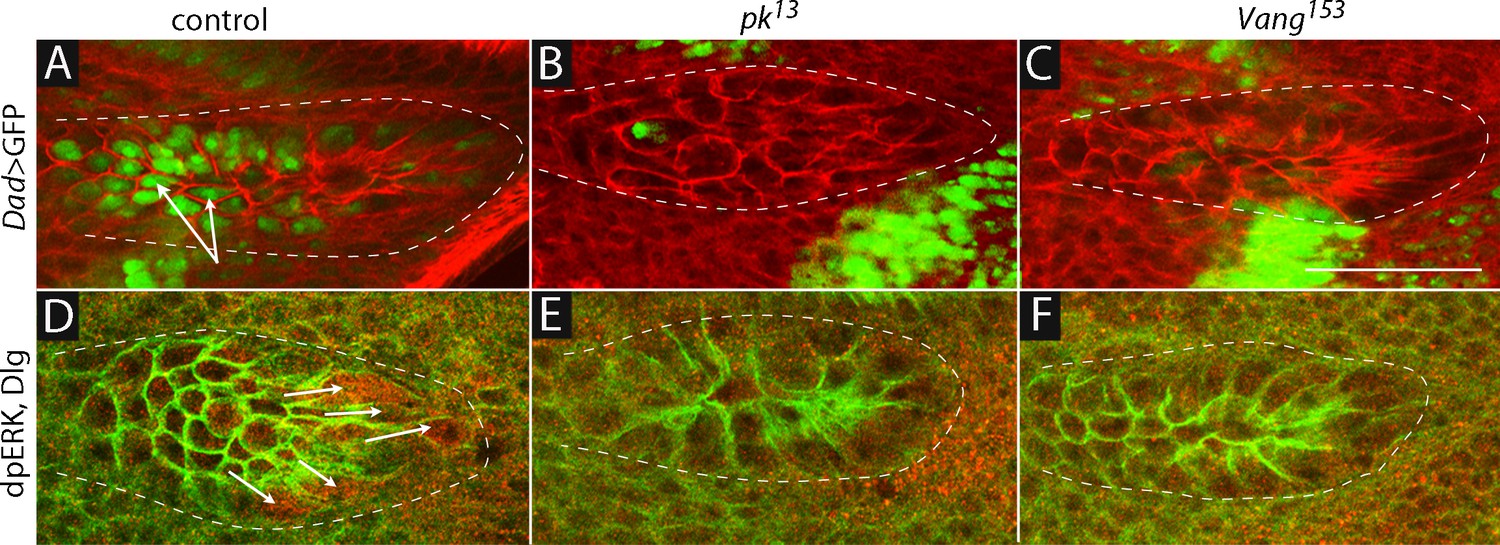
Dpp and FGF signaling in the ASP depend on Prickle and Van Gogh.
(A–C) Dad-GFP expression in control (+/+; Dad-GFP/+), pk mutant (pk13/pk13; Dad-GFP/+) and Vang mutant (Vang153/Vang153; Dad-GFP/+) ASPs marked with α-Dlg. (D–F) dpERK staining in control, pk13 mutant and Vang153mutant flies. The mutant ASPs (B,C,E,F) were selected because their morphology most approximated normal. Arrows point to the ASP cells expressing Dad-GFP (A) and dpERK (D). Scale bar: 50 µm.
Figure 5 with 2 supplements
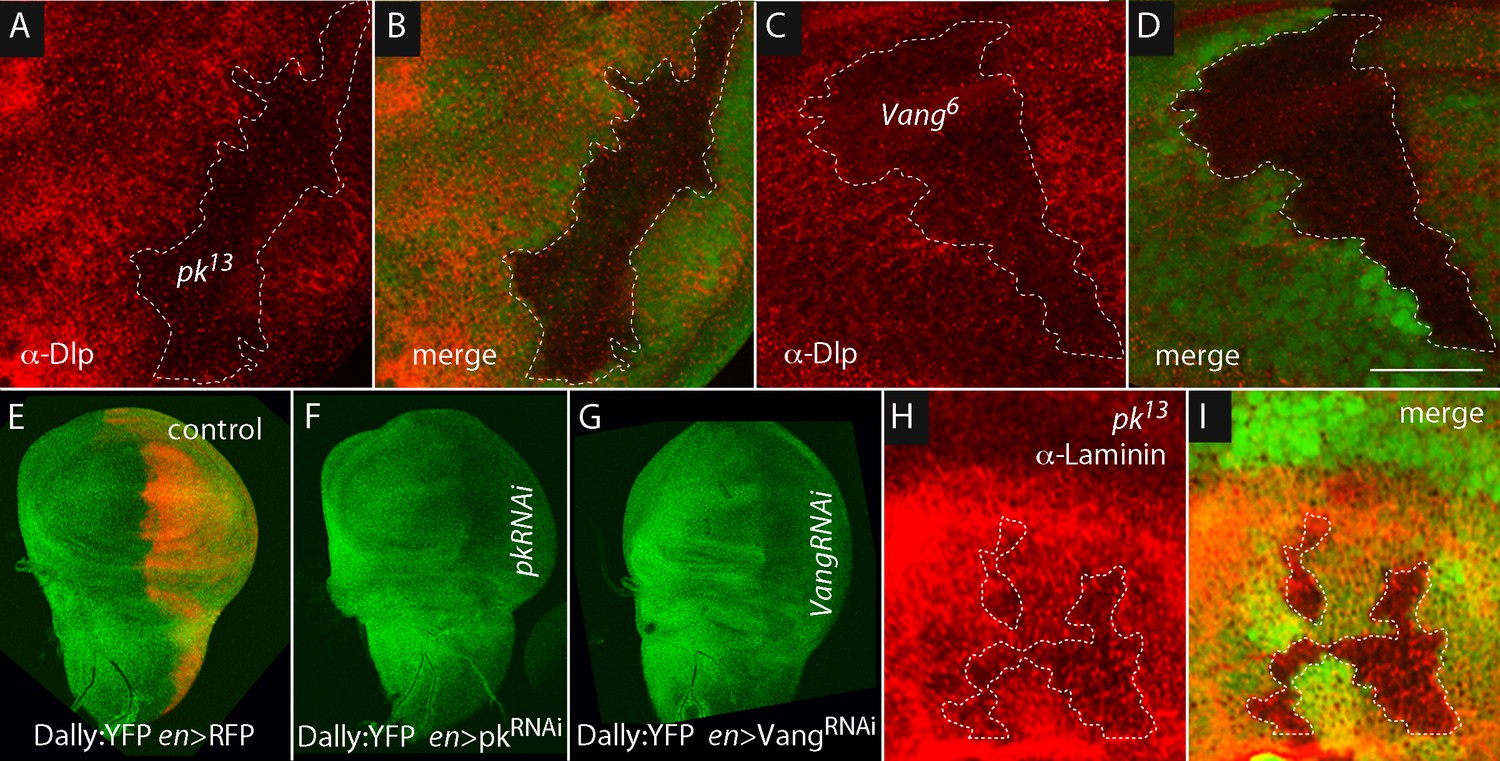
Dally and Dlp depend on Prickle and Van Gogh.
Levels of Dlp were reduced in pk13 (A,B) and Vang6 (C,D) mutant clones (outlined with dashed white lines and lacking green fluorescence). (E–G) Levels of fluorescence in the wing discs of the protein trap Dally:YFP line were relatively uniform in controls (en-Gal4 UAS-RFP/+; dally:YFP/+), but were reduced specifically in the posterior compartment in the presence of pkRNAi (en-Gal4/+; dally:YFP/UAS-pkRNAi) and VangRNAi (en-Gal4/UAS-VangRNAi; dally:YFP/+). (H,I) Levels of Laminin detected by α-Laminin antibody staining (red) were reduced in pk13 mutant clones (outlined with dashed white line and lacking green fluorescence). Scale bar: 50 µm.
-
Figure 5—source data 1
Quantification of fluorescence intensity of α-Dlp staining, Dally:YFP and α-Laminin staining.
- https://doi.org/10.7554/eLife.18979.015
Figure 5—figure supplement 1
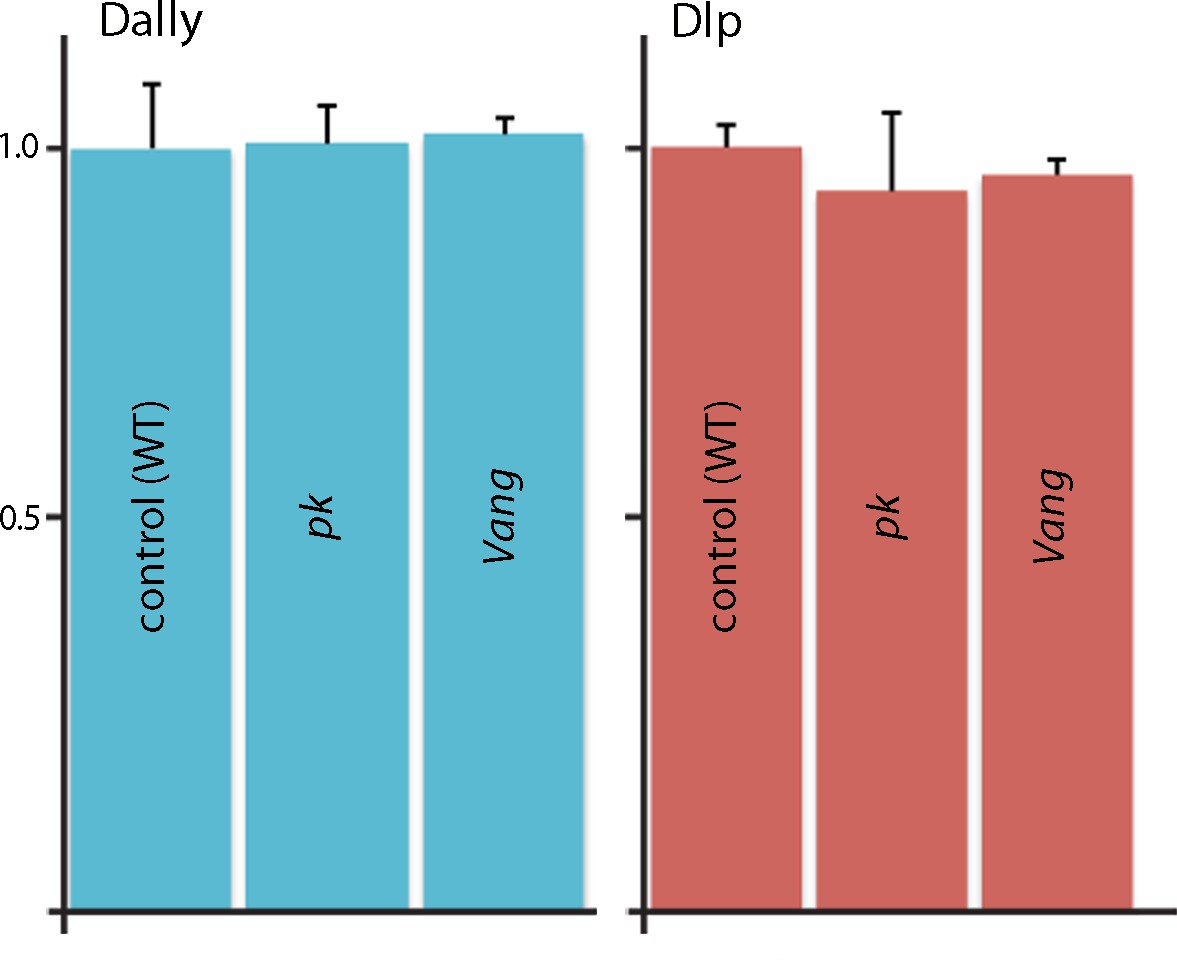
Quantification of Dally and Dlp transcripts in Prickle and Van Gogh mutant wing discs.
qRT-PCR was carried out to monitor expression of Dally and Dlp in normal, pk and Vang wing discs. Bar graph plots qRT-PCR for the Dally and Dlp transcripts relative to actin.
-
Figure 5—figure supplement 1—source data 1
Threshold cycles for dally, dlp and actin transcripts in wild-type, pk mutants and Vang mutants.
- https://doi.org/10.7554/eLife.18979.017
Figure 5—figure supplement 2
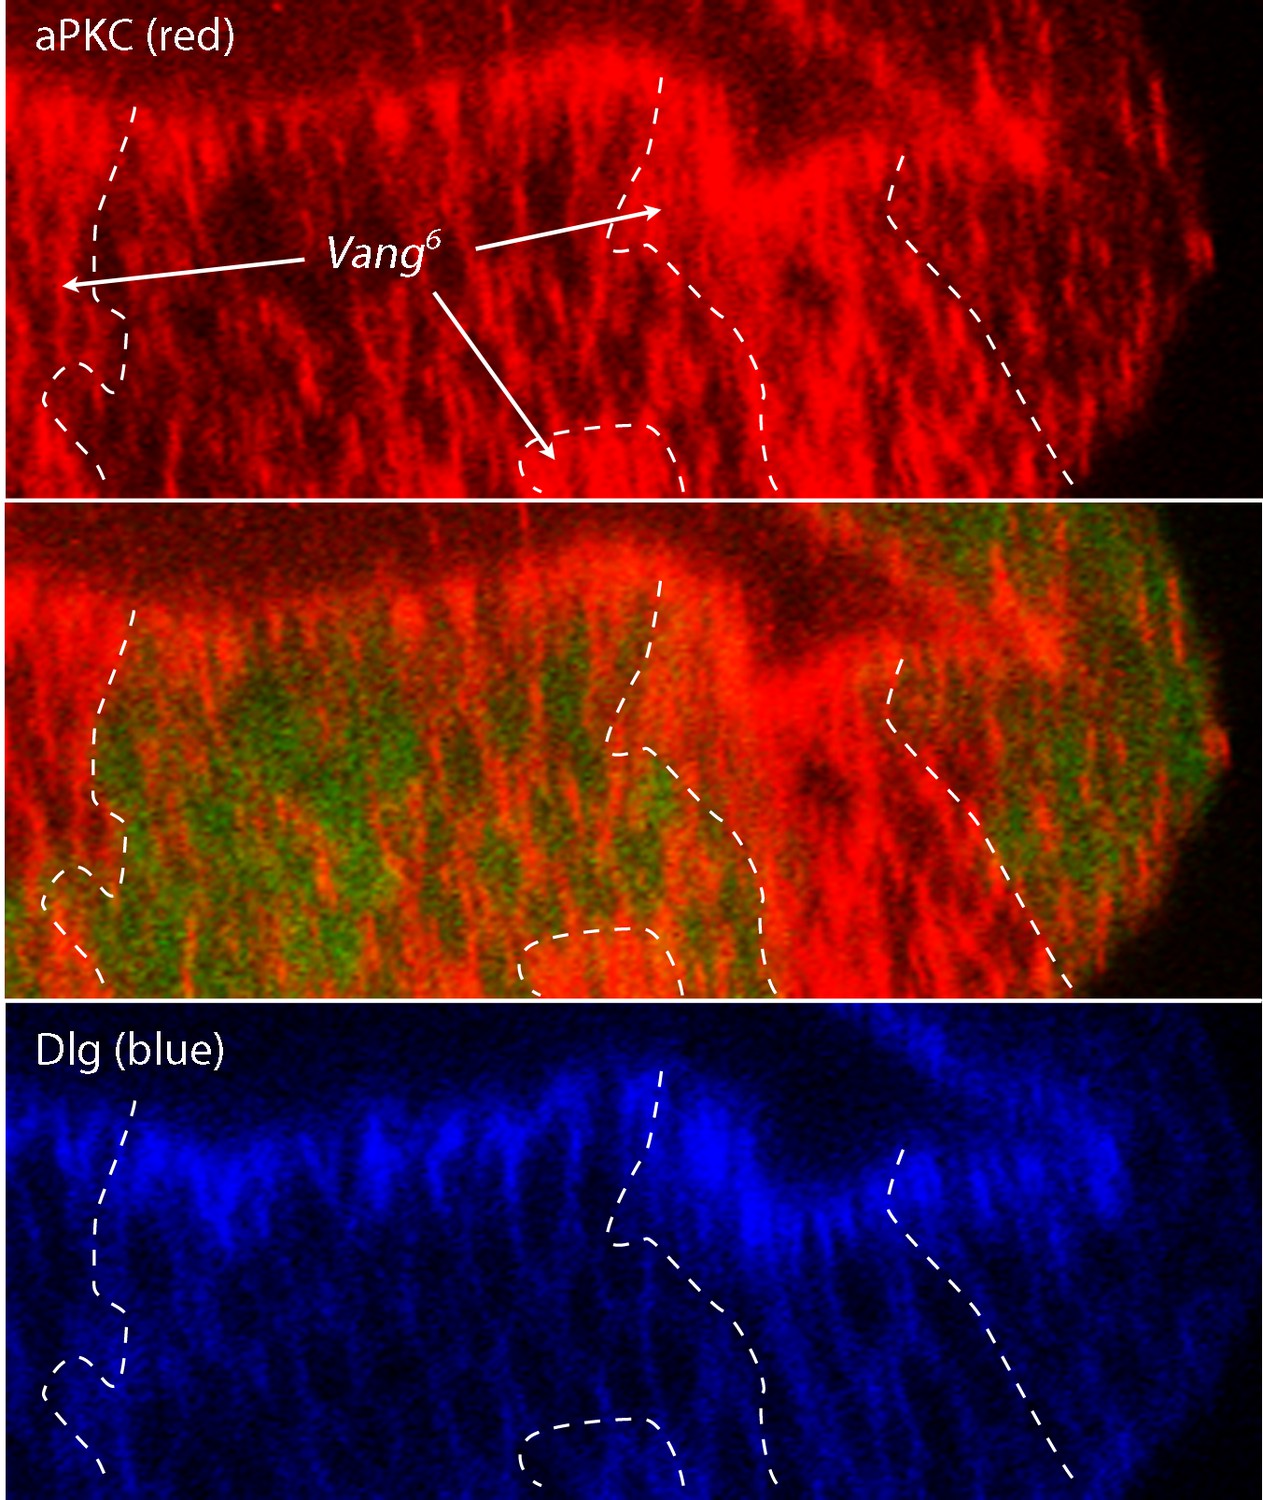
Abnormal apical/basal polarity in Van Gogh mutant cells.
Image J-generated sagittal sections showing clones of Vang6 mutant cells (areas lacking GFP fluorescence and bounded by white dashed lines) had elevated levels of atypical Protein Kinase C (red, α–aPKC antibody staining), which is normally localized to the apical membrane domain and is downregulated by the PCP system. Discs large (α–Dlg antibody staining), which localizes basolaterally, was not apparently affected in the Vang6 mutant cells.
Figure 6

ASP cytonemes and ASP signal transduction depend on HSPG expression in underlying disc cells.
(A–C) CD8:Cherry expression in the ASP (driven by btl-Gal4) marks the ASP and ASP cytonemes in control (A), dally (B) and dlp (C) mutants. Arrows and arrowheads indicate tip and medial cytonemes, respectively. (D–F) FGF signaling monitored by levels of dpERK staining (arrows) were similar in control (D; ap-Gal4/+; btl-LHG lexO-CD2:GFP/+) and dally knockdown (E; ap-Gal4/UAS-dallyRNAi; btl-LHG lexO-CD2:GFP/UAS-dallyRNAi) ASPs, but was reduced by expression of dlpRNAi (F; ap-Gal4/+; btl-LHG lexO-CD2:GFP/UAS-dlpRNAi). (G–I) ASPs marked by α-Dlg staining and Dpp signaling monitored by Dad-GFP fluorescence (arrows) in control (G; ap-Gal4/+; Dad-GFP/+), dally knockdown (H; ap-Gal4/UAS-dallyRNAi; Dad-GFP/UAS-dallyRNAi), and dlp knockdown (I; ap-Gal4/+; Dad-GFP/UAS-dlpRNAi) ASPs. (J) R plots depicting number and orientation of cytonemes in five control and five mutant discs. (K–N) ASP and ASP cytonemes (arrows) were marked by Btl:Cherry (K,L) or by Tkv:Cherry (M,N) and clones of dally (K,M) and dlp (L,N) are indicated by white dashed lines and absence of GFP. (K) hs-FLP/+; btl-Gal4 UAS-Btl:Cherry/+; FRT2A GFP/dally80 FRT2A; (L) hs-FLP/+; btl-Gal4 UAS-Btl:Cherry/+; FRT2A GFP/dlpA187 FRT2A; (M) hs-FLP/+; btl-Gal4 UAS-Tkv:Cherry/+; FRT2A GFP/dally80 FRT2A; (N) hs-FLP/+; btl-Gal4 UAS-Tkv:Cherry/+; FRT2A GFP/dlpA187 FRT2A. Scale bars: 25 µm.
-
Figure 6—source data 1
Figure 6 data - Cytoneme and fluorescence quantification.
(A–C) Numbers of ASP cytonemes in dally and dlp mutants. (D–I) Quantification of Dad-GFP signal and dpERK staining in the ASPs of control, dallyRNAi and dlpRNAi flies. (J) Orientations of ASP cytonemes in control, dally and dlp mutants.
- https://doi.org/10.7554/eLife.18979.020
Figure 7

ASP cytonemes navigate in a stratified ECM.
(A–C) Btl:Cherry and Tkv:GFP expressed simultaneously in the ASP (btl-Gal4 UAS-Btl:Cherry/+; UAS-Tkv:GFP/+) of a early to mid stage L3. (A) Sagittal representation from a composite projection and frontal optical sections (B,C) showing ASP cytonemes (arrows) marked by either Btl:Cherry or Tkv:GFP. Tkv:GFP-containing cytonemes lay in focal planes more distant (distal) from the wing disc than cytonemes with Btl:Cherry. (D) Sagittal representation from a composite projection showing and early to mid L3 stage wing disc expressing a dally:YFP protein trap and stained with α-Dlp antibody (red) and F-actin (blue). The approximate position of ASP indicated by dashed white line; disc is below and not visible in this image. (E) Sagittal representation from a merged composite projection showing wing disc expressing a Viking:GFP protein trap that marks collagen (green), and stained with antibodies against laminin (red) and Dlp (blue). The approximate position of ASP is indicated by dashed white line. (F) Drawings showing our interpretations of the relative locations in an early to mid stage L3 disc of ASP (gray), collagen (green; restricted to the most distal layer), laminin (textured, yellow; most abundant distally and extending proximally to the disc surface), Dally (rose; broadly distributed) and Dlp (lavender; proximal to disc), and Tkv-containing (green) and Btl-containing (red) cytonemes. Scale bars: 20µm.
Figure 8 with 1 supplement
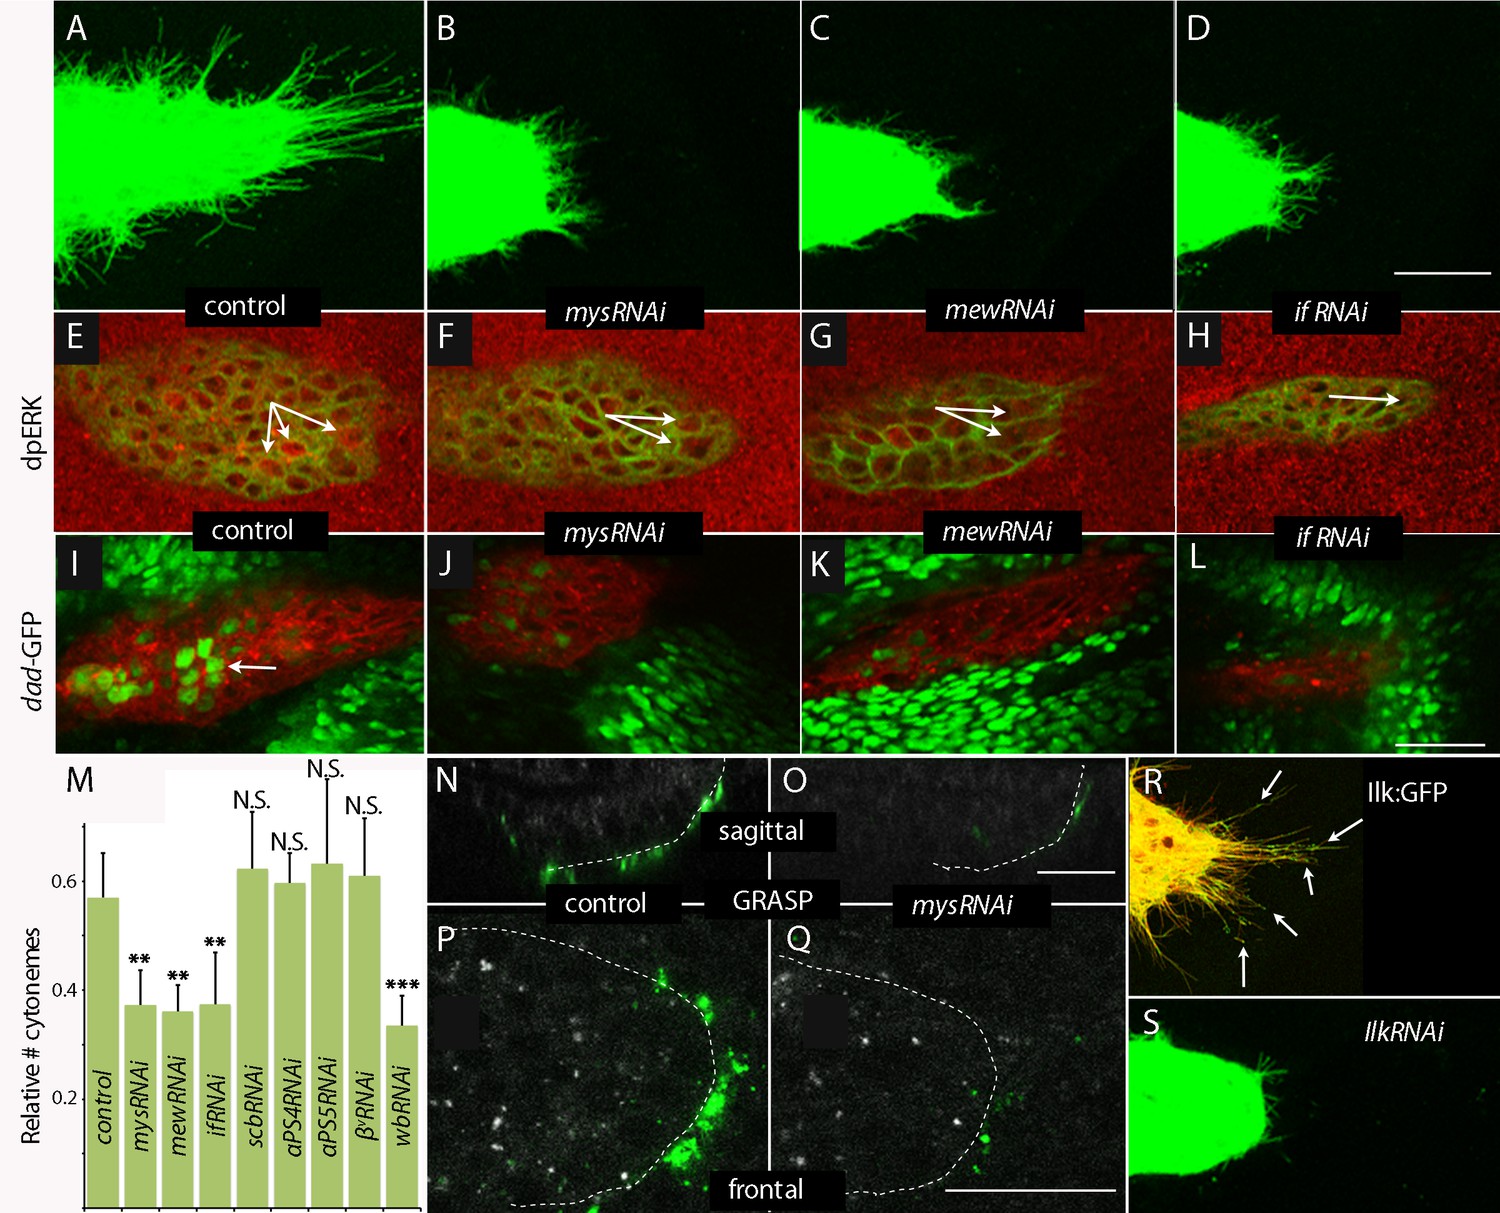
Cytoneme-mediated transport requires integrin.
(A–D) ASP cytonemes were shorter in ASPs that expressed RNAi against integrin subunits encoded by mys, mew and if. (E–L) ASP cells active in FGF signal transduction were detected with α-dpERK antibody (E) and cells active in Dpp signal transduction were detected by GFP fluorescence (I) in control but not in ASPs depleted of mys, mew or if (F–H, J–L). Arrows point to the ASP cells that express dpERK. Genotypes: (A,E) btl-Gal4 UAS-CD8:GFP/+; (B,F) btl-Gal4 UAS-CD8:GFP/UAS-mysRNAi; (C,G) btl-Gal4 UAS-CD8:GFP/UAS-mewRNAi; (D,H) btl-Gal4 UAS-CD8:GFP/+; UAS-ifRNAi/+; (I) btl-Gal4 UAS-CD8:Cherry/+; dad-GFP/+; (J) btl-Gal4 UAS-CD8:Cherry/UAS-mysRNAi; dad-GFP/+; (K) btl-Gal4 UAS-CD8:Cherry/UAS-mewRNAi; dad-GFP/+; (L) btl-Gal4 UAS-CD8Cherry/+; dad-GFP/UAS-ifRNAi. (M) Bar graph plots the relative number of cytonemes in ASPs of control and RNAi-mediated integrin-depleted larvae. Error bars: standard deviation; **p<0.01; N.S., not significant. (N–Q) Sagittal and frontal images showing green fluorescence of reconstituted GFP (GRASP) at contacts between ASP cytonemes and Dpp-expressing cells. ASPs outlined by dashed white lines. Genotypes: (N,P) btl-Gal4 dpp-LHG/+; UAS-CD4:GFP1-10 lexO-CD4:GFP11/+; (O,Q) btl-Gal4 dpp-LHG/UAS-mysRNAi; UAS-CD4:GFP1-10 lexO-CD4:GFP11/+. (R) Localization of ILK:GFP (arrows) in ASP cytonemes (btl-Gal4 UAS-CD8:Cherry/UAS-ILK:GFP). (S) Number and length of ASP cytonemes was reduced with expression of ilkRNAi (btl-Gal4 UAS-CD8:GFP/UAS-ilkRNAi). Scale bars: 25 µm.
-
Figure 8—source data 1
Figure 8 data - Cytoneme and fluorescence quantification.
(A–D) Numbers of ASP cytonemes in control and mysRNAi, mewRNAi and ifRNAi flies. Numerical data are represented as a graph in Figure 8M. (E–L) Quantification of dpERK staining and Dad-GFP fluorescence in the ASPs of control and mysRNAi, mewRNAi and ifRNAi flies.
- https://doi.org/10.7554/eLife.18979.023
Figure 8—figure supplement 1
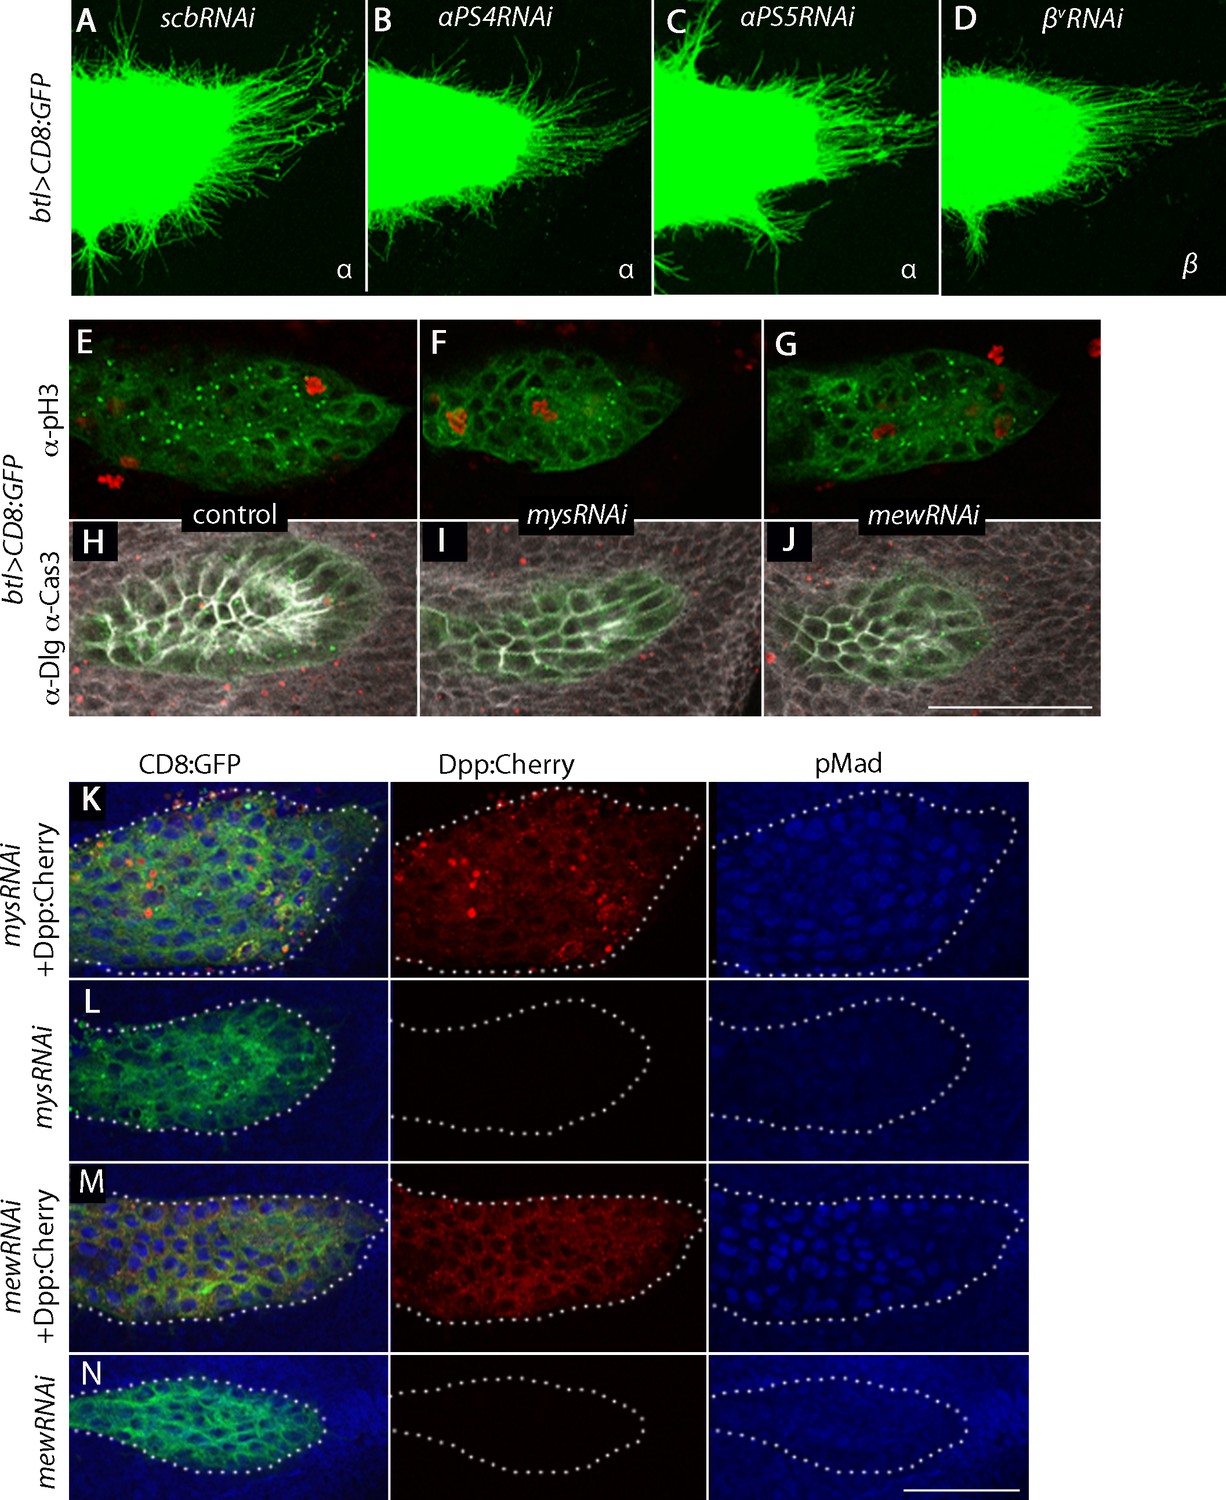
Integrin receptors in the ASP.
(A–D) RNAi targeting integrin α subunits, scb and αPS4, or β subunit, βv, did not reduce the number of ASP cytonemes. Genotypes: (A) btl-Gal4 UAS-CD8:GFP/+; UAS-scbRNAi/+; (B) btl-Gal4 UAS-CD8:GFP/UAS-αPS4RNAi; (C) btl-Gal4 UAS-CD8:GFP/+; UAS-αPS5RNAi; (D) btl-Gal4 UAS-CD8:GFP/+; UAS–βvRNAi/+. (E–J) Number of mitotic cells (E–G), and number of apoptotic cells and cell shape (H–J) was unchanged in ASPs with RNAi targeting mys or mew relative to control. (E–G) stained with a-pH3 antibody; (H–J) stained with α-Caspase-3 and α-Dlg antibodies. Genotypes: (E,H) btl-Gal4 UAS-CD8:GFP/+; (F,I) btl-Gal4 UAS-CD8:GFP/UAS-mysRNAi; (G,J) btl-Gal4 UAS-CD8:GFP/UAS-mewRNAi. (K–N) ASP cells with reduced expression of mys and mew integrins activated Dpp signaling (monitored by α-pMad (blue)) in the presence of ectopic Dpp:Cherry expression (red). Genotypes: (K) btl-Gal4 UAS-CD8:GFP/UAS-mysRNAi; UAS-Dpp:Cherry/+; (L) btl-Gal4 UAS-CD8:GFP/UAS-mysRNAi; Gal80ts/+; (M) btl-Gal4 UAS-CD8:GFP/UAS-mewRNAi; UAS-Dpp:Cherry/+; (N) btl-Gal4 UAS-CD8:GFP/UAS-mewRNAi; Gal80ts/+. Scale bar: 50 µm.
-
Figure 8—figure supplement 1—source data 1
Numbers of ASP cytonemes in scbRNAi, αPS4RNAi, βvRNAi and αPS5RNAi flies.
Numerical data are represented as a graph in Figure 8M.
- https://doi.org/10.7554/eLife.18979.025
Figure 9

Genetic interaction between laminin mutants and integrin mutants.
(A,E,I) RNAi targeting expression of the laminin gene wb in the wing disc -altered ASP morphology and reduced ASP cytonemes (A) and reduced Dpp (dad-GFP fluorescence; E) and FGF signaling (α-dpERK staining; I). Genotypes: (A,I) ap-Gal4/+; btl-LHG lexO-CD2:GFP/UAS-wbRNAi; (E) ap-Gal4/+;dad-GFP/UAS-wbRNAi. (B–D, F–H, J–L) ASP morphology and number of ASP cytonemes (B,C), Dpp signaling (F,G) and FGF signaling (J,K) was normal in mew and wb heterozygotes but not in mew wb double heterozygotes (D,H,L). Arrows indicate signaling cells and dashed white lines indicate ASPs. Genotypes: (B) mewM6/+; btl-LHG lexO-Cherry-CAAX/+; (C) wb3/+; btl-LHG lexO-Cherry-CAAX/+; (D) mewM6/+; wb3/+; btl-LHG,lexO-Cherry-CAAX/+; (F) mewM6/+; dad-GFP/+; (G) wb3/+; dad-GFP/+; (H) mewM6/+; wb3/+; dad-GFP/+; (J) mewM6/+; (K) wb3/+; (L) mewM6/+; wb3/+. (J–L) Staining was with α-Dlg and α-dpERK antibodies. Scale bar: 25 µm.
-
Figure 9—source data 1
Figure 9 data - Cytoneme and fluorescence quantification.
(A) The number of ASP cytonemes of ap>wbRNAi flies. (B–D) The numbers of ASP cytonemes in mew/+, wb/+ and mew/+; wb/+ flies. (E,I) Quantification of Dad-GFP fluorescence and dpERK staining in ap>wbRNAi flies. (F–H) Quantification of Dad-GFP fluorescence in mew/+, wb/+ and mew/+; wb/+ flies. (J–L) Quantification of dpERK staining in mew/+, wb/+ and mew/+; wb/+ flies.
- https://doi.org/10.7554/eLife.18979.027
Tables
Table 1
Expression of RNAi directed against PCP component genes.
| PCP genes | btl-Gal4 | ap-Gal4 |
|---|---|---|
| frizzled | – | – |
| disheveled | – | – |
| Van Gogh | – | reduced |
| prickle | – | small |
| flamingo | – | – |
| diego | – | – |
| fat | – | – |
| dachsous | – | – |
| four-jointed | – | – |
| Grunge | – | small |
| Casein Kinase 1ε (discs overgrown) | – | – |
| G protein o α47A (brokenheart) | – | – |
| Dishevelled Associated Activator of Morphogenesis | – * | – |
| dRac1 | small | – |
| dRhoA | small | small |
| misshapen | abnormal | – |
| Rho Kinase (drok) | small | – |
| multiple wing hair (mwh) | 2 ASP | 2 ASP |
| nemo | – | – |
| mushroom body defect | – | – |
| kugelei | – | – |
| Leukocyte-antigen-related-like (Lar) | no ASP | abnormal |
-
“–” normal ASP.
-
* lethal; repression by Gal80ts relieved for 18 hr at third instar.
Table 2
Numbers of ASP cytonemes in PCP system, HSPG and integrin pathway, mutants.
| ASP cytonemes in prickle and Van Gogh mutants | ||
|---|---|---|
| Genotype | # cytonemes per µm* | t-test† |
| btl-LHG,lexO-Cherry:CAAX/+ | 0.66 ± 0.07 | p value |
| pkpk-sple-13/pkpk-sple-13; btl-LHG,lexO-Cherry:CAAX/+ | 0.28 ± 0.07 | 2.09E-05 |
| Vang153/Vang153; btl-LHG,lexO-Cherry:CAAX/+ | 0.35 ± 0.05 | 3.65E-05 |
| btl-Gal4,UAS-CD8:mCherry/+;dally80/dally80 | 0.28 ± 0.05 | 9.24E-06 |
| btl-Gal4,UAS-CD8:mCherry/+;dlpA187/dlpA187 | 0.46 ± 0.06 | 9.85E-04 |
| ASP cytonemes in wingblister and multiple edematous wings mutants | ||
|---|---|---|
| Genotype | # cytonemes per µm* | t-test† |
| btl-LHG,lexO-Cherry:CAAX/+ | 0.68 ± 0.14 | P value |
| mewM6/+;; btlLHG,lexO-Cherry-CAAX/+ | 0.57 ± 0.09 | 0.19‡ |
| wb3/+; btlLHG,lexO-Cherry-CAAX/+ | 0.58+0.08 | 0.21‡ |
| mewM6/+; wb3/+; btlLHG,lexO-Cherry-CAAX/+ | 0.30 ± 0.09 | 1.02E-03 |
-
* cytonemes were counted around approximately one-half the perimeter of the ASP in images generated as projection stacks from approximately 20–25 optical sections.
-
† significance for each genotype was calculated against the btl>Cherry:CAAX controls.
-
‡ not significant.
Download links
A two-part list of links to download the article, or parts of the article, in various formats.
Downloads (link to download the article as PDF)
Open citations (links to open the citations from this article in various online reference manager services)
Cite this article (links to download the citations from this article in formats compatible with various reference manager tools)
Cells must express components of the planar cell polarity system and extracellular matrix to support cytonemes
eLife 5:e18979.
https://doi.org/10.7554/eLife.18979


