TIR1/AFB-Aux/IAA auxin perception mediates rapid cell wall acidification and growth of Arabidopsis hypocotyls
- Institute of Science and Technology Austria, Austria
- INRA - Centre de Versailles-Grignon, Saclay Plant Science, France
Figures
Figure 1
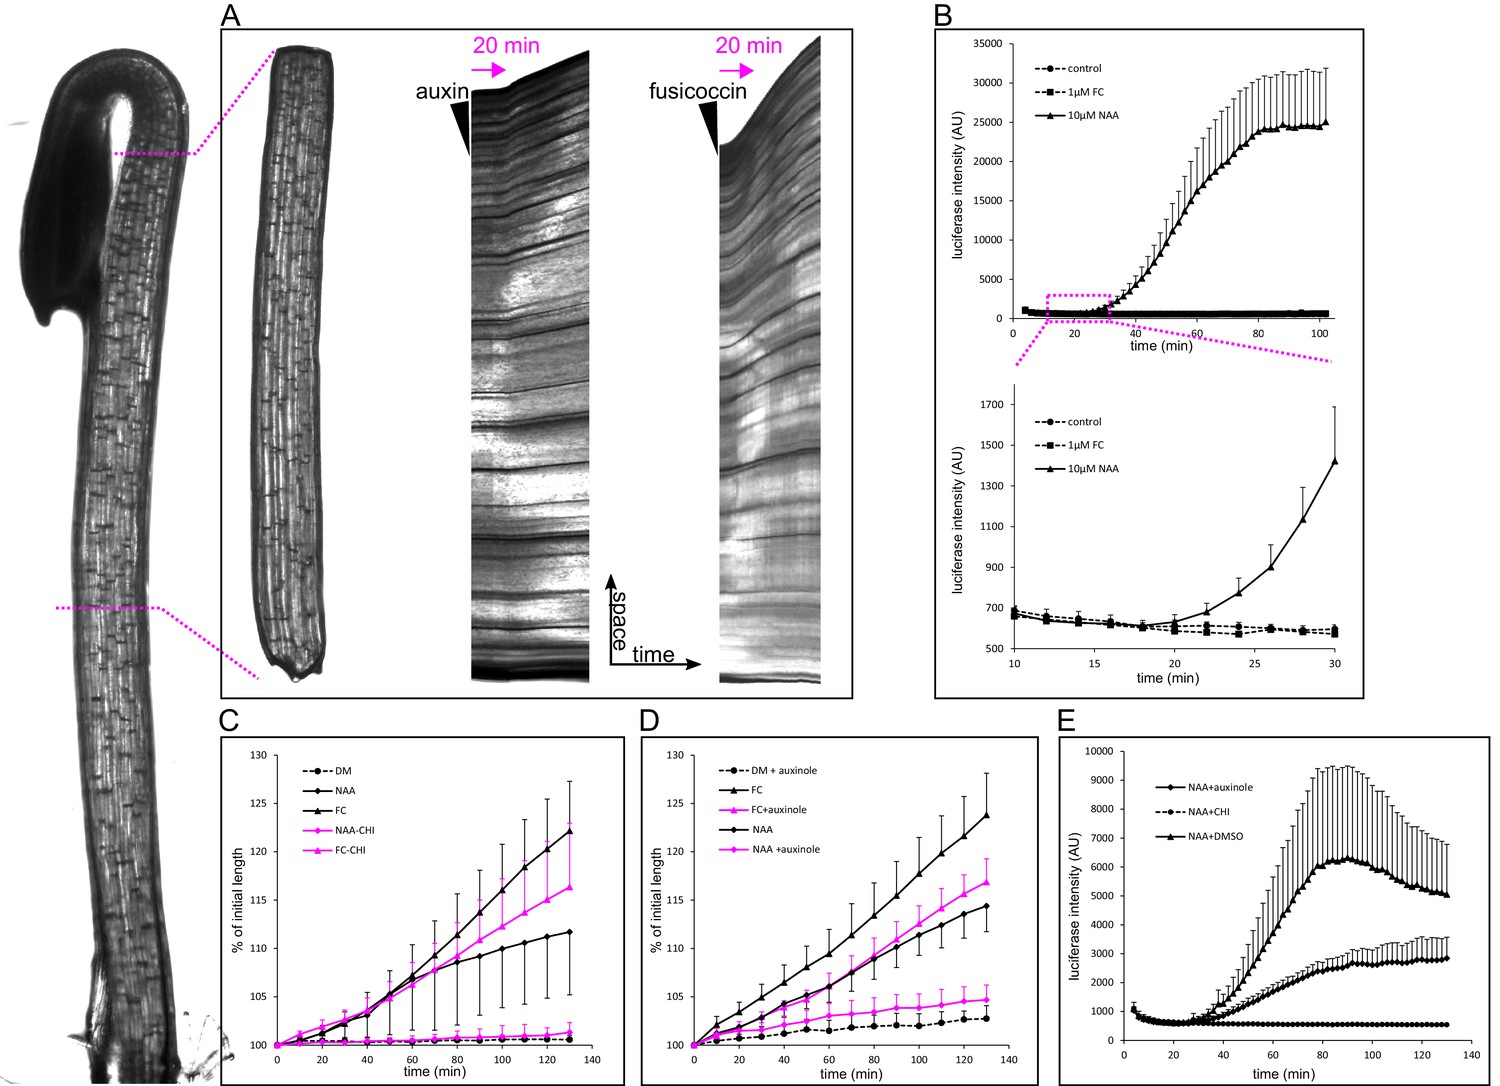
Auxin-triggered growth of hypocotyl segments correlates with nuclear auxin signaling.
(A) A brightfield image of a three-day old etiolated Arabidopsis hypocotyl and the corresponding decapitated hypocotyl segment used in the elongation assay. On the right, kymographs of growing hypocotyls right after application of 10 µM NAA or 5 µM FC (black arrowhead). A lag phase of 20 min preceding the rapid growth is apparent in the case of NAA. The lag phase is shorter in the case of FC. Arrow indicates 20 min. (B) Transcriptional auxin response of hypocotyl segments visualized by the DR5::LUC reporter. Auxin response can be detected 20 min after auxin application. There is no response in the control and fusicoccin treatment. Each curve corresponds to 4 hypocotyl segments, errorbars are stdev.s. The lower graph depicts the onset of DR5::LUC response. (C) Hypocotyl segments do not elongate on the depletion medium (DM); auxin (10 µM NAA) and 1 µM fusicoccin (FC) trigger segment elongation. The protein synthesis inhibitor cycloheximide (50 µM CHI) completely blocks auxin-induced elongation, while FC-induced elongation is only mildly affected by CHI. (D) Auxinole (50 µM), an inhibitor of the TIR1/AFB auxin receptor, largely inhibits auxin induced hypocotyl elongation; the FC-triggered elongation is less affected. In (C) and (D), each curve corresponds to 6 hypocotyl segments, auxinole and CHI were applied during the depletion phase (30 min before auxin treatment); errorbars are stdev.s. (E) CHI completely blocks DR5::LUC auxin response, and auxinole diminishes the response. NAA (10 µM) was applied at timepoint 0; auxinole and CHI (both 50 µM) were present during the depletion phase (30 min before auxin treatment). Quantification as in B).
-
Figure 1—source data 1
Numerical data for the graphs.
- https://doi.org/10.7554/eLife.19048.003
Figure 2
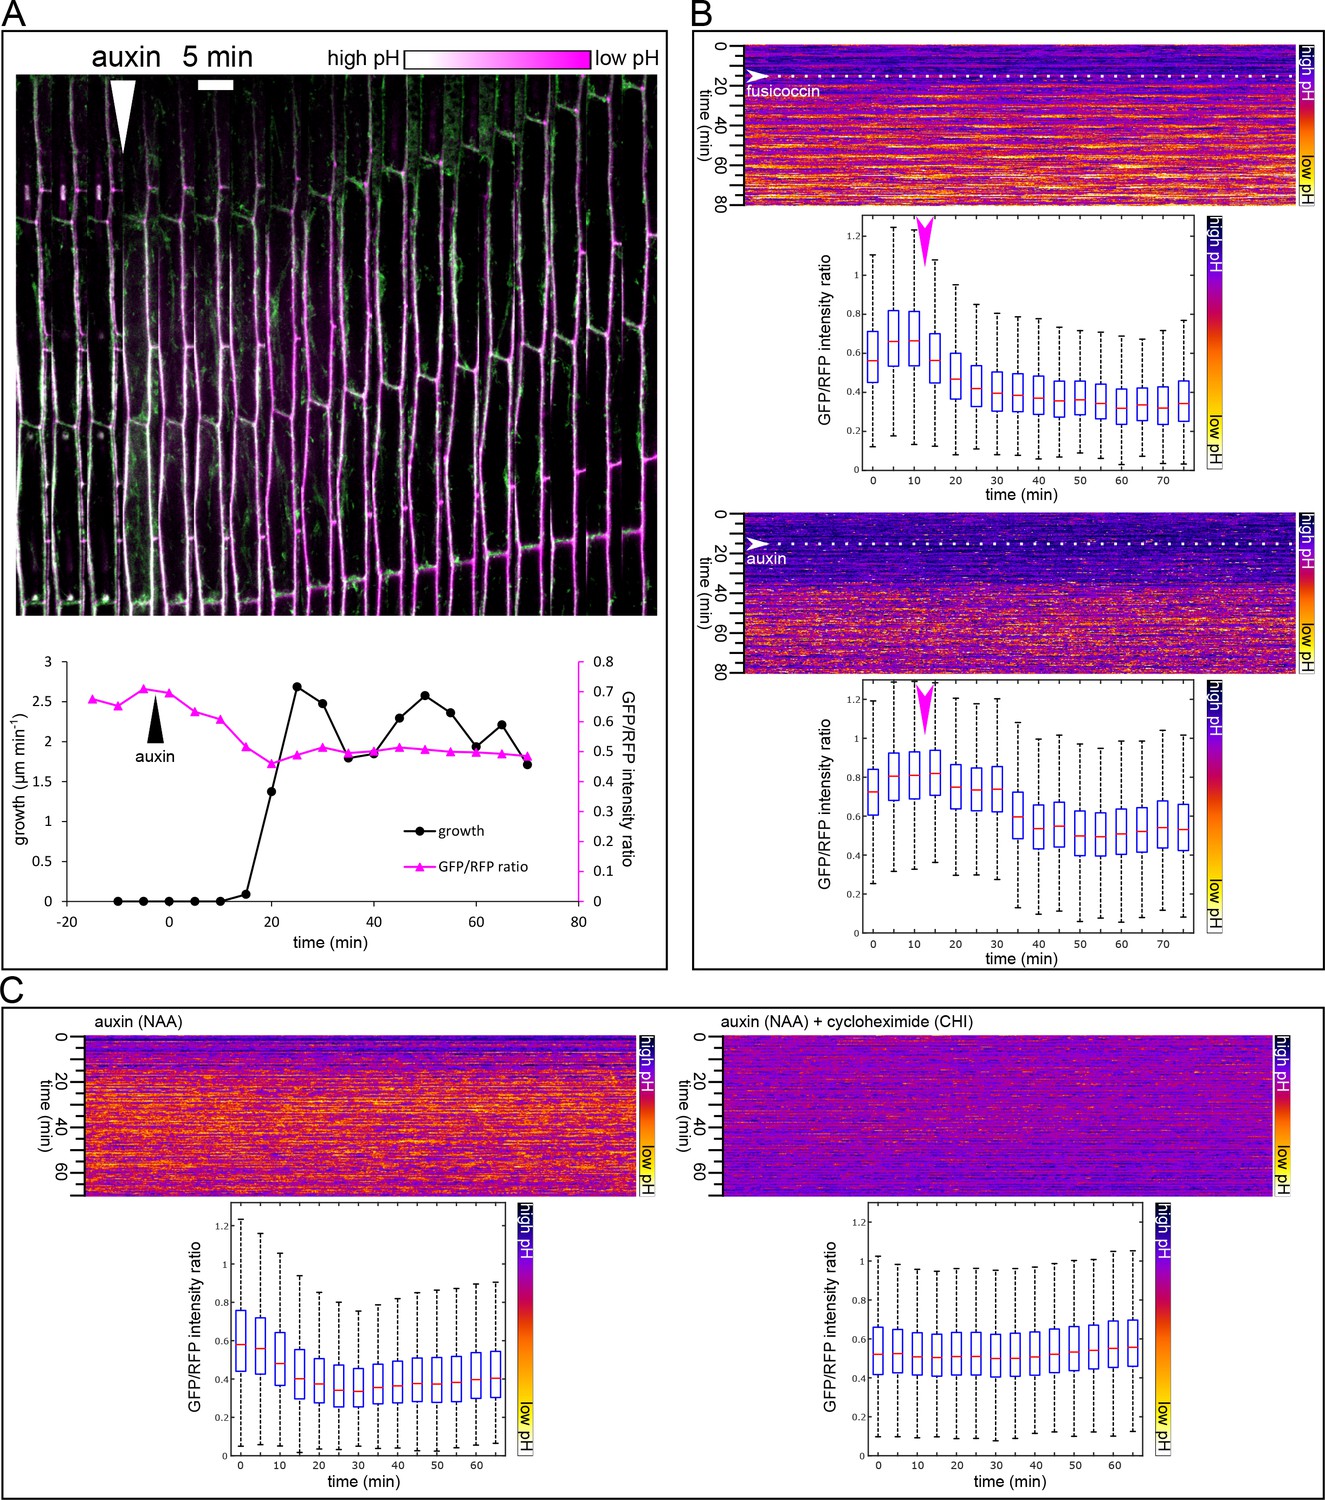
Apoplast acidification visualized by the apo-pHusion marker line.
(A) Apoplast acidification and cell elongation follow approximately 20 min after auxin application (white arrowhead). A region of a hypocotyl segment of the apo-pHusion marker line is shown in time (timestep 5 min). Apoplastic pH is approximated by the ratio between RFP (insensitive to pH) and GFP intensities (quenched by low pH). RFP is shown in magenta, GFP in green; higher pH appears white and lower pH magenta. Bellow, a quantification of growth and apoplastic pH of the same hypocotyl segment. (B) AreaKymo visualisation illustrates the apoplastic pH drop that occurs immediately after fusicoccin addition (5 µM), upper panel. In contrast, a lag phase of 20 min follows auxin application (10 µM NAA), after which apoplastic pH drops suddenly (lower panel). FC and NAA were added during imaging as indicated by arrowheads and dotted lines. Each timepoint is represented by a rectangle and consists of cell wall pixels of the original apo-pHusion confocal image; time progresses from top to bottom. The LUT key is shown on the right. Bellow a quantification of the pH drop shown as a series of boxplots. A time series imaging of a single hypocotyl segment was used as input data. (C) Auxin-induced apoplastic pH drop requires protein synthesis. An AreaKymo after application of auxin (10 µM NAA) 4.5 min before imaging. Cycloheximide (CHI 50 µM) completely blocks apoplastic acidification that is apparent in the control situation. Bellow, the quantification is shown; each plot consists of a confocal timelapse imaging of 4 hypocotyl segments.
-
Figure 2—source data 1
Numerical data for the graph 2A.
- https://doi.org/10.7554/eLife.19048.005
Figure 3 with 1 supplement
Nuclear auxin signaling is needed for growth and apoplast acidification.
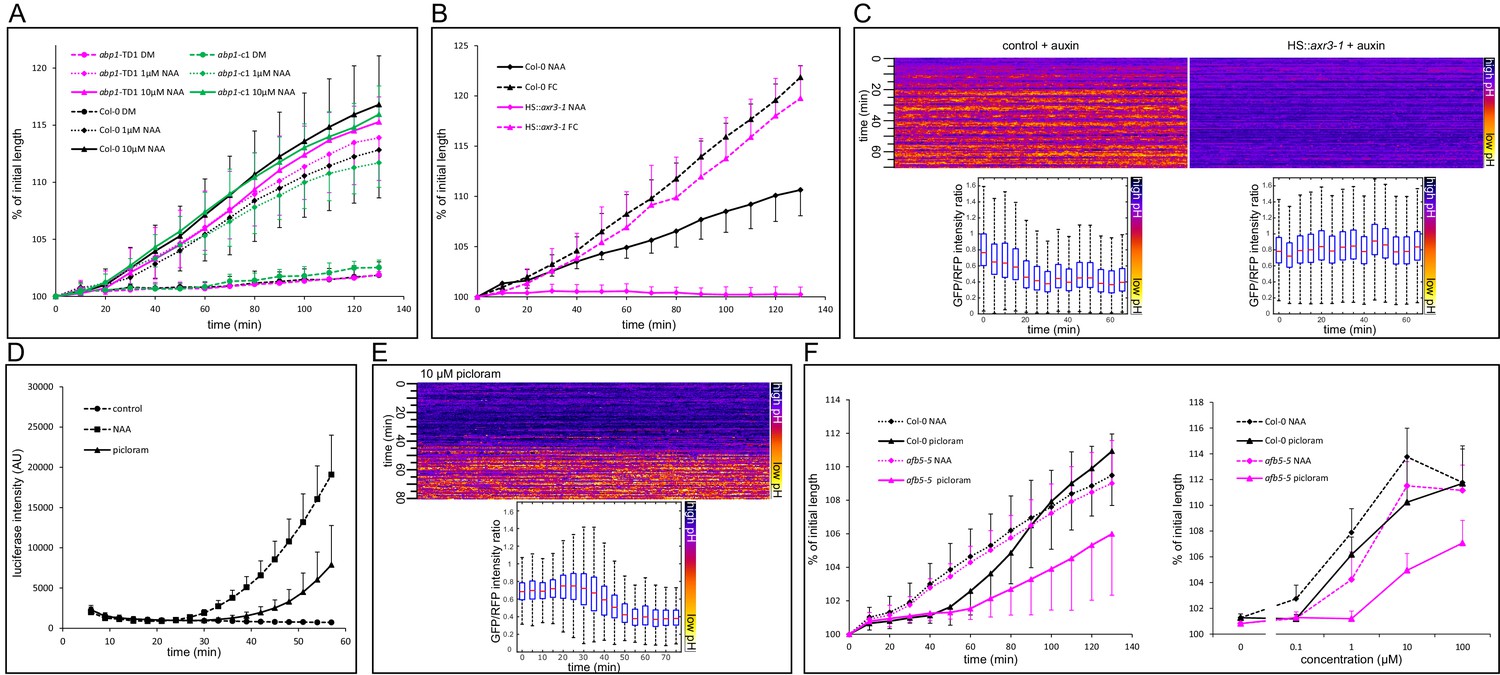
(A) Mutations in the ABP1 gene do not influence auxin-induced hypocotyl elongation. (B) Inhibition of the TIR1/AFB Aux/IAA auxin receptor by the dominant-negative axr3-1 protein completely blocks auxin-induced (10 µM NAA) hypocotyl elongation. The elongation triggered by fusicoccin (1 µM FC) is not affected in the same line. Both HS::axr3-1 and Col-0 seedlings were heatshocked 2 hr before auxin application. (C) Induction of the HS::axr3-1 line completely blocks the auxin-induced apoplastic pH drop. AreaKymo shows that in the control (Col-0 x apo-pHusion), apoplastic pH drops after addition of auxin (10 µM NAA), while this drop is absent in the HS::axr3-1 background. Each plot was constructed from 4 hypocotyl segments, both lines were heat-shocked 2 hr before imaging. (D) The auxin analogue, picloram (10 µM) triggers DR5::LUC auxin response; the response is slower than that of NAA (10 µM). Each curve corresponds to 4 hypocotyl segments, errorbars are stdev.s. (E) Picloram (10 µM) was applied before imaging, apoplastic pH drop occurs approximately 40 min later. An AreaKymo based on 3 hypocotyl segments; quantification is shown in the lower part of the panel. (F) A mutation in the AFB5 auxin co-receptor, afb5-5, leads to decreased sensitivity to picloram-induced hypocotyl elongation. On the left, a timecourse of elongation after 10 µM NAA or picloram is shown. On the right, a dose response curve of Col-0 and afb5-5 to NAA or picloram is presented. In A,B,F, curves correspond to 6 hypocotyl segments, errorbars represent stdev.s.
-
Figure 3—source data 1
Numerical data for the graphs.
- https://doi.org/10.7554/eLife.19048.009
Figure 3—figure supplement 1
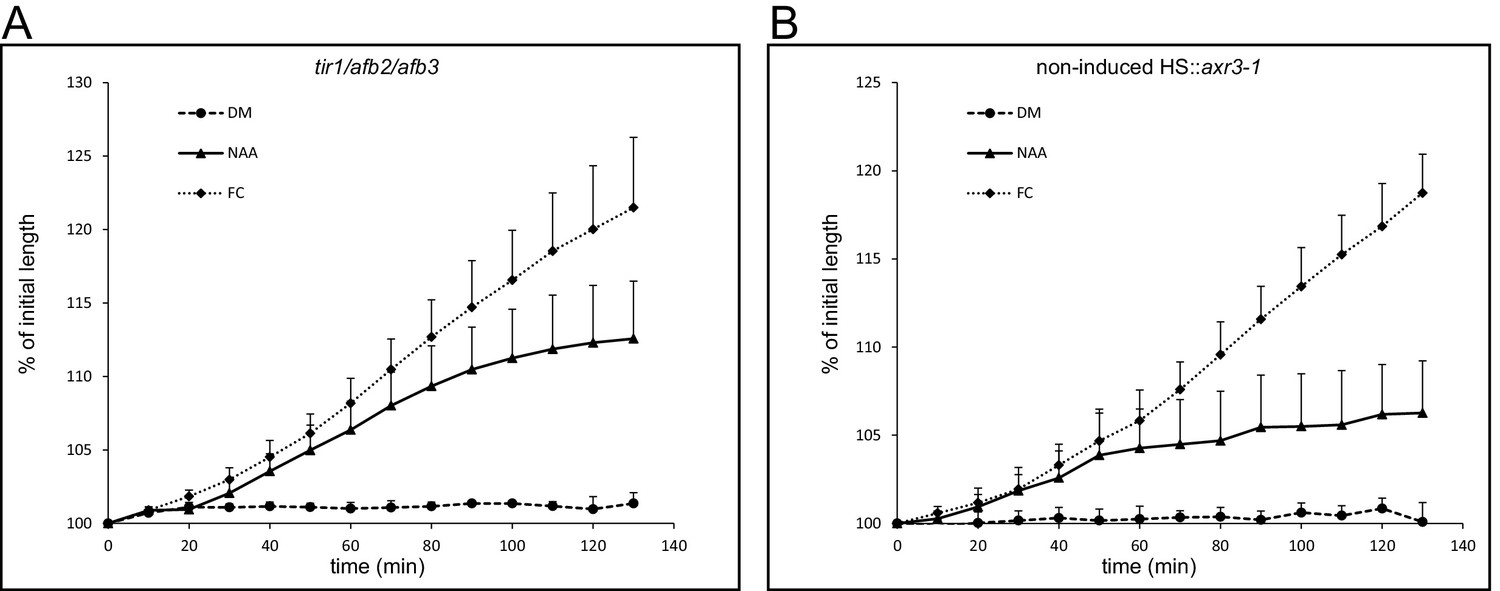
Auxin induced growth of the tir1/afb2/afb3 mutant and the non-induced HS::axr3-1 line.
(A) The tir1-1/afb2/afb3 mutant reacts to auxin (10 µM NAA) and fusicoccin (1 µM) similarly to Col-0. Errorbars represent stdev.s. (B) The non-induced HS::axr3-1 hypocotyl segments also behave as a control – elongate in the presence of auxin (10 µM NAA) and fusicoccin (1 µM). Errorbars represent stdev.s.
-
Figure 3—figure supplement 1—source data 1
Numerical data for the graphs.
- https://doi.org/10.7554/eLife.19048.011
Figure 4
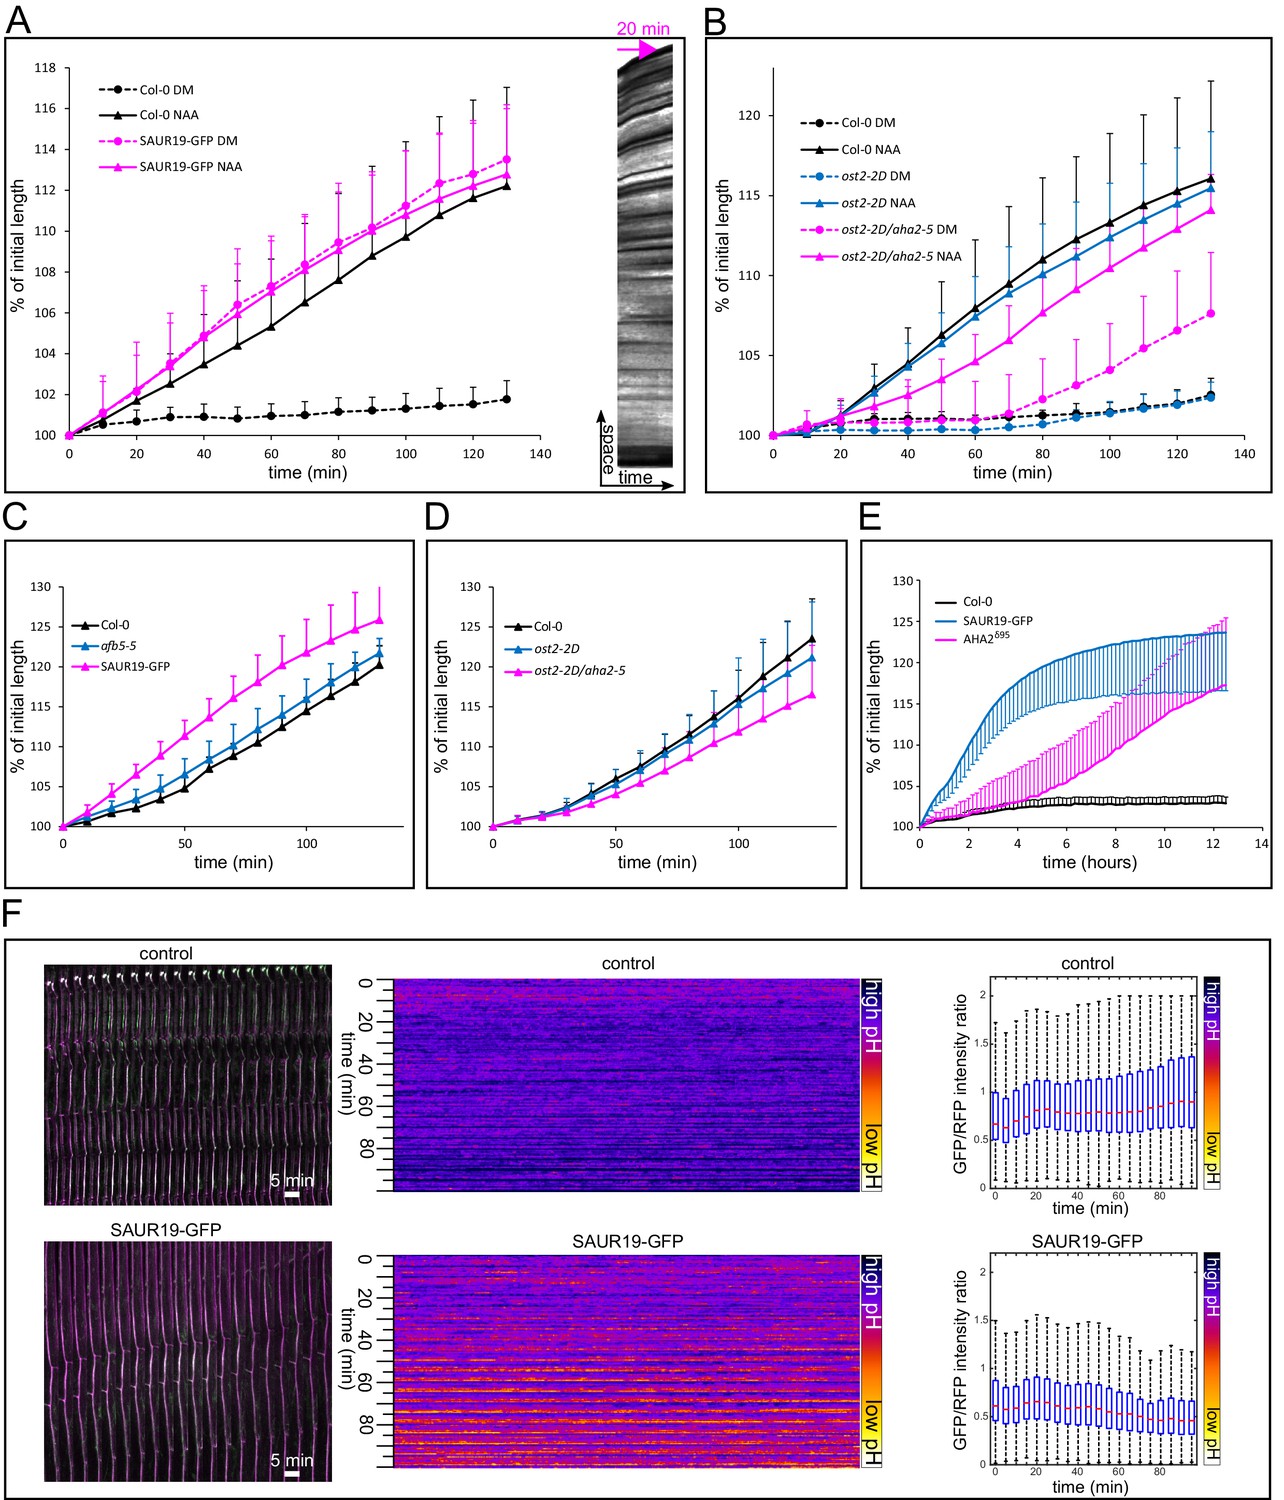
Activation of PM H+-ATPases triggers auxin-independent growth.
(A) The 35S::GFP-SAUR19 hypocotyls elongate in the absence of auxin, and the addition of auxin (10 µM NAA) does not further increase their growth. On the right, a kymograph of a decapitated hypocotyl elongating in the absence of auxin is shown. Arrow represents 20 min. (B) The ost2-2D mutant line with a constitutively active AHA1 PM H+-ATPase does not cause an auxin-independent hypocotyl growth; while the ost2-2D/aha2-5 mutant line elongates in the absence of auxin. (C, D) Elongation of afb5-5, 35S::GFP-SAUR19, ost2-2D and ost2-2D/aha2-5 in the presence of 1 µM fusicoccin. In A-D curves correspond to 6 hypocotyl segments, errorbars represent stdev.s. (E) Hypocotyl segments of AHA2δ95start to elongate approximately four hours after inducing the transgene expression. The autonomous elongation of 35S::GFP-SAUR19 is shown for comparison. Segments were placed on depletion medium with (Col-0 and AHA2δ95) or without (35S::GFP-SAUR19 and another Col-0) 1 µM dexamethasone. Curves correspond to 7–10 hypocotyl segments, errorbars represent stdev.s. (F) 35S::GFP-SAUR19 line has an acidic apoplast and keeps elongating after decapitation in the absence of auxin, while the apoplastic pH of the control rises after decapitation and growth ceases. On the left, a region of a hypocotyl segment of the 35S::GFP-SAUR19 or Col-0 in the apo-pHusion background is shown in time (timestep 5 min). On the right, apoplastic pH of both lines is plotted and quantified using the AreaKymo tool.
-
Figure 4—source data 1
Numerical data for the graphs.
- https://doi.org/10.7554/eLife.19048.013
Figure 5

An asymmetrical acidification of the apoplast is necessary for gravitropism.
(A) The lower epidermal side of a gravistimulated apo-pHusion marker line shows more acidic cell walls than the upper side. Hypocotyl was stimulated for 1 hr, the regions used for apoplastic pH analysis are depicted with dotted lines. SUM projection of a confocal z-stack; a 3 × 1 tilescan image. (B) AreaKymo representation of a control and gravistimulated hypocotyl shows that gravistimulation leads to acidification of cell walls on the lower side of the hypocotyl. The two epidermal sides cell walls are represented as two rectangles, and correspond to areas depicted in A. The quantification is shown on the right as boxplots. (C) Quantification of apoplastic pH in control and gravistimulated (1 hr) hypocotyls of the apo-pHusion marker line. Each point represents GFP/RFP ratio of a single z-section on either epidermal sides of hypocotyls, similar to the areas depicted in A. Note that the ratios cannot be directly compared to Figures 1–3 as these images were acquired using a different microscope and sample setup (see Materials and methods for details). (D) Induction of the axr3-1 protein inhibits hypocotyl gravitropism and growth. On the left, the picture shows a temporal color code of hypocotyls grown in darkness and imaged with an infrared camera for 8 hr after gravistimulation. The hypocotyl is not in contact with the agar to allow for undisturbed bending. On the right, the quantification of the hypocotyl angle 6 hr after gravistimulation is plotted; 0 degrees is horizontal, 90 degrees vertical. (E) The 35S::GFP-SAUR19 line is functionally insensitive to auxin in the elongation assays, and as a result, it bends less in the gravitropic assay. The constitutively active AHA1 allele in the aha2-5 mutant background (ost2-2D/aha2-5) leads to diminished gravitropic response. On the right, the quantification of the hypocotyl angle 6 hr after gravistimulation is plotted; 0 degrees is horizontal, 90 degrees vertical.
-
Figure 5—source data 1
Numerical data for the graphs.
- https://doi.org/10.7554/eLife.19048.015
Videos
Video 1
The movie shows an apo-pHusion marker line hypocotyl segment.
NAA (10 µM) is added at time 0, acidification follows in approximately 20 min. The pH-sensitive GFP is shown in green, the reference mRFP in magenta, therefore white color corresponds to higher pH, while magenta to lower pH values.
Video 2
Apoplastic pH drops rapidly after adding fusicoccin (5 µM at timepoint 0).
An apo-pHusion marker line hypocotyl segment. The pH-sensitive GFP is shown in green, the reference mRFP in magenta, therefore white color corresponds to higher pH, while magenta to lower pH values.
Video 3
Col-0 hypocotyls grown in darkness and imaged using an infrared imaging system.
At the beginning of the movie, the seedlings are stimulated by 90 degrees rotation. Seedlings bend up and continue growing upwards; note the waving of the tip of the growing seedlings. Roots are placed on agar, while the hypocotyl grows in air to allow for unobstructed bending and growth.
Additional files
-
Supplementary file 1
The AreaKymo script.
- https://doi.org/10.7554/eLife.19048.017
Download links
A two-part list of links to download the article, or parts of the article, in various formats.
Downloads (link to download the article as PDF)
Open citations (links to open the citations from this article in various online reference manager services)
Cite this article (links to download the citations from this article in formats compatible with various reference manager tools)
TIR1/AFB-Aux/IAA auxin perception mediates rapid cell wall acidification and growth of Arabidopsis hypocotyls
eLife 5:e19048.
https://doi.org/10.7554/eLife.19048


