Molecular basis of sidekick-mediated cell-cell adhesion and specificity
- Columbia University, United States
- Harvard University, United States
- Howard Hughes Medical Institute, Columbia University, United States
Figures
Figure 1
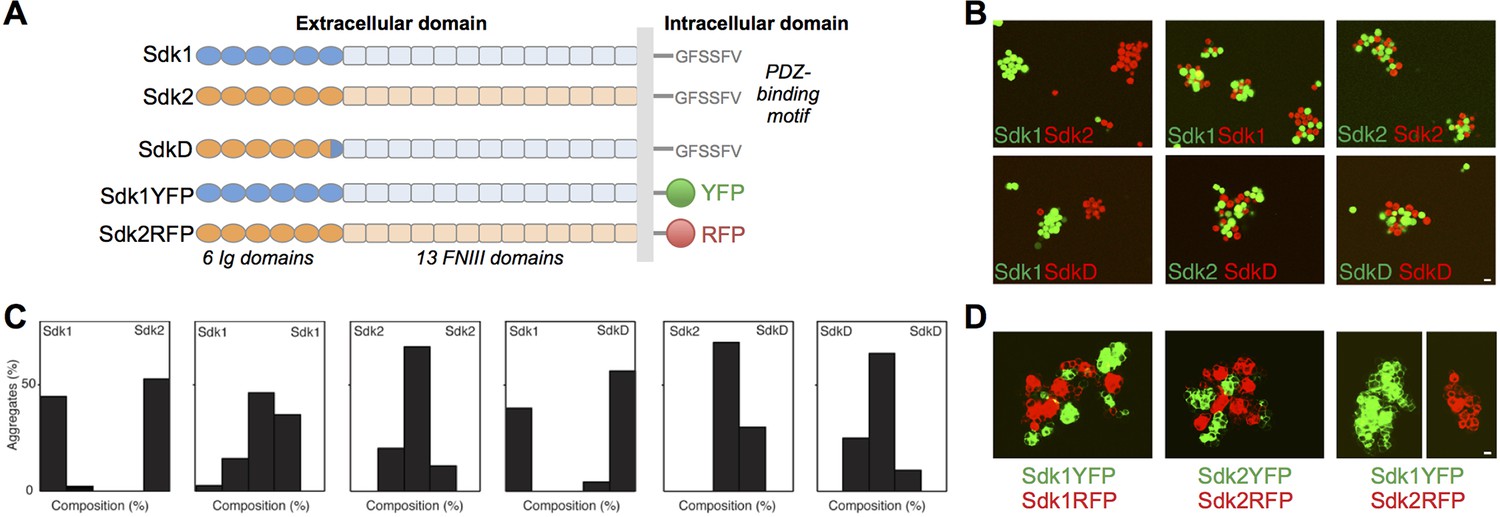
The Sdks’ Ig domain regions are responsible for Sdk1/2 specificity.
(A) Schematic of the domain arrangement of mouse Sdk1, Sdk2, and Sdk constructs used in the cell assays. (B) Aggregation assays demonstrate that L cells (labeled with red or green cell-trackers) co-aggregate only when the cells are expressing the same Sdk (top row). Cells expressing the SdkD chimera (shown in A) co-aggregate with Sdk2 but not Sdk1 expressing cells (bottom row). Scale bar, 5 μm. (C) Quantification of the assays shown in B. Each graph shows the proportion of red and green cells observed in the cell aggregates in each assay (n = 20–39). (D) HEK-293 cells transiently transfected with Sdk-RFP and YFP constructs show cell surface fluorescence and only co-aggregate with cells expressing the same Sdk molecule, regardless of the intracellular fluorescent tag. Scale bar, 5 μm.
Figure 2 with 1 supplement
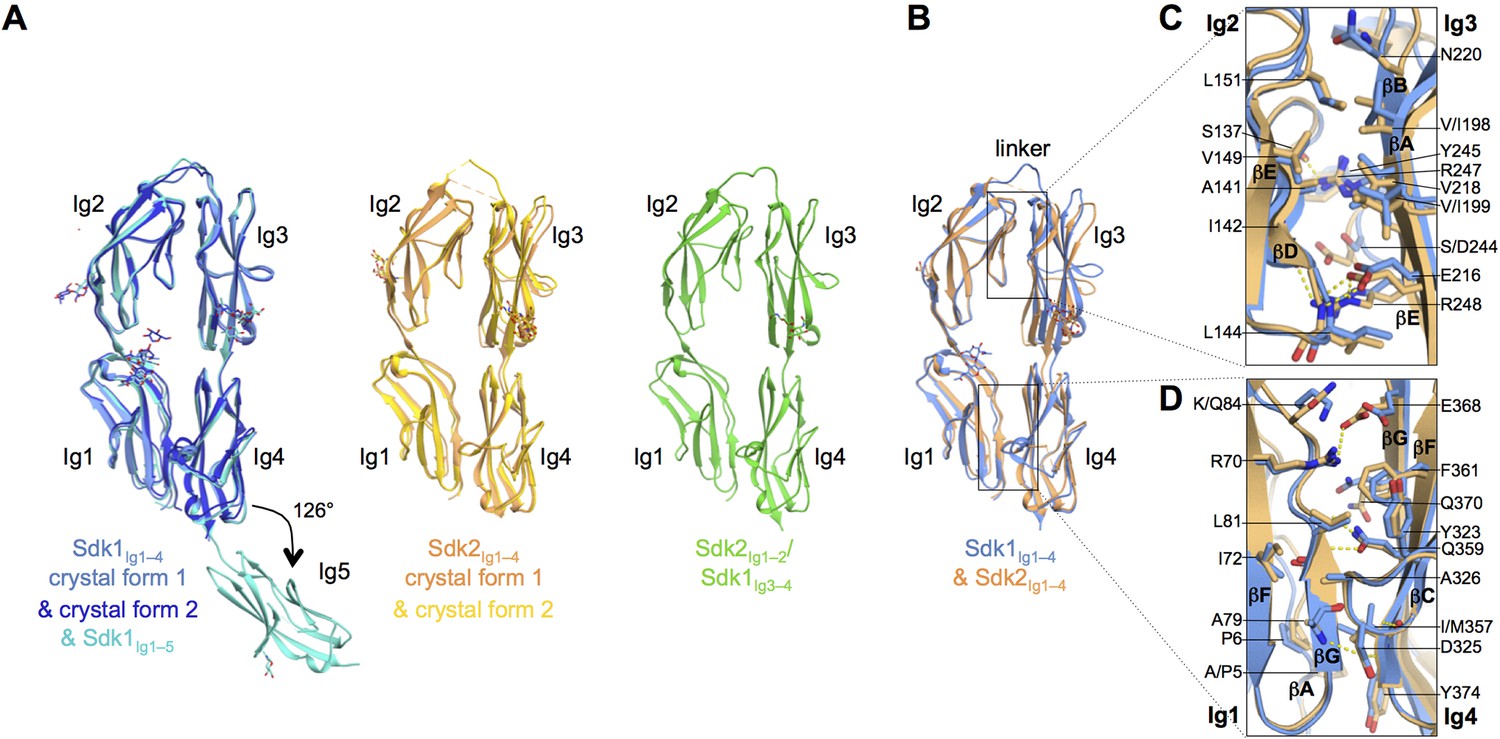
The N-terminal four Ig domains of Sdk1 and Sdk2 adopt a stable horseshoe conformation.
(A) Crystal structures of the five or four N-terminal Ig domains of Sdk1 and Sdk2 show a horseshoe arrangement of Ig1–4, which is maintained in a Sdk2Ig1–2/Sdk1Ig3–4 chimera, from which Ig5 extends at a 126° angle from Ig4 in Sdk1. The left hand panel shows a structural alignment of single protomers from the two different Sdk1Ig1–4 crystal forms and the Sdk1Ig1–5 structure, showing the very high structural similarity of individual protomers among the different crystal forms. The second panel shows protomers from the two Sdk2Ig1–4 crystal forms structurally aligned, and the third panel shows a single protomer from the Sdk2Ig1–2/ Sdk1Ig3–4 structure. All protein structures are shown in ribbon depiction, with oligosaccharides in stick view. (B) Structural alignment of the Sdk1 and Sdk2 Ig1–4 structures revealing that their overall architecture is highly similar. (C) Close-up of the Sdk1 (blue) and Sdk2 (orange) Ig2:Ig3 intra-horseshoe interfaces with interfacial residue side-chains and key main-chain atoms shown as sticks. Sdk2 hydrogen bonds are depicted as dashed yellow lines. (D) Close-up of the Ig1:Ig4 intra-horseshoe interface.
-
Figure 2—source data 1
X-ray crystallography data collection and refinement statistics.
- https://doi.org/10.7554/eLife.19058.005
Figure 2—figure supplement 1
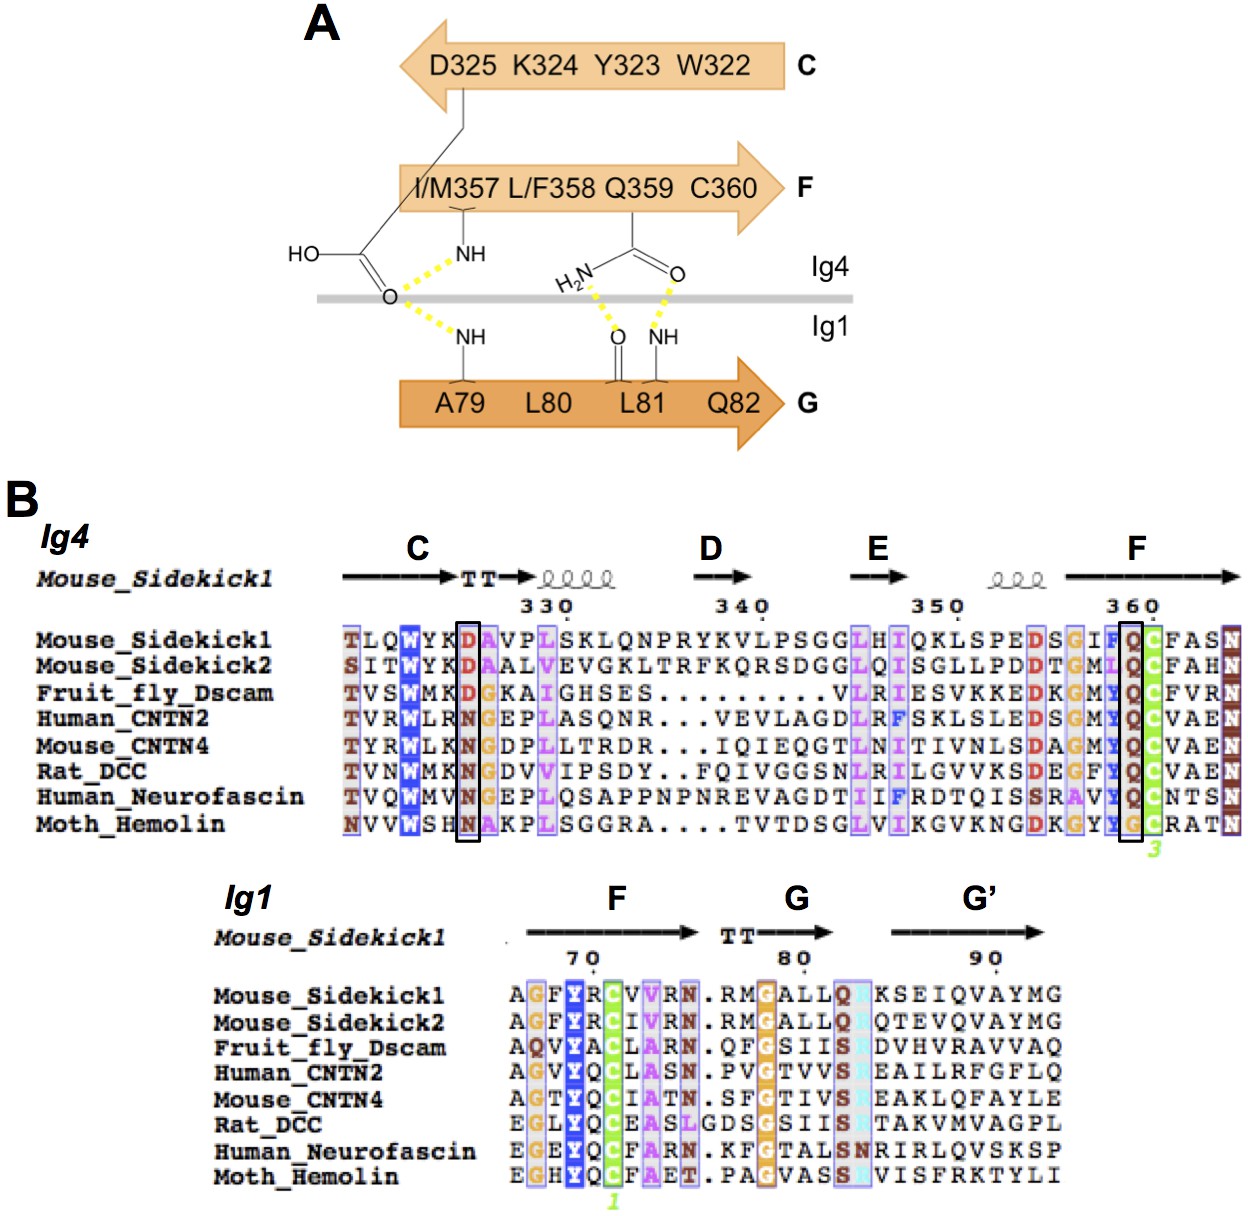
IgSF proteins containing horseshoe motifs including both Sdks have conserved intramolecular Ig1:Ig4 interactions.
(A) Schematic of the Sdk2 Ig1:Ig4 intramolecular hydrogen-bonding network formed between residues from Ig1 beta strand G and Ig4 beta strands C and F. This network is conserved among horseshoe motif-containing IgSF proteins (Chen et al., 2013). (B) Multiple sequence alignment of horseshoe-containing IgSF proteins, for which there are crystal structures, showing the conserved Ig1 and Ig4 motifs from A. Motif residues whose side chains form specific interactions are indicated by black boxes. The secondary structure elements from the Sdk structure are shown above the alignment.
Figure 3 with 1 supplement
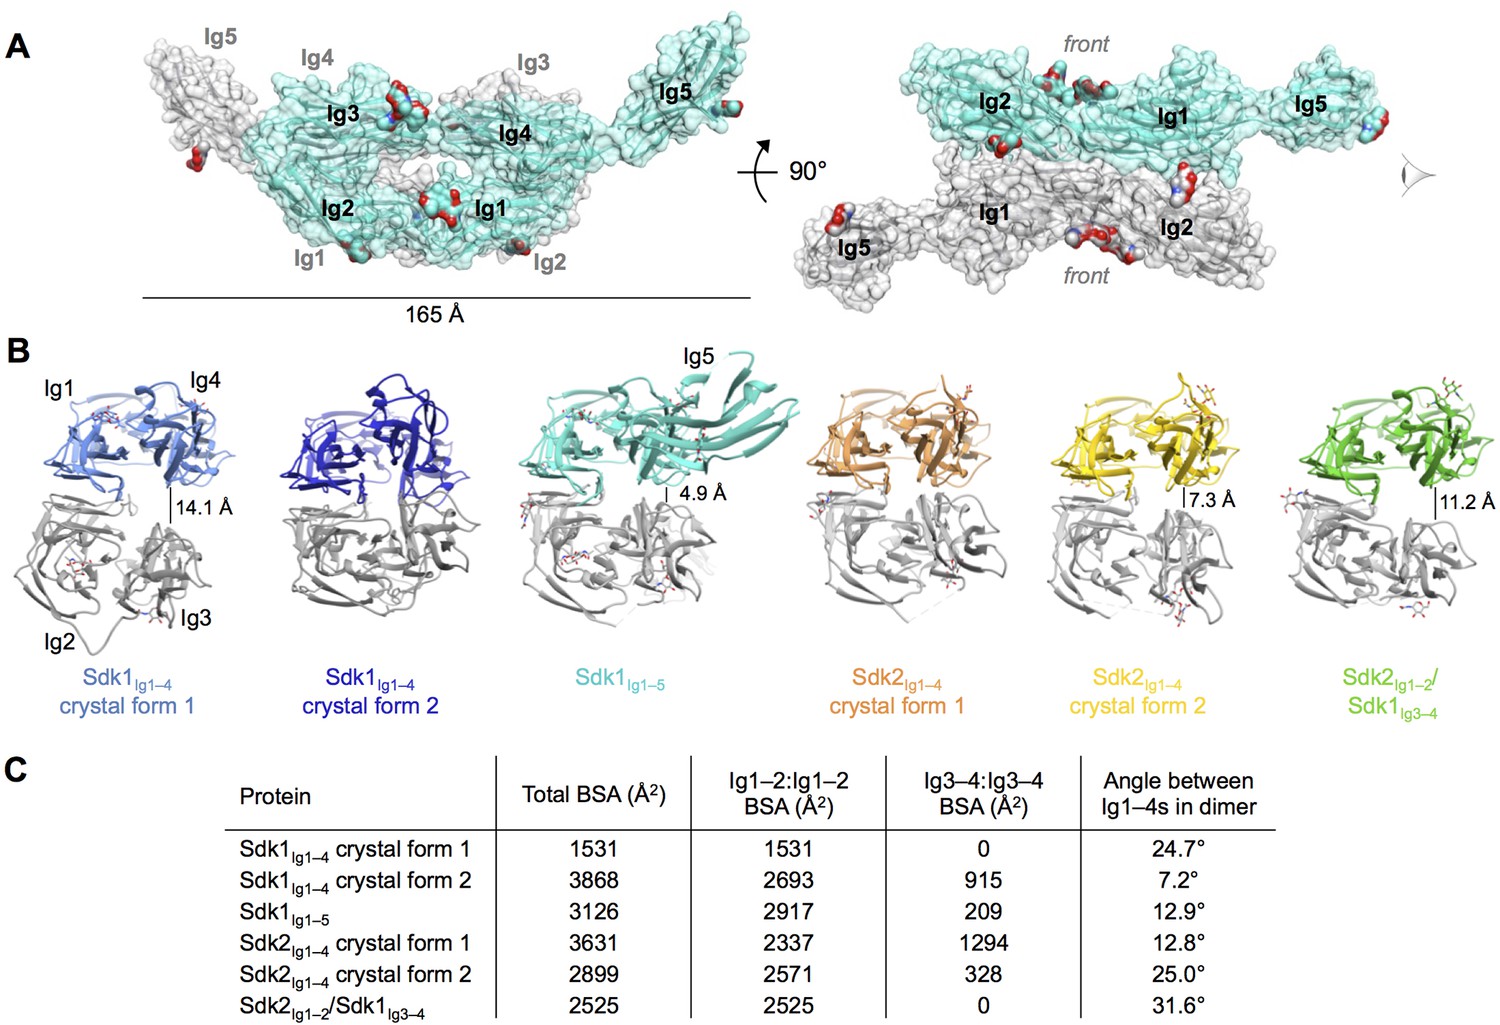
Crystal structures of Sdk1 and Sdk2 reveal a flexible dimer of horseshoes mediated by the N-terminal four Ig domains.
(A) Surface view of the Sdk1Ig1–5 structure showing the back-to-back horseshoe-mediated dimer observed in the crystal structure. One protomer is colored cyan, one protomer colored gray. Oligosaccharides are shown as opaque surfaces, colored by element. (B) The same back-to-back dimer is observed in all Sdk structures, but the angle between the two protomers in each dimer varies. Dimer structures are shown in ribbon depiction, viewed from the eye icon in A. In each dimer, one protomer is colored variably and one protomer is colored gray. All variably colored protomers are aligned, so that the difference in angle is evident from the differing positions of the gray protomer. (C) Table detailing the variation amongst the Sdk dimer crystal structures in the buried surface area (BSA) over both protomers, and in the angle between the planes of the two horseshoe regions (Ig1–4) in the dimers.
Figure 3—figure supplement 1

Dimer interactions mediated by IgSF horseshoe motif proteins.
To date three different homophilic dimer conformations for IgSF proteins with Ig1–4 horseshoe motifs have been observed crystallographically and experimentally validated: (A) Neurofascin (PDB: 3P3Y) forms a symmetric Ig2-mediated dimer, primarily involving interactions between the Ig2 G-strands. The dimer structure is shown in ribbon depiction, with one protomer colored gray and the other green. The crystal structure of human CNTN2 (PDB: 2OM5, shown in the bottom panel with gray and yellow protomers) also shows a similar Ig2 G-strand mediated dimer arrangement, which was validated by mutagenesis experiments. The crystal structure of mouse CNTN4 (PDB: 3JXA) also shows a similar dimer arrangement in the crystal lattice. (B) As described in this paper Sdk1 and Sdk2 Ig1–4 regions form dimers mediated by all four Ig domains. The dimer observed in Sdk1Ig1–4 crystal form 2 (purple and gray protomers) is shown. (C) The horseshoe motif Ig1–4 regions of Drosophila Dscam1 (PDB: 3DMK, protomers colored gray and pink) form a symmetric dimer mediated by Ig2:Ig2 and Ig3:Ig3 interactions, however this dimer does not form in solution without the additional interactions mediated by Ig7 (Meijers et al., 2007). (D) Central panel shows a structural alignment of the gray protomer from each of the Neurofascin, Sdk1, and Dscam1 Ig1–4 dimer structures. Each of the proteins utilizes a different surface of the horseshoe motif to mediate homodimerization.
Figure 4 with 3 supplements
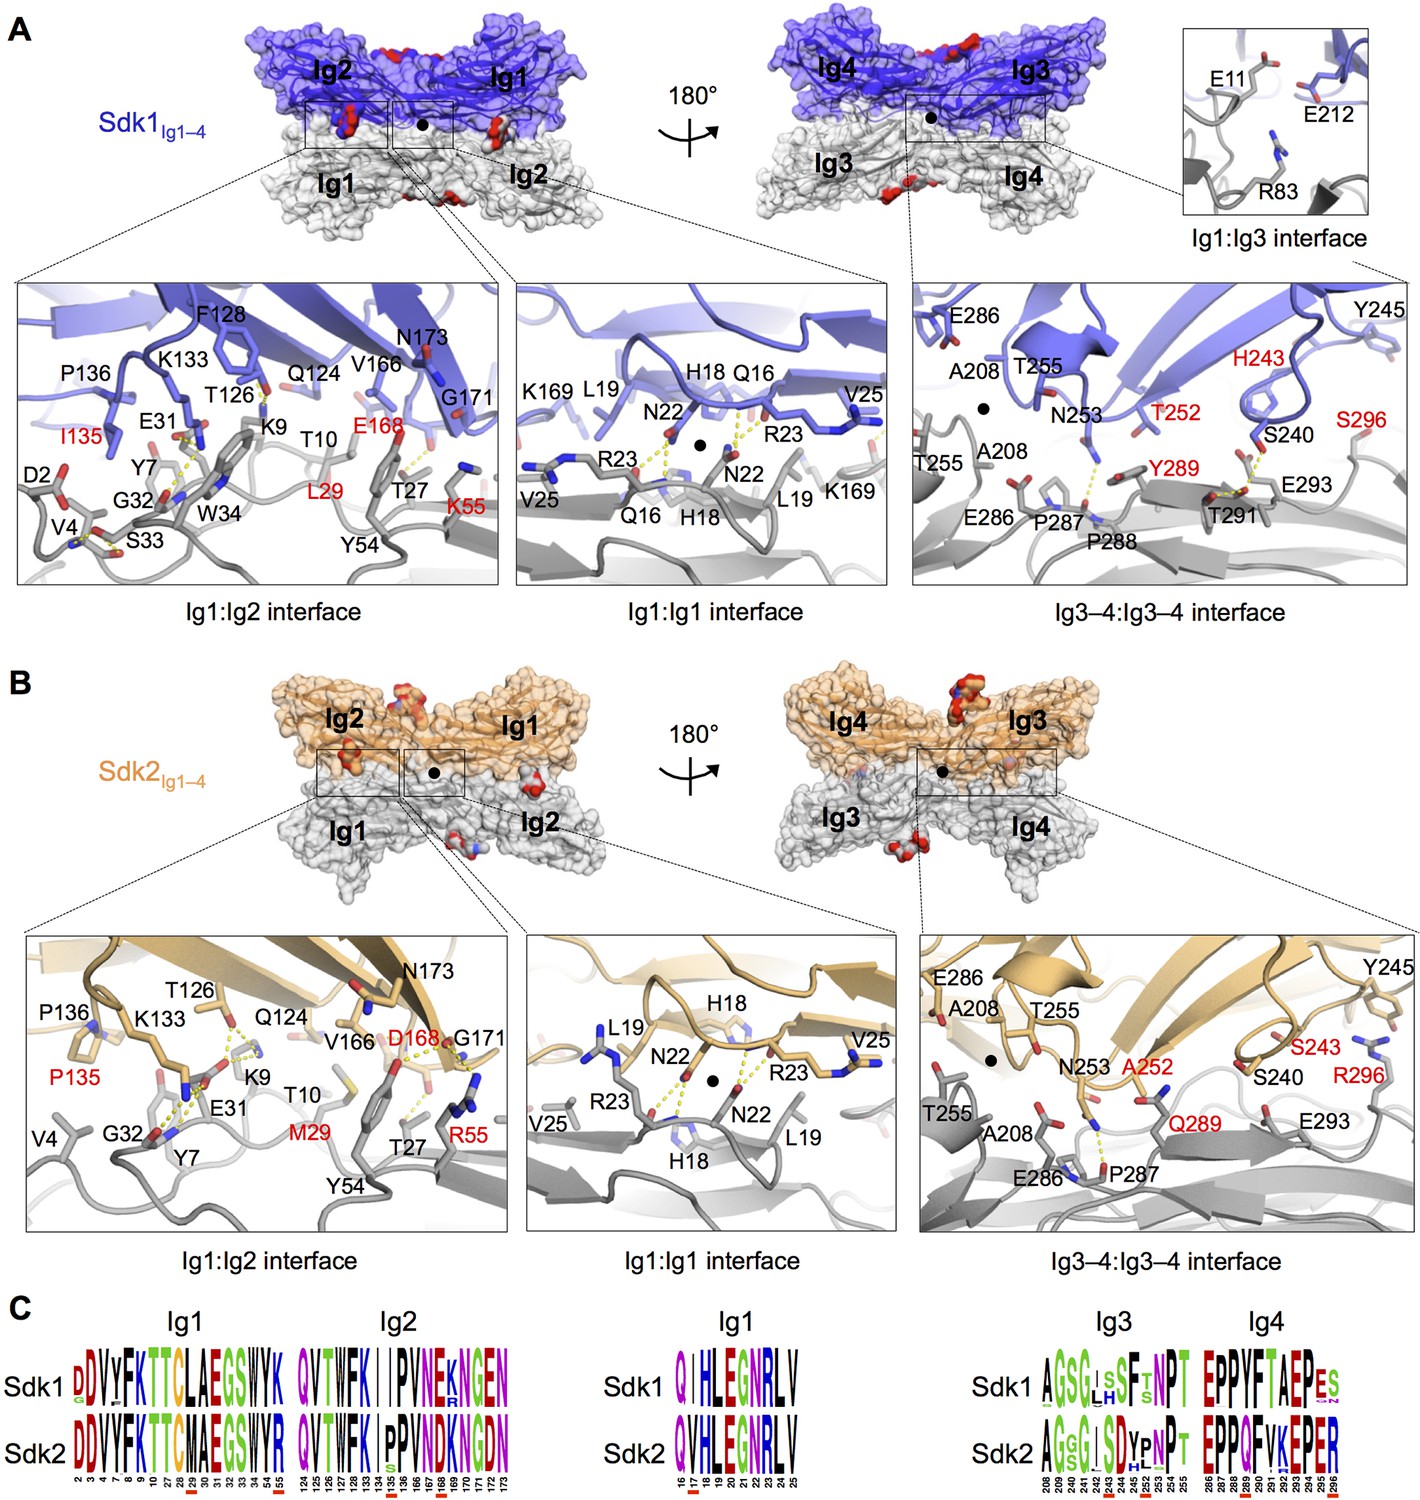
The Sdk1 and Sdk2 dimer interfaces are highly similar.
(A) Sdk1 dimer interface. Top panel: Sdk1Ig1–4 crystal form 2 dimer shown in surface view, one protomer dark blue, the other gray. Bottom panel: Close ups of the Ig1:Ig2, Ig1:Ig1, Ig3–4:Ig3–4 interfaces that make up the dimer. All interfacial residue side-chains, and main-chain atoms involved in hydrogen bonds, are shown in stick view. Residues labeled in red differ between Sdk1 and Sdk2. Hydrogen bonds are shown as yellow-dashed lines. The small Ig1:Ig3 interface observed only in the Sdk1Ig1–4 crystal form 2 is shown in the top right. (B) Sdk2 dimer interface. Sdk2Ig1–4 crystal form 1 dimer shown as for Sdk1 in A. One protomer is colored orange, the other gray. (C) Sequence logos of Sdk1 and Sdk2 dimer interface residues from the Ig1:Ig2, Ig1:Ig1, and Ig3–4:Ig3–4 interfacial regions generated from multiple sequence alignments of vertebrate Sdk1 and Sdk2 protein sequences (species used are listed in Figure 4—source data 1). Key interfacial residues showing differences between Sdk1 and Sdk2 are underlined in red.
-
Figure 4—source data 1
Protein amino acid sequences used to generate Sdk sequence logos.
- https://doi.org/10.7554/eLife.19058.010
Figure 4—figure supplement 1
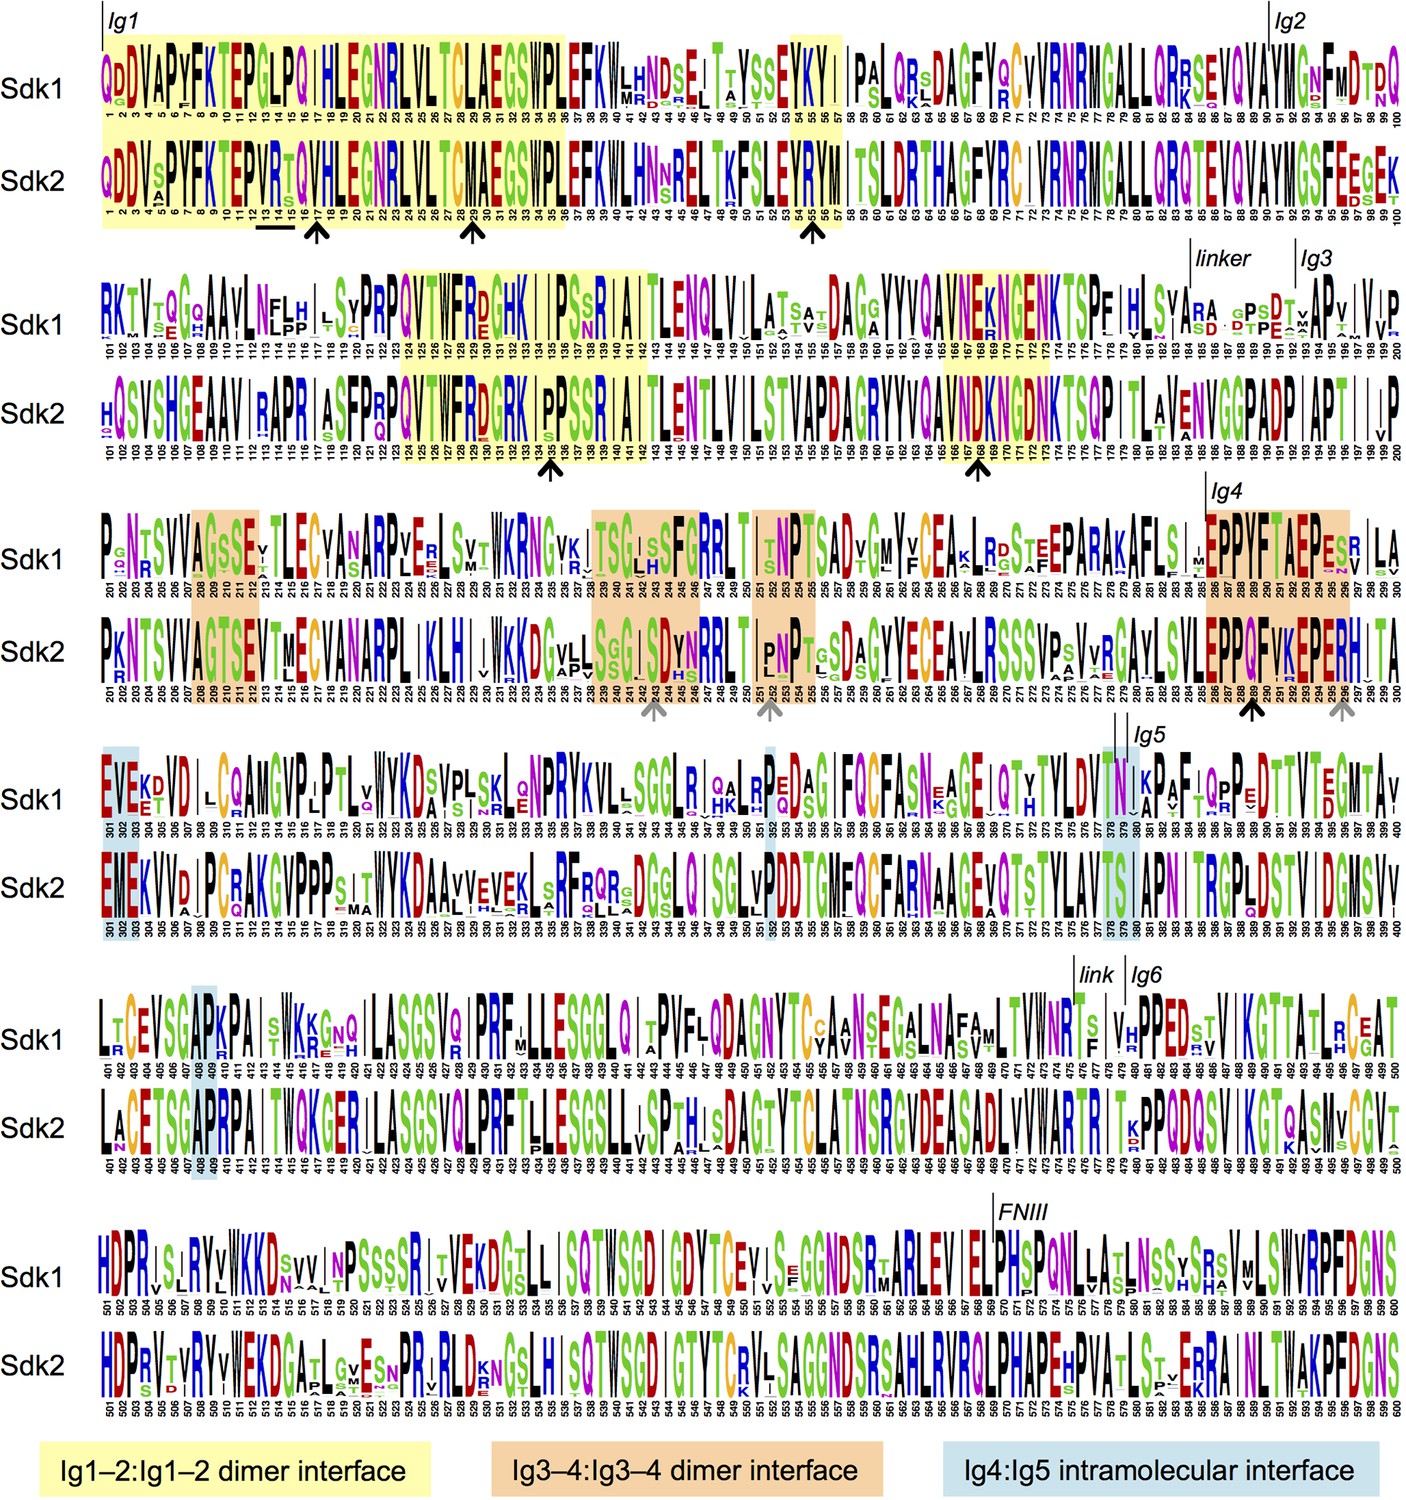
Sdk sequence logos showing conservation of the adhesive dimer interface residues and the Ig4:Ig5 intramolecular interface residues.
Sequence logos for Sdk1 and Sdk2 Ig domain regions generated from multiple sequence alignments of vertebrate Sdk1 and Sdk2 protein sequences (species used are listed in Figure 4—source data 1). Yellow highlights indicate Ig1–2:Ig1–2 dimer interface regions. Orange highlights indicate Ig3–4:Ig3–4 dimer interface regions. Black arrows indicate key interface residues that show conserved differences between Sdk1 and Sdk2. The black underline indicates marginally interfacial Ig1 residues with conserved differences. Grey arrows indicate key interface residues that differ between Sdk1 and Sdk2 but are not as well conserved. Cyan highlights indicate Ig4:Ig5 intramolecular junction interfacial residues.
Figure 4—figure supplement 2
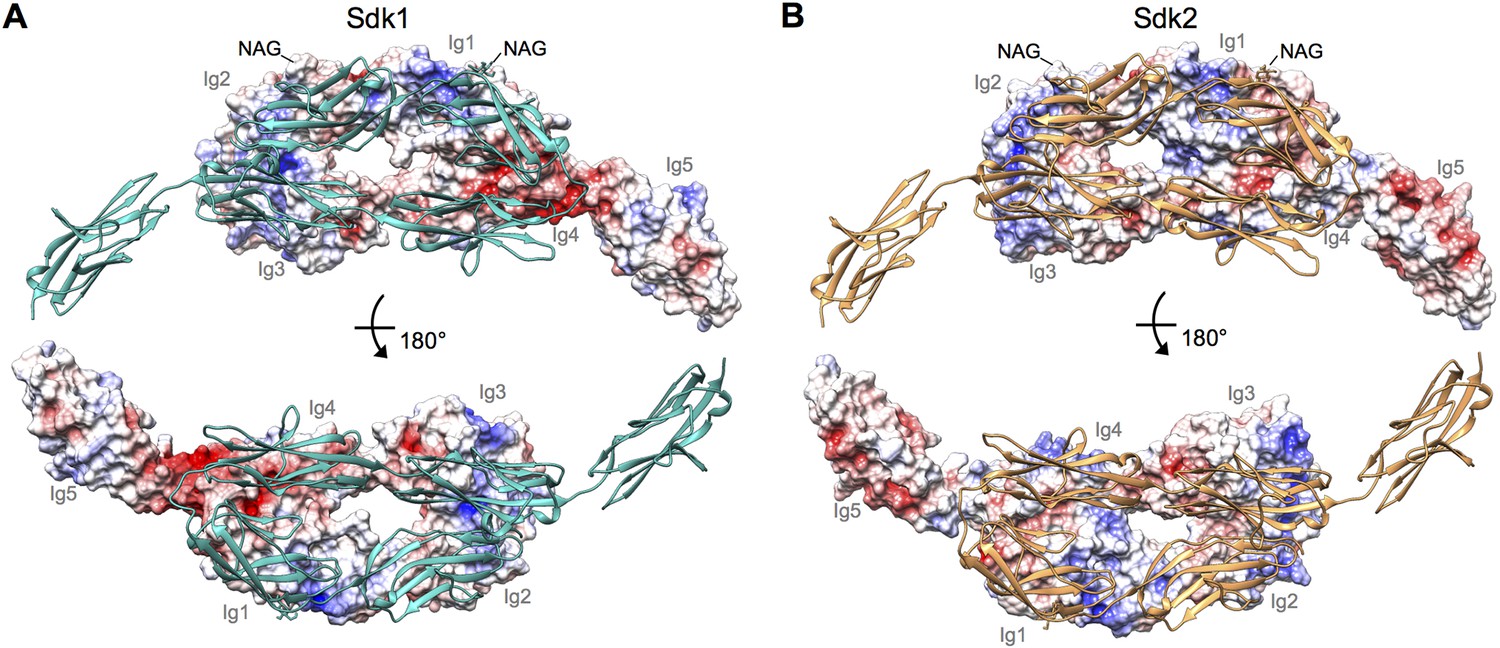
Electrostatic surfaces of the Sdk dimerization interfaces.
(A) Sdk1Ig1–5 dimer structure including the single glycan residue involved in the dimer interface (N-acetylglucosamine (NAG) bonded to asparagine 173). The top panel shows the electrostatic surface of the interacting face of chain A (Ig domains labeled), with chain B shown in ribbon depiction. The bottom panel shows the electrostatic surface of the interacting face of chain B (Ig domains labeled), with chain A shown in ribbon depiction. The Ig4–Ig5 linker region is highly negatively charged. Electrostatic potentials were calculated using DelPhi (Honig and Nicholls, 1995) and depicted at ± 5 keV using UCSF Chimera (Pettersen et al., 2004). (B) Sdk2Ig1–4 dimer structure (crystal form 1) including the single glycan residue involved in the dimer interface (NAG bonded to asparagine 173), with a model of Sdk2Ig5 based on Sdk1Ig1–5 produced using MODELLER (Webb and Sali, 2014). The top panel shows the electrostatic surface of the interacting face of chain A, with chain B shown in ribbon depiction. The bottom panel shows the electrostatic surface of the interacting face of chain B, with chain A shown in ribbon depiction.
Figure 4—figure supplement 3
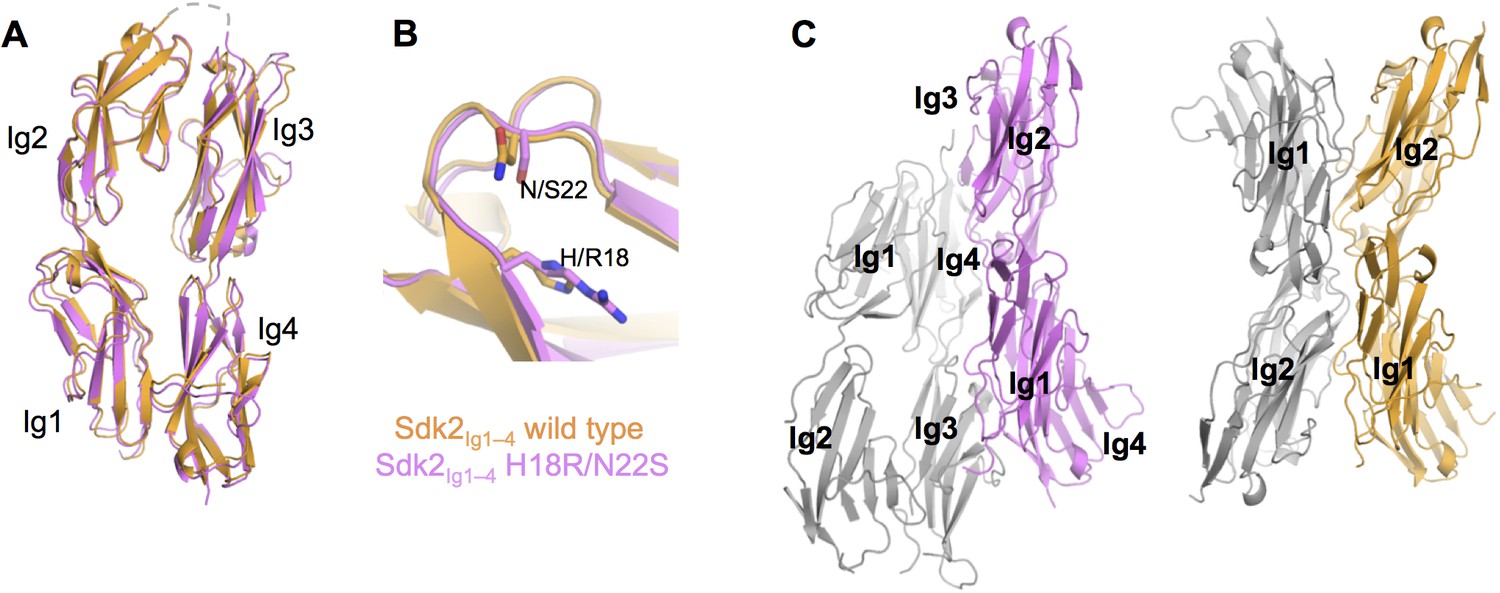
The crystal structure of Sdk2Ig1–4 H18R/N22S mutant shows complete loss of the wild-type dimer interaction.
(A) Structural alignment of individual protomers of the Sdk2Ig1–4 wild-type (crystal form 1, orange ribbon) and Sdk2Ig1–4 H18R/N22S mutant (pink ribbon) shows little difference between the overall horseshoe architecture (RMSD = 1.9Å). (B) Additionally the H18R/N22S mutations do not cause a local conformational change in the Ig1 AB loop. (C) However the wild-type dimer configuration with back-to-back horseshoes making extensive Ig1–2:Ig1–2 contacts is absent from the mutant crystal structure. The most extensive crystallographic dimer in the mutant crystal structure shows no Ig1–2:Ig1–2 contacts and shifted Ig3–4:Ig3–4 contacts relative to the wild-type dimer. Left: Sdk2Ig1–4 H18R/N22S crystallographic dimer with individual protomers in grey and pink; Right: Sdk2Ig1–4 wild-type dimer with individual protomers in grey and orange. X-ray crystallography data collection and refinement statistics can be found in Figure 2—source data 1.
Figure 5 with 2 supplements

Sdk1 dimerization is required for cell aggregation and cis clustering.
(A) Aggregation assay using N-cadherin deficient HEK-293 cells transiently transfected with wild-type (left panel) and N22R mutant (middle panel) Sdk1-RFP. Cytoplasmic RFP transfection was used as a negative control (right panel). (B) Quantification of the aggregation assay shown in A for wild-type (WT) Sdk1 and several Sdk1 dimer interface mutants (n = 15, mean ± S.E.). (C) Immunolabeling of Sdk1 (red) with a monoclonal antibody to Sdk1 in interacting L cells shows wild-type Sdk1 (left panel) localizes to the cell-cell junctions whereas the Sdk1 N22R mutant is diffusely localized (right panel). Counterstaining with wheat germ agglutinin (WGA, green) was used to visualize the cell surface. (D) Immunolabeled Sdk1 (red, stained with anti-Sdk1 cytoplasmic domain) and Sdk1YFP (green, Sdk1’s cytoplasmic domain was replaced with YFP) co-localize at cell-cell junctions between Sdk1 and Sdk1YFP expressing L cells (top panels). Arrows indicate co-localization of red and green fluorescence. By contrast, Sdk1 N22R does not localize to cell-cell junctions between Sdk1 N22R and Sdk1YFP expressing cells (bottom panels). (E) Immunolabeling of Sdk1 with a monoclonal antibody to Sdk1 (red) in solitary L cells shows that wild-type Sdk1 localizes in puncta on the cell surface (left) whereas the Sdk1 N22R mutant is diffusely localized (right). (F) HEK-293 cells transiently transfected with both Sdk1RFP and Sdk1YFP express both proteins, which co-localize to cell-cell junctions (top row). Co-transfection of a Rapsyn::RFPnanobody induces clustering of Sdk1RFP away from cell-cell junctions (second and third rows). Sdk2YFP does not co-cluster with Sdk1RFP (second row), but Sdk1YFP does co-cluster (third row). However Sdk1YFP does not co-cluster with Sdk1 N22R-RFP/Rapsyn::RFPnanobody clusters (bottom row). (G) Our data suggest Sdk dimerizes using the crystallographically-determined interface, both between molecules emanating from opposing cell surfaces (in trans)—mediating cell-cell interactions—and between molecules emanating from the same cell surface (in cis)—mediating Sdk clustering. These interactions are shown schematically, using the Sdk1Ig1–5 crystal structure to illustrate the dimer interaction. The remaining 1 Ig and 13 FNIII domains that constitute the rest of the Sdk extracellular domain are abbreviated to a dashed line, with the transmembrane and intracellular domains shown as solid lines. Scale bars in A, C, D, E and F, 5 μm.
Figure 5—figure supplement 1
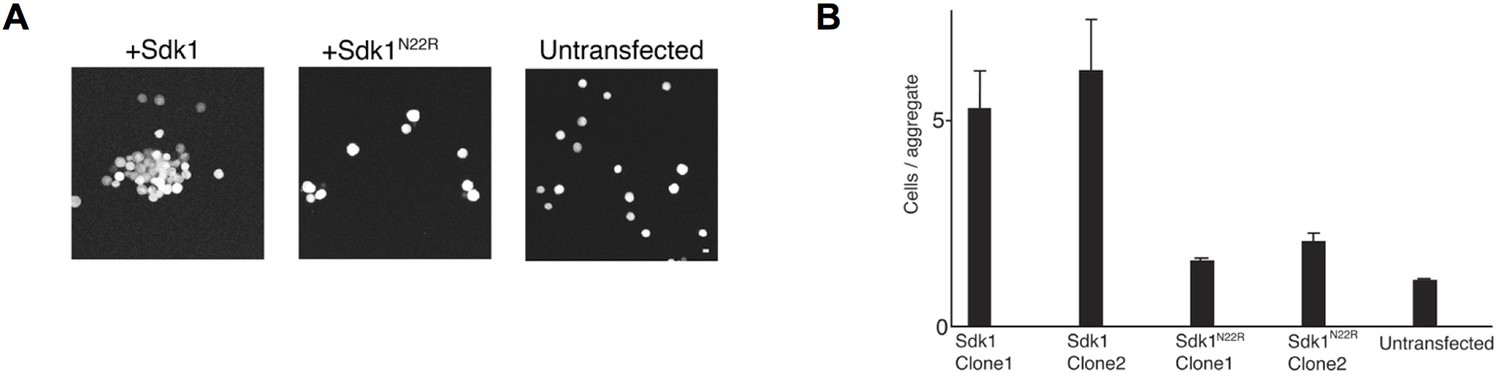
Cell aggregation assay showing the N22R dimer interface mutant impairs Sdk1-mediated cell adhesion.
(A) Aggregation assay of stably transfected L cell lines for wild-type Sdk1 and the Sdk1 N22R mutant. (B) Quantification of the aggregation assay for two stably transfected L cell lines for both wild-type Sdk1 and the Sdk1 N22R mutant (n = 21–24, mean ± S.E.).
Figure 5—figure supplement 2
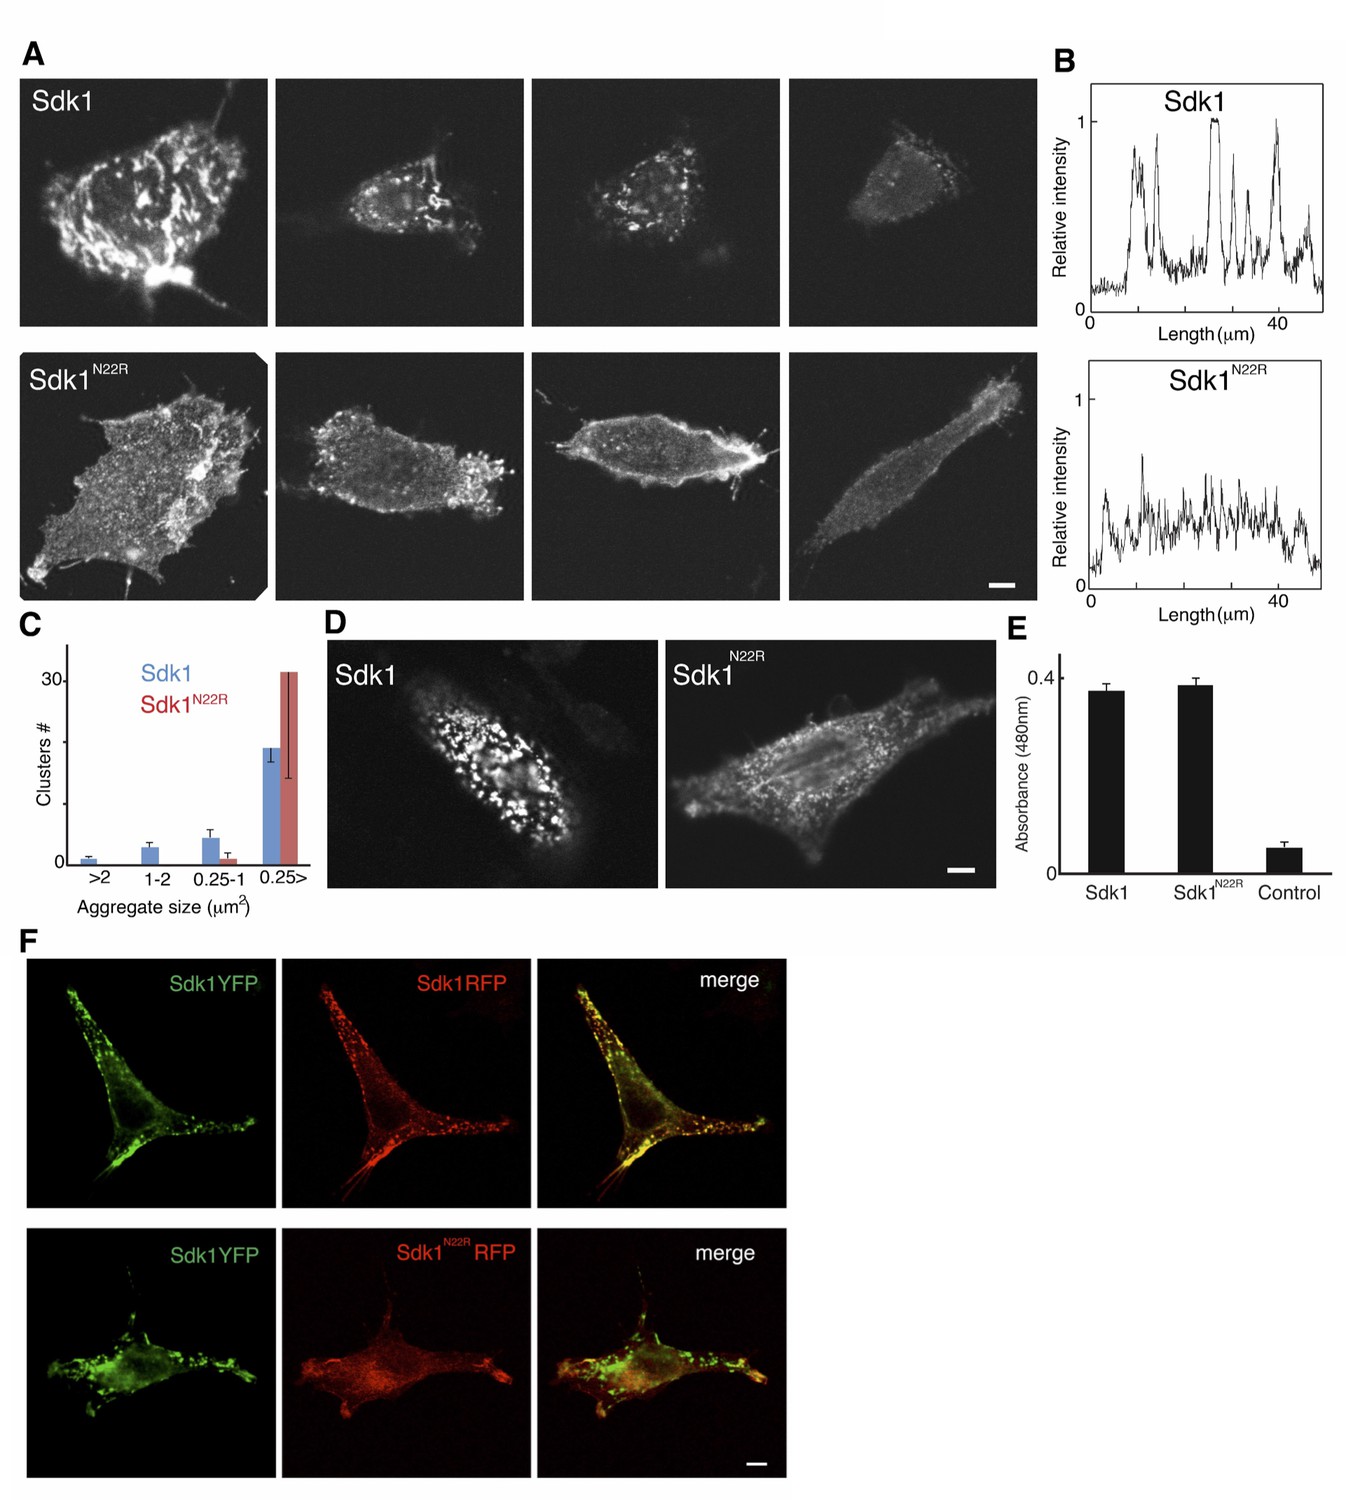
Analysis of Sdk1 puncta.
(A) A gallery of isolated Sdk1-overexpressing L cells. Cells were transfected with Sdk1 wild-type or Sdk1 N22R, pooled after antibiotic selection, re-plated, and stained with monoclonal anti-Sdk1. Images of strongly and weakly expressing cells (left to right) indicate that the effect of the N22R mutation is insensitive to expression level. Scale bar, 5 µm. (B) Line scans of stained cells confirm the distinct nature of Sdk1 wild-type and N22R localization patterns. (C) Aggregates were measured on the surface of isolated L cells (100 µm2) stained as in A. Only wild-type Sdk1 formed large puncta. (D) L cells transfected as in A were incubated with anti-Sdk1 to stain only cell surface-associated clusters. Cells were then fixed and re-stained with second antibody. Scale bar, 5 µm. (E) Sdk1 molcules on cell surface were detected by an enzyme-linked immunoSorbent assay on confluent cultures of pooled transfected L cells, and quantified using peroxidase-conjugated secondary antibodies and a soluble peroxidase substrate. Non-transfected L cells were used as controls. (F) L cells were cotransfected with Sdk1YFP/Sdk1RFP (top), or Sdk1YFP/Sdk1 N22R-RFP (bottom). In these constructs, the cytoplasmic domain is replaced by a fluorescent protein. Sdk1YFP and Sdk1RFP co-cluster, but Sdk1 N22R-RFP did cluster with Sdk1YFP. Scale bar, 5 µm.
Figure 6
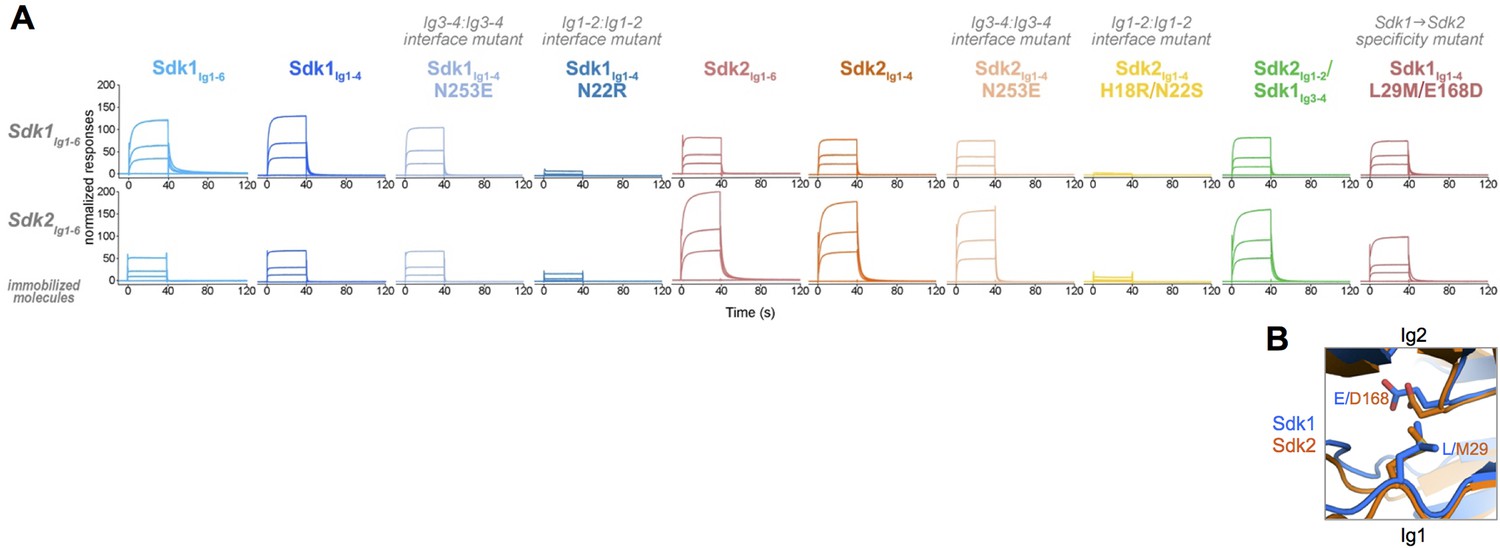
Sdk1 and Sdk2s’ homophilic interactions are stronger than their heterophilic interaction.
(A) Heterophilic and homophilic Sdk binding were analyzed by a surface plasmon resonance (SPR) experiment. Sdk1Ig1–6 (top row) and Sdk2Ig1–6 (bottom row) were covalently attached to the SPR chip and three different identical concentrations of each Sdk analyte (columns) were flowed over the Sdk1Ig1–6 and Sdk2Ig1–6 surfaces. The binding association and dissociation are shown by the normalized SPR response. (B) Close up of interacting specificity residues 29 and 168 in the Sdk1 (blue) and Sdk2 (orange) dimer interfaces.
Figure 7
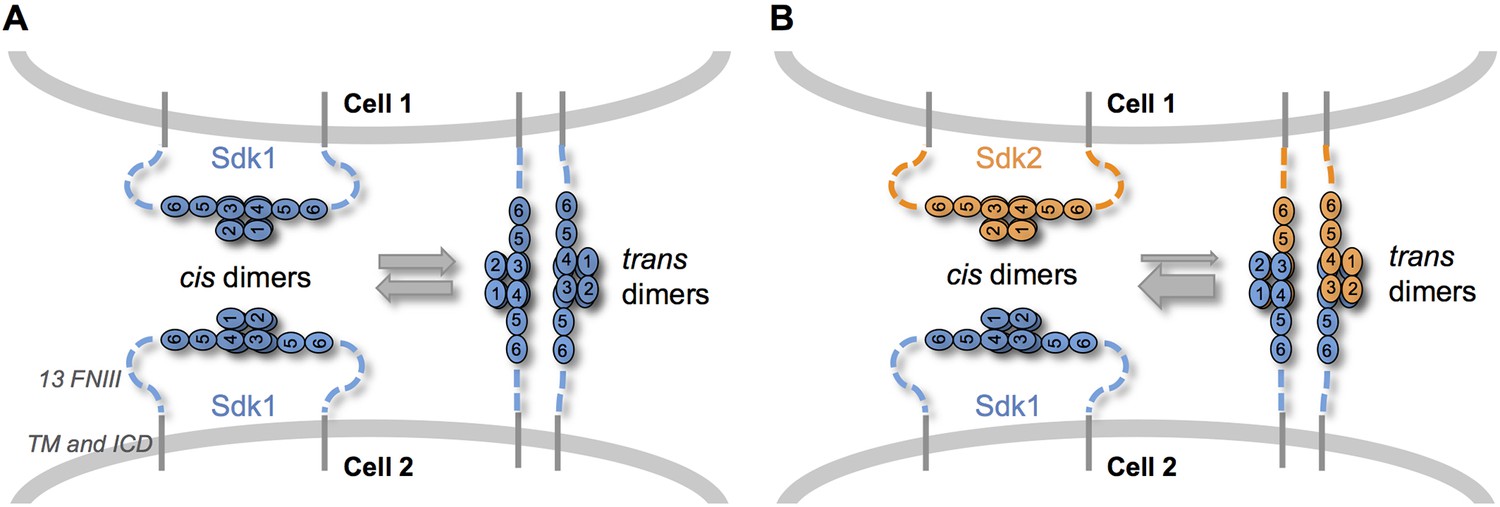
Sdk specificity could be accentuated by competition between cis and trans interactions.
(A) Schematic of two neighboring cells expressing Sdk1 showing the competition between homophilic Ig1–4-mediated dimer interactions in cis and in trans. The six immunoglobulin domains (Ig) are represented as numbered ovals and the thirteen extracellular fibronectin type III (FNIII), whose arrangement is unknown, are represented as dashed lines. (B) Schematic of two neighboring cells, one expressing Sdk1 and one expressing Sdk2, showing the competition between the stronger homophilic dimer interactions in cis and the weaker heterophilic dimer interactions in trans.
Tables
Table 1
Sedimentation equilibrium analytical ultracentrifugation of Sdk fragments. KD = dissociation constant. KI = isodesmic constant. The KI/KD ratio is given when it is less than two, indicating the presence of non-specific binding.
| Protein | Oligomeric state | Dimerization KD (μM, n=2) |
|---|---|---|
| Sdk1 | ||
| Ig1–4 | Dimer | 10.5 ± 1.1 |
| Ig1–5 | Dimer | 4.6 ± 0.06 |
| Ig1–6 | Dimer | 2.3 ± 0.39 |
| Ig1–2 dimer interface mutations | ||
| Ig1–4 N22R | Monomer | N/A |
| Ig1–4 K133E | Weak non-specific dimer | 204 ± 38.9 (KI/KD = 1.24) |
| Ig1–4 L29M/E168D | Dimer | 4.26 ± 0.50 |
| Ig1–6 N22R | Monomer | 650 ± 66 (KI/KD = 1.05) |
| Ig3–4 dimer interface mutation | ||
| Ig1–4 N253E | Dimer | 15.5 ± 1.64 |
| Sdk2 | ||
| Ig1–4 | Dimer | 2.2 ± 0.4 |
| Ig1–5 | Dimer | 0.73 ± 0.036 |
| Ig1–6 | Dimer | 0.44 ± 0.012 |
| Ig1–2 dimer interface mutations | ||
| Ig1–4 H18R/N22S | Monomer | N/A |
| Ig1–4 N22S | Monomer | N/A |
| Ig1–4 N22R | Monomer | N/A |
| Ig1–6 H18R/N22S | Monomer | N/A |
| Ig3–4 dimer interface mutation | ||
| Ig1–4 N253E | Dimer | 18.9 ± 0.95 |
| Chimera | ||
| Sdk2Ig1–2/Sdk1Ig3–4 | Dimer | 3.92 ± 0.17 |
Additional files
-
Supplementary file 1
Sidekick and other horseshoe IgSF protein characteristics.
(A) Sidekick interdomain angles. (B) Structural comparison of IgSF protein horseshoe structures.
- https://doi.org/10.7554/eLife.19058.019
Download links
A two-part list of links to download the article, or parts of the article, in various formats.
Downloads (link to download the article as PDF)
Open citations (links to open the citations from this article in various online reference manager services)
Cite this article (links to download the citations from this article in formats compatible with various reference manager tools)
Molecular basis of sidekick-mediated cell-cell adhesion and specificity
eLife 5:e19058.
https://doi.org/10.7554/eLife.19058


