Cilia-mediated Hedgehog signaling controls form and function in the mammalian larynx
- University of Texas at Austin, United States
- Emory University, United States
- Institut Pasteur, France
- King’s College London, United Kingdom
- Howard Hughes Medical Institute, United states
Figures
Figure 1
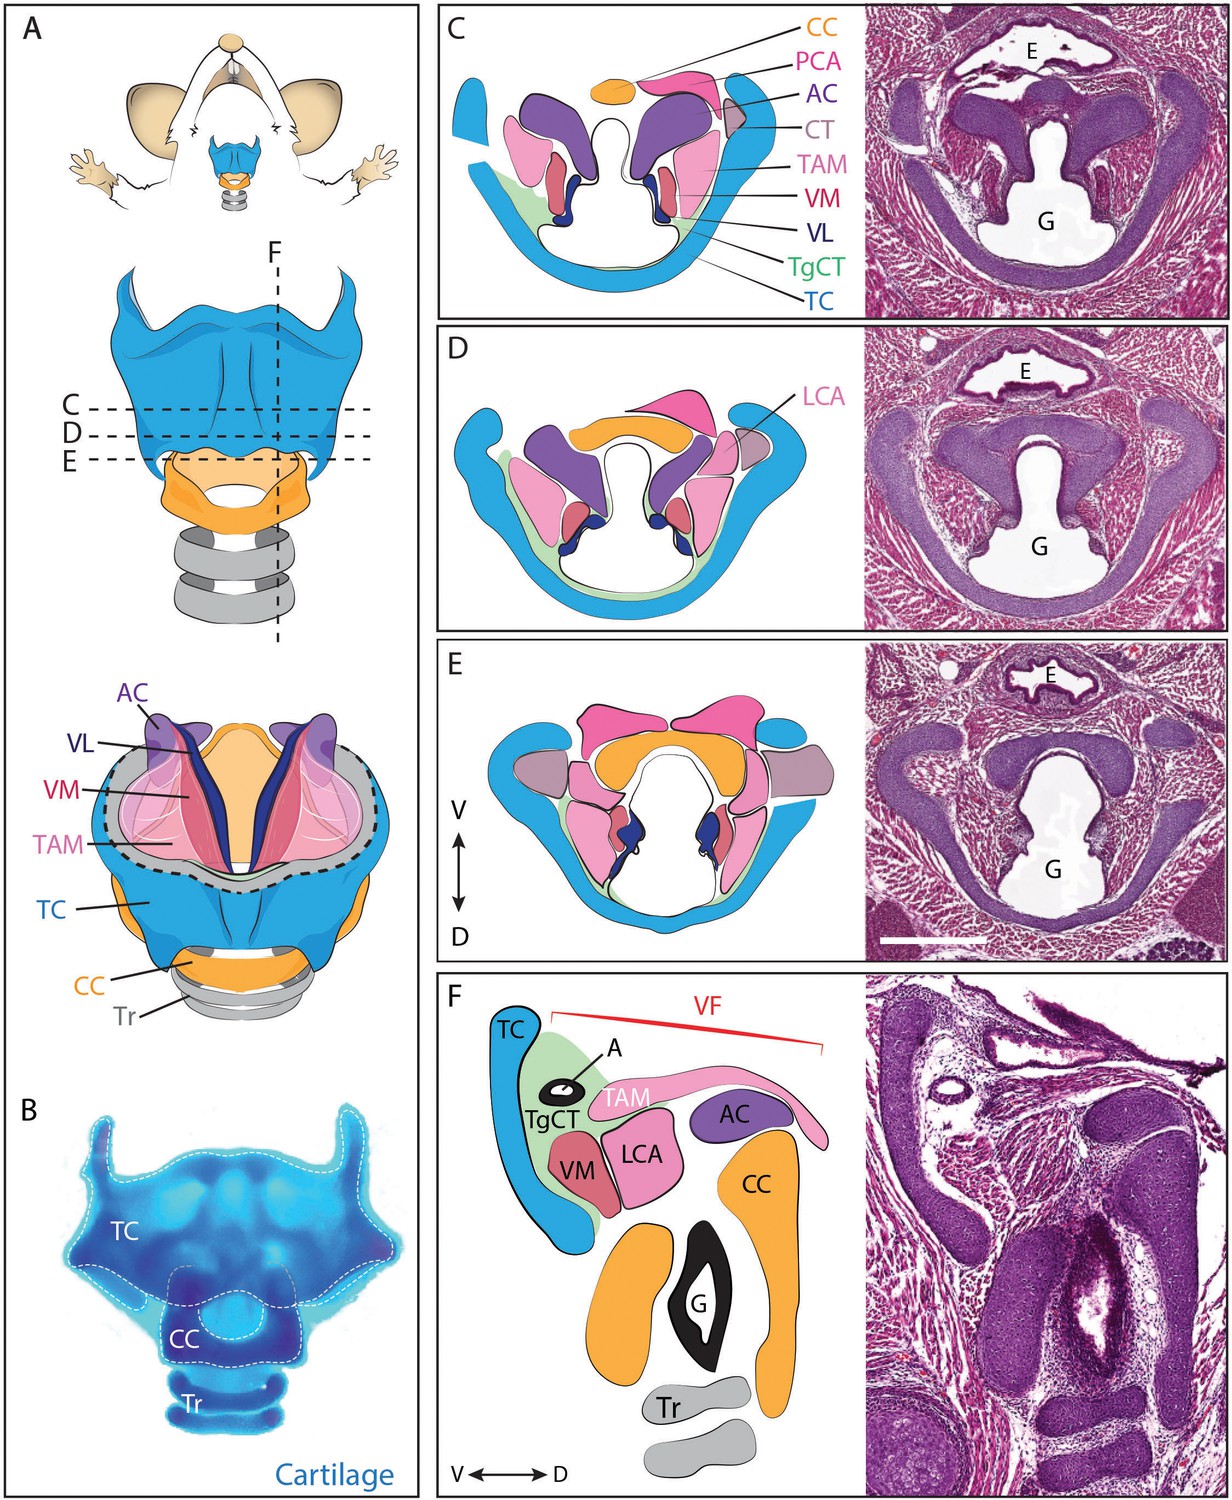
Anatomy of the mouse larynx.
(A) Diagram representing ventral view of mouse laryngeal anatomy. Dashed lines indicate sectional plane represented in panels C–F. (B) Ventral view of an excised adult larynx stained with alcian blue marking cartilage. (C–E) H&E staining of horizontal sections of E18.5 mouse larynx. Sectional plane is indicated in A. Diagrams indicate anatomy observed in sections. (F) H&E staining of sagittal section of E18.5 mouse larynx. Diagram indicates anatomy represented in section. Scale bar indicates 500 μm. Abbreviations: (AC) Arytenoid Cartilage, (CC) Cricoid Cartilage, (CT) Cricothyroid muscle, (E) Esophagus, (G) Glottis, (L) Larynx, (LCA) Lateral Cricoarytenoid muscle, (PCA) Posterior Cricoarytenoid muscle, (T) Tongue, (TAM) Thyroarytenoid Muscle, (TC) Thryoid Cartilage, (TgCT) Thyroglottal connective tissue, (Tr) Trachea, (VL) Vocal Ligament, (VM) Vocalis Muscle, (VF) Vocal fold. (V) and (D) indicate dorso-ventral axes.
Figure 2 with 2 supplements
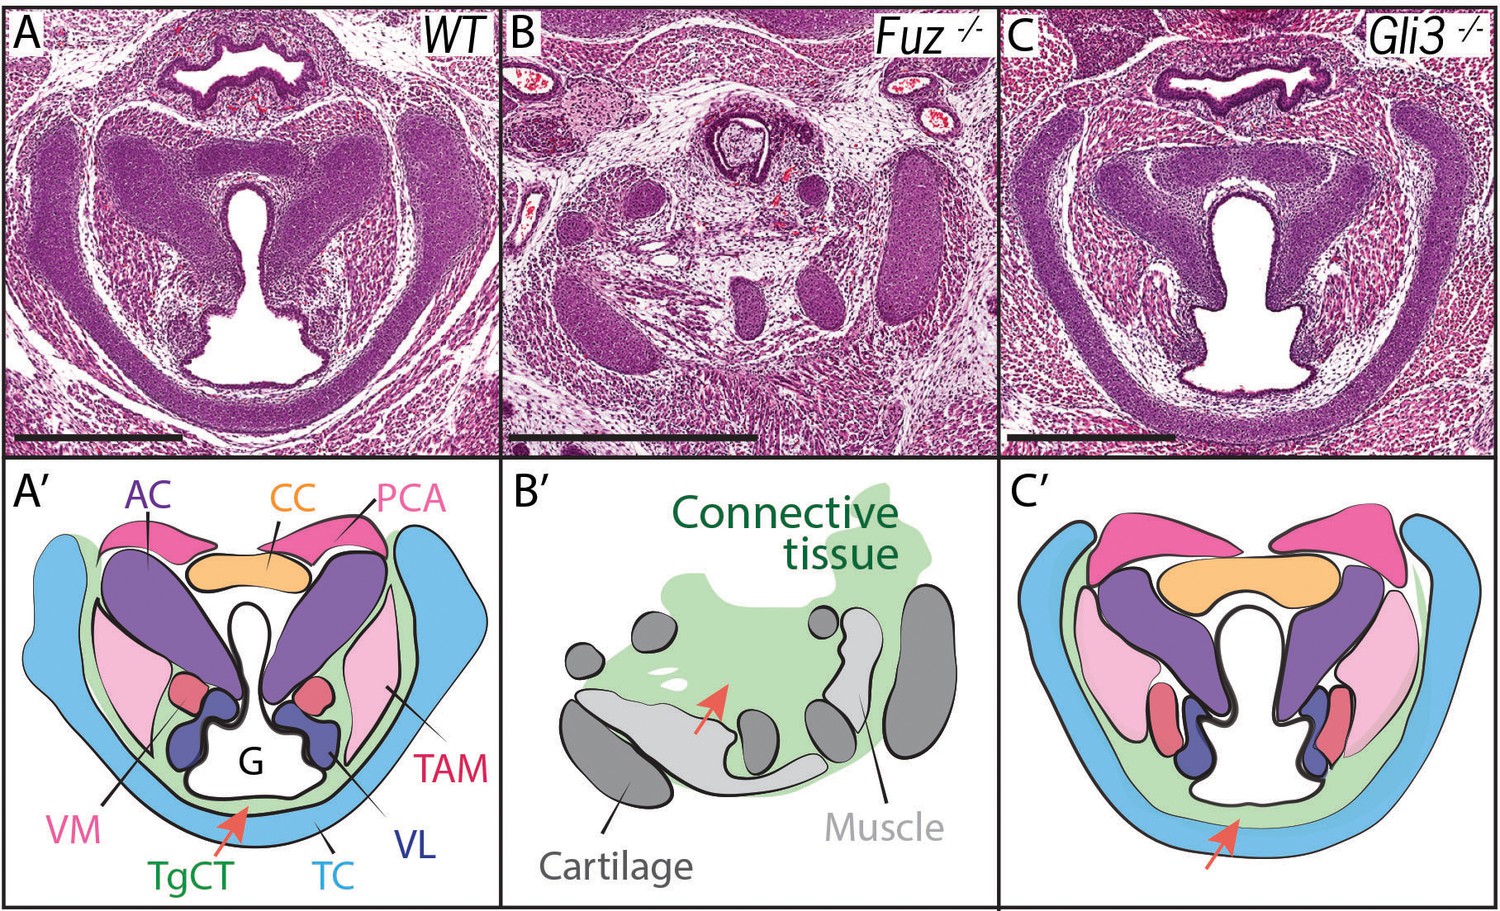
Laryngeal anatomy is disrupted in Fuz and Gli3 mutants.
(A–C) H and E staining of horizontal sections of E18.5 larynges. (A’–C’) Diagrams of anatomy shown in (A–C). Fuz mutant larynges (B–B’) are significantly altered compared to controls, (A–A’). Connective tissue in mutants (light green, (C’) is increased in mutants compared to controls (A–A’), while cartilage and muscle are irregularly patterned. Gli3-/- larynges are less altered than Fuz-/- embryos compared to controls (A–A’). Thyroglottal Connective tissue appears increased in Gli3 mutants (light green, red arrow, (C’). Scale bars indicate 500 μm. Abbreviations: (AC) Arytenoid Cartilage, (CC) Cricoid Cartilage, (CT) Cricothyroid muscle, (G) Glottis, (L) Larynx, (LCA) Lateral Cricoarytenoid muscle, (PCA) Posterior Cricoarytenoid muscle, (T) Tongue, (TAM) Thyroarytenoid Muscle, (TC) Thryoid Cartilage, (TgCT) Thyroglottal connective tissue, (Tr) Trachea, (VL) Vocal Ligament, (VM) Vocalis Muscle, (VF) Vocal fold. (V) and (D) indicate dorso-ventral axes.
Figure 2—figure supplement 1
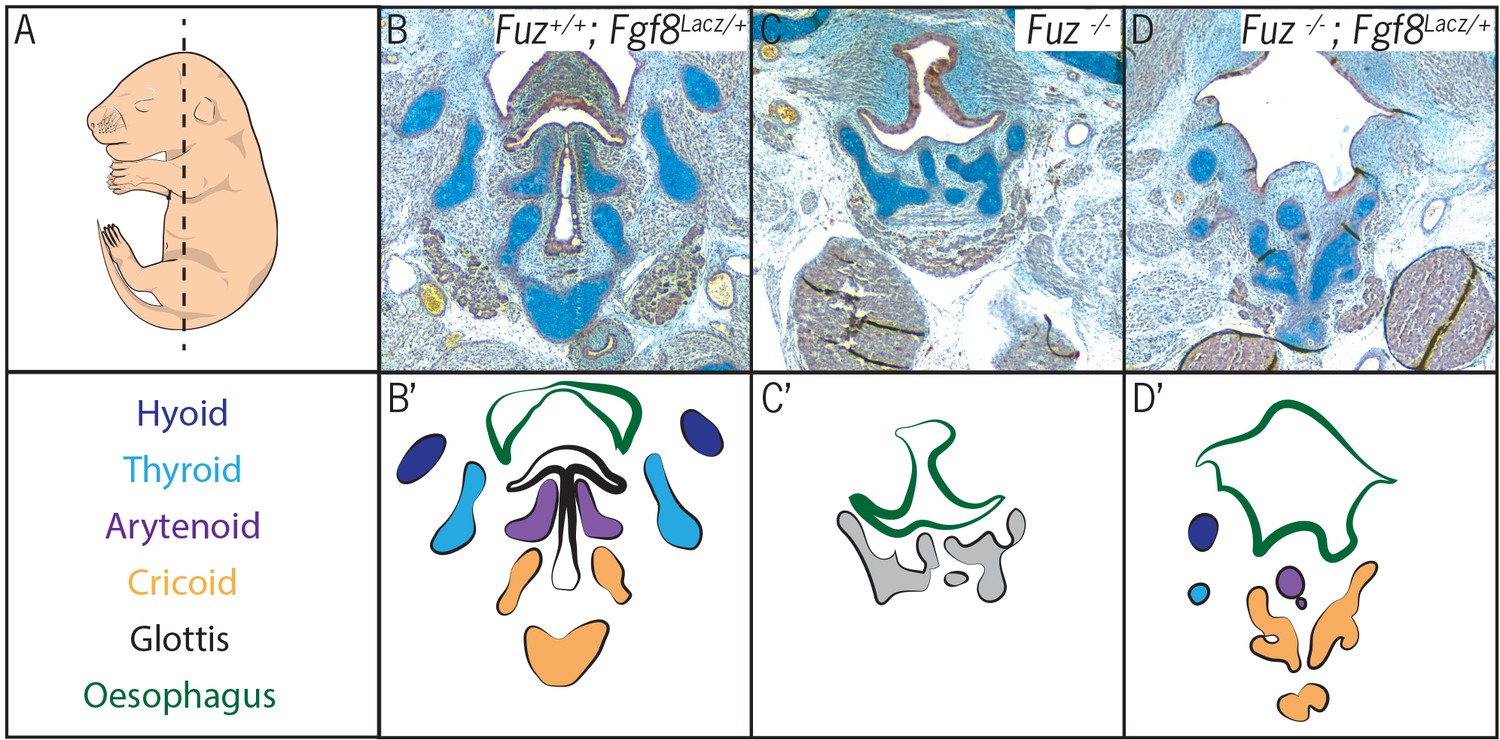
Fgf8 reduction in Fuz mutants partially rescues laryngeal phenotypes.
(A) Diagram indicating sectional plane of E16.5 embryos. (B–C) Trichrome staining of frontal E16.5 Fuz+/+; Fgf8Lacz/+ (B), Fuz+/+(C), and Fuz-/-; Fgf8Lacz/+ embryos. (B’–C’) Diagrams illustrating anatomy observed in (B–C). Hyoid bone (dark blue), thyroid (light blue), arytenoid (purple) and cricoid cartilages are present in Fuz+/+; Fgf8Lacz/+and Fuz-/-; Fgf8Lacz/+embryos.
Figure 2—figure supplement 2
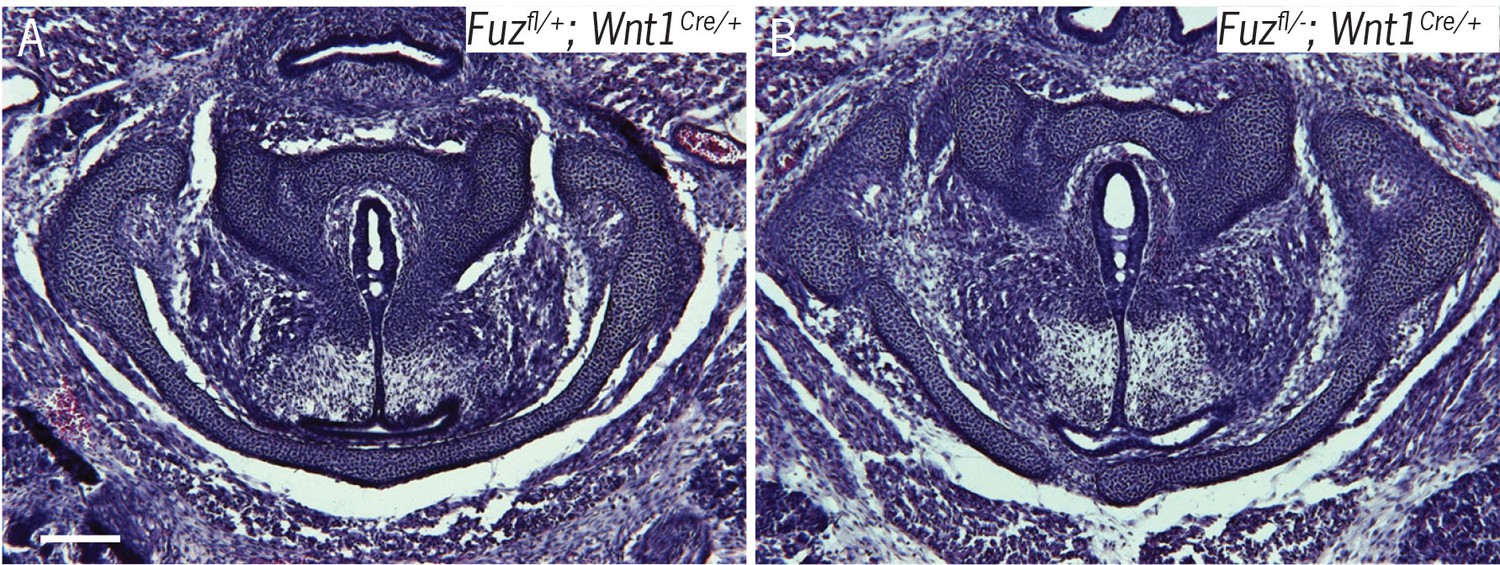
Wnt1Cre driven deletion of Fuz does not affect laryngeal morphology.
(A–B) H&E staining of horizontal sections E16.5 larynges in FuzFl/+; Wnt1Cre/+(A) and FuzFl/+; Wnt1Cre/+ (B) embryos.
Figure 3
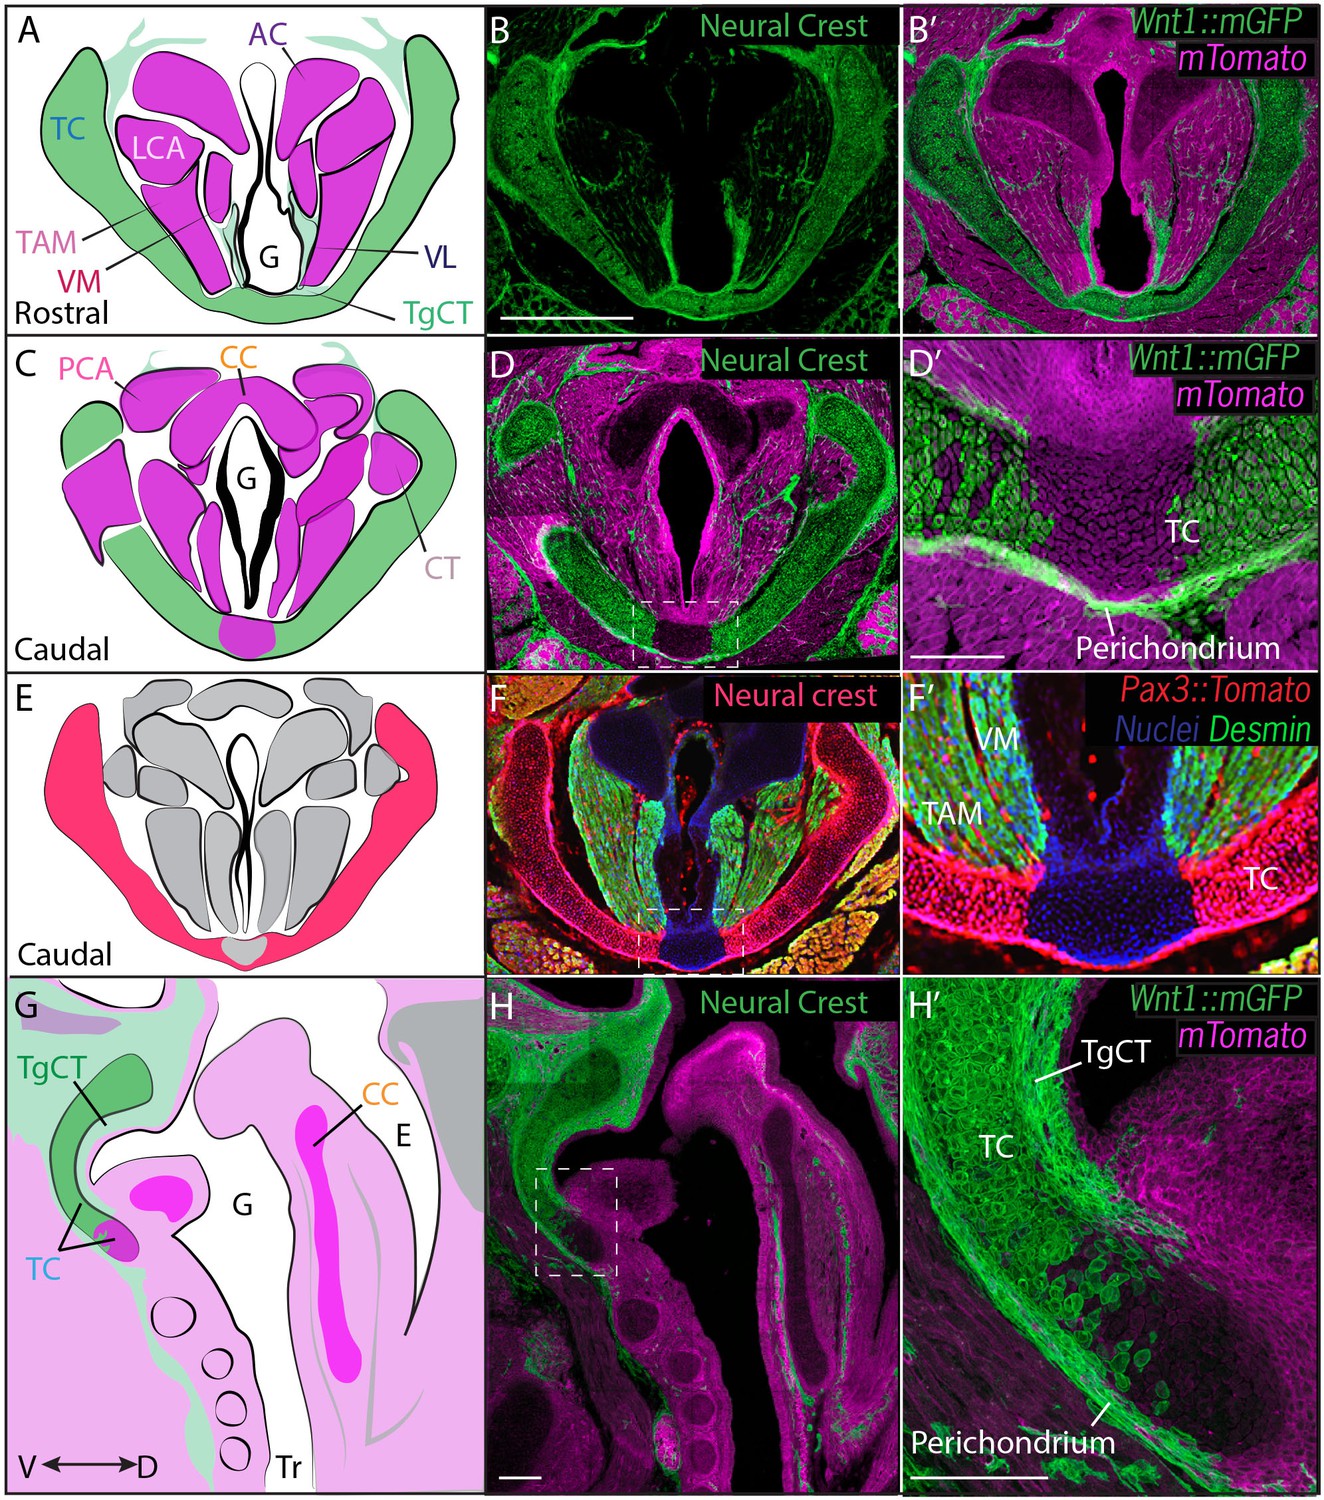
Thyroid cartilage and vocal ligament are mostly neural crest derived.
(A) Diagram representing anatomy in (B–B’). (B–B’) Horizontal section of rostral E18.5 Wnt1Cre/+; R26mTmGlarynx. Neural crest derivatives are labeled in green while other tissues are labeled with Magenta. (B–C) Scale bar indicates 200 μm. (C) Diagram representing anatomy in (D–D’) Horizontal section of caudal E18.5 Wnt1Cre/+; R26mTmGlarynx. (E) Diagram representing anatomy in (F–F’). (F–F’) Horizontal caudal section of E18.5 Pax3Cre/+; R26tomato larynx that is also immunostained for Desmin which marks muscle (Green and yellow in cells that have also expressed Pax3) and nuclei (Blue). (G) Diagram representing anatomy in (H–H’). (H–H’) Sagittal section of E18.5 Wnt1Cre/+; R26mTmGlarynx. Thyroglottal Insets are indicated with white dotted box. (F–F’) Scale bars indicate 100 μm. Abbreviations: (AC) Arytenoid Cartilage, (CC) Cricoid Cartilage, (CT) Cricothyroid muscle, (E) Esophagus, (G) Glottis, (L) Larynx, (LCA) Lateral Cricoarytenoid muscle, (PCA) Posterior Cricoarytenoid muscle, (TAM) Thyroarytenoid Muscle, (TC) Thryoid Cartilage, (TgCT) Thyroglottal connective tissue, (Tr) Trachea, (VL) Vocal Ligament, (VM) Vocalis Muscle, (VF) Vocal fold. (V) and (D) indicate dorso-ventral axes.
Figure 4
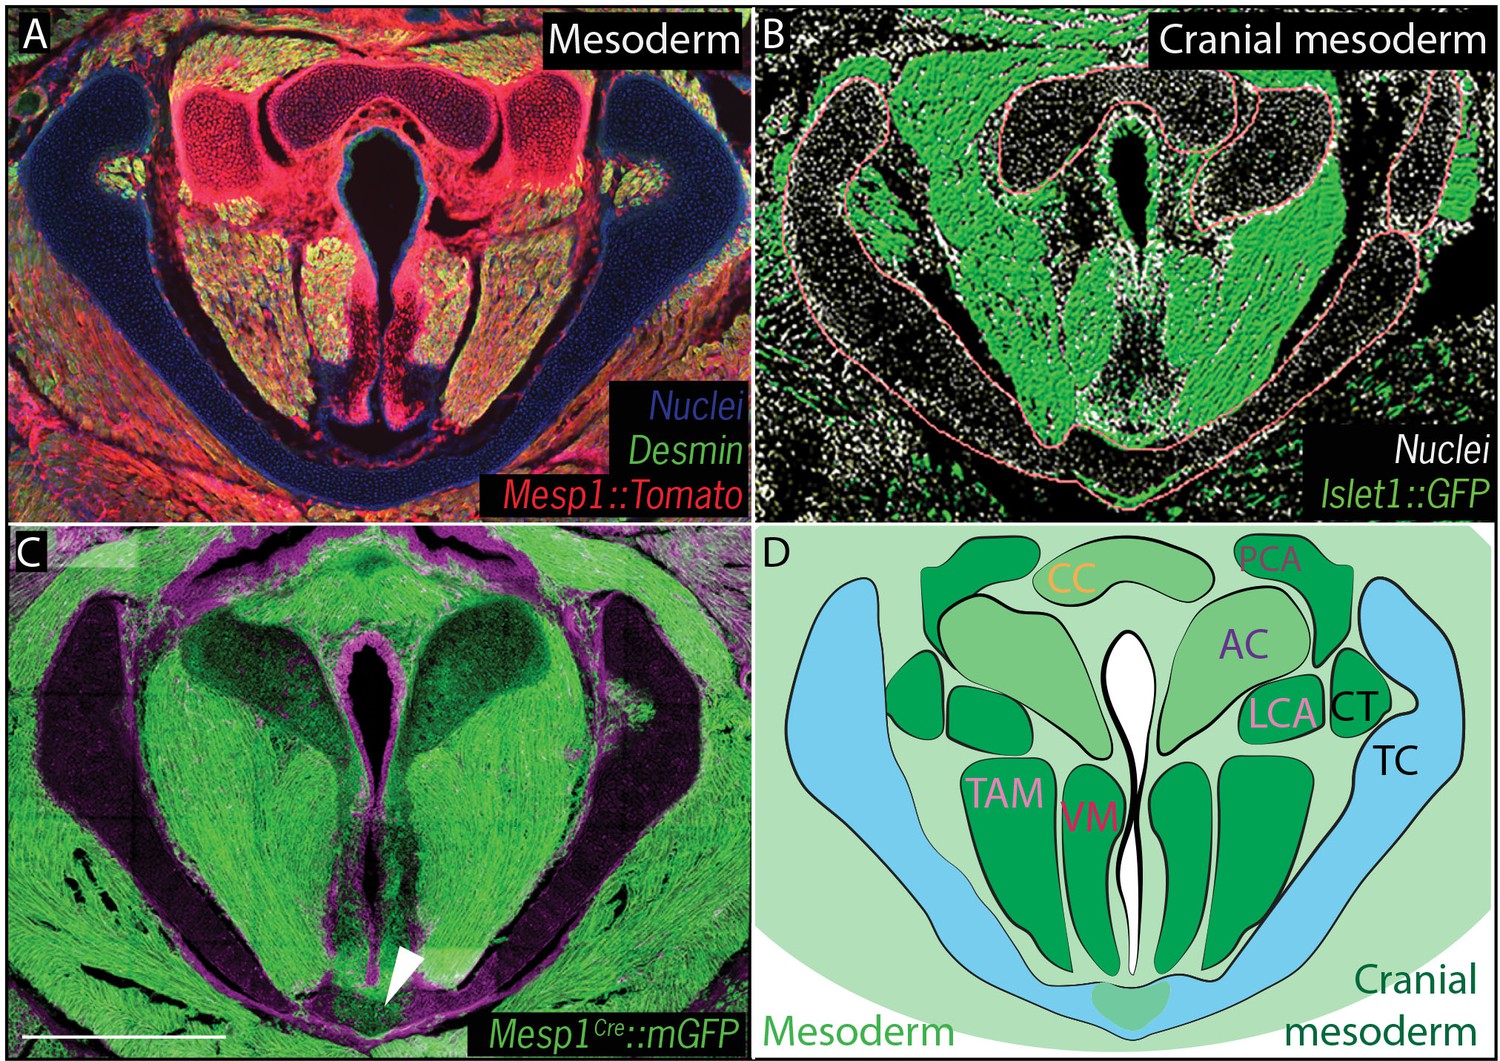
Vocal fold muscles are from cranial mesodermal origin.
(A) Horizontal section of rostral E18.5 Mesp1Cre; R26Tomatolarynx showing that the arytenoid and cricoid cartilages, and Desmin-positive vocal fold muscles are derived from mesoderm. (B) Horizontal section of rostral E18.5 Islet1Cre; R26mTmGlarynx indicating that all the vocal fold muscles are of cranial mesoderm origin. (C) Horizontal section of E18.5 larynx of Mesp1Cre; R26mTmG mouse showing the ventral part of the thyroid cartilage derived from mesoderm. (D) Diagram of anatomy represented in (A–C). The mesoderm derivatives are labeled in light green while the specific muscular cranial mesoderm derivatives are labeled in dark green. Scale bars indicate 100 μm. Abbreviations: (AC) Arytenoid Cartilage, (CC) Cricoid Cartilage, (CT) Cricothyroid muscle, (LCA) Lateral Cricoarytenoid muscle, (PCA) Posterior Cricoarytenoid muscle, (TAM) Thyroarytenoid Muscle, (TC) Thryoid Cartilage, (Tr) Trachea,, (VM) Vocalis Muscle, (VF) Vocal fold.
Figure 5
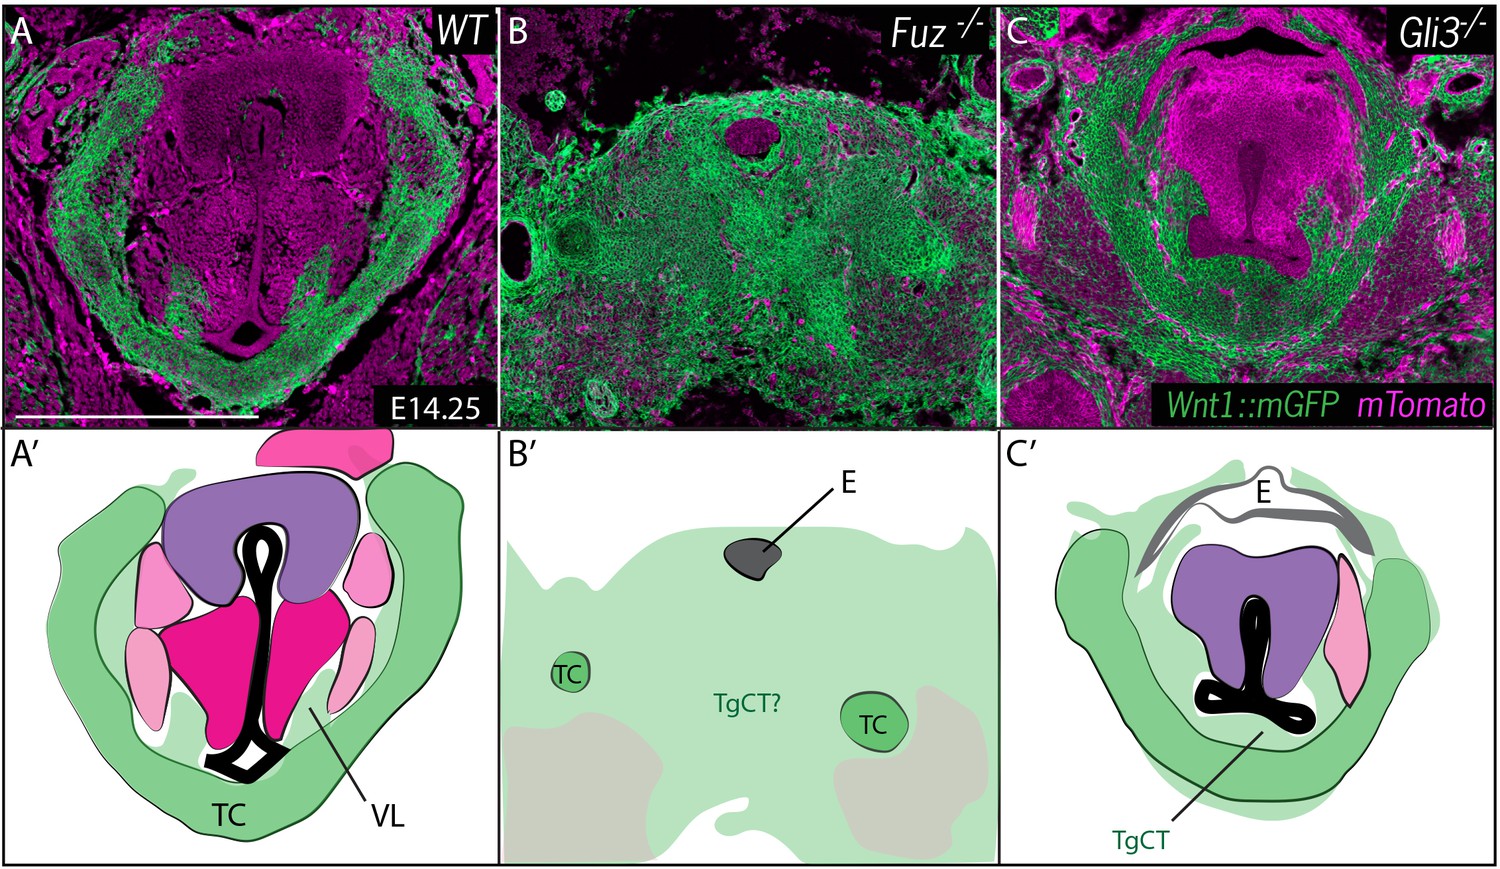
Neural crest is expanded in Fuz and Gli3 mutant larynges.
(A–C) Horizontal section of E14.25 larynges. (A) Wild Type Wnt1Cre::mGFP labeled larynx (B) Fuz-/-; Wnt1Cre/+; R26mTmG larynx. (C) Gli3-/-;Wnt1Cre/+; R26mTmG. Neural crest is labeled in green and other tissues in magenta. (A’–C’) Diagrams representing anatomy found in (A–C). Abbreviations: (AC) Arytenoid Cartilage, (CC) Cricoid Cartilage, (CT) Cricothyroid, (E) Esophagus, (G) Glottis, (L) Larynx, (LCA) Lateral Cricoarytenoid, (PCA) Posterior Cricoarytenoid muscle, (TAM) Thyroarytenoid Muscle, (TC) Thryoid Cartilage, (T) Tongue, (Tr) Trachea, (VL) Vocal Ligament, (VM) Vocalis Muscle, (VF) Vocal fold. (V) and (D) indicate dorsal ventral axes. Scale bars indicates 200 μm.
Figure 6

Expanded Thyroglottal connective tissue in Gli3 mutants is neural crest derived.
(A–C) Horizontal sections of the E18.5 ventral larynx in Gli3+/+;Wnt1Cre/+; R26mTmG(A) Gli3+/-;Wnt1Cre/+; R26mTmG (B) Gli3-/-;Wnt1Cre/+; R26mTmG(C) embryos. (A’–C’) Diagrams representing anatomy observed in (A–C). Black dotted line indicates sectional plane for (D–F’). (D–F) H&E staining of midline sagittal sections of E18.5 larynges in Gli3+/+(D), Gli3+/- (E); Gli3-/- (F) embryos. (D’–E’) Magnified view of Thyroglottal Connective tissue (green arrows) of the vocal pouch from sections in (D–F). Abbreviations: (E) Esophagus, (G) Glottis, (VL) Vocal Ligament, (VM) Vocalis Muscle, (TAM) Thyroarytenoid Muscle. Scale bars indicate 100 μm.
Figure 7
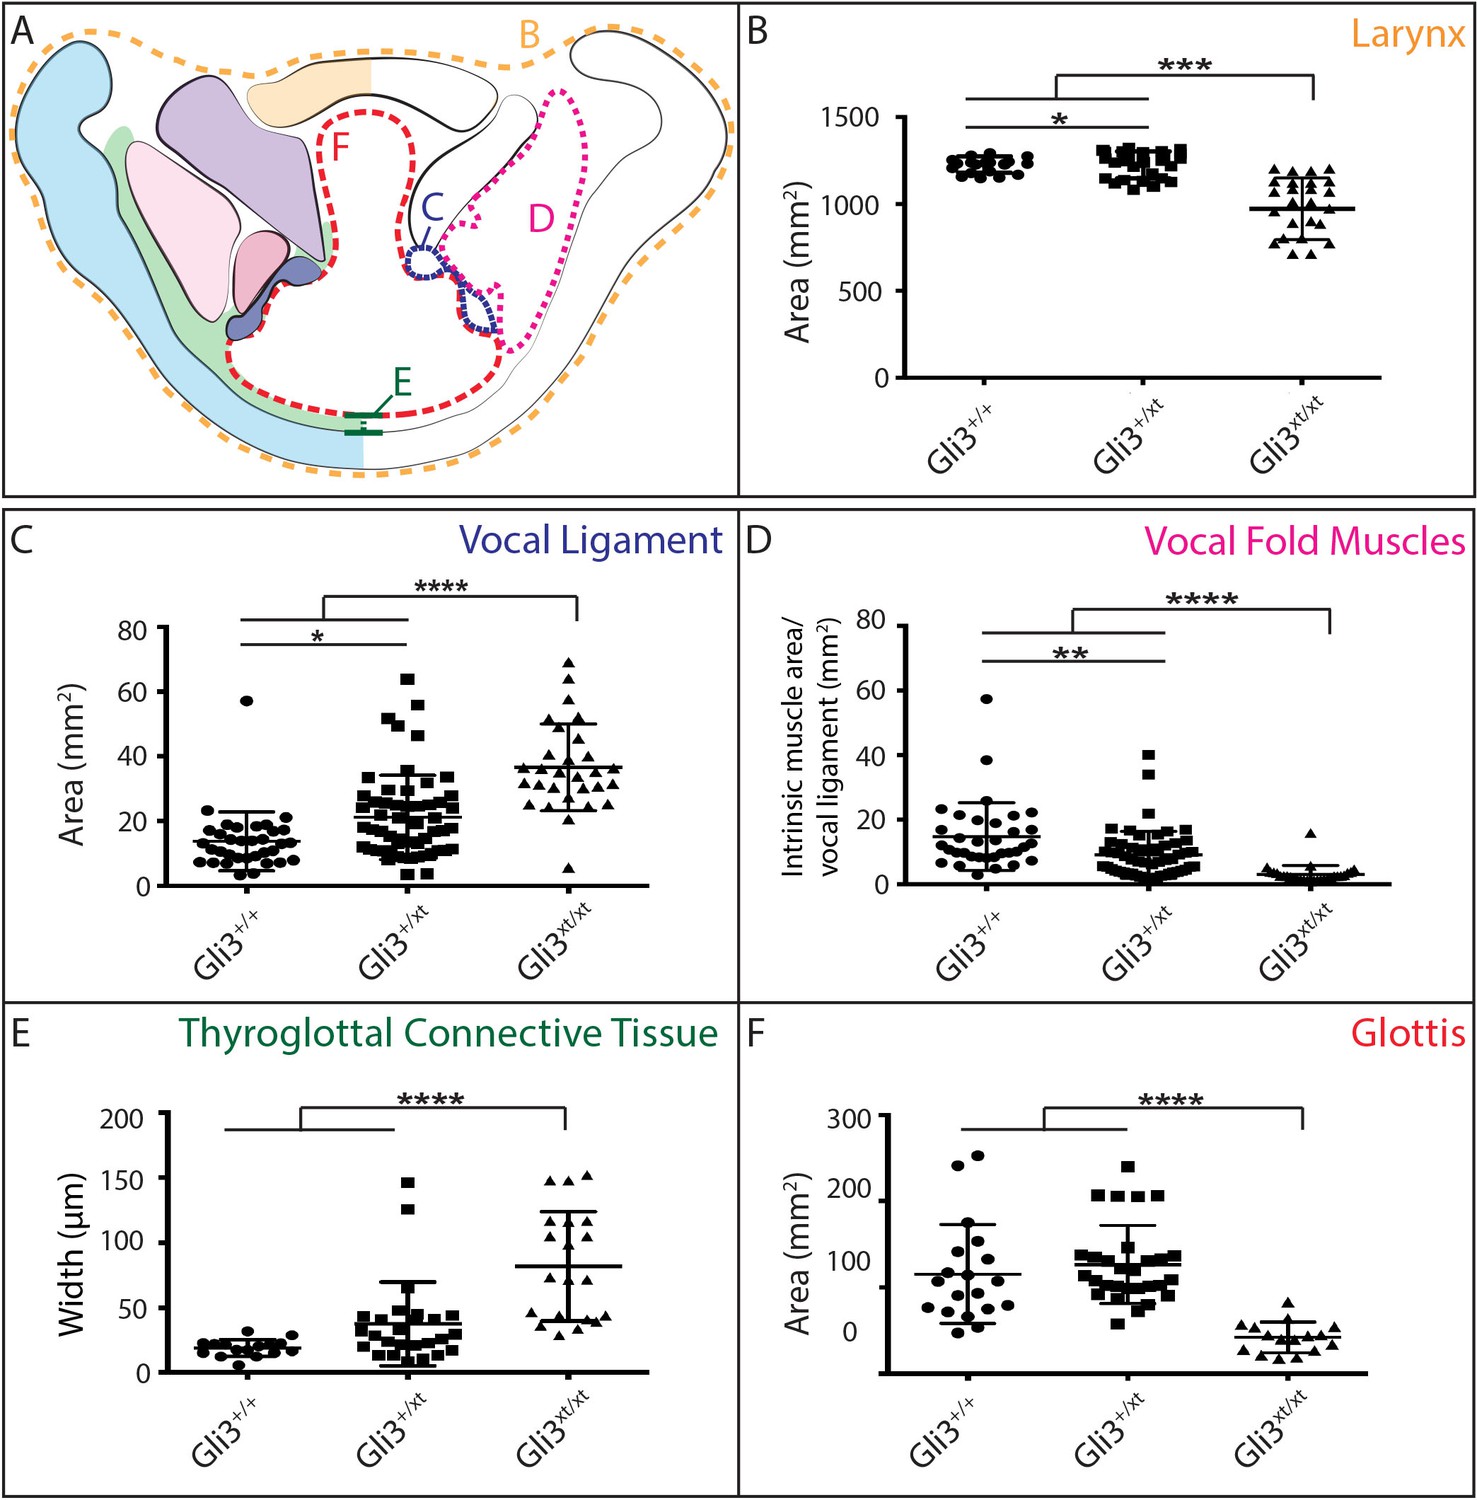
Gli3 mutant laryngeal morphology is significantly altered.
(A) Diagram representing laryngeal measurement presented in (B–F). (B) Quantification of total laryngeal cross sectional area excluding extrinsic muscles in E18.5 Gli3+/+ (n = 5), Gli3+/- (n = 5), Gli3-/- (n = 5) embryos (orange, (A). (C) Quantification of Vocal ligament area E18.5 Gli3+/+, Gli3+/-, Gli3-/- embryos (blue, (A). (D) Quantification of vocal fold muscle area in E18.5 Gli3+/+, Gli3+/-, Gli3-/- embryos. (E) Quantification of Thyroglottal connective tissue is in E18.5 Gli3+/+, Gli3+/-, Gli3-/- embryos. (F) Quantification of Glottic space in E18.5 Gli3+/+, Gli3+/-, Gli3-/- embryos. P values, * = 0.05, ** = 0.01, *** >0.001, **** >0.0001.
Figure 8
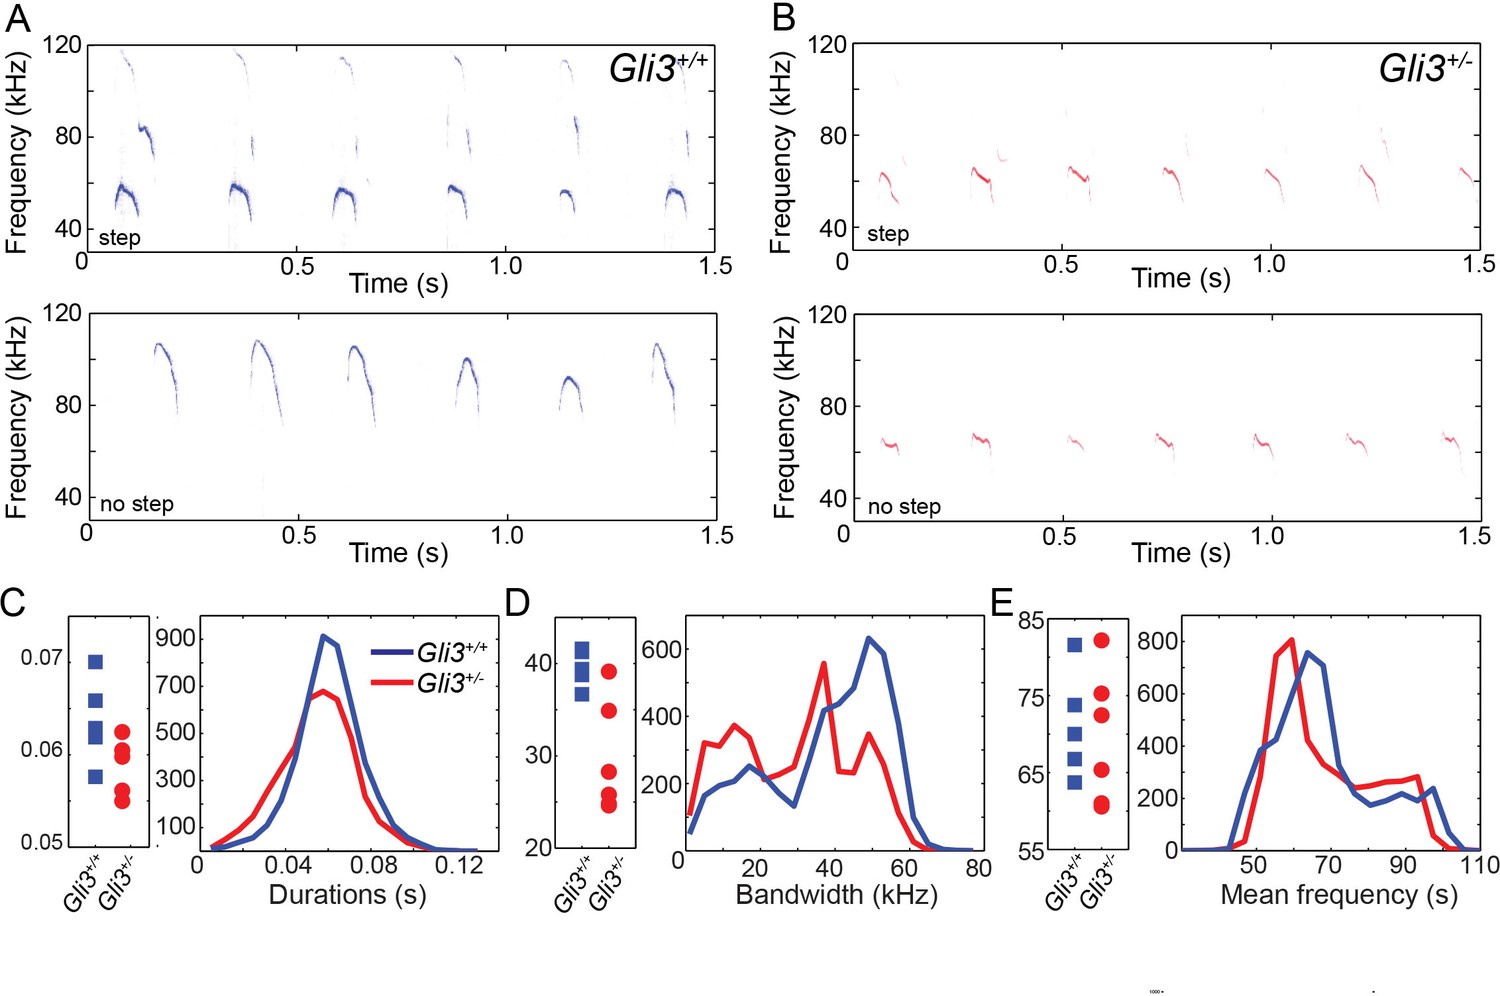
WT and HT vocalizations do not differ on simple acoustic measures.
(A) Examples of Gli3+/- vocalizations with (top panel) and without (bottom panel) frequency steps. (B) Examples of Gli3+/- vocalizations with (top panel) and without (bottom panel) frequency steps. (C) Duration of Gli3+/- (blue) and Gli3+/- (red) pup vocalizations. Average values for each individual (left panel) and summary histogram of all vocalizations (right panel). (D) Bandwidth of Gli3+/+ (blue) and Gli3+/- (red) pup vocalizations. Average values for each individual (left panel) and summary histogram of all vocalizations (right panel). (E) Mean frequency of Gli3+/- (blue) and Gli3+/- (red) pup vocalizations. Average values for each individual (left panel) and summary histogram of all vocalizations (right panel).
Figure 9
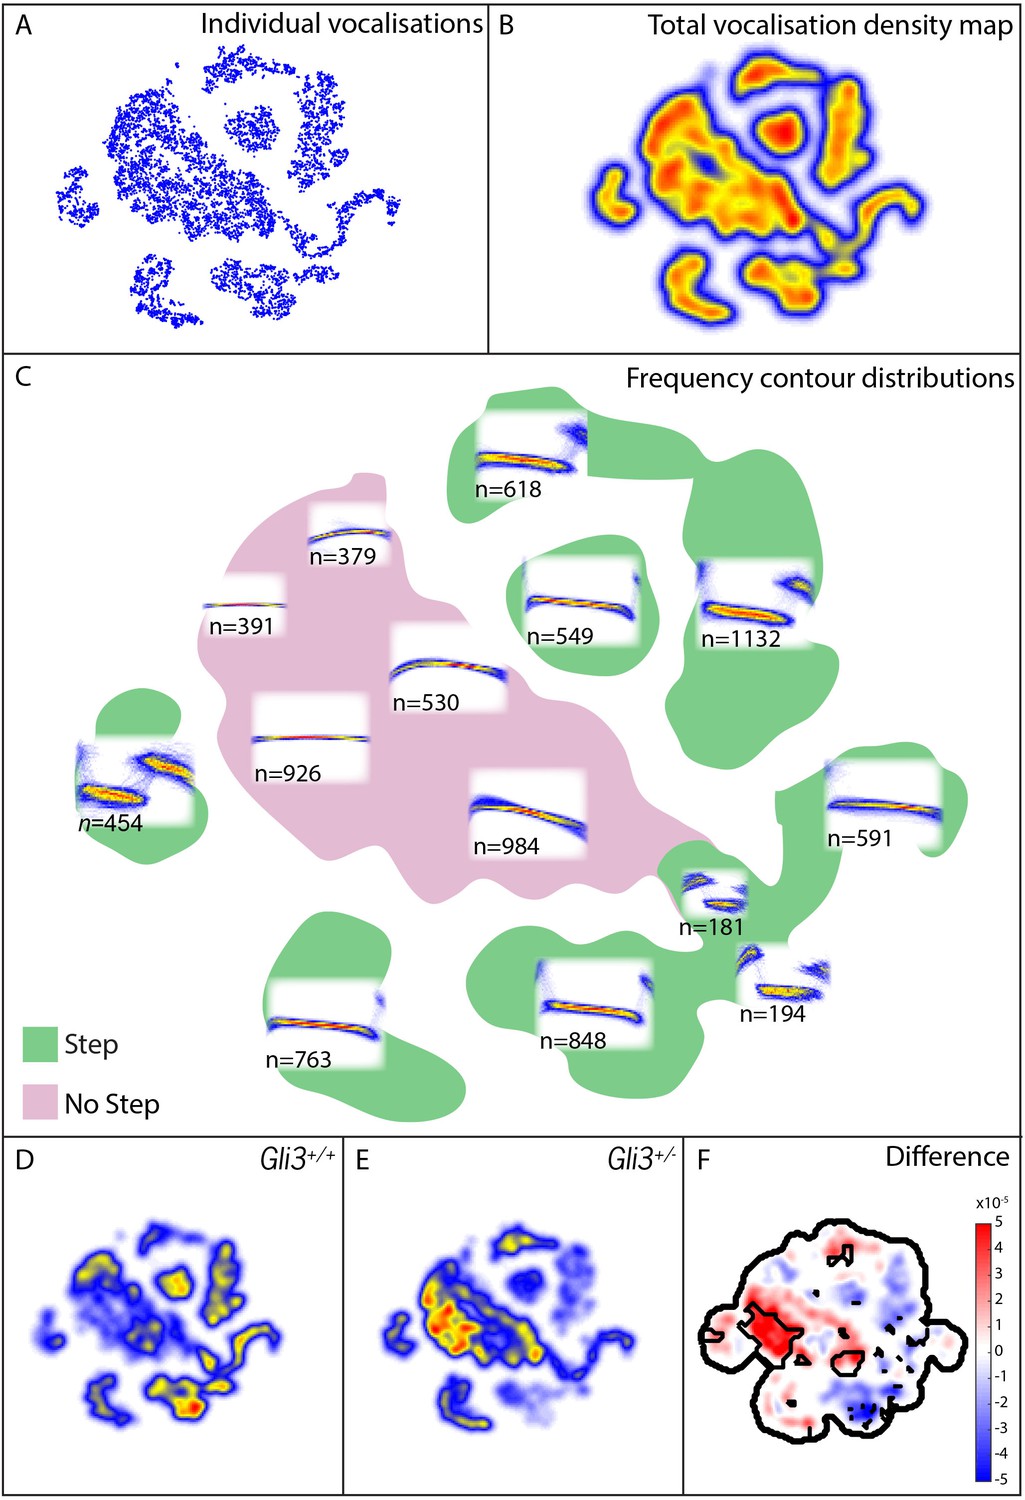
Map of pup vocal repertoire reveals differences in acoustic structure.
(A) Position of each vocalization within the vocal repertoire map (Individual vocalizations). To generate the map, we defined the difference between two vocalizations to be the dynamically time-warped (Sakoe and Chiba, 1978) mean squared error between them. Low-dimensional structure is then extracted from these distances using t-Distributed Stochastic Neighbor Embedding (t-SNE) [van der Maaten and Hinton (2008) and Berman et al. (2014), resulting in the points seen in (A). This embedding results in a clustered structure, This two dimensional non-linear embedding preserves local neighbor relationships in the original high dimensional space. Because this embedding could be equivalently presented at any angle, the vertical and horizontal axes here are arbitrarily chosen and do not represent, for example, the leading directions of variation within the data set. (B) Estimated density of the vocalizations within the map (total vocalization density map). (C) Overlapped frequency contours for regions across the vocal repertoire map, showing the distribution of syllable types (Frequency Contour Distribution). (D) Gli3+/+ vocalizations in the map. (E) Gli3+/- vocalizations in the map. (F) Difference between the maps with significance regions outlined. (F1,9 = 0.04, p=0.85) were observed, and only non-significant changes we observed in frequency bandwidth (F1,9 = 1.26, p=0.29) and average frequency (F1,9 = 0.28, p=0.61).
Download links
A two-part list of links to download the article, or parts of the article, in various formats.
Downloads (link to download the article as PDF)
Open citations (links to open the citations from this article in various online reference manager services)
Cite this article (links to download the citations from this article in formats compatible with various reference manager tools)
Cilia-mediated Hedgehog signaling controls form and function in the mammalian larynx
eLife 6:e19153.
https://doi.org/10.7554/eLife.19153


