Phenotypic plasticity as an adaptation to a functional trade-off
- University of Minnesota, United States
- College of Ecology and Evolution, Peoples Republic of China
Figures
Figure 1
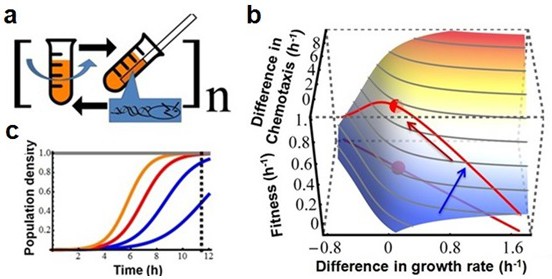
Testing the existence of a trade-off between growth rate and chemotaxis using experimental evolution.
(a) Experimental design. Bacteria are grown in a batch culture of rich medium for 11.5 hr to late exponential phase (Figure 2b, dashed curve). A capillary carrying fresh medium is lowered into the culture (after wash and dilution, see Materials and methods) for 30 min to attract chemotactically active cells. Cells thus collected are used to inoculate another batch culture. The cycle is repeated 150 times (approximately1650 generations). (b) Predicted adaptive landscape. The experimental system defines an adaptive landscape that can be described mathematically from first principles. Relative fitness plotted as a function of the differences in growth rates and chemotactic abilities , is determined a priori by the experimental conditions and is robust to violations of assumptions (Appendix).The trade-off, who's position must be determined empirically, is absent when a population evolves along a positive diagonal (blue arrow) and present when a population evolves along a negative diagonal (red arrow) (Agrawal et al., 2010). The red dot marks maximum fitness on the Pareto front of the trade-off. (c) Curvature in the landscape is produced by the population density at the point of capillary selection (dashed line) becoming less dependent on growth rate as the latter is increased from low (blue) to high (red and orange). In other words, as growth rate increases, its contribution to fitness diminishes due to the sigmoid nature of logistic growth.
Figure 2 with 7 supplements
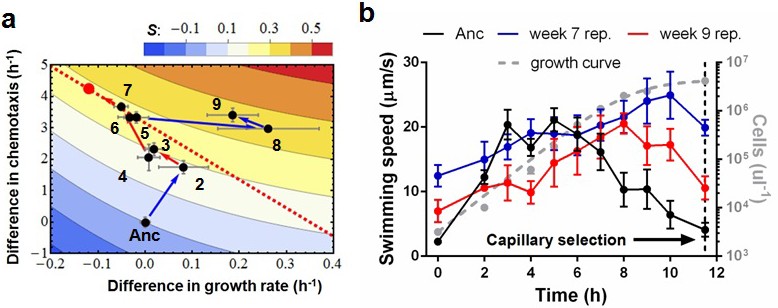
Phenotypic plasticity in the face of a trade-off between growth rate and chemotaxis.
(a) An evolutionary trajectory through the known adaptive landscape. Numbers indicate the stage of evolution in weeks. The dashed line denotes the empirically determined Pareto front and the red dot denotes its fitness maximum. Contours mark fitness isoclines. Each point represents the average of six clones randomly picked from the evolving population. The large standard errors noticeable at week 8 are a consequence of transient polymorphisms as new fitter mutants sweep into the population. (b) Swimming speeds of representative clones from different stages. Each point represents the mean of five replicate populations, each of which is the mean of ~400 cells. Error bars represent standard deviations. The dashed curve indicates a typical growth curve with its vertical axis on the right. After six hours, growth rate diminish and the populations start transitioning from exponential to stationary phase. Each point is the average taken from three replicate populations. Error bar are standard deviations.
Figure 2—figure supplement 1
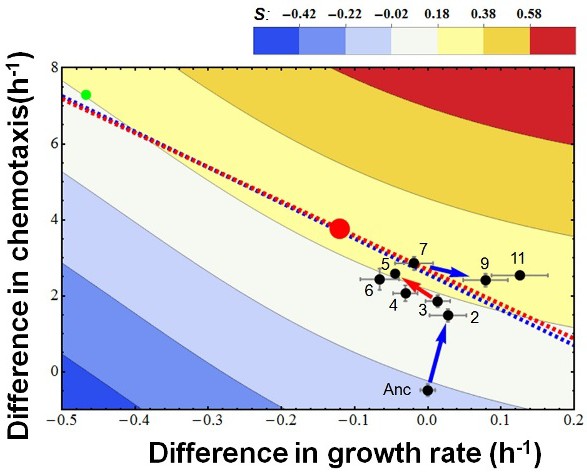
The overall evolutionary trajectory of all five populations.
The red regression line is the same as in Figure 2a whereas the blue line is regressed from the pooled data of the other four populations. Red and green balls indicate the theoretical optimum and an observed outliner strain. Color codes fitness.
Figure 2—figure supplement 2
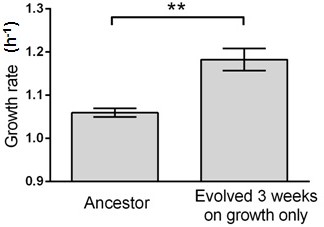
Growth rate evolves 11.6% faster within 3 weeks (c.a. 460 generations) in this control experiment without capillary selection.
Six isolates from the ancestral strain and the evolving population were randomly picked for growth rate measurements. Error bars indicate one standard error. T-test gives a p-value of 0.0022.
Figure 2—figure supplement 3
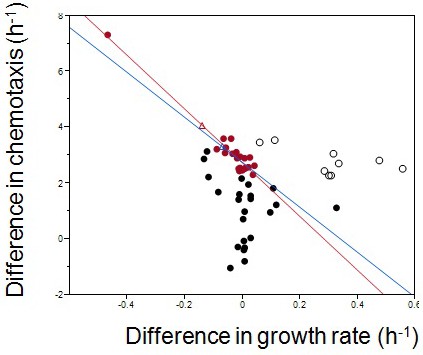
Empirical Pareto front and theoretical fitness optimum.
Each dot represents one of six isolates from weekly samples of the focal population. Red dots were chosen for the regression.The red line is the linear regression to the red dots; the blue line excludes the outlier in the upper left corner. Diff. chemotaxis = 2.7–9.6*diff. growth rate, for the red line; Diff. chemotaxis = 2.7–8.1 *diff. growth rate, for the blue line. The two Pareto fronts define their own theoretical optima (empty triangles). Empty circles are late evolving isolates beyond the Pareto front.
Figure 2—figure supplement 4
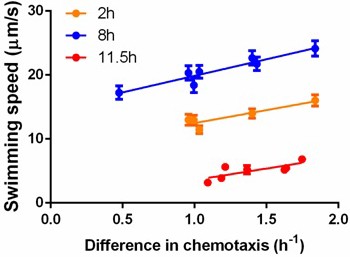
Correlation between swimming speed and chemotactic ability.
Each dot represents measurements for a different isolate. The isolates and their corresponding competitors were sampled from the same stage of growth in order to measure the difference in chemotaxis. Cells were grown in a standard batch culture. Two (orange), eight (blue) and 11.5 hr (red) after inoculation, samples were taken and treated with the standard protocol before measurements. While incubation in capillary competition assay (30 min), swimming speeds were determined within 20 min after sampling. For the two-hour sampling, cells were concentrated by mild centrifugation; the other two points required proper dilution with washing buffer. For orange points, , ; blue points, , ; red points, , . Error bars indicate standard error from ~300 cells per data point.
Figure 2—figure supplement 5
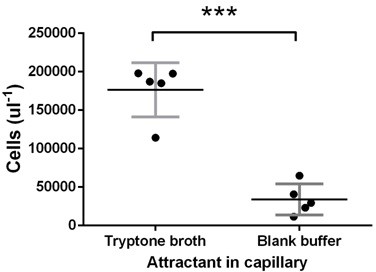
Test of E. coli chemotaxis at the late stage.
Ancestral E. coli cells were grown in tryptone broth for 11.5 hr and harvested for capillary assay as in the experimental evolution. Tryptone broth or buffer were put in the capillary. The vertical axis gives the number of cells attracted into the capillary after 30 min incubationas measured by flow cytometer. Tryptone broth attracted five times cells as that of the buffer (p<0.0001), proving that cells at this stage of growth did chemotaxis. Each dot represents an experimental replication.
Figure 2—figure supplement 6
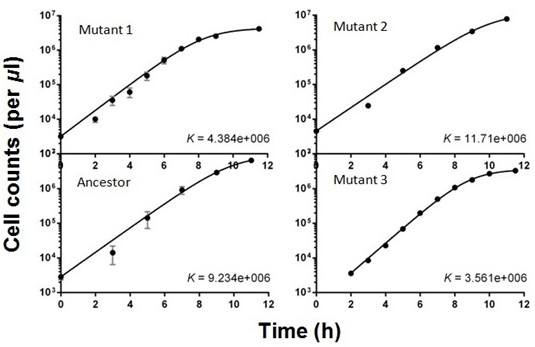
Logistic growth curves fitted to data from isolated clones.
Each point represents three to six replicates. Error bars are standard deviations. Cell densities were determined using flow cytometry. These mutants were isolated at week 9.
Figure 2—figure supplement 7
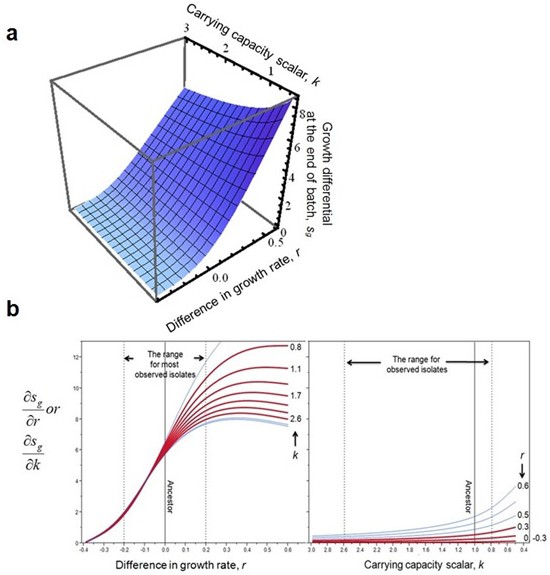
The impact of r and k on competition at the end of batch growth, f, a, and its derivatives, b.
The surface and derivatives were generated with appropriate parameterization (w0 = 1/2000, t = 11.5, step size for derivatives is 0.01 for both variables). Dashed lines and red curves in b mark the parameter space for evolved isolates. Note that the axis for k is reversed.
Figure 3 with 3 supplements

Molecular, physiological and fitness impacts of the adaptive mutations.
(a) Intracellular concentrations of c-di-GMP inthe ancestor (Anc) and phase 2 isolate (P2) as measured by Vc2 riboswitch (Sudarsan et al., 2008) expressed GFP. (b) GFP expression driven from an ectopic fliC promoter in the ancestor and in the phase 3 isolate (P3). Each point represents the mean of three replicates. (c) and (d). Swimming speed of wildtype fliA (solid curve) and mutant fliA (dashed curve) in the ancestral (black) or phase 3 (red) genetic backgrounds. Each point represents the mean of five replicate populations, each of which is the mean of ~400 cells. Error bars represent standard deviations. (e) Fraction of motile cells within isogenic populations. Legend and data symbols follow that of c and d. (f) Effect of the fliA mutation on growth rate and chemotaxis. Ancestral background (black), phase 3 background (red), wildtype fliA (filled circles) and mutant fliA (open circles). Values are normalized to mean values of wildtype fliA. Bar indicates mean. For all panels, ∗ indicates statistical significance at least of 0.05 with three to five replicate populations; , with nine replicate populations; + , with 200 cells randomly pooled from the replicate populations for comparison.
Figure 3—figure supplement 1
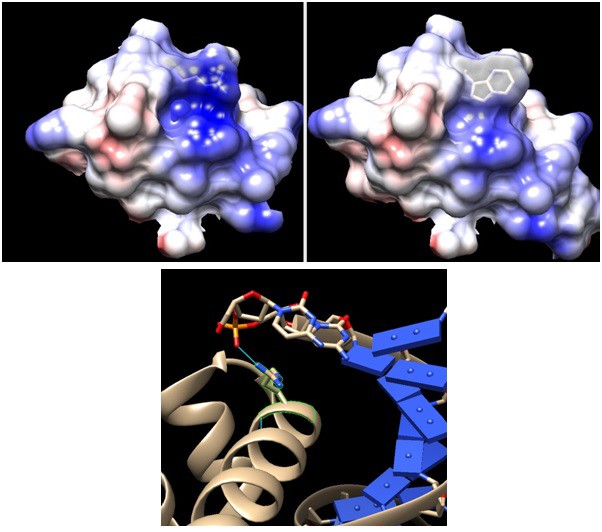
Comparison between wildtype and mutant sigma factor F at the DNA binding domain.
Upper panels: Arginine 220 of wildtype FliA (left, PDB:1SC5) is mutated to tryptophan (right). Positive charge –indicated by Coulombic surface coloring (blue for positive and red for negative) – of the cleft area is reduced by the mutation, although the side chain protrusion is retained. Lower panel: DNA binding domain of Thermus aquaticus sigma factor A – having the same DNA binding domain of helix-turn-helix – bound to −35 element DNA(PDB: 1KU7). The conserved arginine is highlighted in green with its hydrogen bond to the DNA backbone phosphate indicated by blue line. The modeling and visualization were done using UCSF Chimera software. Coulombic surface coloring is a built-in function and the default parameters were used. The R220Wwas introduced using the function 'rotamers' and the most likely confirmation, which minimizes steric hindrance with the wildtype structure, was chosen from the Dunbrack library.
Figure 3—figure supplement 2
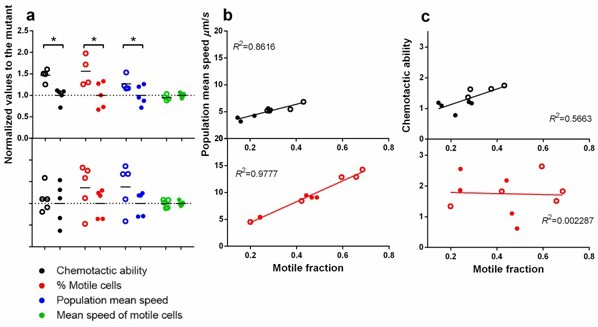
Statistical structure of swimming speed within isogenic populations and its impact on chemotaxis.
Upper panels are in ancestral background and lower, P3. Filled circles are wildtype fliA and empty, mutant. ∗ indicates statistical significance at least of 0.05 with four to five replicate populations a. Comparison between the two versions of fliA in their effect on chemotactic ability, percentage of motile cells, population mean speed and mean speed of motile cells. (b) Regression of population mean speed with percentage of motile cells. (b) Regression of chemotactic ability with percentage of motile cells. For b and c, the upper and lower panels were drawn with the same scale for direct comparison.
Figure 3—figure supplement 3
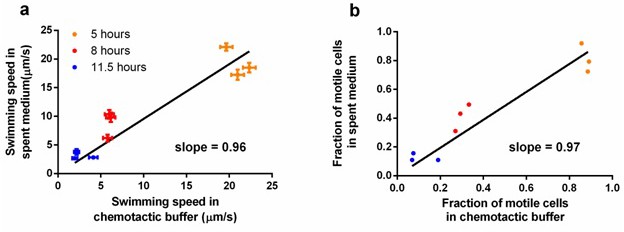
Comparison of measurements taken in spent medium and in chemotactic buffer.
Ancestral E. coli cells were grown in tryptone broth per standard protocol and sampled at three different time points. Cells were mildly centrifuged to be resuspended in supernatant (spent medium) and chemotactic buffer separately. (a) Comparison in swimming speed. Each dot represents an independent culture. The regression line was forced to pass the origin, p<0.0001. Error bar indicates the standard error of 174 cells. (b) Comparison in the fraction of motile cells. The data used is the same as in a. The regression line was forced to pass the origin, p<0.0001. With slopes close to one in both, we conclude that our measurements in chemotactic buffer does not deviate significantly from those in the natural environment of the experimental evolution.
Tables
Table 1
Complete mutations of representative isolates from week 7 and week 9. Note that there is no overlap in mutations between the two isolates.
| Nucleotide change | Animo acid substitutionor genomic context | Genes | Phenotypes | |
|---|---|---|---|---|
| Week 7 isolate | G→T | G167C (GGT→TGT) | yahA → | c-di-GMP-specific phosphodiesterase |
| G→T | L356L (CTC→CTA) | dcp ← | dipeptidylcarboxypeptidase II | |
| repeat_region (–) +4 bp | intergenic (−209/−52) | udk ← / → yegE | uridine/cytidine kinase/diguanylatecyclase | |
| repeat_region (+) +4 bp | intergenic (+113/−115) | yqaD → / → CsiD | orf, hypothetical protein/orf, hypothetical protein | |
| repeat_region (–) +9 bp | coding (1504– 1512/2247 nt) | ptsP ← | PTS system, enzyme I, transcriptional regulator (with NPR and NTR proteins) | |
| Week 9 isolate | Δ5579 bp | [gapC]–[ydcJ] | [gapC], cybB, ydcA, hokB, mokB, trg, ydcI, [ydcJ] | |
| G→A | R220W (CGG→TGG) | fliA ← | flagellar biosynthesis; alternative sigma factor 28; regulation of flagellar operons | |
| C→T | E82K (GAA→AAA) | rpsC ← | 30S ribosomal subunit protein S3 | |
| repeat_region (+) +5 bp | intergenic (+86/−36) | rbsB → / → rbsK | D-ribose periplasmic binding protein/ribokinase |
Download links
A two-part list of links to download the article, or parts of the article, in various formats.
Downloads (link to download the article as PDF)
Open citations (links to open the citations from this article in various online reference manager services)
Cite this article (links to download the citations from this article in formats compatible with various reference manager tools)
Phenotypic plasticity as an adaptation to a functional trade-off
eLife 5:e19307.
https://doi.org/10.7554/eLife.19307


