Phenotypic plasticity as an adaptation to a functional trade-off

  1. Xiao Yi  Is a corresponding author
  2. Antony M Dean  Is a corresponding author
  1. University of Minnesota, United States
  2. College of Ecology and Evolution, Peoples Republic of China

Abstract

We report the evolution of a phenotypically plastic behavior that circumvents the hardwired trade-off that exists when resources are partitioned between growth and motility in Escherichia coli. We propagated cultures in a cyclical environment, alternating between growth up to carrying capacity and selection for chemotaxis. Initial adaptations boosted overall swimming speed at the expense of growth. The effect of the trade-off was subsequently eased through a change in behavior; while individual cells reduced motility during exponential growth, the faction of the population that was motile increased as the carrying capacity was approached. This plastic behavior was produced by a single amino acid replacement in FliA, a regulatory protein central to the chemotaxis network. Our results illustrate how phenotypic plasticity potentiates evolvability by opening up new regions of the adaptive landscape.

https://doi.org/10.7554/eLife.19307.001

Introduction

Trade-offs arise when finite resources are allocated to different traits such that an increase in one causes a decrease in another. In variable environments trade-offs can be imposed consecutively, with different traits favored at different times. There are now two possible adaptive responses: (i) simultaneously optimize the traits or (ii) change the traits dynamically to match the prevailing conditions, a phenomenon called phenotypic plasticity. Theoretical models predict that, provided the genetic variation exists to generate a suitably plastic response, the second should be favored because it reduces the costs imposed by the trade-offs (De Jong, 1993; King and Roff, 2010; Malausa et al., 2005; Murren et al., 2015; Roff, 2001; Scheiner, 1993; van Noordwijk and de Jong, 1986; Worley et al., 2003). For example, changes in insect wing morphology with varying environmental conditions, such as temperature and food quality, have been attributed to the trade-off between flight capability and reproduction (Harrison, 1980; Zera et al., 1997). Wings develop fully only in stressful environments, allowing insects to escape adversity while minimizing costs to reproduction in benign environments (Harrison, 1980).

Empirical examples of both phenotypic plasticity and trade-offs abound, but rarely has phenotypic plasticity been proved to be an adaptive response to trade-offs (King and Roff, 2010). Nor have the genetic architectures underlying phenotypic plasticity been identified (Murren et al., 2015). These difficulties are due to the lack of a simple tractable experimental system.

Here, we use Escherichia coli to explore a trade-off between two traits, growth rate and chemotaxis – the ability to move up a concentration gradient of nutrients. By monitoring phenotypic evolution in a well-defined selective environment, we can show how these traits are first simultaneously optimized before an adaptively plastic response evolves that gains access to a new region of the adaptive landscape.

Extensive studies from molecular biology and physiology have established that both growth and chemotaxis are energetically expensive and critically important to fitness (Freter and O'Brien, 1981; Macnab, 1996). Given bacterial metabolic rates are limited (Makarieva et al., 2008), there must be a trade-off between growth and chemotaxis. To test this, five populations of wildtype E. coli were propagated in a serial transfer regime that alternated between competitive growth in batch culture and capillary selection for chemotaxis (Figure 1a).

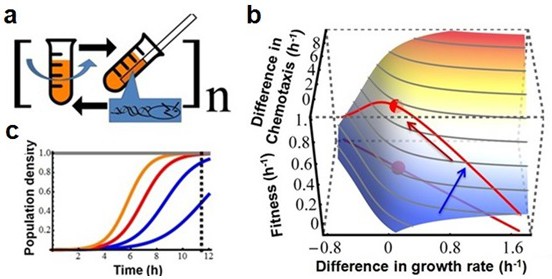
Testing the existence of a trade-off between growth rate and chemotaxis using experimental evolution.

(a) Experimental design. Bacteria are grown in a batch culture of rich medium for 11.5 hr to late exponential phase (Figure 2b, dashed curve). A capillary carrying fresh medium is lowered into the culture (after wash and dilution, see Materials and methods) for 30 min to attract chemotactically active cells. Cells thus collected are used to inoculate another batch culture. The cycle is repeated 150 times (approximately1650 generations). (b) Predicted adaptive landscape. The experimental system defines an adaptive landscape that can be described mathematically from first principles. Relative fitness (w) plotted as a function of the differences in growth rates (rmrw) and chemotactic abilities (cmcw), is determined a priori by the experimental conditions and is robust to violations of assumptions (Appendix).The trade-off, who's position must be determined empirically, is absent when a population evolves along a positive diagonal (blue arrow) and present when a population evolves along a negative diagonal (red arrow) (Agrawal et al., 2010). The red dot marks maximum fitness on the Pareto front of the trade-off. (c) Curvature in the landscape is produced by the population density at the point of capillary selection (dashed line) becoming less dependent on growth rate as the latter is increased from low (blue) to high (red and orange). In other words, as growth rate increases, its contribution to fitness diminishes due to the sigmoid nature of logistic growth.

https://doi.org/10.7554/eLife.19307.002

Our experimental system defines an adaptive landscape in which selection for limited resources during growth is modeled using Lotka-Volterra equations (Gotelli, 1998),

dmdt=rmm(1mw)dwdt=rww(1mw)

where m and w are the population sizes for the mutant and wildtype normalized to their common carrying capacity, and rm and rw are their respective intrinsic rates of growth. The selection after 11.5 hr of growth, defined as sg=Loge(m11.5/w11.5)Loge(m0/w0), is determined by numerical integration of the Lotka-Volterra equations. The selection after chemotaxis is sc=Loge(m12/w12)Loge(m11.5/w11.5)=0.5 (cmcw) in which cmcw is the difference in chemotactic ability (this difference is equivalent to the difference in growth rates (rmrw) as populations increase exponentially in both situations [Adler, 1973]). There are approximately 11 population doublings (generations) per growth cycle (effectively a 2048-fold dilution into fresh growth medium at the beginning of each growth cycle). Relative fitness of the mutant to wildtype is

w=(sg+sc)/12

Plotting w as a function of the differences in the rates of growth (rmrw) and chemotaxis (cmcw) produces an adaptive surface (Figure 1b) whose curvature is attributable to the deceleration in growth rates as the cultures approach the carrying capacity (Figure 1c). Projecting a hypothetical Pareto front (representing the limit where trade-offs force phenotypes to become tightly negatively correlated) onto the surface produces a maximum. The existence of the trade-off and the location of the Pareto front must be determined empirically. Cultures evolving towards the adaptive peak (red dot, Figure 1b) show that natural selection maximizes fitness in the face of a trade-off.

Evolutionary trajectories across this landscape are characterized by three phases. Figure 2a depicts a typical trajectory (see Figure 2—figure supplement 1 for additional data). During the first phase (weeks 1 and 2) substantial increases in chemotactic ability and fitness occur (ANOVA, p<0.0001; p<0.0001); few isolates have changed growth rates. Therefore no trade-off is present. Control experiments without chemotaxis select for improved growth rates (p=0.0022, Figure 2—figure supplement 2). The selective gradient (Lynch, 1998) (a measure of selective strength) along the growth axis is much steeper than along the chemotaxis axis (0.603 vs. 0.087, Materials and methods). Therefore, adaptation in the early phase is dominated by chemotaxis mutations of large phenotypic effect.

Figure 2 with 7 supplements see all
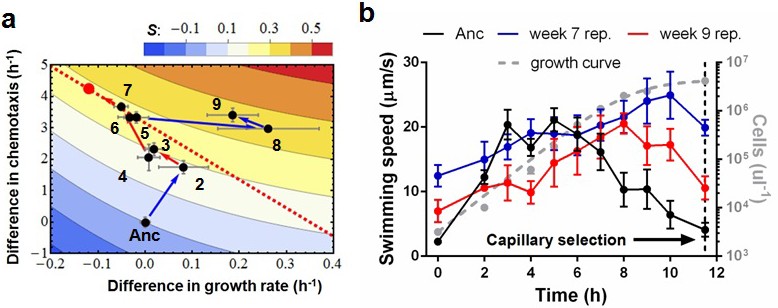
Phenotypic plasticity in the face of a trade-off between growth rate and chemotaxis.

(a) An evolutionary trajectory through the known adaptive landscape. Numbers indicate the stage of evolution in weeks. The dashed line denotes the empirically determined Pareto front and the red dot denotes its fitness maximum. Contours mark fitness isoclines. Each point represents the average of six clones randomly picked from the evolving population. The large standard errors noticeable at week 8 are a consequence of transient polymorphisms as new fitter mutants sweep into the population. (b) Swimming speeds of representative clones from different stages. Each point represents the mean of five replicate populations, each of which is the mean of ~400 cells. Error bars represent standard deviations. The dashed curve indicates a typical growth curve with its vertical axis on the right. After six hours, growth rate diminish and the populations start transitioning from exponential to stationary phase. Each point is the average taken from three replicate populations. Error bar are standard deviations.

https://doi.org/10.7554/eLife.19307.003

The second phase (weeks 2 to 7) is characterized by adaptation to a trade-off. Growth rates decline(p=0.029) as chemotaxis continues to improve (p=0.0018). Regressing growth rate against chemotaxis (data from weeks 5–7, Figure 2—figure supplement 3) reveals a Pareto front (dashed line, Figure 2a) that almost parallels the fitness isoclines. This explains why fitness improves at a slower rate (p=0.0009). By week 6 this evolving population (like the other four) had approached the predicted fitness optimum (red dot, Figure 2a).

Most previous studies of trade-offs have faced difficulties in relating phenotypes to fitness(Agrawal et al., 2010; Allouche et al., 2012; Fonseca-Azevedo and Herculano-Houzel, 2012; Keen, 2014; Keller et al., 2014; King et al., 2004; Mole and Zera, 1993; Phan and Ferenci, 2013; Shoval et al., 2012). In our adaptive landscape the relationships between phenotypes and fitness were defined a priori. Independent regressions from different experimental populations produce similar Pareto fronts (Figure 2—figure supplement 1), with all populations evolving close to the predicted optimum (Figure 2—figure supplement 1). This establishes a hard-wired trade-off between chemotaxis and growth rate attributable to resource/energy limitation (DeLong et al., 2010). The match between the prediction and experimental realizations shows that the interplay of the selective forces is understood and that adaptation is predictable at the phenotypic level.

Week 8 in the third phase saw populations break through the Pareto front with large increases in growth rate (p=0.0068, comparing weeks 7 and 9) while maintaining strong chemotaxis (p=0.77). To understand how the hard trade-off forced by partitioning energy between chemotaxis and growth was overcome we isolated individual clones from the three phases and determined their swimming speed over the course of growth in batch culture. Three patterns were evident (Figure 2b): (1) the ancestor's swimming speed increases during rapid growth and then declines as the carrying capacity is approached, (2) clones from the early and the middle periods swim faster than the ancestor nearly the whole time, the difference becoming more marked during late growth, and (3) clones that broke through the Pareto front reduce swimming speed during rapid growth and increase swimming speed as the carrying capacity is approached.

Chemotactic ability is strongly correlated with swimming speed (Figure 2—figure supplement 4). One adaptation evident in isolates from the first and second phases simply increases swimming speed throughout the growth cycle. This requires diverting resources away from growth, which slows. Genomic sequencing of a phase 2 clone identified two relevant mutations (Table 1):a non-synonymous substitution in yahA and another substitution in the promoter region of yegE. Both genes encode enzymes that metabolize(3′-5′)-cyclic dimeric guanosine monophosphate (c-di-GMP)(Claret et al., 2007; Pesavento et al., 2008), a second messenger that negatively modulates flagellar activity in E. coli (Boehm et al., 2010; Pesavento et al., 2008). We replaced the E. coli lac operon with a synthetic construct in which expression of GFP is post-transcriptionally modulated by the riboswitch, Vc2, which senses c-di-GMP (Sudarsan et al., 2008). As expected, GFP expression shows that the phase 2 isolate has lower intracellular c-di-GMP concentrations at the beginning and end of the growth cycle when its swimming speed is higher than the ancestor (Figure 3a).

Figure 3 with 3 supplements see all
Molecular, physiological and fitness impacts of the adaptive mutations.

(a) Intracellular concentrations of c-di-GMP inthe ancestor (Anc) and phase 2 isolate (P2) as measured by Vc2 riboswitch (Sudarsan et al., 2008) expressed GFP. (b) GFP expression driven from an ectopic fliC promoter in the ancestor and in the phase 3 isolate (P3). Each point represents the mean of three replicates. (c) and (d). Swimming speed of wildtype fliA (solid curve) and mutant fliA (dashed curve) in the ancestral (black) or phase 3 (red) genetic backgrounds. Each point represents the mean of five replicate populations, each of which is the mean of ~400 cells. Error bars represent standard deviations. (e) Fraction of motile cells within isogenic populations. Legend and data symbols follow that of c and d. (f) Effect of the fliA mutation on growth rate and chemotaxis. Ancestral background (black), phase 3 background (red), wildtype fliA (filled circles) and mutant fliA (open circles). Values are normalized to mean values of wildtype fliA. Bar indicates mean. For all panels, ∗ indicates statistical significance at least of 0.05 with three to five replicate populations; , with nine replicate populations; + , with 200 cells randomly pooled from the replicate populations for comparison.

https://doi.org/10.7554/eLife.19307.011
Table 1

Complete mutations of representative isolates from week 7 and week 9. Note that there is no overlap in mutations between the two isolates.

https://doi.org/10.7554/eLife.19307.015
Nucleotide changeAnimo acid substitutionor genomic contextGenesPhenotypes
Week 7 isolateG→TG167C (GGT→TGT)yahAc-di-GMP-specific phosphodiesterase
G→TL356L (CTC→CTA)dcpdipeptidylcarboxypeptidase II
repeat_region (–) +4 bpintergenic (−209/−52)udk ← / → yegEuridine/cytidine kinase/diguanylatecyclase
repeat_region (+) +4 bpintergenic (+113/−115)yqaD → / → CsiDorf, hypothetical protein/orf, hypothetical protein
repeat_region (–) +9 bpcoding (1504– 1512/2247 nt)ptsPPTS system, enzyme I, transcriptional regulator (with NPR and NTR proteins)
Week 9 isolateΔ5579 bp[gapC]–[ydcJ][gapC], cybB, ydcA, hokB, mokB, trg, ydcI, [ydcJ]
G→AR220W (CGG→TGG)fliAflagellar biosynthesis; alternative sigma factor 28; regulation of flagellar operons
C→TE82K (GAA→AAA)rpsC30S ribosomal subunit protein S3
repeat_region (+) +5 bpintergenic (+86/−36)rbsB → / → rbsKD-ribose periplasmic binding protein/ribokinase

Isolates from the third phase reduced motility during growth only to boost it when approaching carrying capacity in preparation for chemotaxis selection. Genomic sequencing of a phase 3 clone identified a non-synonymous substitution that replaced a conserved arginine with a tryptophan at site 220 in the DNA binding domain of FliA, a transcription factor essential for chemotaxis and motility (Claret et al., 2007). Structural modeling (Figure 3—figure supplement 1) predicts that R220W reduces the electrostatic interaction with, and eliminates a hydrogen bond to, the backbone phosphate of DNA.

To determine if the R220W mutation reduces flagellar operon transcriptional activity we replaced the E. coli lac operon with a synthetic construct in which GFP expression is driven from the fliA-dependent fliC promoter. We constructed four strains: two genetic backgrounds (ancestor and phase 3) each with either of two fliA alleles (wildtype and mutant). As expected, FliAR220W reduced overall GFP expression in both backgrounds, with the loss of peak expression causing a reduction in the swimming speed of individual cells early in the cycle (Figure 3b).

Despite the overall reduction in transcription from fliC, FliAR220W increases average swimming speed late in the growth cycle (Figure 3c,d). This is achieved by boosting the fraction of cells in the population that are motile (Figure 3e). Note that the boost is bigger in the ancestral than the phase 3 background where three additional mutations (Table 1) also raise the fraction of motile cells. Hence, reduced motility early in the growth cycle and increased motility late in the growth cycle are caused by a single pleiotropic mutation, R220W. This mutation is expected to increase fitness in the face of the trade-off.

Directly measuring the two fitness components of strains carrying wildtype or mutant versions of FliA (Figure 3f) shows thatFliAR220W elevated fitness in two ways: (1) increasing growth rates by reducing flagellar transcription and the associated energetic costs to individual cells, and (2) increasing the fraction of the population that is motile during chemotaxis selection. Hence, a single mutation, with pleiotropic effects at the levels of individuals and of populations, produces the plastic behavior needed to adapt to a dynamic environment.

The first gains in fitness were achieved by a significant boost in chemotactic ability, with motility becoming less plastic (compared to the ancestor) across the growth cycle. Further improvements in fitness were limited by the growth-chemotaxis trade-off. Eventually, however, a new pattern of motility evolved across the growth cycle that mitigated the trade-off. These observations illustrate the adaptive value of phenotypic plasticity in variable environments whenever fitness components are bounded by trade-offs. FliA regulates the concerted expression of more than 40 chemotaxis genes (Claret et al., 2007). Characterizing the adaptive fliA mutant has revealed how a novel adaptive plastic behavior readily evolves by tinkering with a node at the center of an existing gene network. Delineating the mechanistic basis of a behavioral adaptation, our approach serves to complement those many studies of phenotypic plasticity that have focused on genome wide associations (Ghalambor et al., 2015; Gompert et al., 2014).

There are three different ways adaptation can resolve constraints caused by functional trade-offs. First, gain-of-function mutations can change the constraint itself. For example, E. coli can evolve the ability to use citrate as a carbon source under aerobic conditions (Hall, 1982), thereby eliminating a metabolic constraint. Second, adaptation can optimize traits to bring populations to an adaptive peak. Echoing previous work on adaptive landscapes where trade-offs serve as boundary conditions to provide strong predictive power (Dekel and Alon, 2005; Ibarra et al., 2002; Poelwijk et al., 2011), we observed that growth rate and chemotaxis were initially optimized to bring populations close to the optimum on the Pareto front. Third, in a variable environment the costs associated with a trade-off can be mitigated by a phenotypically plastic response. The unanticipated escape from the optimum illustrates how the emergence of a new behavior can reduce the costs of a trade-off to gain access to virgin regions of an adaptive landscape. Recently, another group found that a trade-off between different environments facilitated adaptation (De Vos et al., 2015).This adds to our speculation that, besides phenotypic plasticity, many other adaptive novel traits have their origins in tradeoffs.

Materials and methods

Strains and media

Request a detailed protocol

E. coli strain MG1655 (Coli Genetic Stock Center, Yale) was propagated in tryptone broth (TB; 10 g NaCl2, 5 g tryptone per liter; Fisher BioReagents). Chemotactic competition and swimming speed were determined in washing buffer (7 g K2HPO4, 2 g KH2PO4per liter, 0.1 mM EDTA, Sigma). Evolved clones were isolated by streaking on LB plates (10 g NaCl2, 5 g yeast extract 5 g, 10 g tryptone, 15 g agar per liter; Fisher BioReagents). Genetic engineering followed standard protocols as detailed in supplemental file 1.

Experimental evolution

Request a detailed protocol

E. coli cells were selected for growth rate and chemotaxis in a fast-paced cyclical environment. From a single colony, the ancestral strain was grown overnight at 30°C to full density and diluted 1000 times into each of five 18 mm sterile glass tubes (Pyrex) containing one ml TB. The five cultures were treated the same way. They were incubated at 30°C and shaken at 250 rpm. 11.5 hr after inoculation, 50 µl of each culture was diluted into 250 µl of washing buffer and centrifuged at 3000 g for 3 min. The supernatant was discarded and the pellet gently re-suspended in 300 µl of washing buffer to minimize flagellar damage. 180 µl of the suspension was transferred to a well in a sterile 96-well microplate (BD Falcon). Having loaded all five samples, the plate was raised on one side so that it became perpendicular to the bench surface. The liquid remained inside the wells due to surface tension. A glass micro-capillary (0.8 mm inner diameter × 75 mm, Drummond) was heat-melted at one end to seal the opening. After cooling to room temperature, the capillary was flamed over Bunsen burner briefly and the open end immediately submerged into TB. On cooling to room temperature the capillary absorbed ~5 µl of TB. Washing buffer was pipetted to rinse off carryover medium on the outer surface of the capillary. The open end was submerged into the liquid in the well and the whole system was incubated at 30°C for chemotactic competition to occur. After 30 min, the capillary was removed and rinsed with washing buffer to remove cells on the outer wall. To initiate the next cycle of growth and chemotaxis, the liquid and cells in the capillary were pushed into a glass tube of 1 ml of fresh TB medium by flaming the capillary briefly. This cycle of growth and chemotaxis was repeated 150 times (11 weeks). Each week 1 ml of culture was taken from each tube and diluted with 80% sterile glycerol to the final glycerol concentration of 16%. The diluted cultures were stored at −80°C as archives. For each archived culture, 6 single strains were randomly picked from single colonies streaked on agar plate. Each strain was characterized for growth rate and chemotactic ability.

Measuring growth rates and chemotactic abilities

Request a detailed protocol

Overnight cultures were diluted 1000-fold into 10 mls of fresh tryptone broth and incubated at 30°C with vigorous shaking. Cell counts were determined by flow cytometry at 3, 4 and 5 hr after inoculation. Growth rates were determined as the slope of linear regression line of logarithmic transformed counts against time. At 11.5 hr, samples from both cultures were centrifuged at low speed and re-suspended in six times the volume of washing buffer. The mutant and the ancestor (carrying a selectively neutral fhuA marker that confers resistance to the bacteriophage T5) were mixed in a 1:1 ratio in 180 µl. A micro-capillary carrying ~5 µl tryptone broth was lowered to the mixture, and the system incubated at 30°C for 30 min. Cell counts from pre- and post-incubation (inside the capillary) were determined by flow cytometry (details in supplemental file 1). The difference between the logarithm-transformed ratios, before and after incubation, is a measure of chemotaxis of a mutant relative to the ancestor.

Measuring swimming speed

Request a detailed protocol

Culture samples, diluted in washing buffer or concentrated by low-speed centrifugation according to cell density, were placed on microscope slides. Five second video clips were taken from different fields using a microscope (Olympus IX70 Inverted Fluorescence Microscope, SPOT Flex camera). The swimming speeds of individual cells were determined for the trajectories extracted using Image-Pro Plus 6.0 software.

Calculation of selective gradients

Request a detailed protocol

We studied the selective gradients along the two functional dimensions. A grid of values for c and r was generated that covered the parameter space traveled by the evolving populations: for c from −1 to 8 with increment size 0.2 and for r from −0.2 to 0.3 with increment size 0.025. The fitness, wij, at each point, (cij, rij), was calculated, where i and j were the indexes for the simulated values of c and r respectively. The surface made of these points is smooth and approximates a plane. Therefore, the overall selective gradients can be approximated by averaging the gradients as follows:

wc=10.2jnim(wi+1,jwi,j)(m1)/nwr=10.025imjn(wi,j+1wi,j)(n1)/m

Genomic sequencing and mutation identification

Request a detailed protocol

Genomic DNA of isolated clones or mixed populations were extracted using Genomic DNA Extraction Kit (ThermoFisher), libraries were prepared using Nextera Kits (illumina) and sequenced by illumina HiSeq 2000 (Single-read. 50 cycles) with 160×coverage. Genomes were assembled and mutations identified using the Breseq pipeline with the wildtype strain MG1655 serving as the control.

Structural modeling of the fliA mutation

Request a detailed protocol

Although crystal structures of FliA bound to DNA are not available, clues to the functional role of arginine 220 can be deduced from its location in the conserved helix-turn-helix motif for DNA binding (Meinhart et al., 2003). Indeed, this conserved arginine is critical to DNA binding through electrostatic interactions and hydrogen bond formation with the backbone phosphate of DNA in the homologous Thermus aquaticus sigma factor A (Campbell et al., 2002). Modeling the R220W mutation into sigma factor A eliminates the electrostatic interaction and the hydrogen bond to the backbone phosphate of DNA.

Genetic engineering

Request a detailed protocol

Of the four mutations identified in the phase 3 isolate (P3), fliA was chosen for further study. Four strains were constructed: the ancestral background with the ancestral fliA, the ancestral background with the P3fliA, the P3 background with ancestral fliA, and the P3 background with the P3fliA. 1 Kb sequences upstream and downstream of the promoter of the dcyD operon (adjacent to thefliA operon)were PCR amplified separately. The kanamycin resistance cassette from pKD13S was PCR amplified and inserted between the two chromosomally derived sequences by fusion PCRS. The kanamycin resistance cassette was integrated between the terminator of fliA operon and the promoter of dcyD operon by lambda red-mediated homologous recombination. Single colonies with the kanamycin resistance cassette were isolated and stored at −80°C. P1 phage transductionS was then used to introduce both ancestral and P3 versions of fliA into the P3 and ancestral backgrounds respectively. The four reconstructed strains were verified by Sanger sequencing the fliA locus(Biomedical Genomic Center of University of Minnesota). The constructs for ectopic promoter analysis monitoring c-di-GMP and fliC expression were made as follows. To monitor c-di-GMPa 1 Kb region upstream of lacI, kanamycin resistance cassette, tac promoter, Vc2 riboswitch, gfp, and a 1 Kb region downstream of lacA were fused by PCRS. To monitor fliC expression a 1 Kb region upstream of lacI, kanamycin resistance cassette, fliC promoter, gfp, and 1 Kb downstream of lacA were fused by PCRS. The synthetic circuits were integrated into appropriate host genome using lambda red recombinationS with concomitant loss of lac. Source templates: Vc2 from Vibriocholerae O395N1 toxT::lacZ; pfliC, 1 Kb regions upstream of lacI and downstream of lacA from E. coli MG1655; tac promoter by chemical synthesis; kanamycin cassette from plasmid pKD13S.

Appendix

Model validation

Two assumptions inour model of the adaptive landscape are

  1. Strains compete for common resources in the absence of other interactions.

  2. Growth in TB is logistic and strains have the same carrying capacity.

Previous work has demonstrated that laboratory strains of E. coli grow in exactly the same way in mixed culture as they do in monoculture (Yi and Dean, 2013). Known exceptions are: (i) growth in minimal media with excess glucose can result in cross-feeding with acetate and glycerol metabolites in the presence of an acetate specialist(Treves et al., 1998); (ii) a small fraction of a population sacrifices itself to promote resistance to antibiotics (Lee et al., 2010). Our experimental system does support the conditions for these interactions.

The logistic equation provides a reasonable fit to the growth data (Figure 2—figure supplement 6). Importantly, the decelerating growth after hour 6, which is responsible for the curvature of the landscape surface, is accurately captured by the logistic equation. We will later show that decelerating growth introduces curvature to the landscape resulting in an optimum at the Pareto front of the trade-off.

Carrying capacities vary three-fold among the isolates. We introduce a scalar k to change the mutant carrying capacity. This gives:

dmdt=rmm(1kmw)dwdt=rww(kmw)

Figure 2—figure supplement 7a shows that both r and k contribute to selection during growth, sg. Within the range of values for r and k seen among isolated clones sg is dominated by changes in r while changes in k make little difference (Figure 2—figure supplement 7b). The modulation of r 's effect by k is limited for most isolates and is significant only for phase 3 isolates with large growth rates. We conclude our model is robust to assumptions 1 and 2.

References

    1. Agrawal AA
    2. Conner JK
    3. Rasmann S
    (2010)
    Evolution Since Darwin: The First 150 Years
    Tradeoffs and negative correlations in evolutionary ecology, Evolution Since Darwin: The First 150 Years, Sunderland, Sinauer Associates, Inc.
    1. Freter R
    2. O'Brien PC
    (1981)
    Role of chemotaxis in the association of motile bacteria with intestinal mucosa: chemotactic responses of Vibrio cholerae and description of motile nonchemotactic mutants
    Infection and Immunity 34:215–221.
  1. Book
    1. Gotelli NJ
    (1998)
    A Primer of Ecology
    Sunderland: MA Sinauer Associates.
    1. Hall BG
    (1982)
    Chromosomal mutation for citrate utilization by Escherichia coli K-12
    Journal of Bacteriology 151:269–273.
  2. Book
    1. Lynch M
    2. Walsh B
    (1998)
    Genetics and Analysis of Quantitative Traits
    Sinauer Associates.
  3. Book
    1. Macnab RM
    (1996)
    Flagella and Motility 
    Washington: ASM Press.
  4. Book
    1. Roff DA
    (2001)
     Life History Evolution
    Sinauer Associates.

Decision letter

  1. Wenying Shou
    Reviewing Editor; Fred Hutchinson Cancer Research Center, United States

In the interests of transparency, eLife includes the editorial decision letter and accompanying author responses. A lightly edited version of the letter sent to the authors after peer review is shown, indicating the most substantive concerns; minor comments are not usually included.

[Editors’ note: a previous version of this study was rejected after peer review, but the authors submitted for reconsideration. The first decision letter after peer review is shown below.]

Thank you for submitting your work entitled "Phenotypic plasticity as an adaptation to a functional trade-off" for consideration by eLife. Your article has been reviewed by four peer reviewers (including the Reviewing Editor) and Ian Baldwin as the Senior Editor.

Our decision has been reached after consultation between the reviewers. Based on these discussions and the individual reviews below, we feel that the message is interesting, but it may take you more than 2 months to fix all problems. Our main concerns are in how you performed and interpreted experiments, and in the mathematical model. Thus, we regret to inform you that we reject your submission at its current stage. However, if you can address all our concerns, eLife will be happy to consider a re-submission.

Reviewer #1:

The manuscript by Yi and Dean showed that phenotypic plasticity can evolve to break a functional trade-off between growth and chemotaxis. The manuscript started with a model prediction on how bacteria exposed to fluctuating environment and selection (selecting for growth following by selecting for chemotaxis) should evolve. Indeed, such prediction was shown to hold for early stage of evolution where cells initially evolved to be better at both growth and chemotaxis (my interpretation here differs somewhat from that of authors) and at phase 2 evolved along a Pareto front as cells evolved to be slower grower and faster swimmer. At phase 3 (P3), a single mutation in fliA allowed cells to break this tradeoff. fliA mutant lowered swimming speed during exponential growth when chemotaxis is not selected for, and increased swimming speed and fraction of motile cells at high cell density. The results are interesting. However, major issued will need to be addressed before acceptance.

1) I am not sure that I understand the lack of reproducibility across figures. Figure 2B shows that ancestor at 0 hr has a swimming speed of 8 μm/s. In Figure 3E, fraction motile in ancestor is close to 0, and the swimming speed is only ~2 8 μm/s (Figure 3B). This type of several-fold difference makes me suspicious.

2) Even though mutation in filA does seem to have an effect since fliA mutation is sufficient to increase swimming speed and% motile cells during late stage growth (Figure 3C and E), some other mutation(s) in P3 can also yield the same phenotype (compare late stage growth of solid red in Figure 3D with sold black in Figure 3C, and solid red and solid black in Figure 3E). My hypothesis is further supposed by the observation that in Figure 2B, the red line seems to show a much more drastic phenotype during early stages than the fliA mutant.

3) The writing is often confusing. For example, Figure 1A makes one believe that they are doing experiments, but Figure 1B and C give the impression of modeling. They do not lay out their model clearly (especially in the fifth paragraph of the main text where chemotaxis enters the game). Note that fitness (growth rate) can be quantified since it is constant during exponential phase. However, for chemotaxis, does population ratio change exponentially over time? In other words, would you get very different results if the duration of chemotaxis assay varies?

4) I am not sure of the usefulness of the interpretation that "usually without significant changes in growth rate" (main text, sixth paragraph) during the initial stage of evolution. I think that averaging across clones is not a good way of quantifying. If you have two populations of say 6 individuals, one with and one without a fast-growing individual, statistically speaking the two populations are the same. But the population with fast-growing individual will quickly deviate from the population without fast-growing individual. Why not just plot all six clones that you quantified, each with an error bar for measurement? My interpretation is that some clones must have significantly improved growth rate to generate the data of Figure 2A. This will also make later statements (i.e. decrease in growth rate) more sensible, since most clones in later stages do not seem to have smaller growth rate than the ancestor.

5) How might one refute the alternative hypothesis that fliA is pleiotropic and that growth rate improvement has nothing to do with swimming rate plasticity? They seem to need a control where they destroy plasticity, and show that the growth advantage goes away. If this control is difficult to perform, you will at least need to acknowledge the existence of this possibility and discuss why you cannot perform such an experiment and why you think that this possibility is unlikely.

Reviewer #2:

Yi and Dean bring molecular genetics to bear on the problem of complex adaptation involving a functional trade-off. Some general aspects of the process have been recognized in a qualitative manner, but this study provides interesting quantitative evidence on the evolutionary trajectory followed by populations of E. coli subjected to alternating selection for rapid growth and chemotaxis. They used serial transfer of innocula from populations that increased from a lag phase, through an exponential growth phase, to stationary phase which they simply called "growth rate". The transfer was carried out by allowing cells to swim into a capillary for 30 minutes before being deposited in fresh medium. The efficiency of transfer was considered a measure of "chemotaxis" and they directly showed swimming speed, measured from video micrographs, correlated with the number of bacteria that entered into the capillaries.

Five separate populations were transferred twice daily for 9 weeks. They found that during the first 6 weeks chemotaxis improved in the populations but that there was a trade-off in growth rate such that it decreased (Figure 2 and Figure 2—figure supplement 1). During the next few weeks chemotaxis stayed high and the growth rate improved until it exceeded that of the original population. This is a classical sequential adaptation of traits overcoming a trade-off where initially the rate of swimming increased but the energy expended in rapid swimming limited the growth rate; further evolution resulted in reduced rate of swimming in exponentially growing cells with a return to rapid swimming just before they were presented with a capillary for transfer. The growth rate of these more highly evolved populations exceeded that of the original population. These results are clearly and thoroughly presented.

Yi and Dean then sequenced representative isolates from week 7, when only chemotaxis had improved, and week 9, when chemotaxis was still high but the growth rate had also increased. At week 7 they found mutations in the upstream region of the gene encoding the enzyme that synthesizes c-di-GMP (yegE) and in the gene encoding the c-di-GMP phosphodiesterase (yahA). The level of c-di-GMP was much reduced in low density cultures of these cells (Figure 2A). This may account for the increase in chemotaxis of these cells since c-di-GMP is a signal that negatively modulates flagellar activity. There were 3 other mutations in the population but they were not analyzed and may have been irrelevant. It would be interesting to know if these same mutations were found in the other 4 populations carried through the selection. Genes that were hit two or more times are likely to be pertinent to the increase in fitness. The mutation in yahA appears to increase the level of phosphodiesterase and so is likely to be a gain-of-function dominant mutation. The authors should consider establishing this point.

The population from week 9 was found to carry a mutation in fliA which encodes the sigma factor that regulates flagellar operons. Reduction in this sigma factor may account for the decrease in the rate of swimming during early stages in the growth cycle. The subsequent increase in swimming rate might result from the utilization of a separate sigma factor for the flagellar operons as a quorum is reached. It was not clear in Table 1 whether all of the mutations seen at week 7 were still present in week 9 along with the three new mutations. This should be clarified.

Expression from the FliA-dependent fliC promoter was studied in cells from the week 9 population (P3) that were transformed with either wild type or mutant fliA (Figure 3B, D). The wild type allele reversed the phenotype showing that the fliA mutation is recessive. The mutant allele shows that the rapid increase in expression of fliC and increase in swimming rate that occurs as the population enters the stationary stage is FliA independent. It seems possible that another sigma factor regulates flagellar operons during late stages of the growth cycle. The authors did not mention such a possibility and might want to comment on it.

The authors state that the differences in the fraction of motile cells are statistically significant but the differences are not great. They might consider omitting this point.

It seems that the rate of swimming had to increase before a change in the pattern of expression of flagellar genes could allow an increase in growth rate. If the regulatory mutation in the sigma factor happened first, the cells might not have been able to swim fast enough to compete in the capillary until the c-di-GMP mutations arose. A discussion along these lines might be useful.

This is an interesting study of the evolutionary response of an E. coli population to a complex selection regime. However, the results rest on genomic analyses from a single population and, as such, are not much more than anecdotal. It would be necessary to have genomic analyses from isolates of two or more populations that had undergone the exact same selection to be certain that the evolutionary trajectory had been recognized. Also, nowhere in this manuscript did the authors show that movement of bacteria into the capillary is chemotactic. They should stick with speed of swimming which is what they measure. In fact, I doubt that E. coli in stationary state in rich media is chemotactic to fresh rich media.

Reviewer #3:

This work explores a very interesting plastic response of E. coli to environment. I'm unable to complete the review at this stage, however, until the authors address the questions below.

I don't understand the measured correlation between swimming speed and chemotactic ability. The evidence is presented in Figure 2—figure supplement 4. First, there are no units. Second, please include error bars for each data point. Third, if difference in chemotaxis is strongly correlated with swimming speed, why the difference in chemotaxis for the highest yellow data point is ~1.8 while the difference in chemotaxis for the lowest blue data point is ~0.5, as I marked by arrows? These two clones have very similar swimming speed.

Also, I understand that measurement of the swimming speed and the difference in chemotaxis is performed in the phosphate buffer (subsections “Strains and media” and “Measuring growth rates and chemotactic abilities”) while in the propagation experiment the capillary is inserted directly into the culture (Figure 1 and caption). If my understanding is correct, the measured difference in chemotaxis does not reflect the chemotactic ability of the bacteria that get into the capillary during propagation. First, E. coli's swimming speed depends on pH of the medium because its flagellar motor is powered by protons. However, for unbuffered rich medium, such as LB, which is similar to tryptone broth, the pH reaches 9 after 1day of growth (J. Bacteriol. December 2007, vol. 189, 8746-8749). Have you measured the swimming speed in the growth medium at the end of the 11.5 hours? Second, E. coli's chemotactic response to the same chemical cue is very different depending on the environment it has adapted to, as demonstrated by the classical papers by J. Adler. Third, during chemotaxis, E. coli executes the run-tumble motility pattern so its speed is not constant. By swimming speed do you mean the instantaneous speed or average speed?

Reviewer #4:

I think this is a high quality paper that will appeal across several disciplines. I think its main problem is that it is not readily accessible to the audience that it will otherwise attract. None of my comments is fatal nor requires additional empirical work, but I think the comments warrant a serious overhaul or at least attention to that possibility.

1) Perspective. The paper is in essence a study of a population (strain) evolving to escape an apparent trade-off. The perspective could be elaborated more fully. For example, I can imagine two different scenarios for evolution to escape a trade-off: (a) a trade-off exists because of a true genetic constraint, and the population eventually evolves to change that constraint, allowing new phenotypes to evolve that are no longer constrained in the original way; (b) an apparent trade-off exists because all common variation/mutations obey the trade-off, but rare mutations sometimes violate the trade-off. My sense is that the latter is operating in this paper, because the R220W mutation is stated to function in a wild-type background the same as it does in the background in which it evolved. Thus (I imagine), the mutation would have been favored initially had it arisen then. (But maybe it would only have been favored in the new background?)

Regardless of how the authors view their system, I think that some presentation of a perspective on trade-offs is warranted, especially since their genetic dissection is so deep. The novelty of the paper is the genetic dissection. I also think that there are many examples that can be cited as cases of evolution of new constraint functions. Lenski's citrate metabolism is one (which was apparently Barry Hall's discovery), Hall's eBG system, and no doubt some of Tony's work would qualify. It will help to unite this work with more of the literature.

2) The mathematical model. I have some issues with or misunderstanding of the model. Growth rate clearly fits an ODE-based model of fitness, as in their (unnumbered) equations. The fit of the 'chemotaxis' part is not obvious. Here, a small tube is plunged into a volume of cells (how much?), and at 30 minutes is hauled out, the contents of the tube being used to start the next generation.

I am guessing that this is a very different process than subjecting the entire population to a common environment in which small differences in behavior lead to quantitative increases in success for all members of the population that express that behavior. However, I confess to not knowing how chemotactic selection was carried out. Methods describe a procedure for evaluating chemotaxis rate, but it is not clear that the volumes used in that assay are the same used in the selection. (180 μl seems a small volume to use for an 11.5hr growth.)

To the extent I imagine it then, the chemotaxis selection is something more akin to truncation selection with a probabilistic success rate because cells that don't end up in the capillary tube have 0 fitness even if they chemotax at some rate. Furthermore, the nature of selection is not the same for all cells in the culture exposed to the capillary tube, because some cells will start near the capillary orifice, others much farther away. It may well be that the selection can be approximated the way they have done, but I want to see some kind of argument or derivation. Normally, I would not fuss, but the paper claims that their trade-off functions are derived a priori, which is not compatible with what we have been given. And maybe this criticism stems from my inability to grasp the protocol details.

I also do not see how the trade-off surface in Figure 2 is derived. Here, there are further assumptions about how cm – cw trades off with rm – rw. The paper argues up front that the physiological basis of the trade-off is energy, but how is the energetic equivalence between chemotaxis and growth calculated – in the context of this selection? (It might make more sense to use standard notation such as delta for the incremental difference of the mutant from wild-type.) And perhaps a related point is that I do not understand why the logistic growth is (apparently) claimed to reduce selection for faster growth once the population has evolved to the point that it saturates in 11.5 hours – isn't there still selection for even faster growth, because any faster mutant will overtake the others? I'm clearly not following things here.

If some of these criticisms are foundless, I hope they at least help the authors recognize the bases of my confusion.

[Editors’ note: what now follows is the decision letter after the authors submitted for further consideration.]

Thank you for submitting your article "Phenotypic plasticity as an adaptation to a functional trade-off" for consideration by eLife. Your article has been favorably evaluated by Naama Barkai (Senior Editor) and two reviewers, one of whom is a member of our Board of Reviewing Editors. The reviewers have opted to remain anonymous.

The reviewers have discussed the reviews with one another and the Reviewing Editor has drafted this decision to help you prepare a revised submission.

Summary:

The author has addressed many of the comments raised by reviewers. However, there are still key issues that will need to be addressed.

Essential revisions:

In the subsection “Measuring growth rates and chemotactic abilities”: the culture used for measurements was grown at 37 Celsius degrees. Is this a typo? If not, the measured swimming speed and growth rates don't reflect those when the cells were grown at 30 Celsius degrees in the evolution experiments.

It is necessary to establish that the swimming speed and fraction of motile cells to be similar in phosphate buffer as in growth medium TB during the first 11.5 hours. This is because E. coli's swimming speed, and thus the energy cost, depends on pH and TB is not buffered.

Plot error bars using the same color as the average. The error bars in Figure 2B, especially for ancestor at time zero (which I had reservations), are difficult to see. You can always shift the data points slightly in the x-direction so that error bars do not overlap.

Your Abstract is still confusing. For example, "growth close to carrying capacity": this made me think that you used a turbidostat to grow cells at near saturation. However, in reality, your cells experienced a substantial period of exponential growth (8hrs out of 11.5). Or did I actually miss something? Also, please excuse the slowness of this reviewer. I must confess that I still have no idea what your last sentence means. For example, pleiotropy in what? You are probably aware of the different definitions of evolvability. Thus, some of these "commonly used terms" can be confusing unless you define them rigorously.

Figures are generally of poor quality (especially axis marking). Figure fonts and symbols often look blurred. The authors will need to fix these problems.

https://doi.org/10.7554/eLife.19307.016

Author response

[Editors’ note: the author responses to the first round of peer review follow.]

Our decision has been reached after consultation between the reviewers. Based on these discussions and the individual reviews below, we feel that the message is interesting, but it may take you more than 2 months to fix all problems. Our main concerns are in how you performed and interpreted experiments, and in the mathematical model. Thus, we regret to inform you that we reject your submission at its current stage. However, if you can address all our concerns, eLife will be happy to consider a re-submission.

Reviewer #1:

The manuscript by Yi and Dean showed that phenotypic plasticity can evolve to break a functional trade-off between growth and chemotaxis. The manuscript started with a model prediction on how bacteria exposed to fluctuating environment and selection (selecting for growth following by selecting for chemotaxis) should evolve. Indeed, such prediction was shown to hold for early stage of evolution where cells initially evolved to be better at both growth and chemotaxis (my interpretation here differs somewhat from that of authors) and at phase 2 evolved along a Pareto front as cells evolved to be slower grower and faster swimmer. At phase 3 (P3), a single mutation in fliA allowed cells to break this tradeoff. fliA mutant lowered swimming speed during exponential growth when chemotaxis is not selected for, and increased swimming speed and fraction of motile cells at high cell density. The results are interesting. However, major issued will need to be addressed before acceptance.

1) I am not sure that I understand the lack of reproducibility across figures. Figure 2B shows that ancestor at 0 hr has a swimming speed of 8 μm/s. In Figure 3E, fraction motile in ancestor is close to 0, and the swimming speed is only ~2 μm/s (Figure 3B). This type of several-fold difference makes me suspicious.

In Figure 2B, each curve was the speed kinetics of a single strain from a single sampling, each 300-400 cells. We chose the curves with most dramatic patterns for illustration. This concerned our reviewers, so we now plot the averages of five experimental replications. We are aware that the kinetic curves from the same strain have large variability. This is expected because we are dealing with an organismal behavior; for example, large variability in swimming speed is evident in Figure 5 of (Boehm et al., 2010). We confirmed the kinetic behaviors of different strains using rigorous statistical tests and using knock- in/out genetics.

2) Even though mutation in fliA does seem to have an effect since fliA mutation is sufficient to increase swimming speed and% motile cells during late stage growth (Figure 3C and E), some other mutation(s) in P3 can also yield the same phenotype (compare late stage growth of solid red in Figure 3D with sold black in Figure 3C, and solid red and solid black in Figure 3E). My hypothesis is further supposed by the observation that in Figure 2B, the red line seems to show a much more drastic phenotype during early stages than the fliA mutant.

We agree. As mentioned in the eleventh paragraph of the main text, any or all of three other mutations in the focal evolvant also increase the fraction of motile cells, and thus the average swimming speed in late hours. This does nothing to undermine our main point which is that the fliA mutation reduces swimming speed in early hours and increases speed in late hours. Put it another way, the dual effect of fliAon swimming speed is still operational in P3 background at an elevated baseline boosted by the three other mutations.

3) The writing is often confusing. For example, Figure 1A makes one believe that they are doing experiments, but Figure 1B and C give the impression of modeling. They do not lay out their model clearly (especially in the fifth paragraph of the main text where chemotaxis enters the game). Note that fitness (growth rate) can be quantified since it is constant during exponential phase. However, for chemotaxis, does population ratio change exponentially over time? In other words, would you get very different results if the duration of chemotaxis assay varies?

The modeling of the adaptive landscape was intended to describe the experiments and provide a guide to predict the future trajectory of phenotypic evolution. To clarify this point, we add subheadings 'a. Experimental design' and 'b.Predicted adaptive landscape. The experimental system defines an adaptive landscape that can be described mathematically from first principles.'

In the resubmission, we add a reference to the classic paper by Adler (Adler, 1973) that shows the number of cells entering a capillary carrying attractant increases exponentially in the first 30 min of incubation (Adler, 1973 Figure 2). Hence, both growth and capillary selection are exponential in nature. They are therefore conceptually equivalent. We fixed the duration of chemotaxis to be 30 min throughout the experiments and thus the selection due to chemotaxis can be represented as a simple difference. Also, 30 mins sufficiently short that fewer than 200,000 cells enter the capillary. Hence, saturation is of no concern.

4) I am not sure of the usefulness of the interpretation that "usually without significant changes in growth rate" (main text, sixth paragraph) during the initial stage of evolution. I think that averaging across clones is not a good way of quantifying. If you have two populations of say 6 individuals, one with and one without a fast-growing individual, statistically speaking the two populations are the same. But the population with fast-growing individual will quickly deviate from the population without fast-growing individual. Why not just plot all six clones that you quantified, each with an error bar for measurement? My interpretation is that some clones must have significantly improved growth rate to generate the data of Figure 2A. This will also make later statements (i.e. decrease in growth rate) more sensible, since most clones in later stages do not seem to have smaller growth rate than the ancestor.

We replaced the sentence with " few isolates have changed growth rates". We absolutely agree with the reviewer that the isolates can vary from each other in phenotype. Averaging across the isolates allows the overall the population trajectory to be clearly mapped onto the adaptive landscape, emphasizing the overall tempo and mode of phenotypic evolution. Data for individual isolates are presented in Figure 2—figure supplement 3 for interested readers.

5) How might one refute the alternative hypothesis that fliA is pleiotropic and that growth rate improvement has nothing to do with swimming rate plasticity? They seem to need a control where they destroy plasticity, and show that the growth advantage goes away. If this control is difficult to perform, you will at least need to acknowledge the existence of this possibility and discuss why you cannot perform such an experiment and why you think that this possibility is unlikely.

The alternative hypothesis, that the fliA mutation is pleiotropic and that growth rate improvement has nothing to do with swimming rate plasticity, requires yet another hypothesis to explain why fliA mediated swimming rate plasticity should no longer improve growth rate in the face of a demonstrated trade-off. One possibility is that the fliA mutation itself somehow negates the hard trade-off between energy for growth and energy for chemotaxis, although the means by which this might be achieved is highly speculative. We feel our interpretation is less convoluted – the fliA mutation alters swimming rate in the manner expected to increase fitness.

Two independent lines of evidence support causality between growth rate reduction and swimming speed increase. The first comes from Figure 3C, F. Introducing the fliA mutation to the ancestor increases the growth rate while decreasing the swimming speed in the early hours. The second comes from the empirical observation that, from week 2 to 7, the populations had decreased growth rates while chemotaxis increased (Figure 2A). This trend was not explained by the fliA mutation since this mutation was only isolated from week 9. For instance, the representative strain of week 7 did not carry it (Table 1). Hence, the trade-off between growth and chemotaxis is not fliA-dependent, suggesting it is due to a more fundamental mechanism such as the hard trade-off between energy for growth and energy for chemotaxis. These results are entirely consistent with the hypothesis that the fliA mutation alters swimming rate in the manner expected to increase fitness.

Reviewer #2:

[…] Yi and Dean then sequenced representative isolates from week 7, when only chemotaxis had improved, and week 9, when chemotaxis was still high but the growth rate had also increased. At week 7 they found mutations in the upstream region of the gene encoding the enzyme that synthesizes c-di-GMP (yegE) and in the gene encoding the c-di-GMP phosphodiesterase (yahA). The level of c-di-GMP was much reduced in low density cultures of these cells (Figure 2A). This may account for the increase in chemotaxis of these cells since c-di-GMP is a signal that negatively modulates flagellar activity. There were 3 other mutations in the population but they were not analyzed and may have been irrelevant. It would be interesting to know if these same mutations were found in the other 4 populations carried through the selection. Genes that were hit two or more times are likely to be pertinent to the increase in fitness. The mutation in yahA appears to increase the level of phosphodiesterase and so is likely to be a gain-of-function dominant mutation. The authors should consider establishing this point.

We appreciate the reviewer's interest and suggestion in delving into the mechanisms underlying the "brute force" increase of swimming speed seen in the representative strain of week 7. Our focus in the current paper is how the growth-chemotaxis trade-off is alleviated by a new behavior seen in the strain isolated from week 9. To avoid distraction, we think it better to save the work on week 7 isolates for another study.

The population from week 9 was found to carry a mutation in fliA which encodes the sigma factor that regulates flagellar operons. Reduction in this sigma factor may account for the decrease in the rate of swimming during early stages in the growth cycle. The subsequent increase in swimming rate might result from the utilization of a separate sigma factor for the flagellar operons as a quorum is reached. It was not clear in Table 1 whether all of the mutations seen at week 7 were still present in week 9 along with the three new mutations. This should be clarified.

We have interpreted our results based on the decades of work by multiple laboratories that have thoroughly characterized chemotaxis in E. coli. There is no evidence that E. coli flagellar operons are regulated by sigma factors other than fliA and sigma70. There is no evidence that E. coli flagellar operons are regulated by quorum sensing. There is no compelling reason to pursue these hypotheses given that our explanations are currently sufficient. We specified in the caption to Table 1: “Note that there is no overlap in mutations between the two isolates”.

Expression from the FliA-dependent fliC promoter was studied in cells from the week 9 population (P3) that were transformed with either wild type or mutant fliA (Figure 3B, D). The wild type allele reversed the phenotype showing that the fliA mutation is recessive. The mutant allele shows that the rapid increase in expression of fliC and increase in swimming rate that occurs as the population enters the stationary stage is FliA independent. It seems possible that another sigma factor regulates flagellar operons during late stages of the growth cycle. The authors did not mention such a possibility and might want to comment on it.

We do not understand how the reviewer concludes that the changes in swimming speed are FliA independent. The fliA mutation clearly reduces swimming speed early in the growth cycle relative to wildtype fliA, just as it increases it late in the cycle relative to wildtype fliA, in both the ancestral and the evolved genetic backgrounds. We are not aware of any other sigma factors that regulate chemotaxis genes and motility besides sigma factor 28 (fliA) and sigma factor 70. It is hard to imagine how introducing the fliA mutation would cause a change of action in sigma factor 70 in late hours. At the same time, variability in the fraction of motile cells explains population-average swimming speed and/or chemotaxis. We add a new figure (Figure 3—figure supplement 2) in the resubmission to support this statement. R2 for the regression between motile fraction and swimming speed is at least 0.86.

It seems that the rate of swimming had to increase before a change in the pattern of expression of flagellar genes could allow an increase in growth rate. If the regulatory mutation in the sigma factor happened first, the cells might not have been able to swim fast enough to compete in the capillary until the c-di-GMP mutations arose. A discussion along these lines might be useful.

Again, isolates from week 7 and 9 do not have mutational overlap. Thus, the c-di-GMP mechanism is irrelevant to the discussion of the changed regulation of swimming speed by the fliA mutation.

This is an interesting study of the evolutionary response of an E. coli population to a complex selection regime. However, the results rest on genomic analyses from a single population and, as such, are not much more than anecdotal. It would be necessary to have genomic analyses from isolates of two or more populations that had undergone the exact same selection to be certain that the evolutionary trajectory had been recognized.

We evolved five independent and parallel populations and all had similar evolutionary trajectories: the populations initially evolved to the Pareto font and then broke through to reach high growth and high chemotaxis. We add: "All five parallel shared similar patterns (Figure 2—figure supplement 1)”. In this study, we focus on one population in its genetic and mechanistic dissection as an in-depth case study. Therefore, at the phenotypic level, the phenomenon of trade-off alleviation is reproducible and thus general. At the molecular/genetic level, the mechanism we identified may not be general. Evolutionary history consists of idiosyncratic events: the symbiotic event that gave rise to mitochondria and eukaryotes happened once in three billion years; rubisco, arguably the most abundant protein on the planet, had a single origin. We believe our case study has its own merit even without generality in the underlying molecular/genetic mechanisms. We are not making a case for generality. We are exploring how phenotypic plasticity can mitigate a trade-off.

Also, nowhere in this manuscript did the authors show that movement of bacteria into the capillary is chemotactic. They should stick with speed of swimming which is what they measure. In fact, I doubt that E. coli in stationary state in rich media is chemotactic to fresh rich media.

We add Figure 2—figure supplement 5 in our resubmission to show that E. coli cells did chemotax in our experimental conditions with a negative control using blank buffer as the attractant.

Reviewer #3:

This work explores a very interesting plastic response of E. coli to environment. I'm unable to complete the review at this stage, however, until the authors address the questions below.

I don't understand the measured correlation between swimming speed and chemotactic ability. The evidence is presented in Figure 2—figure supplement 4. First, there are no units. Second, please include error bars for each data point. Third, if difference in chemotaxis is strongly correlated with swimming speed, why the difference in chemotaxis for the highest yellow data point is ~1.8 while the difference in chemotaxis for the lowest blue data point is ~0.5, as I marked by arrows? These two clones have very similar swimming speed.

We apologize for the inappropriately prepared supplemental figures. We have now updated them in the resubmission according to the reviewer's comments. Error bars have been added to Figure 2—figure supplement 4. Note that data points of different colors were taken at different stages of growth and that the difference in chemotaxis measures the relative ability of the isolates with respect to a common competitor strain (ancestor) to be attracted into the capillary. The isolates and their corresponding competitors were sampled from the same stage of growth. Therefore, it is not meaningful to compare data points across different colors, i.e., different growth stages. But regression of data points from the same growth stage shows a good correlation between swimming speed and chemotaxis.

Also, I understand that measurement of the swimming speed and the difference in chemotaxis is performed in the phosphate buffer (subsections “Strains and media” and “Measuring growth rates and chemotactic abilities”) while in the propagation experiment the capillary is inserted directly into the culture (Figure 1 and caption).

Again, I apologize for the inaccurate information we provided on the experimental protocols. We indeed washed and diluted the culture in phosphate buffer and then inserted a capillary into this treated sample. We provided this information in the supplemental info for pre-submission (eLife has the record) and accidentally deleted it when re-arranging and shortening texts for full submission. We added the full description in the "Experimental evolution" section of the Methods.

If my understanding is correct, the measured difference in chemotaxis does not reflect the chemotactic ability of the bacteria that get into the capillary during propagation. First, E. coli's swimming speed depends on pH of the medium because its flagellar motor is powered by protons. However, for unbuffered rich medium, such as LB, which is similar to tryptone broth, the pH reaches 9 after 1day of growth (J. Bacteriol. December 2007, vol. 189, 8746-8749). Have you measured the swimming speed in the growth medium at the end of the 11.5 hours?

Yes, we did measure swimming speed at 11.5 hours as shown in Figure 2—figure supplement 4, and Figure 3C, D. Note that before all speed measurements and capillary assays/selection, cells sampled from the population grown in tryptone broth were treated with a modified Adler (1973) protocol with washing and dilution in phosphate buffer (described in Methods). Therefore, chemotaxis was always carried out in a well-buffered standardized environment.

We did check the motility at 11.5h for cells sampled from tryptone broth cultures without washing. They were motile. Note that at 11.5 hours at 30°C, the cultures were transitioning from log phase to stationary phase (see the growth curve in Figure 2B). They were still growing, if only slowly, and serious complications in stationary phase, such as extreme pH and secondary metabolites, would still be minimal.

Second, E. coli's chemotactic response to the same chemical cue is very different depending on the environment it has adapted to, as demonstrated by the classical papers by J. Adler. Third, during chemotaxis, E. coli executes the run-tumble motility pattern so its speed is not constant. By swimming speed do you mean the instantaneous speed or average speed?

Chemotaxis selection and assays were carried out under the defined standardized conditions described in the Methods. As also described in the Methods, swimming speed is calculated as the average linear velocity of a single cell over the course of 5 seconds with 16 fps. Tumbling would contribute to the slowing down of the speed.

Reviewer #4:

I think this is a high quality paper that will appeal across several disciplines. I think its main problem is that it is not readily accessible to the audience that it will otherwise attract. None of my comments is fatal nor requires additional empirical work, but I think the comments warrant a serious overhaul or at least attention to that possibility.

1) Perspective. The paper is in essence a study of a population (strain) evolving to escape an apparent trade-off. The perspective could be elaborated more fully. For example, I can imagine two different scenarios for evolution to escape a trade-off: (a) a trade-off exists because of a true genetic constraint, and the population eventually evolves to change that constraint, allowing new phenotypes to evolve that are no longer constrained in the original way; (b) an apparent trade-off exists because all common variation/mutations obey the trade-off, but rare mutations sometimes violate the trade-off. My sense is that the latter is operating in this paper, because the R220W mutation is stated to function in a wild-type background the same as it does in the background in which it evolved. Thus (I imagine), the mutation would have been favored initially had it arisen then. (But maybe it would only have been favored in the new background?)

We have been struggling with the conceptual framework. The current one is the result of compromise. In the resubmission, we add discussion of these two ways of overcoming trade-offs. While there have been examples of breaking the constraint directly such as Lenski 's citrate work, we argue that our work illustrates how a trade-off can be alleviated by a new behavior without breaking the constraint. The two of us have been all at sixes and sevens about behavior, plasticity and trade-offs, genetic, biochemical, apparent and real. We think the trade-off between energy for growth and energy for motility is hard wired and cannot be modified (energy for growth and for motility is pulled from the same pool). This is a physical constraint (the conservation of energy and matter) rather than a genetic constraint that might otherwise change. The trade-off is real rather than apparent. What the bugs do is minimize costs and maximize benefits by becoming phenotypically plastic. The trade-off is still there.

Regardless of how the authors view their system, I think that some presentation of a perspective on trade-offs is warranted, especially since their genetic dissection is so deep. The novelty of the paper is the genetic dissection. I also think that there are many examples that can be cited as cases of evolution of new constraint functions. Lenski's citrate metabolism is one (which was apparently Barry Hall's discovery), Hall's eBG system, and no doubt some of Tony's work would qualify. It will help to unite this work with more of the literature.

We refrained from citing an extensive body of literature in order to keep with requirements of eLife for short report. But we plan to write a review on adaptive landscape where a synthesis with previous work is more appropriate.

2) The mathematical model. I have some issues with or misunderstanding of the model. Growth rate clearly fits an ODE-based model of fitness, as in their (unnumbered) equations. The fit of the 'chemotaxis' part is not obvious. Here, a small tube is plunged into a volume of cells (how much?), and at 30 minutes is hauled out, the contents of the tube being used to start the next generation.

We apologize for the insufficient details on the experimental procedures in our previous manuscript. We did not submit the whole population (1 ml dense culture in rich medium) to capillary selection because that would saturate the capillary and the complex chemical environment in late log phase would complicate chemotaxis. So we washed and diluted cultures in phosphate buffer to a final OD600 of ~0.1- 0.2 and used 180 μl for capillary assay. We have now updated the Methods.

I am guessing that this is a very different process than subjecting the entire population to a common environment in which small differences in behavior lead to quantitative increases in success for all members of the population that express that behavior.

Adler showed in Figure 2 of his classic paper (Adler, 1973) that the number of cells attracted into the capillary carrying attractant increases with time in an exponential manner. Hence, both growth and capillary selection are exponential in nature. They are conceptually equivalent.

However, I confess to not knowing how chemotactic selection was carried out. Methods describe a procedure for evaluating chemotaxis rate, but it is not clear that the volumes used in that assay are the same used in the selection. (180 μl seems a small volume to use for an 11.5hr growth.)

The Methods have been updated to exactly describe the chemotaxis selection, which is identical to the chemotaxis assay.

To the extent I imagine it then, the chemotaxis selection is something more akin to truncation selection with a probabilistic success rate because cells that don't end up in the capillary tube have 0 fitness even if they chemotax at some rate.

As we have noted above, both growth and capillary selection are exponential in nature. They are conceptually equivalent. There is no truncation selection. The success rate will be almost deterministic for any mutant of appreciable frequency (say > 1%) and with a large selection coefficient (say > 1%) in the 100,000-200,000 cells entering the capillary. Our chemotaxis assays always involved mutant populations far > 1000 cells.

Furthermore, the nature of selection is not the same for all cells in the culture exposed to the capillary tube, because some cells will start near the capillary orifice, others much farther away. It may well be that the selection can be approximated the way they have done, but I want to see some kind of argument or derivation.

It is certain that the migration of cells into the capillary is a complex dynamic process. We have not attempted to model this process a priori. Instead, we have taken the observed exponential increase in cells in the capillary as the basis for our model. A priori prediction of the exponential parameter would akin to predicting the exponential growth rate of E. coli from first principles. But given that it is exponential we can construct the model.

Normally, I would not fuss, but the paper claims that their trade-off functions are derived a priori, which is not compatible with what we have been given. And maybe this criticism stems from my inability to grasp the protocol details.

We never claim the trade-off front is derived a priori. Instead, we stated in the eighth paragraph of the main text that "in our adaptive landscape the relationships between phenotypes and fitness were defined a priori". And we go on "independent regressions from different experimental populations led to similar Pareto fronts (Figure 2—figure supplement 1), with all populations evolving close to the predicted optimum (Figure 2—figure supplement 1)". Hence, the trade-off between growth and chemotaxis is entirely empirical. The Pareto font is empirical and derived by linear regression of the data points (Figure 2—figure supplement 3).

When mapping this front onto the curved adaptive landscape, which is defined a priori, a fitness optimum is derived. This provides a prediction for further experimental evolution.

I also do not see how the trade-off surface in Figure 2 is derived. Here, there are further assumptions about how cm – cw trades off with rm – rw. The paper argues up front that the physiological basis of the trade-off is energy, but how is the energetic equivalence between chemotaxis and growth calculated – in the context of this selection? (It might make more sense to use standard notation such as delta for the incremental difference of the mutant from wild-type.) And perhaps a related point is that I do not understand why the logistic growth is (apparently) claimed to reduce selection for faster growth once the population has evolved to the point that it saturates in 11.5 hours – isn't there still selection for even faster growth, because any faster mutant will overtake the others? I'm clearly not following things here.

The question is: Why is the adaptive landscape curved rather than a flat plane? If, say, we grow the population for only 5 hours instead of 11.5, and impose capillary selection when the cells are still in mid-log phase, then the adaptive landscape would be a flat plane. Mapping the empirical Pareto front (a straight line) onto this plane can't produce an optimum. Allowing cells to grow into late-log or early stationary phase causes a reduction in growth rates. As explained in Figure 1C, with faster grow rates populations approach carrying capacity sooner. By the time capillary selection is imposed, a population with a large growth rate will be very close to carrying capacity. Further increases the growth rate will not produce much of an increase in population size. The effect of diminishing returns due to logistic growth produces curvature in the adaptive landscape.

[Editors' note: the author responses to the re-review follow.]

Essential revisions:

In the subsection “Measuring growth rates and chemotactic abilities”: The culture used for measurements was grown at 37 Celsius degrees. Is this a typo? If not, the measured swimming speed and growth rates don't reflect those when the cells were grown at 30 Celsius degrees in the evolution experiments.

Yes, it is a typo, now corrected.

It is necessary to establish that the swimming speed and fraction of motile cells to be similar in phosphate buffer as in growth medium TB during the first 11.5 hours. This is because E. coli's swimming speed, and thus the energy cost, depends on pH and TB is not buffered.

The first author did the experiment in the past month measuring swimming speed and the fraction of motile cells in the original culture and in phosphate buffer side-by-side. The result, reported in the new figure (Figure 3—figure supplement 3), shows that both measurements have similar values between the two assay conditions and that plotting one against the other gives a line with slope close to one. We agree that TB and phosphate buffer are very different and would influence chemotaxis and motility differentially.

But the measurements were taken within 5-10 min post dilution into phosphate buffer in all our experiments. We believe this interval is too brief for dramatic physiological changes to occur.

Plot error bars using the same color as the average. The error bars in Figure 2B, especially for ancestor at time zero (which I had reservations), are difficult to see. You can always shift the data points slightly in the x-direction so that error bars do not overlap.

Error bar color is corrected. The error bar for the ancestor at time 0 in Figure 3B is smaller than the symbol.

Your Abstract is still confusing. For example, "growth close to carrying capacity": this made me think that you used a turbidostat to grow cells at near saturation. However, in reality, your cells experienced a substantial period of exponential growth (8hrs out of 11.5). Or did I actually miss something? Also, please excuse the slowness of this reviewer. I must confess that I still have no idea what your last sentence means. For example, pleiotropy in what? You are probably aware of the different definitions of evolvability. Thus, some of these "commonly used terms" can be confusing unless you define them rigorously.

The new manuscript reads "growth up to carrying capacity". The last sentences now state "…illustrate how phenotypic plasticity potentiates evolvability by opening up new regions of the adaptive landscape". "Opening up new regions of the adaptive landscape" annotates "evolvability".

Figures are generally of poor quality (especially axis marking). Figure fonts and symbols often look blurred. The authors will need to fix these problems.

We increased resolution of the pictures.

https://doi.org/10.7554/eLife.19307.017

Article and author information

Author details

  1. Xiao Yi

    Department of Ecology, Evolution and Behavior, University of Minnesota, St. Paul, United States
    Present address
    BioTechnology Institute, University of Minnesota, Saint Paul, United States
    Contribution
    XY, Conception and design, Acquisition of data, Analysis and interpretation of data, Drafting or revising the article
    For correspondence
    xiaoyi8607@gmail.com
    Competing interests
    The authors declare that no competing interests exist.
    ORCID icon "This ORCID iD identifies the author of this article:" 0000-0003-4025-856X
  2. Antony M Dean

    1. Department of Ecology, Evolution and Behavior, University of Minnesota, St. Paul, United States
    2. Laboratory of Microbial Evolution, College of Ecology and Evolution, Guangzhou, Peoples Republic of China
    Contribution
    AMD, Drafting or revising the article, Contributed unpublished essential data or reagents
    For correspondence
    deanx024@umn.edu
    Competing interests
    The authors declare that no competing interests exist.
    ORCID icon "This ORCID iD identifies the author of this article:" 0000-0002-9546-7679

Funding

University of Minnesota (Research Support)

  • Xiao Yi

The funders had no role in study design, data collection and interpretation, or the decision to submit the work for publication.

Acknowledgements

The authors thank M Travisano, RF Denison, D Drabeck, WH Ratcliff and S Wan for many comments on previous versions of the manuscript.

Reviewing Editor

  1. Wenying Shou, Fred Hutchinson Cancer Research Center, United States

Publication history

  1. Received: July 1, 2016
  2. Accepted: September 28, 2016
  3. Accepted Manuscript published: October 3, 2016 (version 1)
  4. Version of Record published: October 11, 2016 (version 2)
  5. Version of Record updated: October 13, 2016 (version 3)

Copyright

© 2016, Yi et al.

This article is distributed under the terms of the Creative Commons Attribution License, which permits unrestricted use and redistribution provided that the original author and source are credited.

Metrics

  • 3,360
    Page views
  • 652
    Downloads
  • 24
    Citations

Article citation count generated by polling the highest count across the following sources: Crossref, PubMed Central, Scopus.

Download links

A two-part list of links to download the article, or parts of the article, in various formats.

Downloads (link to download the article as PDF)

Open citations (links to open the citations from this article in various online reference manager services)

Cite this article (links to download the citations from this article in formats compatible with various reference manager tools)

  1. Xiao Yi
  2. Antony M Dean
(2016)
Phenotypic plasticity as an adaptation to a functional trade-off
eLife 5:e19307.
https://doi.org/10.7554/eLife.19307

Further reading

    1. Ecology
    2. Evolutionary Biology
    Jason P Dinh, SN Patek
    Research Article Updated

    Evolutionary theory suggests that individuals should express costly traits at a magnitude that optimizes the trait bearer’s cost-benefit difference. Trait expression varies across a species because costs and benefits vary among individuals. For example, if large individuals pay lower costs than small individuals, then larger individuals should reach optimal cost-benefit differences at greater trait magnitudes. Using the cavitation-shooting weapons found in the big claws of male and female snapping shrimp, we test whether size- and sex-dependent expenditures explain scaling and sex differences in weapon size. We found that males and females from three snapping shrimp species (Alpheus heterochaelis, Alpheus angulosus, and Alpheus estuariensis) show patterns consistent with tradeoffs between weapon and abdomen size. For male A. heterochaelis, the species for which we had the greatest statistical power, smaller individuals showed steeper tradeoffs. Our extensive dataset in A. heterochaelis also included data about pairing, breeding season, and egg clutch size. Therefore, we could test for reproductive tradeoffs and benefits in this species. Female A. heterochaelis exhibited tradeoffs between weapon size and egg count, average egg volume, and total egg mass volume. For average egg volume, smaller females exhibited steeper tradeoffs. Furthermore, in males but not females, large weapons were positively correlated with the probability of being paired and the relative size of their pair mates. In conclusion, we identified size-dependent tradeoffs that could underlie reliable scaling of costly traits. Furthermore, weapons are especially beneficial to males and burdensome to females, which could explain why males have larger weapons than females.

    1. Evolutionary Biology
    Anthony V Signore, Phillip R Morrison ... Kevin L Campbell
    Research Article

    The extinct Steller's sea cow (Hydrodamalis gigas; †1768) was a whale-sized marine mammal that manifested profound morphological specializations to exploit the harsh coastal climate of the North Pacific. Yet despite first-hand accounts of their biology, little is known regarding the physiological adjustments underlying their evolution to this environment. Here, the adult-expressed hemoglobin (Hb; a2β/δ2) of this sirenian is shown to harbor a fixed amino acid replacement at an otherwise invariant position (β/δ82Lys→Asn) that alters multiple aspects of Hb function. First, our functional characterization of recombinant sirenian Hb proteins demonstrate that the Hb-O2 affinity of this sub-Arctic species was less affected by temperature than those of living (sub)tropical sea cows. This phenotype presumably safeguarded O2 delivery to cool peripheral tissues and largely arises from a reduced intrinsic temperature sensitivity of the H. gigas protein. Additional experiments on H. gigas β/δ82Asn→Lys mutant Hb further reveal this exchange renders Steller's sea cow Hb unresponsive to the potent intraerythrocytic allosteric effector 2,3-diphosphoglycerate, a radical modification that is the first documented example of this phenotype among mammals. Notably, β/δ82Lys→Asn moreover underlies the secondary evolution of a reduced blood-O2 affinity phenotype that would have promoted heightened tissue and maternal/fetal O2 delivery. This conclusion is bolstered by analyses of two Steller's sea cow prenatal Hb proteins (Hb Gower I; z2e2 and HbF; a2g2) that suggest an exclusive embryonic stage expression pattern, and reveal uncommon replacements in H. gigas HbF (g38Thr→Ile and g101Glu→Asp) that increased Hb-O2 affinity relative to dugong HbF. Finally, the β/δ82Lys→Asn replacement of the adult/fetal protein is shown to increase protein solubility, which may have elevated red blood cell Hb content within both the adult and fetal circulations and contributed to meeting the elevated metabolic (thermoregulatory) requirements and fetal growth rates associated with this species cold adaptation.