Electrostatic anchoring precedes stable membrane attachment of SNAP25/SNAP23 to the plasma membrane
- Life and Medical Sciences (LIMES) Institute, University of Bonn, Germany
- Heidelberg University Biochemistry Center (BZH), Germany
Figures
Figure 1 with 2 supplements
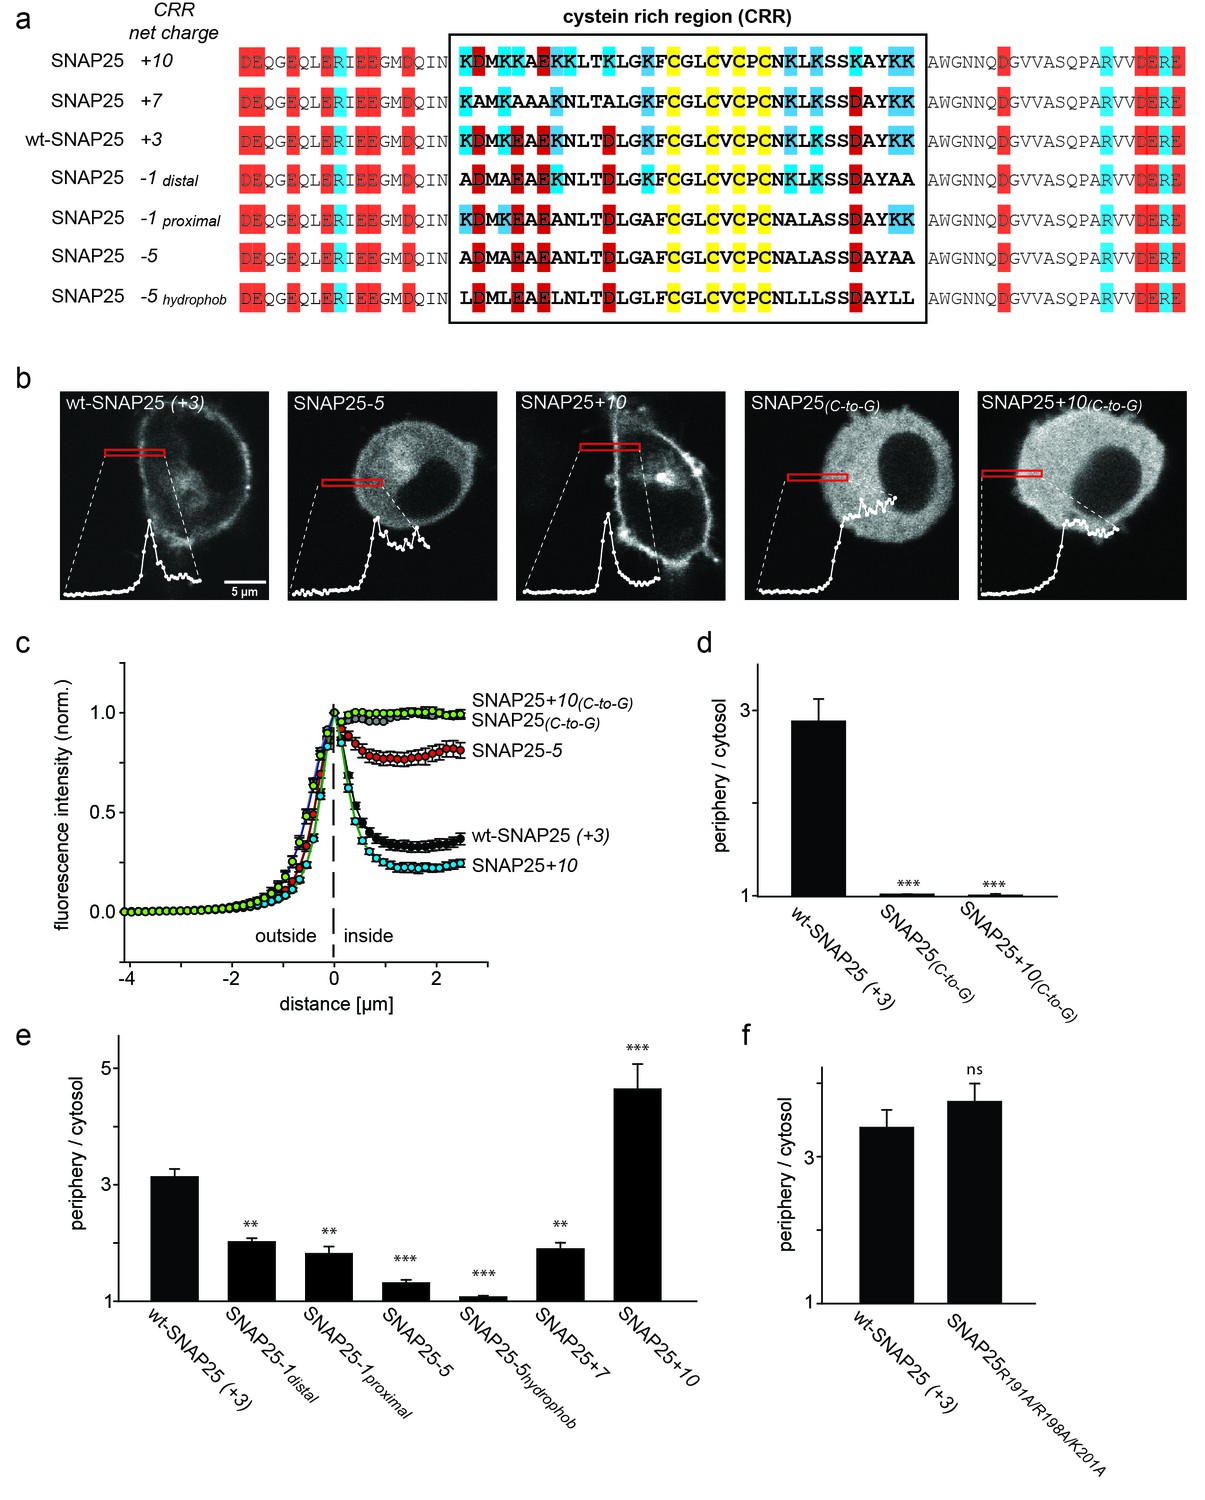
SNAP25 plasma membrane targeting in live cells.
(a) Diagram of the amino acid sequences from position 51 to 125 for wild type SNAP25 and for several constructs in which the net charge of the cysteine rich region (CRR; box) is increased or decreased. Numbers associated with the constructs’ names refer to the net charge of the CRR. Cysteines are highlighted in yellow; negatively and positively charged amino acids are highlighted in red and blue, respectively. A net charge of +3 is found in all mammalian SNAP25 proteins whose encoding genes are available in the UniProtKB/Swiss-Prot-data bank (see Figure 1—figure supplement 1). (b) Confocal micrographs from live PC12 cells expressing wt-SNAP25 (+3), SNAP25–5 and SNAP25+10 as N-terminally GFP-tagged constructs. Also shown are two more constructs, based on wt-SNAP25 (+3) and SNAP25+10, in which the four cysteines for palmitoylation are exchanged for glycines (SNAP25(C-to-G) and SNAP25+10(C-to-G)). Red elongated boxes mark the regions of interest (ROIs) in which the fluorescence distribution at the cell periphery was analysed by linescans. White graphs illustrate the corresponding fluorescence traces. (c) For one experiment several traces were averaged. (d–f) Ratio between cell periphery and cytosol signal for (d) the variants lacking cysteines for palmitoylation, (e) constructs with an altered charge around the cysteine cluster, and (f) a construct with an eliminated polybasic cluster located at the C-terminus of SNAP25. Values are given as means ± S.E.M. (n = 3–19; t-test *p<0.05, **p<0.01, ***p<0.001, ns = not significant). For the constructs exhibiting weakest and strongest targeting in (c), Figure 1—figure supplement 2 shows that the ratio between cell periphery and cytosol signal is independent of the expression level.
Figure 1—figure supplement 1
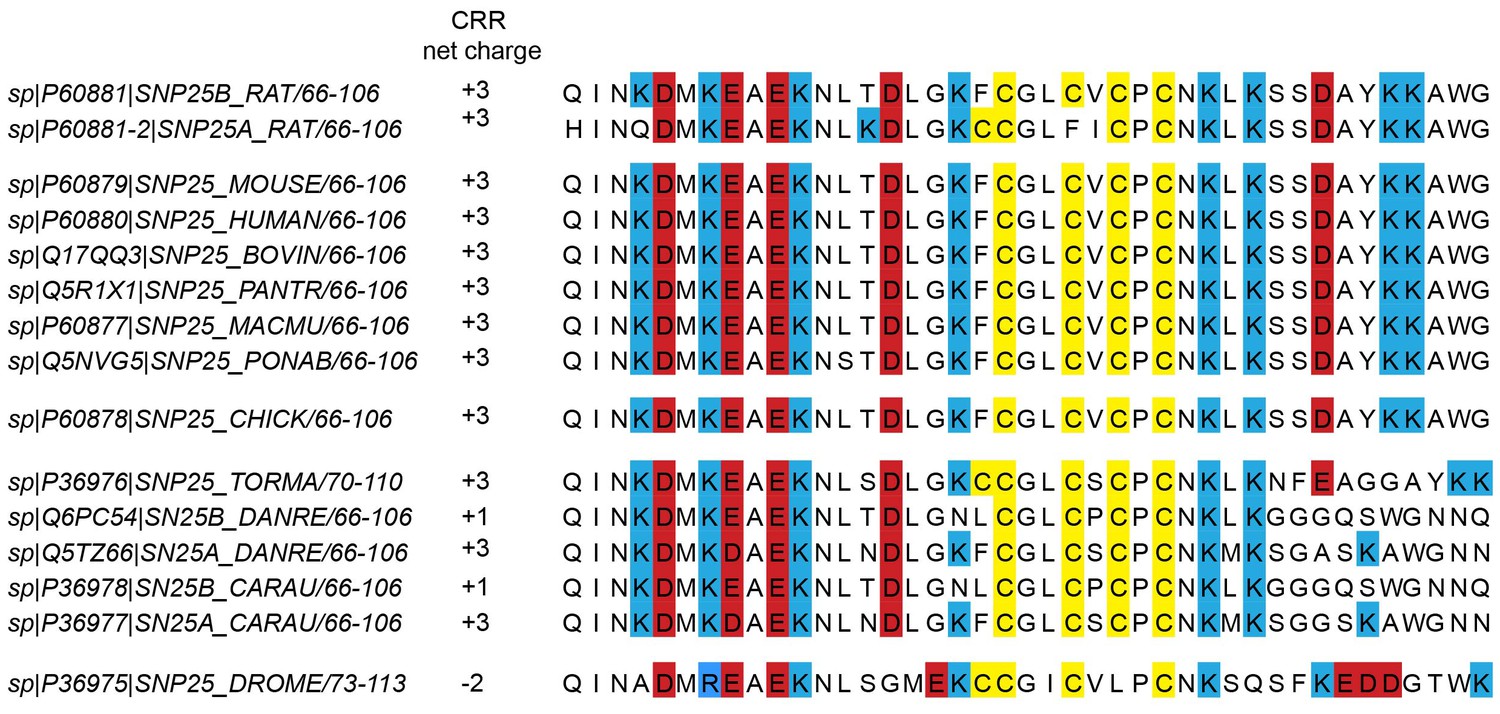
Cysteine-rich regions from different species.
In the UniProtKB/Swiss-Prot-data bank, 15 hits are found for the SNAP25 gene. From those hits, we eliminated a fragment of rabbit SNAP25 that lacks the cysteine-rich region (CRR), and added the SNAP25a isoform of rat SNAP25 (P60881-2). Note that in P36976 and P36975, some of the included positively charged amino acids are a few residues further downstream than is the case in mammalian proteins. Species include Rattus norvegicus (rat), Mus musculus (mouse), Homo sapiens (human), Bos taurus (bovine), Pan troglodytes (chimpanzee); Macaca mulatta (rhesus macaque), Pongo abelii (Sumatran orangutan), Gallus gallus (chicken), Torpedo marmorata (marbled electric ray), Danio rerio (zebrafish), Carassius auratus (goldfish), and Drosophila melanogaster (drosophila).
Figure 1—figure supplement 2
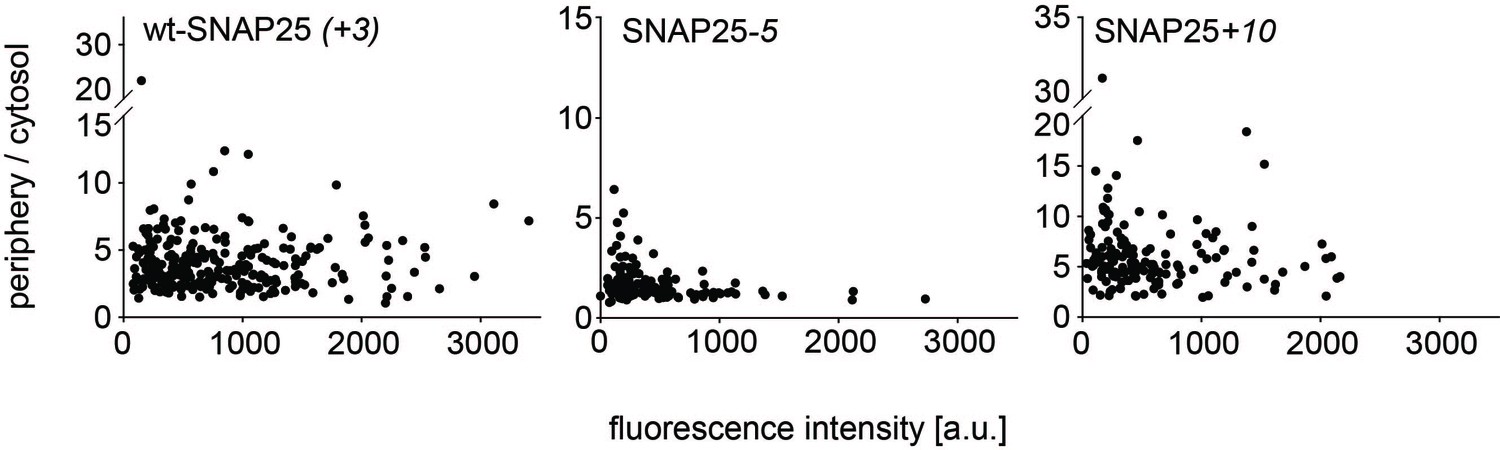
No correlation between the periphery/cytosol signal ratio and the expression level.
The periphery/cytosol-ratio in individula cells is plotted versus fluorescence peak intensity. This figure is based on experimental data included in Figure 1e. In Figure 1e ratios for each experimental day are averaged, whereas individual values are shown here.
Figure 2 with 1 supplement

SNAP23 plasma membrane targeting.
(a) Amino acid sequences from positions 45 to 119 shown for SNAP23+10, wt-SNAP23 (+3) and SNAP23-3. The box indicates the cysteine-rich region (CRR) in which mutations were introduced. Red, blue and yellow, respectively, highlight negatively charged amino acids, positively charged amino acids and cysteines. (b, c) The periphery/cytosol signal ratio from confocal micrographs was analysed as described in Figure 1. Values are given as means ± S.E.M. (n = 3–8; t-test *p<0.05, **p<0.01, ***p<0.001). For more SNAP23 constructs, see Figure 2—figure supplement 1.
Figure 2—figure supplement 1
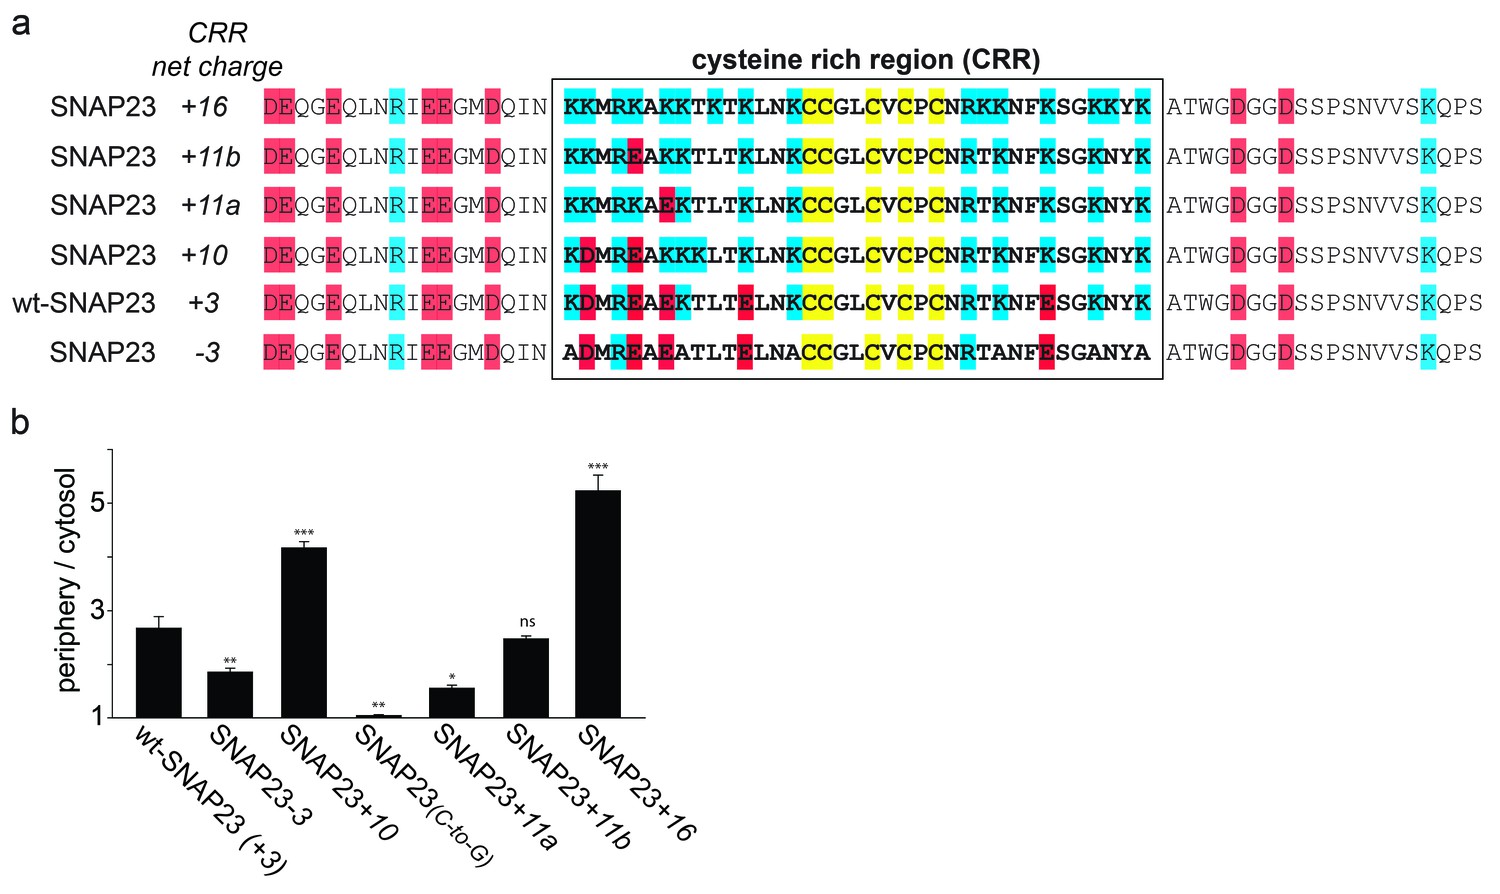
Correlation between SNAP23 targeting and charge of the cysteine-rich region.
Extended Figure 2a and c showing the additional constructs SNAP23+11a, SNAP23+11b and SNAP23+16. (a) The sequence of rat SNAP23 from position 45 to 119 is depicted for wt-SNAP23 (+3) and for several constructs carrying different charges in the cysteine-rich region (CRR, from 64 to 100, box). The net charge in this region is given by the numbers associated with the constructs’ names. Cysteines for palmitoylation are highlighted in yellow, negatively and positively charged amino acids are highlighted in red and blue, respectively. (b) Periphery/cytosol signal ratio. Values are given as means ± S.E.M. (n = 3–8; t-test *p<0.05, **p<0.01, ***p<0.001, ns = not significant).
Figure 3 with 2 supplements

Subcellular distribution of SNAP25 constructs analysed by cell fractionation.
PC12 cells expressing the indicated constructs were mechanically homogenised followed by centrifugation, yielding supernatant and pellet that contain the cytosolic and the membrane fraction, respectively. Fractions were analysed by Western blotting using an antibody against GFP. Left: immunoblots of one representative experiment. For each construct, the respective cytosol and membrane fractions are shown at arbitrary scaling (for the entire blot see Figure 3—figure supplement 1; for the average expression levels see Figure 3—figure supplement 2). Right: the ratio between membrane-associated and cytosolic protein was quantified from the band intensities. Values are given as means ± S.E.M. (n = 4; t-test *p<0.05, **p<0.01, ***p<0.001).
Figure 3—figure supplement 1
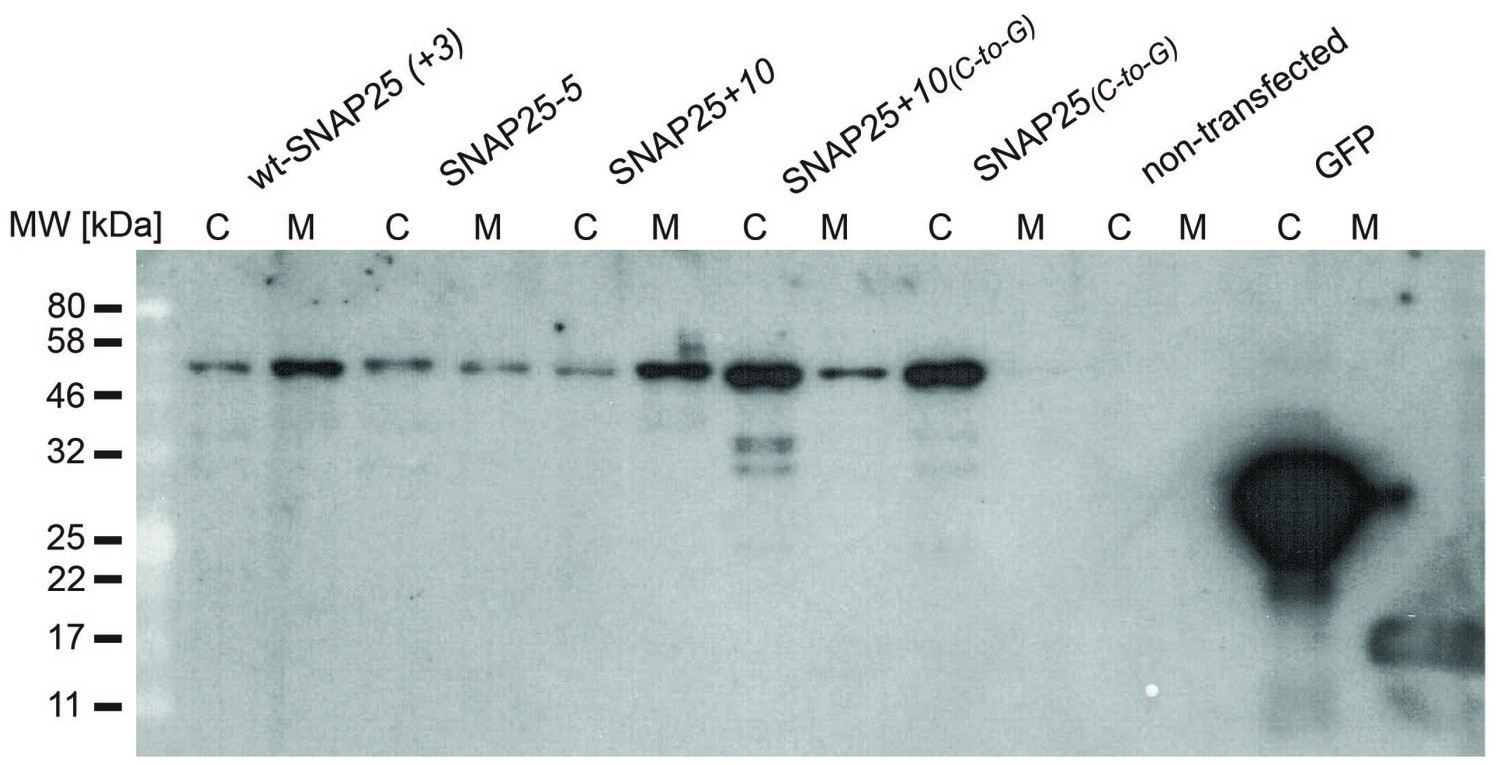
Entire Western blot.
Blot used for Figure 3. Equal amounts of proteins were loaded. C, cytosol fraction; M, membrane fraction. In this experiment, SNAP25(C-to-G) and SNAP25+10(C-to-G) tended to be expressed at higher levels. On average, the expression levels of the constructs were similar (see Figure 3—figure supplement 2).
Figure 3—figure supplement 2
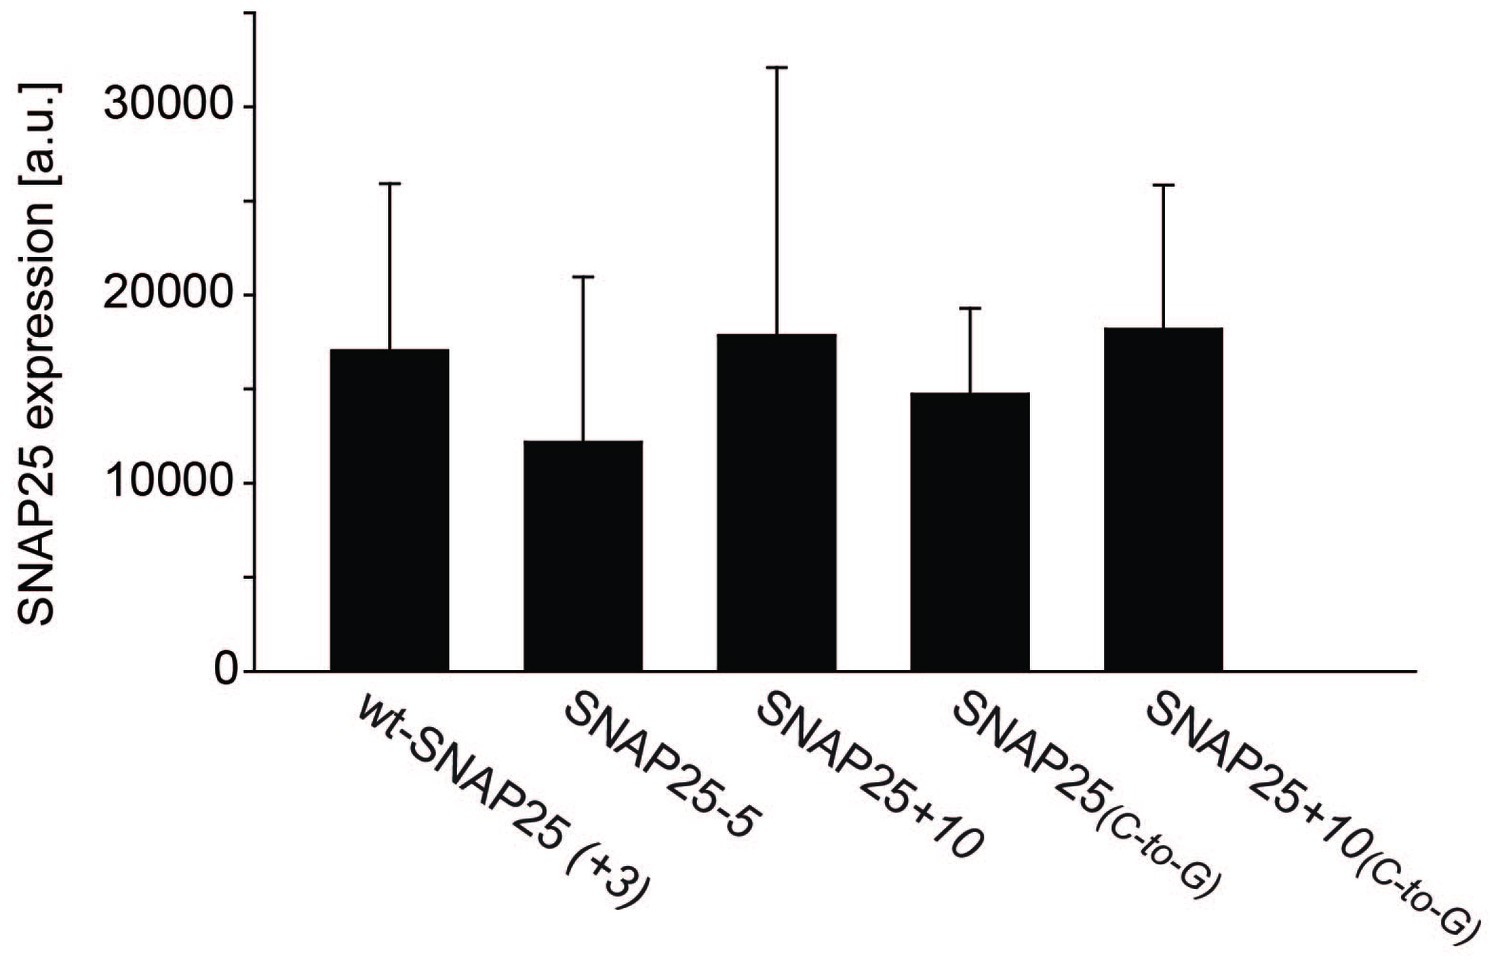
Variation of expression levels.
The expression levels in the experiments performed for Figure 3 were calculated by adding up the signal intensities from the cytosol and the membrane fraction of each construct. The variability in expression levels between experiments is considerable. However, we do not note a correlation between membrane-association and expression levels. Values are given as means ± s.d. (n = 4).
Figure 4

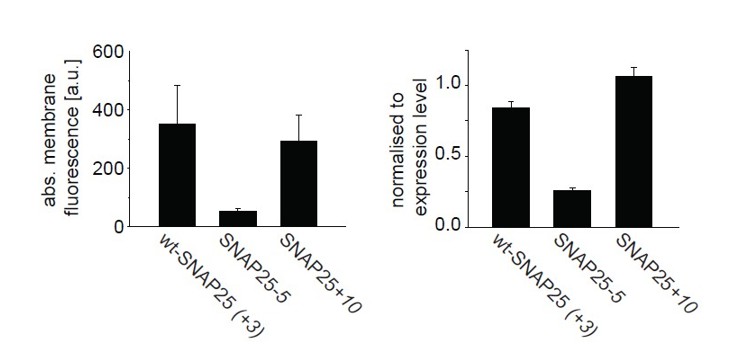
Association of wt-SNAP25 (+3), SNAP25-5, SNAP25+10 and SNAP25+10(C-to-G) with isolated plasma membranes.
(a) Plasma membrane sheets were generated from cells expressing the indicated GFP-SNAP25 constructs by mechanical shearing forces, followed by direct imaging. During imaging, the sample was screened for green fluorescence and all membranes exhibiting green fluorescence were imaged in the green channel, followed by imaging of the blue channel. We also analysed sheets from cells transfected with SNAP25(C-to-G), but in these samples, no green fluorescence was visually detectable in the screening process. Top, blue fluorescent dye (TMA-DPH) visualizing the location and shape of the membrane sheets; bottom, GFP fluorescence of the membrane sheet associated SNAP25 variants. The same images are shown at two different lookup tables (LUT). (b) Quantification of GFP-fluorescence on membrane sheets, normalized to wt-SNAP25 (+3). Values are given as means ± S.E.M. (n = 3–7; t-test *p<0.05, **p<0.01, ***p<0.001).
Figure 5
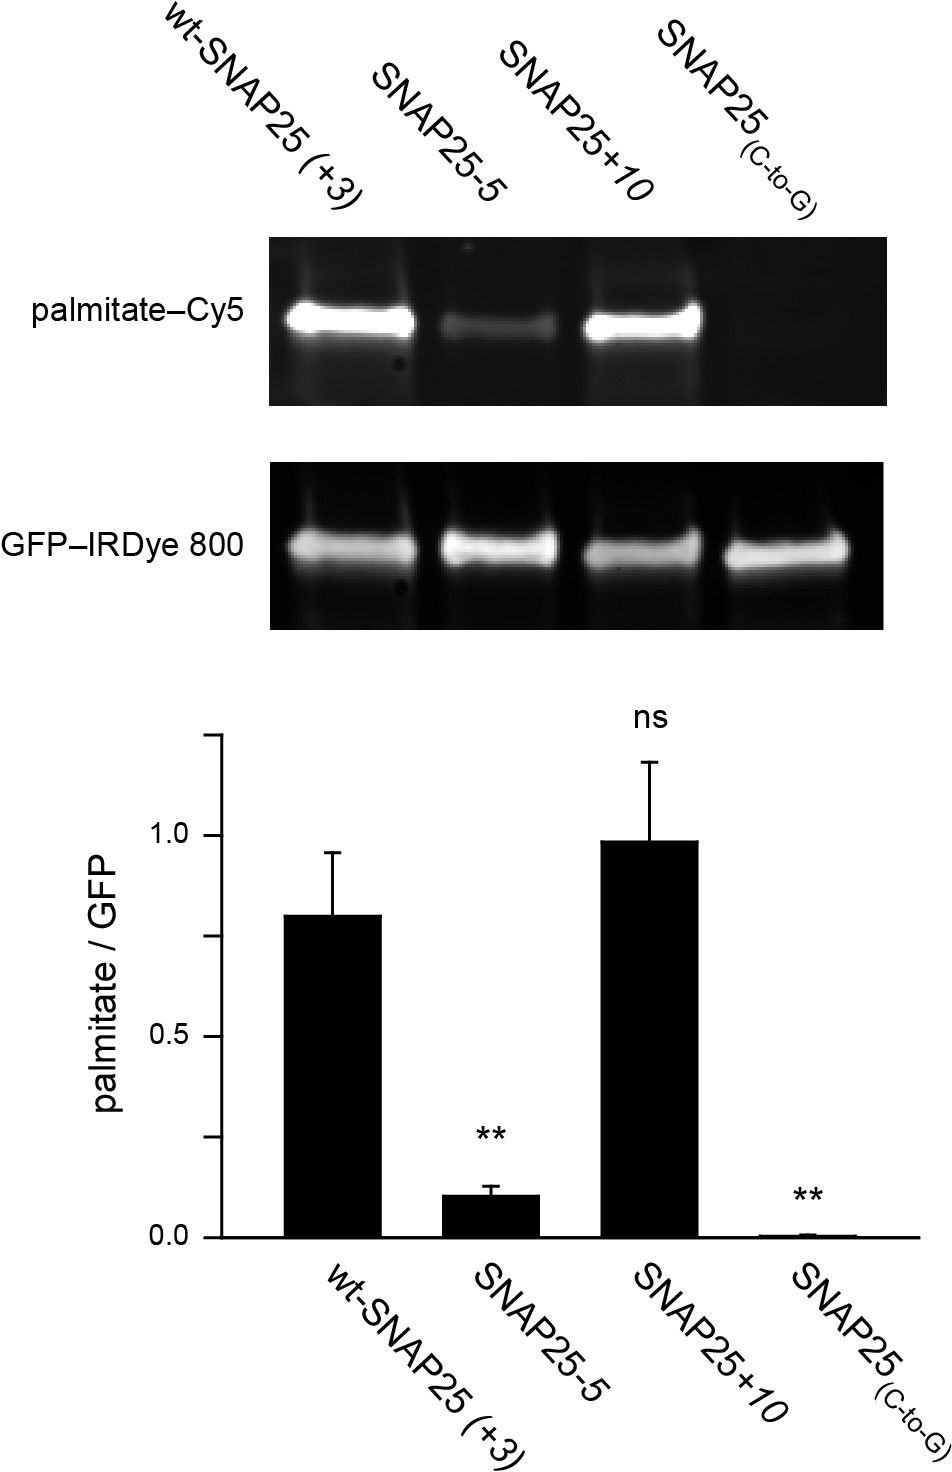
Assessment of the palmitoylation of GFP-SNAP25 constructs.
PC12 cells were transfected with wt-SNAP25 (+3), SNAP25-5, SNAP25+10, or SNAP25(C-to-G) and fed with alkyne-palmitate overnight. Cells were then lysed, and the GFP-tagged constructs were immunoprecipitated. Subsequently, a click reaction with Cy5-azide was performed to label incorporated palmitate, and the samples were subjected to SDS-PAGE and Western blotting. The amount of protein was quantified by immunolabelling (anti-GFP antibody/IRDye-labelled secondary antibody) and used for normalization of the palmitate-Cy5 signal, yielding the palmitate/GFP ratio. The panels show the fluorescence of the palmitate-Cy5 (top) and the GFP signal (bottom) of one representative immunoblot. The bar chart shows palmitate/GFP ratios of n = 5 independent experiments (mean + S.E.M.; t-test *p<0.05, **p<0.01, ***p<0.001, ns = not significant).
Figure 6
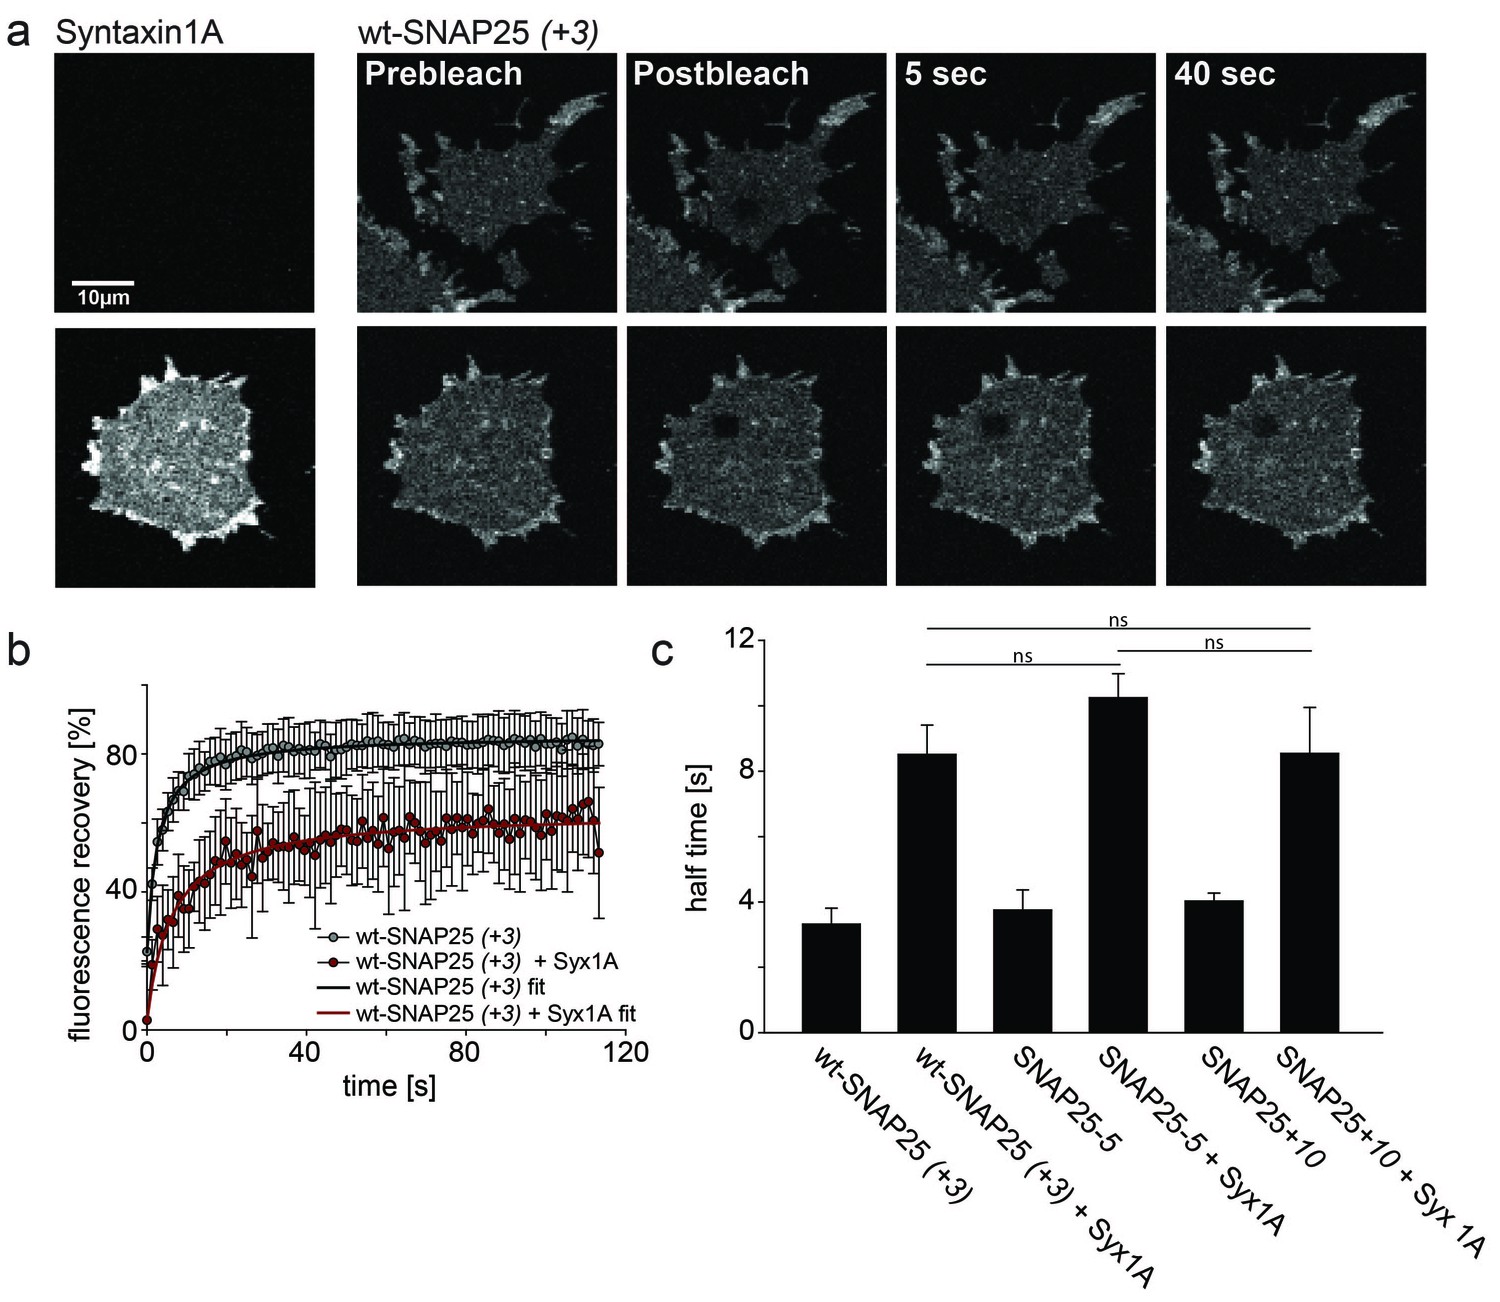
Probing the interaction of SNAP25 constructs with syntaxin 1A.
(a) Illustration of a fluorescence recovery after photobleaching (FRAP) experiment that measures SNAP25 interactions with syntaxin on membrane sheets generated from PC12 cells expressing the respective constructs. GFP-SNAP25 mobility was analysed in the absence (top row) or presence (bottom row) of co-expressed syntaxin 1A-RFP (for RFP fluorescence see images on the left shown at the same scaling). Right (from left to right): membrane sheets before bleaching of a square region of interest (ROI), the first image immediately after bleaching, and 5 s and 40 s after bleaching. The ROI refills with GFP-signal faster in the absence of syntaxin 1A-RFP. (b) Averaged fluorescence recovery traces from one experiment, in the absence (grey) or presence (red) of syntaxin 1A-RFP. Values are given as means ± S.D. (n = 7–12 membrane sheets). Hyperbola functions are fitted to the averaged traces yielding the half time of recovery. (c) Average half times of recovery for wt-SNAP25 (+3), SNAP25-5 and SNAP25+10, in the absence and presence of overexpressed syntaxin 1A. Values are given as means ± S.E.M. (n = 3–4; t-test *p<0.05, **p<0.01, ***p<0.001, ns = not significant). Please note that, in this experiment, large pixels were used to keep bleaching low. Therefore the spatial resolution is lower than that in the other experiments and does not allow for resolving the SNAP25 micropatterning.
Figure 7
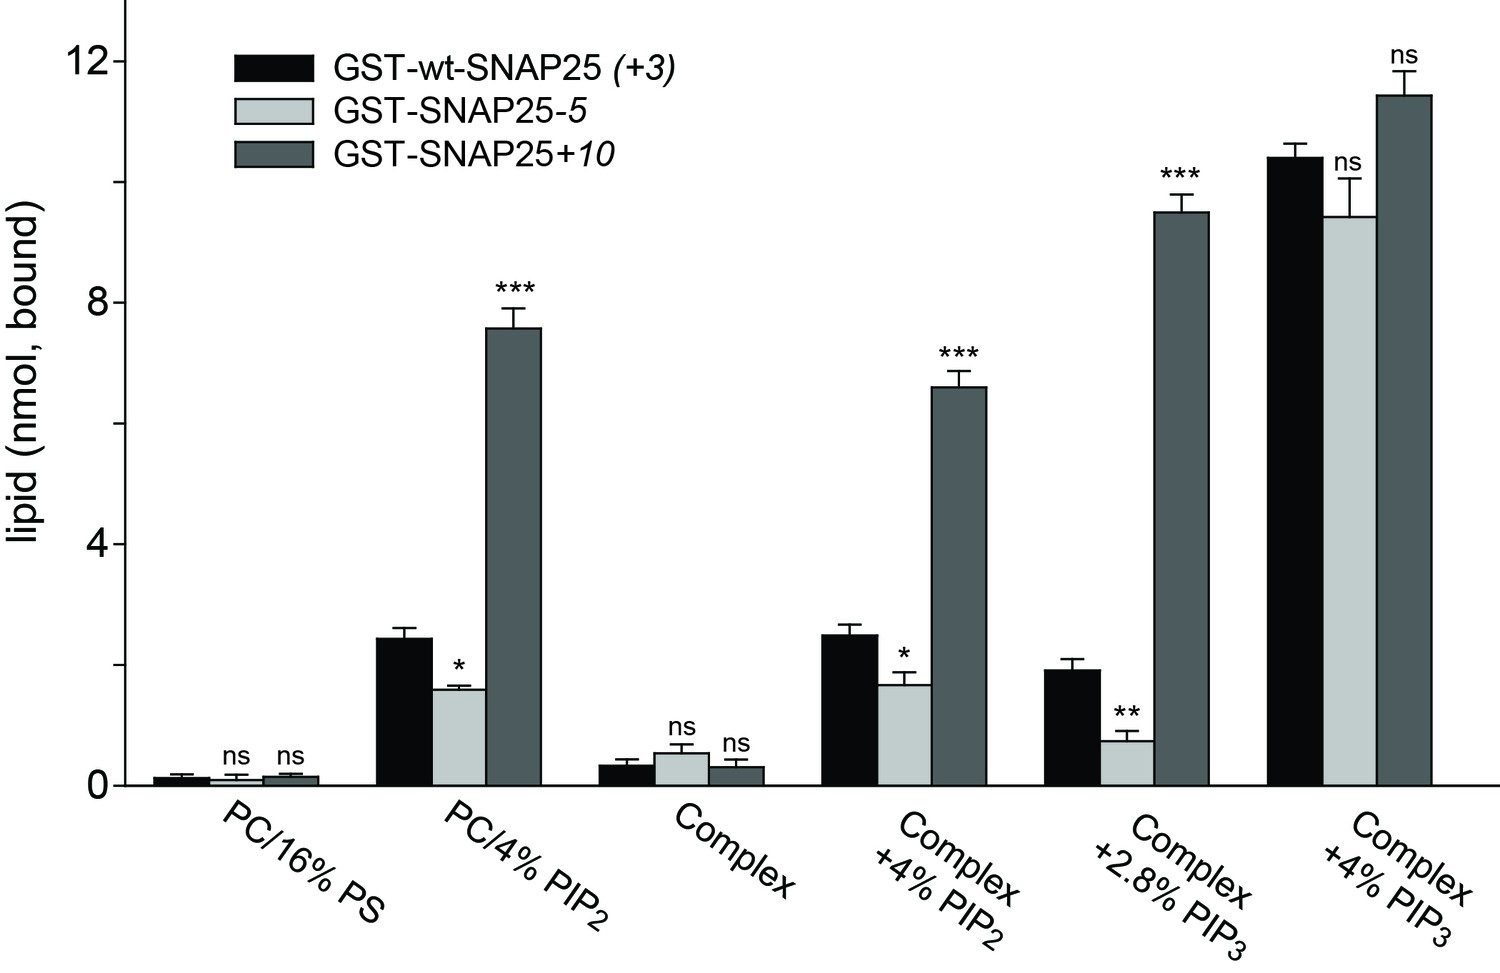
Binding of purified SNAP25 constructs to reconstituted liposomes.
Atto647N-labeled liposomes containing either POPC or a complex lipid mixture (POPC/DOPS/POPE/cholesterol/PI) and the indicated amounts of PI(4,5)P2 or PI(3,4,5)P3 were added to immobilized GST-wtSNAP25 (+3), GST-SNAP25-5 and GST-SNAP25+10 and incubated 1 hr at 4°C. After washing the beads, the amount of bound liposomes was measured by their Atto647N fluorescence (excitation: 639 nm, emission: 669 nm). The amounts of liposomes specifically bound to the different GST-SNAP25 constructs were determined by subtracting the values derived from the GST controls. Values are given as means ± S.E.M. (n = 3; t-test *p<0.05, **p<0.01, ***p<0.001, ns = not significant).
Author response image 1
From a set of experiments shown in Figure 1 the difference “periphery” – “cytosol” = “membrane” was calculated (left), and normalized to the “cytosol”-value (right).
Values are given as means ± s.e.m. (n = 4 independent experiments).
Author response image 2
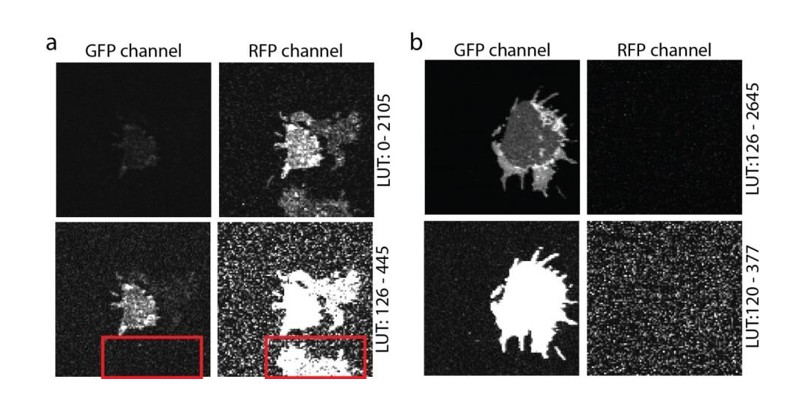
Crosstalk controls.
(a) PC12 membrane sheet from SNAP25-GFP and syntaxin-RFP transfected cells. In the lower image a membrane expressing only syntaxin-RFP is shown, with no bleed-through into the green channel (see red box in the lower panel). (b) Single transfection with SNAP25-GFP. A membrane sheet with high amounts of SNAP25-GFP is imaged in both the GFP- and the RFP-channels. No crosstalk from the green into the red channel is noticed. The images in both (a) and (b) are provided at two different look up tables (LUT) (upper and lower row).
Author response image 3
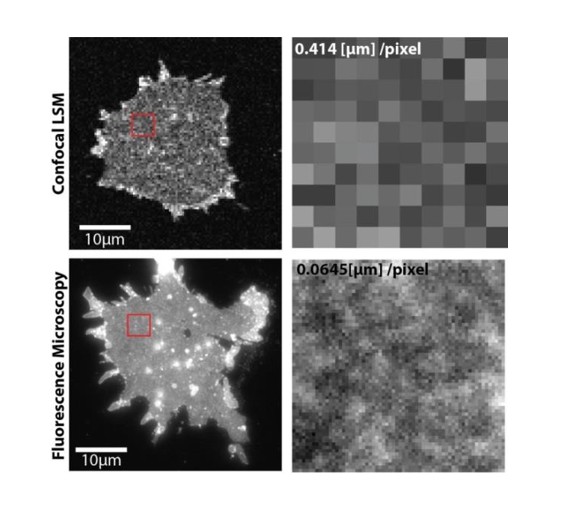
Upper panels, PC12 membrane sheet with SNAP25-GFP imaged via confocal laser scanning microscopy in a FRAP experiment (pixel size is 414 nm).
Lower panels, same preparation imaged by fluorescence microscopy at a pixel size of 65 nm. The smaller pixels allow resolving the spotty SNAP25 domain pattern (lower right), which is not resolved with large pixels (upper right). In the lower left some bright spots are visible that could be organelles or other membranous structures.
Download links
A two-part list of links to download the article, or parts of the article, in various formats.
Downloads (link to download the article as PDF)
Open citations (links to open the citations from this article in various online reference manager services)
Cite this article (links to download the citations from this article in formats compatible with various reference manager tools)
Electrostatic anchoring precedes stable membrane attachment of SNAP25/SNAP23 to the plasma membrane
eLife 6:e19394.
https://doi.org/10.7554/eLife.19394


