Structural snapshots of Xer recombination reveal activation by synaptic complex remodeling and DNA bending
- European Molecular Biology Laboratory, Germany
- University of Glasgow, United Kingdom
Figures
Figure 1
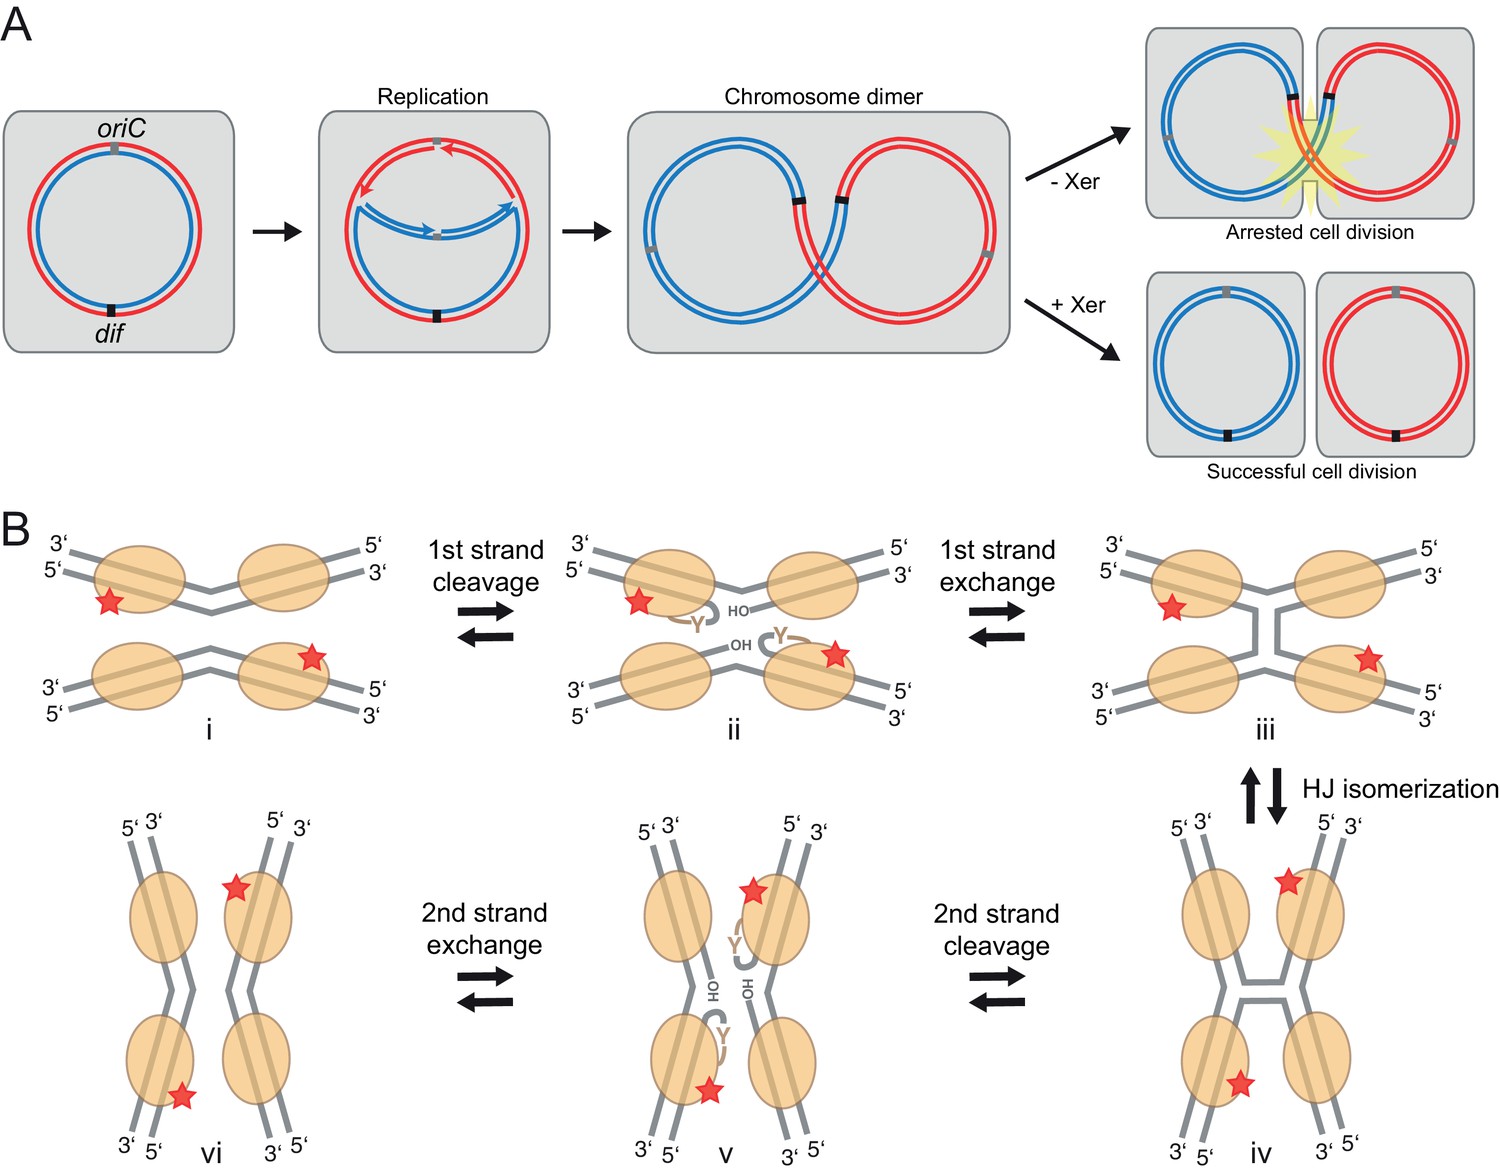
Xer recombination.
(A) The role of Xer recombination in the maintenance of bacterial chromosomes. Homologous recombination behind a stalled replication fork can result in a chromosome dimer. Xer recombinases monomerize these to rescue healthy genome segregation. The absence of Xer leads to cell division arrest and cell death. (B) Schematic representation of tyrosine site-specific recombination. Two recombinase monomers (beige ovals) bind one specific DNA site (grey) and two such sites are aligned in antiparallel in a tetrameric synaptic complex (i). The catalytic tyrosines of two symmetry-related protomers (red star) cleave one strand of each DNA, creating a covalent 3’ phosphotyrosyl bond and a free 5’ hydroxyl group (ii). The latter then attacks the phosphotyrosyl bond of the partner DNA, forming the HJ intermediate (iii). Following an isomerization step, the second pair of protomers becomes catalytically active (iv), leading to a reciprocal set of cleavage and strand exchange reactions that resolve the HJ and generate the recombined DNA products (v–vi). Only two protein subunits are active in the tetramer at a time (‘half-of-the-sites reactivity’), strictly ordering the chemical steps to ensure faithful progression of the recombination reaction to the desired products. Note that the DNA substrates are drawn with the strand going 3’ to 5’ on the top.
Figure 2 with 4 supplements

Structure of the XerH-difH complex.
(A) Sequence of the H. pylori difH site. The sequence is written in the 3’ to 5’ direction to maintain consistency with the historical nomenclature of the arms, the structural figures, and the schematic models. The two XerH-binding arms are shown in gold and blue and the central region and the terminal base-pairs in gray. The inserted base-pair in the left arm is shown in brown. Red arrows indicate XerH cleavage sites. Binding assays confirming the site are shown in Figure 2—figure supplement 1. (B) The XerH-difH synaptic complex structure (left), compared to the previously solved Cre-loxP synaptic complex (PDB: 4CRX; right). XerH molecules are shown in cartoon representation, colored as their bound difH arms in A (molecule A in gold, molecule B in blue). Red arrows indicate the cleavage sites on the DNA. Side arrows mark the synaptic interface. The dyad symmetry axis of the tetramer runs along the midline of the synaptic interface. See Figure 2—figure supplement 2 for a snapshot of the electron density map. (C) Close-up of the left arm-bound XerH (molecule A, gold). The N-terminal domain (residues 1–163) consists of six α-helices (αA to αF, cylinders); helices αB and αC are XerH-specific. The C-terminal catalytic domain (residues 171–362) is also mostly helical (αG-αO), with a single β-sheet containing three antiparallel β-strands (brown arrows). The interdomain linker could not be located in the structure (dashed line). The catalytic tyrosine is shown in red. Figure 2—figure supplement 3 shows a comparison with the previously solved DNA-free structure of XerD. (D) Sequence-specific interactions of XerH (side chains shown as sticks with atomic coloring) and DNA. Hydrogen bonds (<3.5 Å) are shown as dashed black lines. See Figure 2—figure supplement 4 for a comprehensive overview of the protein-DNA interactions and their biochemical validation.
Figure 2—figure supplement 1
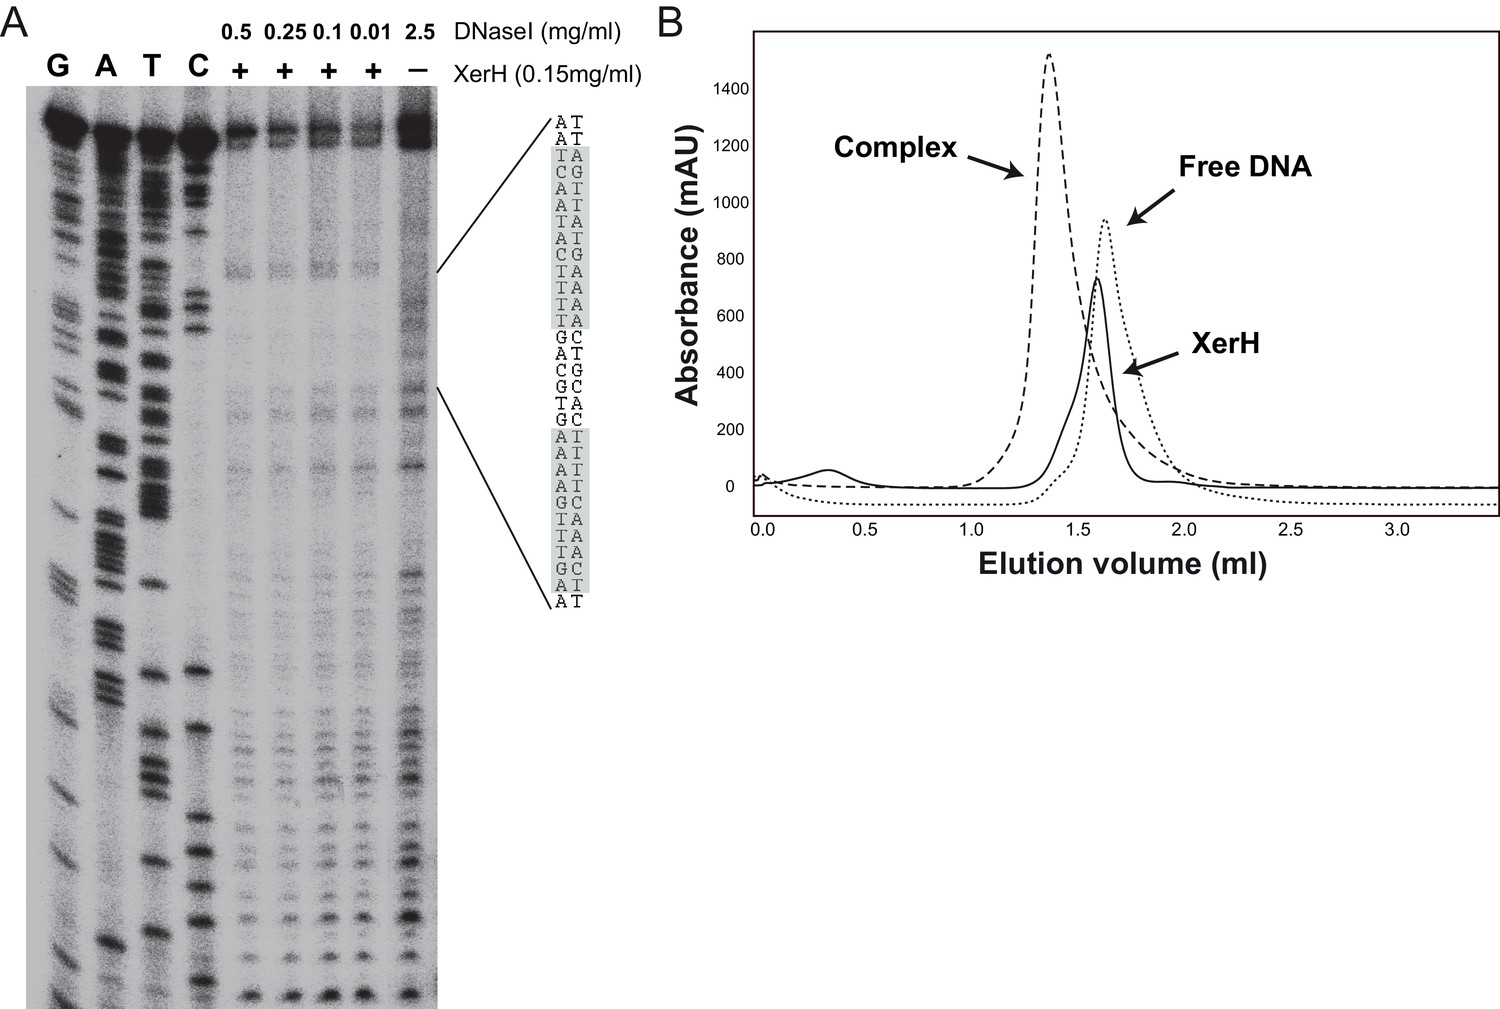
XerH binding to the predicted difH site.
(A) DNase I footprinting assay mapping the XerH-protected region of difH. A difH-containing bottom strand-labeled DNA substrate was incubated with XerH and then digested with the indicated amounts of DNase I to reveal the XerH-protected region of the substrate. Sequencing ladders (G, A, T, and C) were run alongside the reactions. The sequence of the protected region is shown, with the two difH arms shaded gray. (B) Analysis of complex formation between XerH and a 33 bp difH substrate by size-exclusion chromatography (SEC) detected at 260/280 nm. Retention volumes indicate formation of a complex with a larger size upon combining protein and DNA.
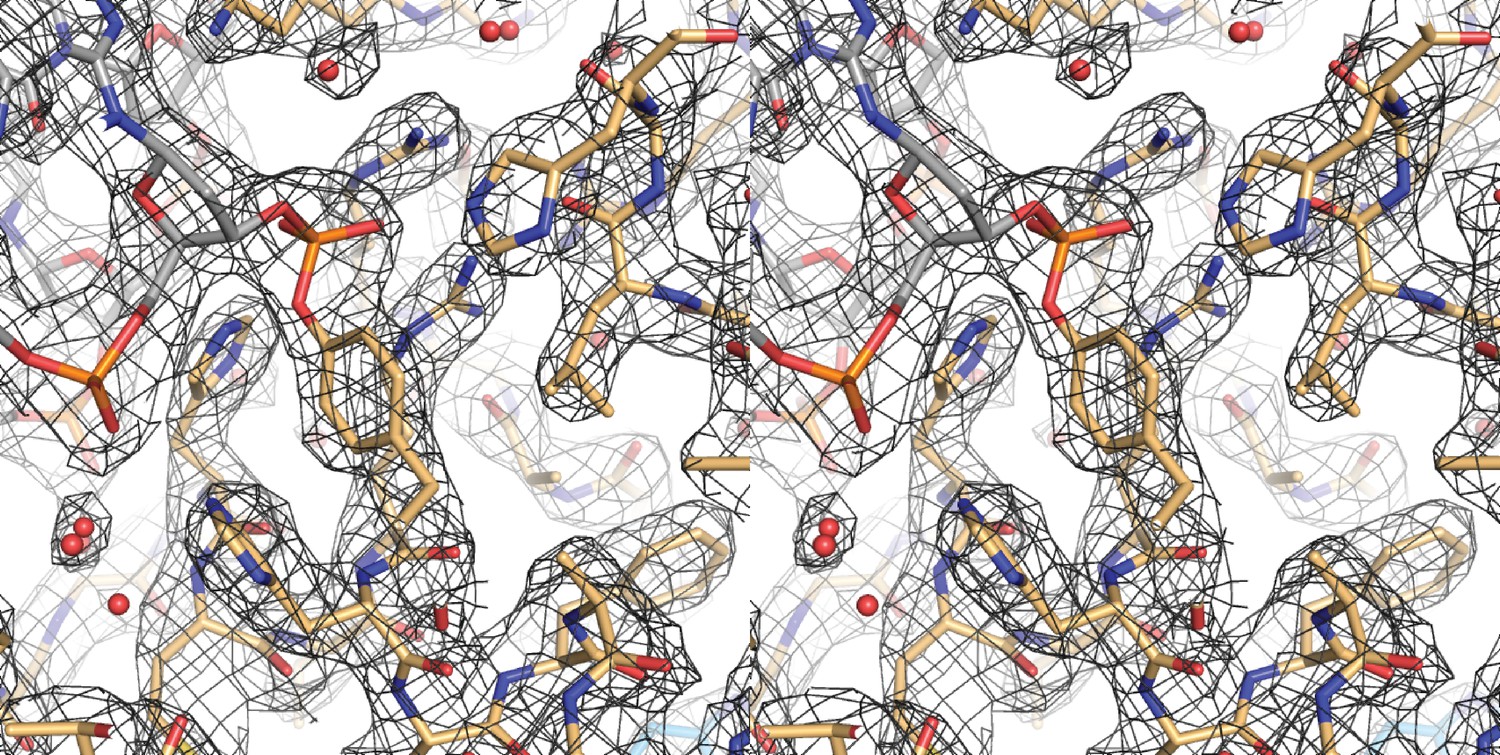
Figure 2—figure supplement 2
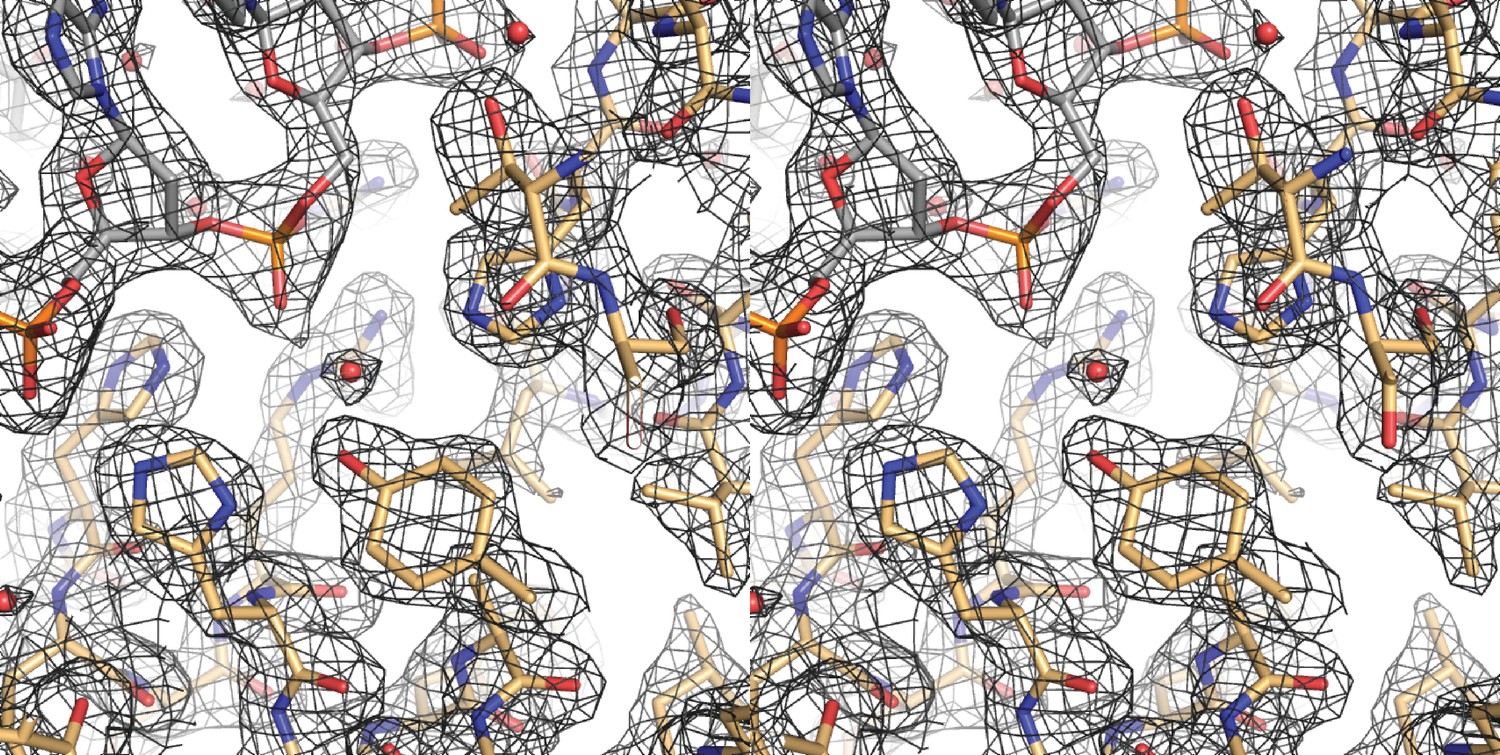
A cross-eyed stereo image of the bias-minimized 2Fo-Fc composite omit electron density map of the pre-cleavage XerH-difH complex structure.
The map (black mesh) shows the region of the active site of the left arm-bound subunit contoured at 1.2 sigma level. Protein (gold) and DNA (gray) residues are shown as sticks with atomic coloring; water molecules are shown as red spheres.
Figure 2—figure supplement 3
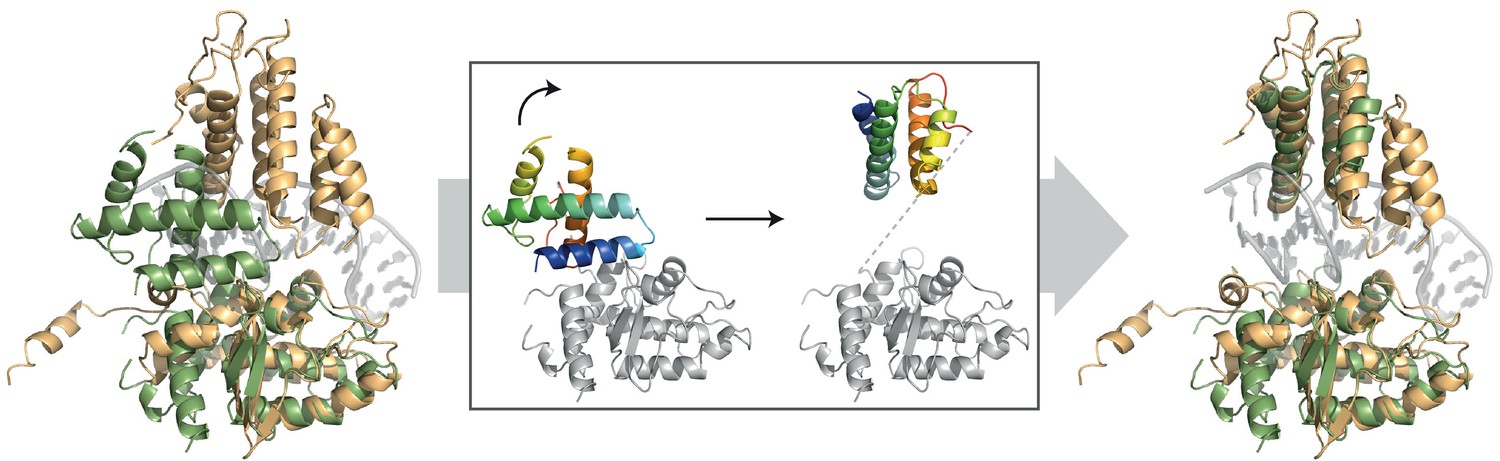
Comparison of the DNA-bound XerH (gold) and DNA-free XerD (PDB: 1A0P; green) structures.
The insert shows how a rotation of the N-terminal domain (in rainbow coloring from blue for N-terminus to red for C-terminus) can lead to the opening of the XerD clamp in order to accommodate a DNA duplex without clashes.
Figure 2—figure supplement 4
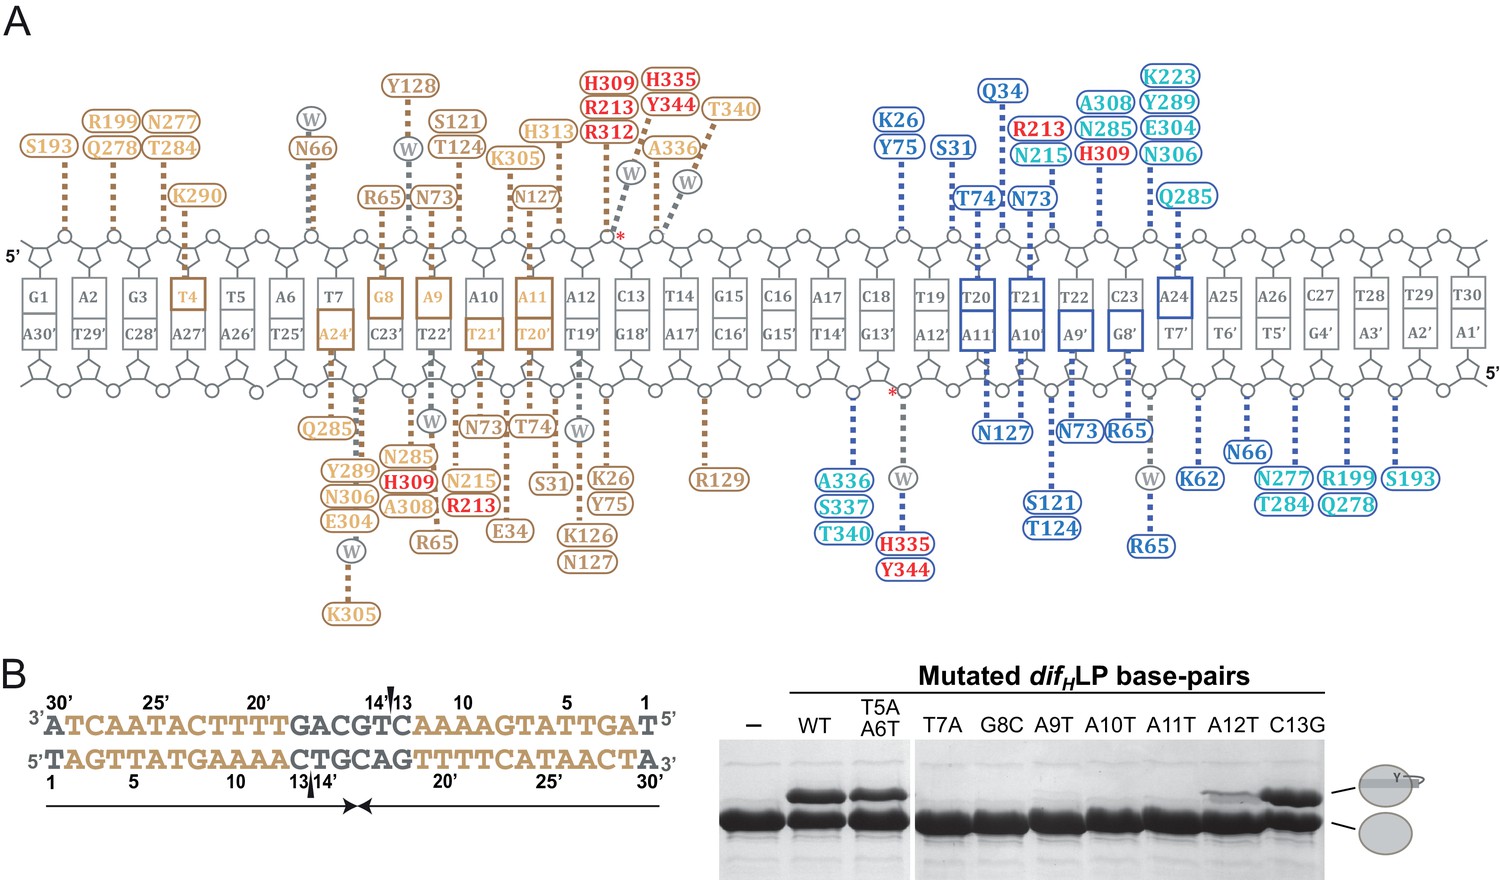
Interactions between XerH and the difH site.
(A) Schematic view of the interactions observed in the XerH-difH synaptic complex crystal structure. Amino acids of the XerH subunits bound to the left and right difH arms are shown in gold and blue, respectively. The residues of the N-terminal domain are shown with a darker color, and the catalytic residues are shown in red. Dashed lines indicate hydrogen bonds. Bases directly contacted by XerH are colored gold or blue. Interacting water molecules are shown in grey. Red stars mark the cleavage sites. The diagram is based on protein-DNA interaction analysis performed with NUCPLOT (Luscombe et al., 1997). (B) Mutational analysis of XerH-difH interactions. The left-arm palindrome difH (difHLP) substrate is shown on the left with the left arm sequences in gold. Note that the sequence is written in the 3’ to 5’ direction as in the main figure. Arrows beneath the sequence indicate the palindromic region, and triangles mark the introduced nicks. On the right, in vitro XerH cleavage assays with various substrate variants. The DNA mutations numbered as in (A) are indicated above the gel. In this assay, upon cleavage XerH becomes covalently attached to the cleaved DNA strand via a phosphotyrosyl bond, which is trapped by the use of double-nicked ‘suicide’ substrates (see schematic representation in Figure 3C). The XerH-DNA covalent intermediate and unmodified XerH can be separated on SDS-PAGE.
Figure 3 with 2 supplements
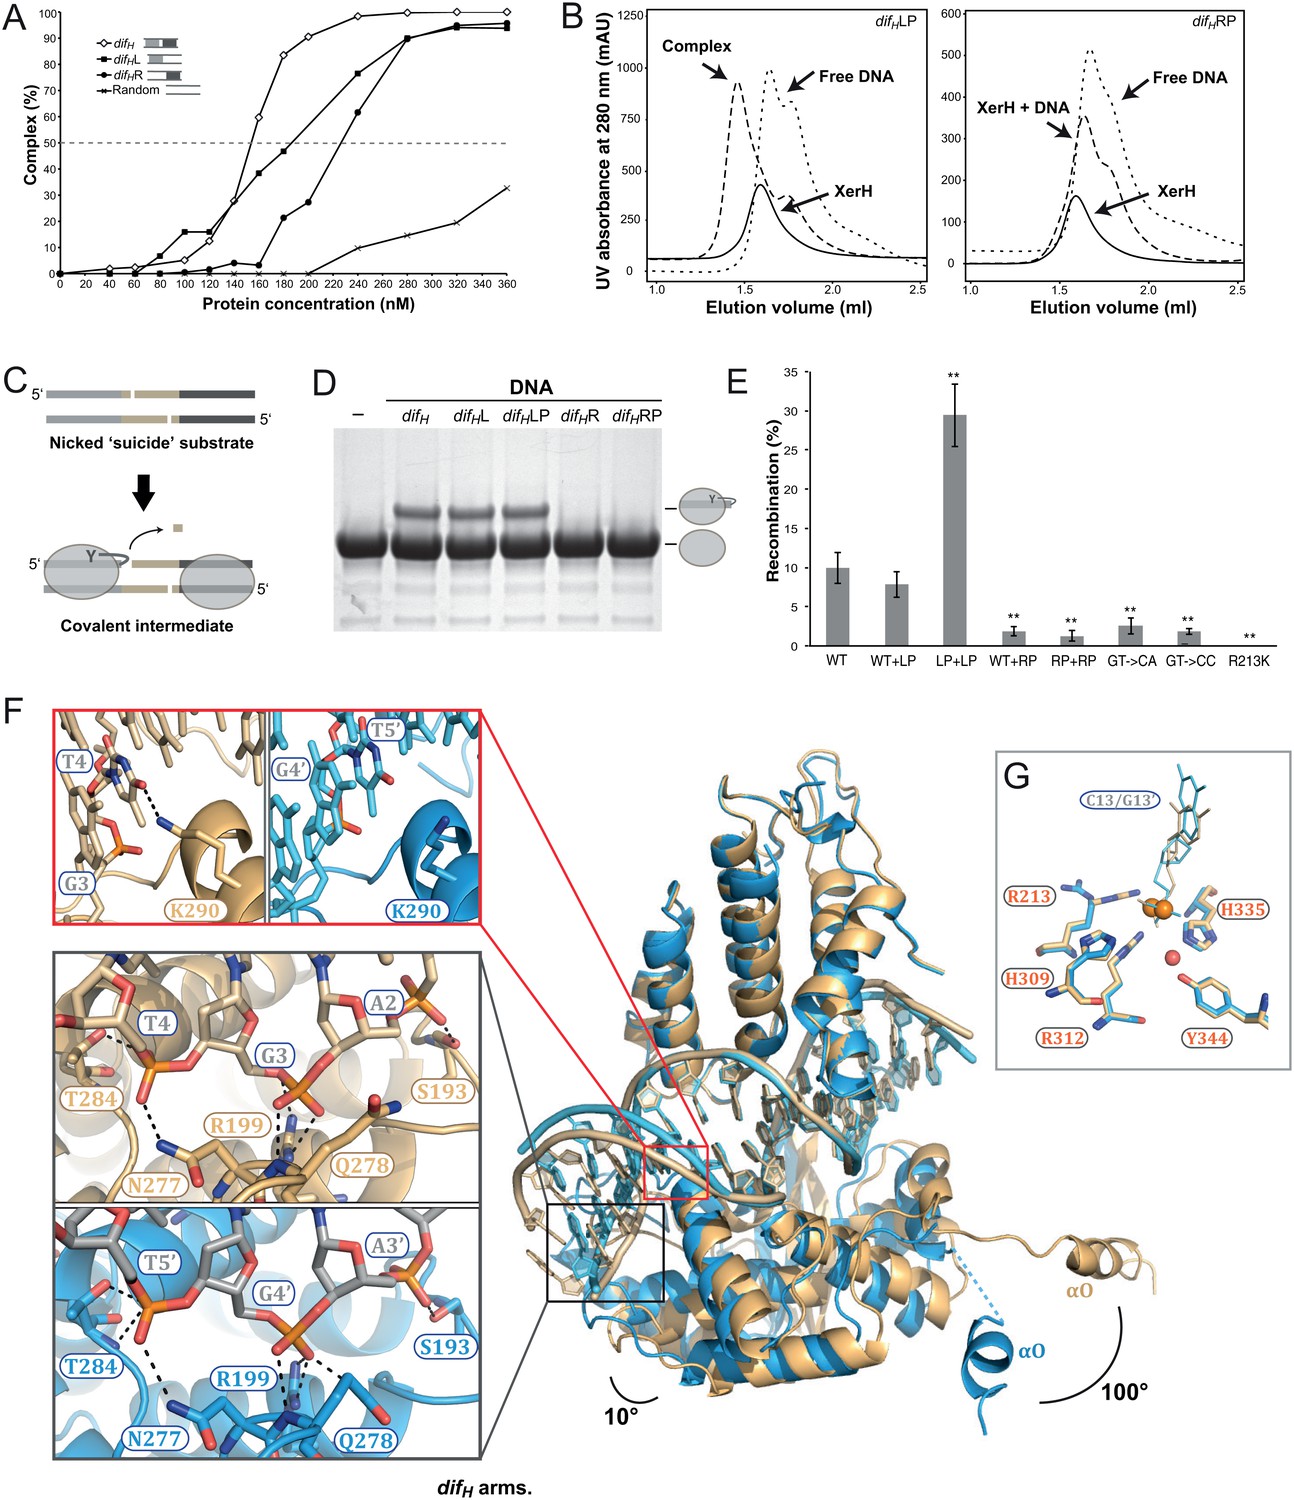
Differential recognition of the two difH arms.
(A) XerH binding to difH and derivatives containing a single difH arm (difHL or difHR) flanked by a random sequence, as quantified from EMSA (see original gels in Figure 3—figure supplement 1 and numerical quantification data in Figure 3—source data 1). Random DNA was used as a control. (B) SEC of XerH complexes with palindromic difH substrates (left-arm palindrome difHLP, right-arm palindrome difHRP). XerH alone migrates as a monomer. A shift in retention is observed with difHLP, indicating stable complex formation. No corresponding shift is seen with difHRP. (C) The design of the in vitro cleavage assay using nicked ‘suicide’ substrates: upon cleavage by XerH, a single nucleotide diffuses away trapping the covalent phosphotyrosyl intermediate. (D) In vitro DNA cleavage assays, showing that the left arm of difH is required for XerH activity. The covalent protein-DNA intermediate is detected by SDS-PAGE. (E) Left arm is required for XerH-mediated recombination in E. coli. Intramolecular recombination rates were measured with plasmids containing two difH sites (WT+WT), one difH site and one difHLP site (WT+LP), two difHLP sites (LP+LP), one difH site and one difHRP site (WT+RP), two difHRP sites (RP+RP), two difH sites with G3 and T4 mutated to CA, or two difH sites with G3 and T4 mutated to CC. G3 was mutated together with T4, because it may interact with K290 and complement the role of T4. XerH catalytic mutant R213K XerH is shown as a control. Bars indicate standard deviation determined from three independent experiments (n = 3). **p<0.05 (Student’s test). Colony counts and recombination rates are tabulated and their statistical analysis is shown in Figure 3—source data 2. (F) XerH recognizes the left (gold) and right (blue) difH arms differently. Superimposition of two adjacent XerH subunits shows differences in the DNA bending, in the positions of the C-terminal domains, and in the protruding helices αO. Red insert: Interaction of K290 and T4 (dashed lines: hydrogen bonds) at the left arm (left panel) is absent at the right arm (right panel). Black insert: Interactions with the three outermost base-pairs of the left (top) and the right (bottom) difH arms are remarkably similar despite the shifted DNA sequence. Functional characterization of these interactions and the role of the specific features of the left difH arm are shown in Figure 3—figure supplement 2. (G) Active site conformations at the left (gold) and right (blue) difH arm. Catalytic residues (sticks) are incompletely assembled around the scissile phosphates (orange spheres). The red sphere denotes a bound water molecule.
-
Figure 3—source data 1
Quantification of XerH binding to difH variants based on EMSA experiments.
The original gels are shown in Figure 3—figure supplement 1.
- https://doi.org/10.7554/eLife.19706.011
-
Figure 3—source data 2
Results of the in vivo recombination assays.
Colony counts and recombination rates are tabulated and their statistical analysis by Student’s t-test is shown.
- https://doi.org/10.7554/eLife.19706.012
Figure 3—figure supplement 1

Electrophoretic mobility shift assay (EMSA) gels showing XerH binding to difH and derivatives.
EMSA was performed with 50 bp substrates containing wild-type difH (A), left arm of difH accompanied by a random sequence (B), right arm of difH preceded by a random sequence (C), or a fully randomized sequence with matched GC content (D). The resulting bands correspond to free DNA, DNA bound to one XerH monomer (gray oval), or DNA bound to two XerH monomers, as indicated by the schematics on the right hand side of the gels. These complex stoichiometries are derived from analytical SEC and supported by EMSA with half-site difH DNA (data not shown).
Figure 3—figure supplement 2
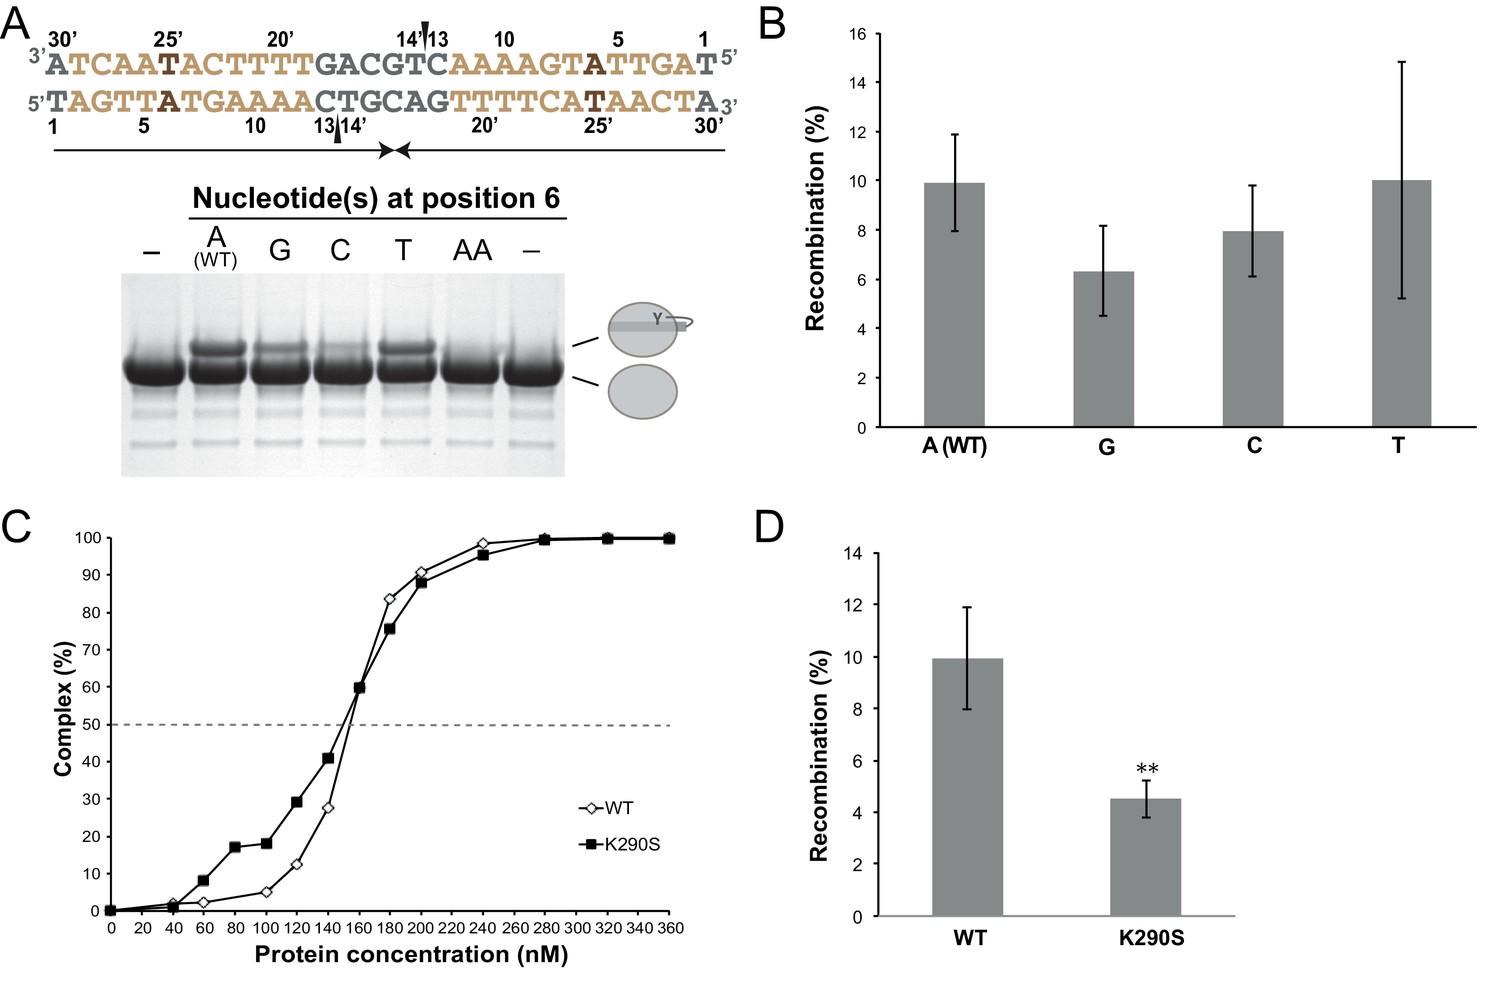
Functional characterization of the role of the specific features of the left difH arm.
(A) Cleavage assays with difHLP derivatives modified at the inserted base-pair (positions 6/25’, brown). The figure illustrates the unmodified substrate (written in the 3’ to 5’ direction), nicked at the two positions marked by black wedges. Upon cleavage, XerH becomes covalently attached to DNA via a phosphotyrosyl bond, which is separated from unmodified XerH on SDS-PAGE (see also Figure 3C). (B) Mutations of the inserted base in the left arm do not affect XerH-mediated recombination in E. coli. galK reporter plasmids contained two wild-type difH sites (A–WT) or two difH sites with the left arm mutated at position 6/25’ (A6 mutated to G, C, or T as indicated). Bars indicate standard deviation (n = 3). None of the mutations showed significant reduction of recombination (p>0.05; Student's test). Exact colony counts, recombination rates, and their statistical analysis are shown in Figure 3—source data 2. (C) K290S mutation does not affect difH binding (WT: wild-type XerH control). Binding curves were quantified from EMSA (see numerical data in Figure 3—source data 1). (D) K290S mutation reduces XerH recombination in E. coli by 50% (WT: control assay with wild-type XerH). Reporter plasmids contained two wild-type difH sites. Statistical analysis is as in (B). **p<0.05 (Student’s test). Colony counts, recombination rates, and statistical analysis are included in Figure 3—source data 2.
Figure 4 with 1 supplement
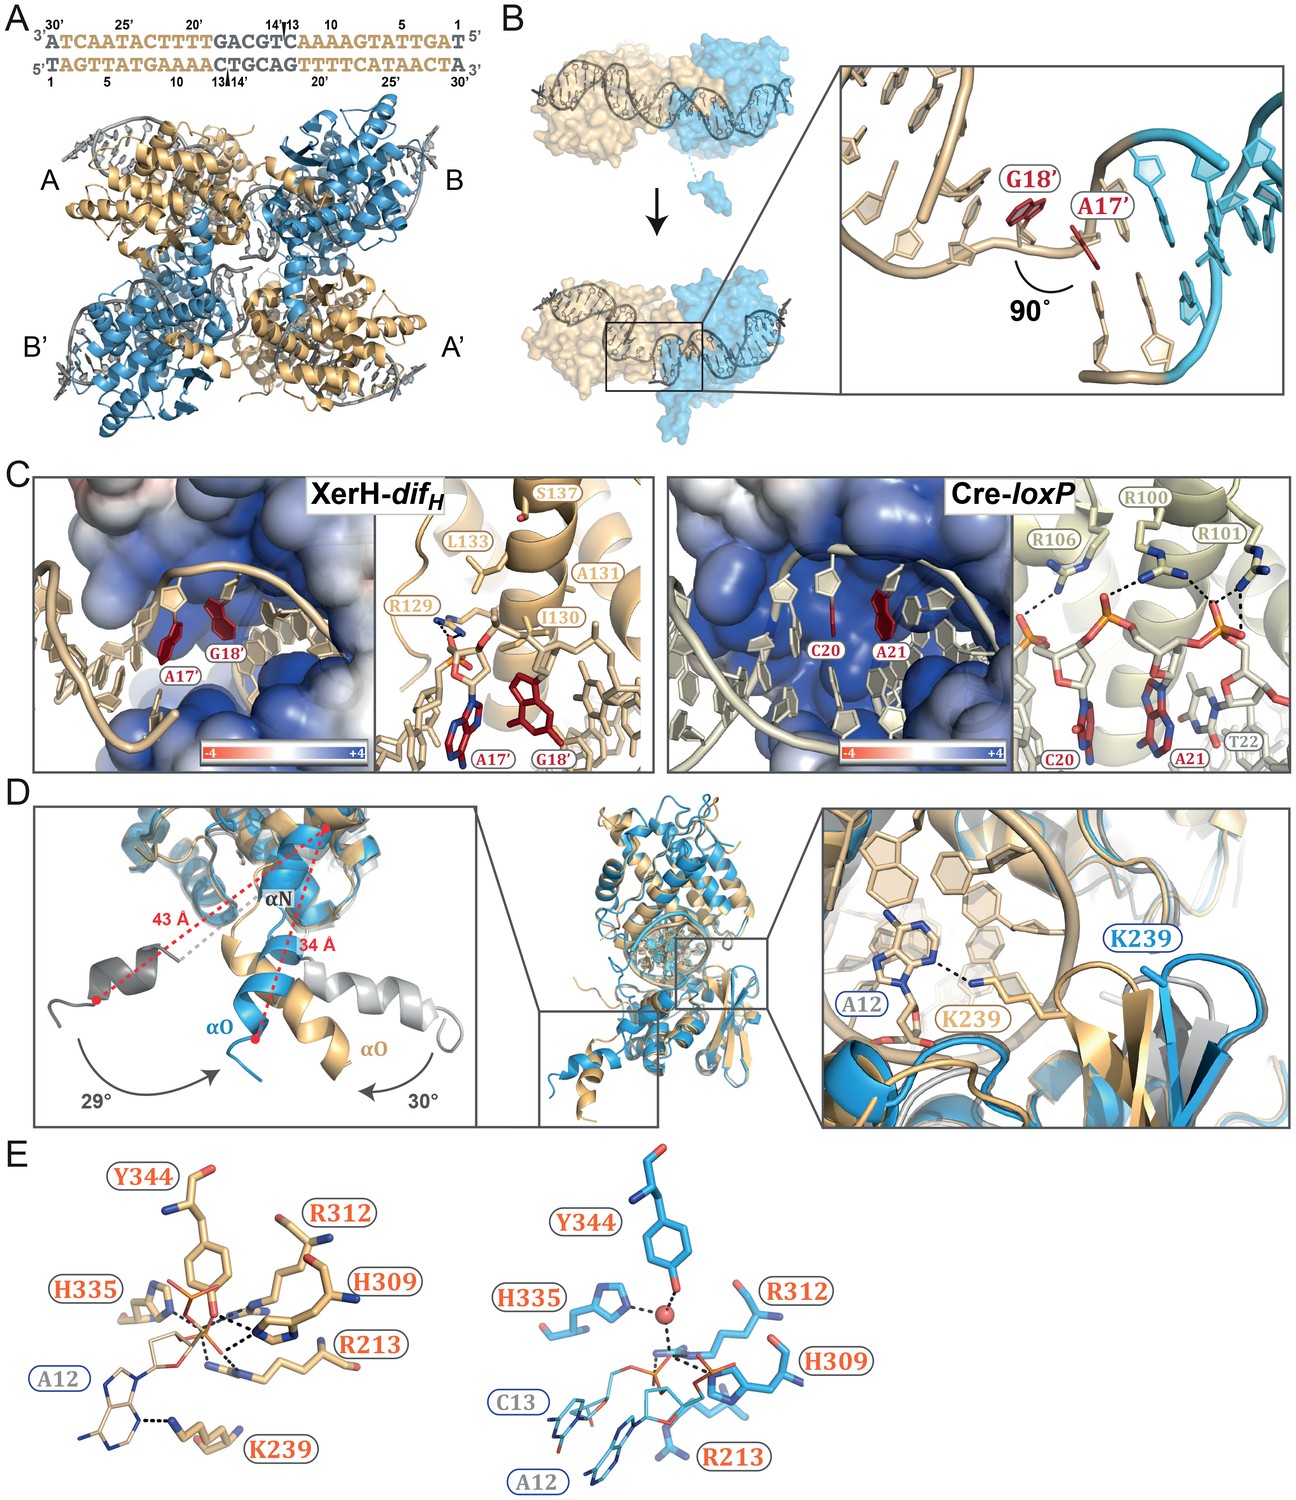
The post-cleavage XerH-difHLP synaptic complex structure.
(A) Overall view of the XerH-difHLP structure in cartoon representation. Sequence of the difHLP substrate is shown above (written in the 3’ to 5’ direction, with the arms in gold, central region in gray) the nick positions are marked by triangles. Figure 4—figure supplement 1 shows a snapshot of the electron density map. (B) Compared to the pre-cleavage XerH-difH complex, both subunits (A, gold; B, blue surface) have rotated ~22° towards each other, concomitant with DNA bending. Insert: Close-up of DNA bending: A17’ and G18’ (red) are unstacked, with a 90° kink. (C) XerH (left) interacts with the DNA kink differently than Cre (PDB: 1NZB; right). The electrostatic surface potential is shown in red (negative) and blue (positive). (D) Superimposition of the two subunits (A, gold and B, blue) bound to the same difHLP site illustrates their different conformations. Left insert: Helices αN and αO are repositioned relative to the pre-cleavage structure (grey), including rotations (marked by arrows) and shortening of the helices (red dashed lines showing the distances between Cα of L338 and Cα of W359). Right insert: repositioning of the β2-β3 loop upon activation enables the catalytic K239 to interact with the DNA. For clarity, only the DNA associated with the golden monomer is shown. (E) Active site conformations of the distinct XerH subunits. In the active subunit (molecule A, left), R213, H309, R312, and H335 make hydrogen bonds with the scissile phosphate (orange), K239 contacts the base of the adjacent nucleotide A12, and Y344 is covalently attached to the DNA. In the inactive subunit (right) the catalytic tyrosine is 5.5 Å away from the scissile phosphate, R213 and H335 point away, and the K239 side chain is disordered. Red sphere – bound water molecule; dashed lines – hydrogen bonds.
Figure 4—figure supplement 1
Cross-eyed stereo image of the bias-minimized 2Fo-Fc composite omit electron density map of the post-cleavage XerH-difH complex structure.
The map (black mesh) shows the region of the active site of the active subunit contoured at 1.2 sigma level. Protein (gold) and DNA (gray) residues are shown as sticks with atomic coloring; water molecules are shown as red spheres.
Figure 5 with 1 supplement
XerC/D-dif synaptic complex models reveal common features of Xer recombination.
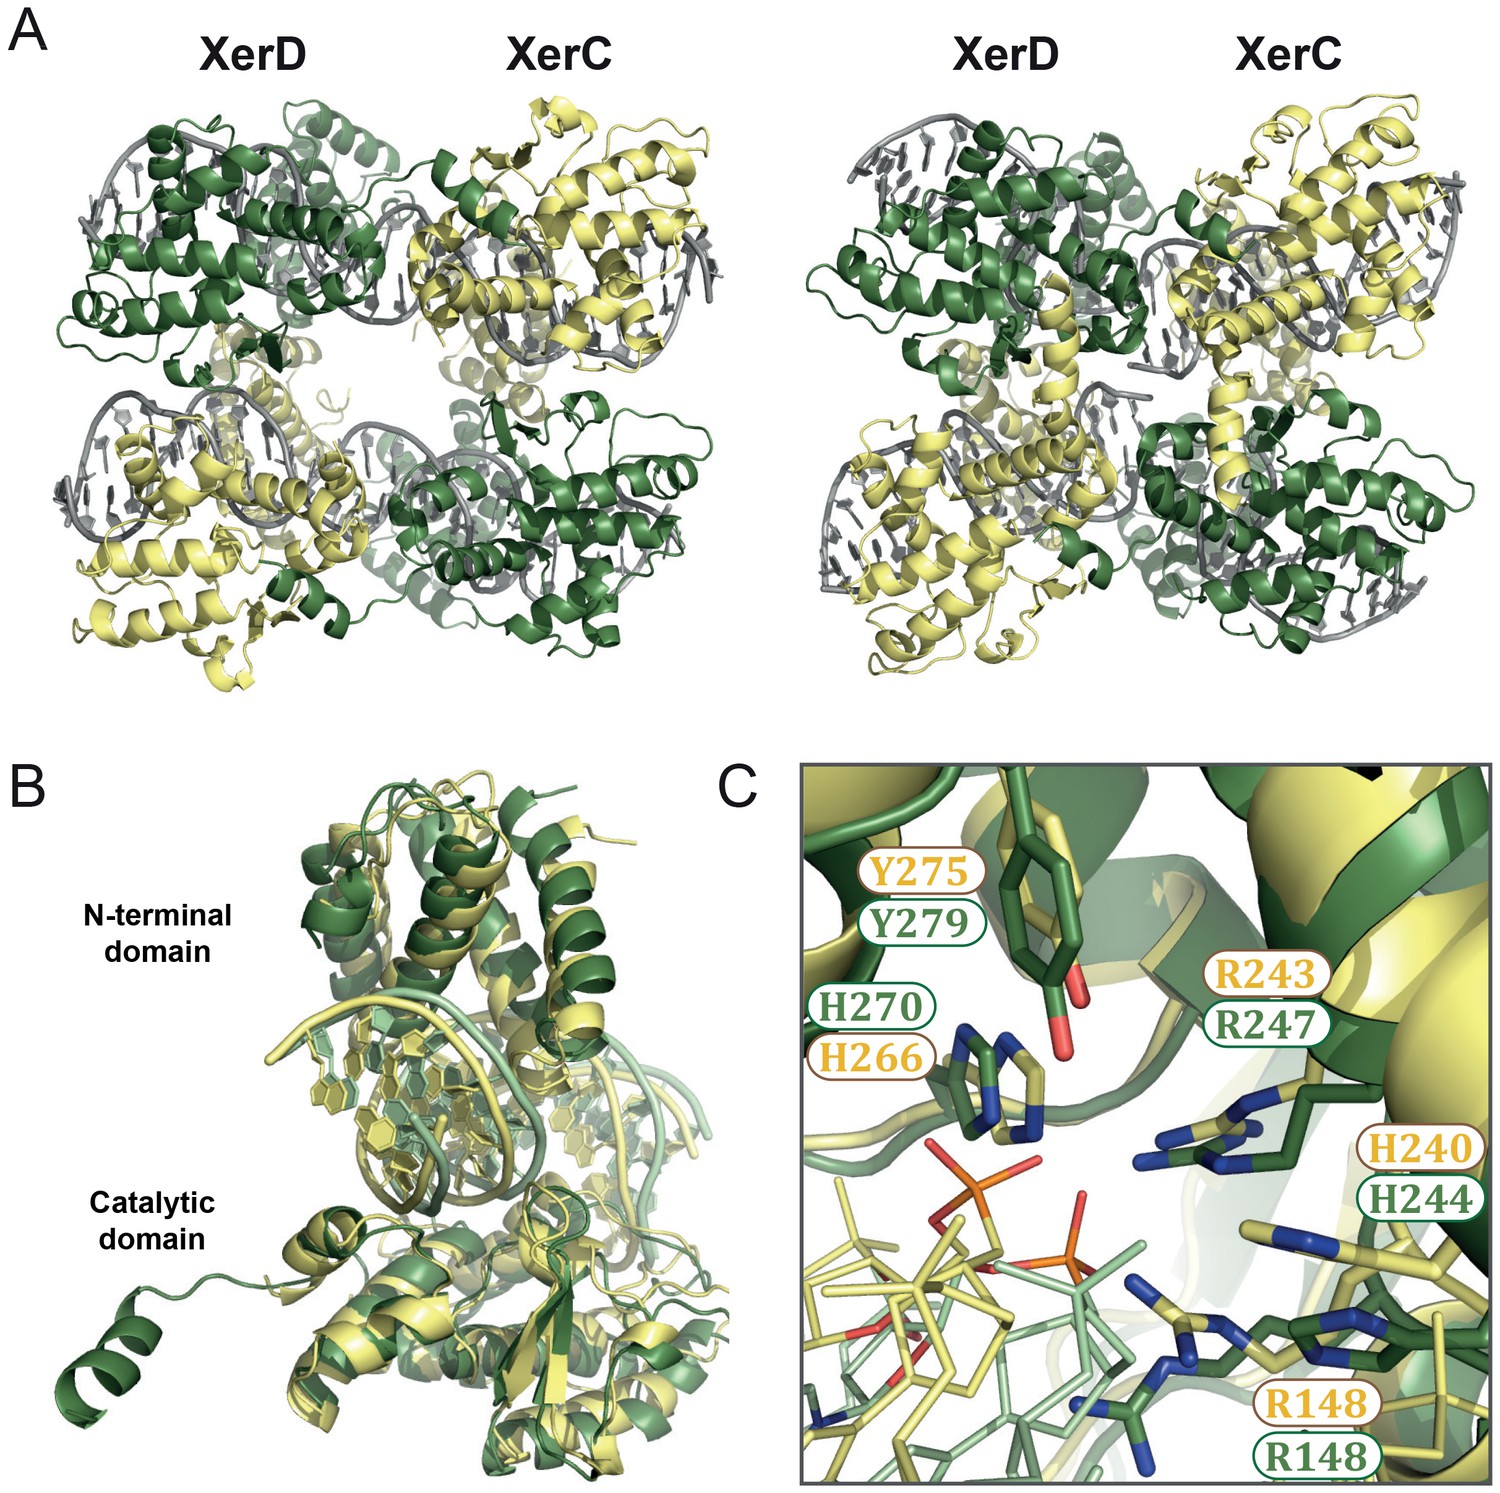
(A) Cartoon representation of heterotetrameric XerC/D-dif synaptic complexes modeled based on the pre-cleavage (left) or the post-cleavage (right) XerH-difH complexes. XerD (green) and XerC (yellow) monomers are arranged compatibly in the tetramers. Figure 5—figure supplement 1 shows the structure-based sequence alignment and a comparison of protein-DNA interactions. (B) Superimposition of XerD and XerC monomers in the pre-cleavage structure model. (C) Conserved active site residues of XerD and XerC (sticks with atomic coloring) are assembled around the scissile phosphate (orange) in the pre-cleavage XerC/D-dif synaptic complex.
Figure 5—figure supplement 1

Modeling of XerC/D-dif synaptic complexes.
(A) Secondary structure-based alignment of XerH, XerD, and XerC. α-helices and β strands are marked above, conserved catalytic residues are in red. (B) Schematic view of the interactions of XerH, XerD, and XerC with the outer base-pairs of their respective binding sites. Dashes indicate hydrogen bonds.
Figure 6 with 1 supplement
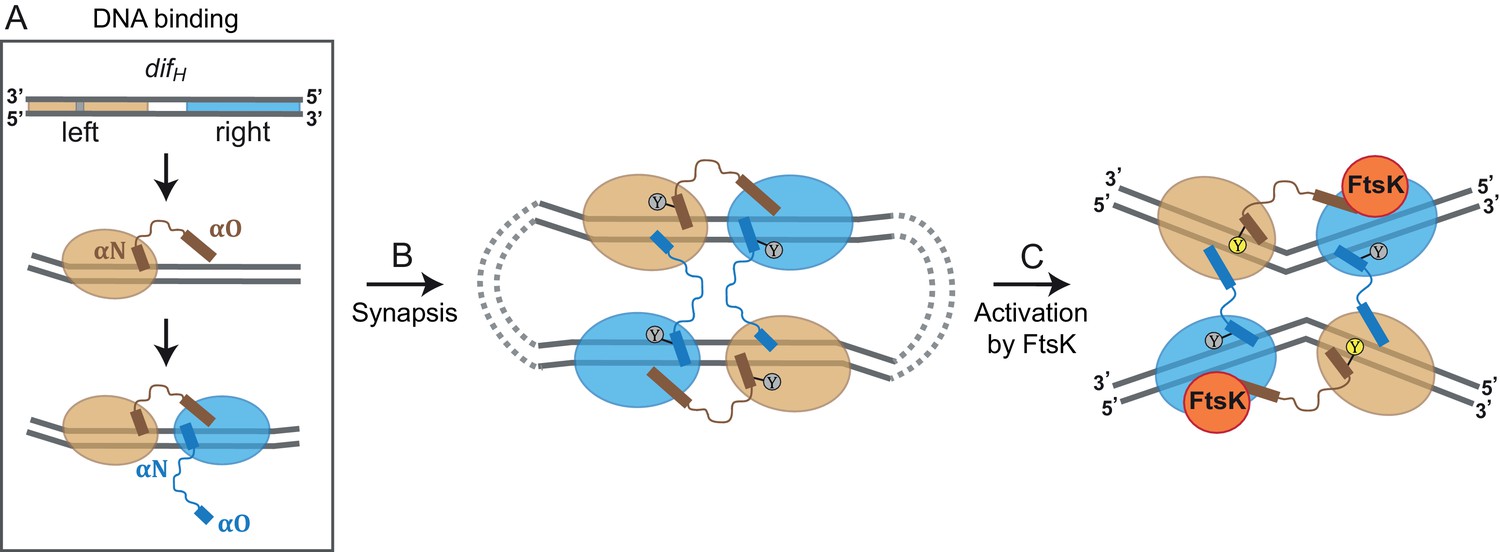
Model for XerH recombination activation.
(A–C) Differential binding affinities of XerH to the left and right arms of difH DNA trigger an asymmetric DNA conformation and arrange the two protein subunits in distinct conformations (A). Two difH sites are brought together in a tetrameric synaptic complex (B) stabilized by a cyclic arrangement of the protruding αO helices. Initially formed XerH-difH complexes are inactive (indicated by gray nucleophilic tyrosine) as seen in our pre-cleavage structure. Figure 6—figure supplement 1 shows that XerH alone is unable to cleave an intact DNA substrate. Catalytic activation then involves DNA bending and a major rearrangement of the protein subunits (as in our post-cleavage structure), presumably enabled by a direct interaction with FtsK (C). As a result, helices αO become ordered across the synapse, while helices αN and αO along one difH molecule rotate, bringing the nucleophilic Y344 into the active conformation (yellow) that enables DNA cleavage. Note that the DNA substrates are drawn with the strand going 3’ to 5’ on the top as in Figure 1B.
Figure 6—figure supplement 1
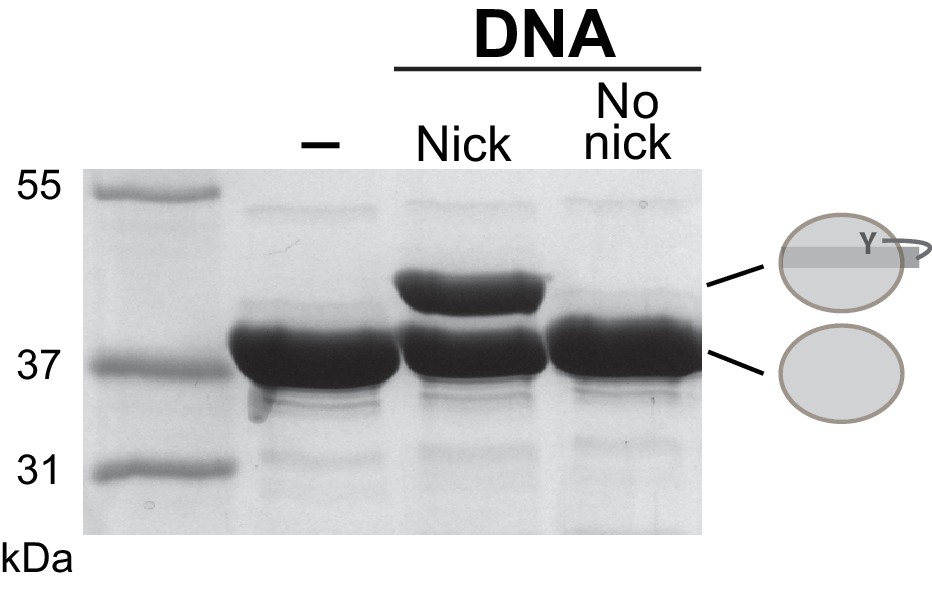
XerH activity on intact and nicked difH substrates.
XerH is unable to cleave intact difH substrates, as assessed by DNA cleavage assays on SDS-PAGE. Wild-type difH with or without ‘suicide’ nicks was used as indicated. (-) denotes no-DNA control.
Videos
Video 1
Activation of the XerH-difH synaptic complex.
Morphing of the XerH-difH synaptic complex in pre-cleavage conformation into the post-cleavage conformation. Activation involves major conformational rearrangement of the synaptic complex, involving rotation of all XerH subunits and sharp DNA bending.
Tables
Table 1
X-ray diffraction data collection and refinement statistics.
XerH-difH | XerH-difHLP native | XerH-difHLP Se | |
|---|---|---|---|
Crystal properties | |||
Space group | P 21 21 21 | I 2 2 2 | I 2 2 2 |
Unit cell: a, b, c (Å) | 79.28, 153.2, 169.39 | 86.38, 115.22, 235.2 | 85.79, 115.73, 235.29 |
Unit cell: α, β, γ (°) | 90, 90, 90 | 90, 90, 90 | 90, 90, 90 |
Data collection | |||
Beamline | I04-1 (DLS) | ID29 (ESRF) | ID29 (ESRF) |
Wavelength (Å) | 0.92819 | 0.97908 | 0.97908 |
Resolution range (Å) | 48.89–2.1 (2.18–2.1) | 46.96–2.4 (2.49–2.4) | 47.04–3.15 (3.2–3.15) |
Total reflections | 793843 | 372682 | 100854 |
Unique reflections | 120659 | 46216 | 37960 |
Multiplicity | 6.6 (6.0) | 8.1 (8.2) | 2.7 (2.6) |
Completeness (%) | 99.87 (99.81) | 99.86 (99.50) | 97.2 (96.2) |
R-meas (%) | 11.28 (82.4) | 10.32 (140.1) | 11.9 (71.0) |
R-sym (%) | 10.4 (75.4) | 9.7 (131.4) | 9.7 (58.2) |
I/σI | 12.53 (2.25) | 14.90 (1.51) | 11.17 (1.89) |
CC1/2 | 0.998 (0.754) | 0.999 (0.648) | 0.994 (0.727) |
Wilson B-factor | 31.55 | 56.97 | 59.75 |
Refinement | |||
R-work | 0.1913 | 0.1949 | |
R-free | 0.2233 | 0.2203 | |
Number of non-hydrogen atoms | 14670 | 6984 | |
Protein residues | 1508 | 769 | |
RMS (bonds) | 0.003 | 0.002 | |
RMS (angles) | 0.53 | 0.55 | |
Ramachandran favored (%) | 99 | 97 | |
Ramachandran outliers (%) | 0 | 0 | |
Clashscore | 1.92 | 2.99 | |
Average B-factor | 37.90 | 72.20 |
Additional files
-
Supplementary file 1
List of oligonucleotides used in this study.
- https://doi.org/10.7554/eLife.19706.022
Download links
A two-part list of links to download the article, or parts of the article, in various formats.
Downloads (link to download the article as PDF)
Open citations (links to open the citations from this article in various online reference manager services)
Cite this article (links to download the citations from this article in formats compatible with various reference manager tools)
Structural snapshots of Xer recombination reveal activation by synaptic complex remodeling and DNA bending
eLife 5:e19706.
https://doi.org/10.7554/eLife.19706


