Large-scale remodeling of a repressed exon ribonucleoprotein to an exon definition complex active for splicing
- University of California, Los Angeles, United States
- University of Arizona, United States
Figures
Figure 1 with 1 supplement

Distal PTBP1 binding flanking an alternative exon represses both splice sites.
(A) Diagram of the modified Src N1 exon RNA used in this study. PTBP1-binding sites are indicated as black bars. The upstream site (shown below) originally located within the polypyrimidine tract of the 3’ splice site was shifted to a position 25-nt upstream of the branch point sequence (BPS [Black, 1991]; cucAg). The polypyrimidine tract (PY tract) and 3’ splice site (3’ ss) of the Adenovirus Major Late (AML) first intron (highlighted in green) were added in place of the original N1 splice site. The downstream PTBP1-binding sites were left unchanged (shown above to the right). A mutation (MUT) of the upstream PTBP1-binding sites known to prevent PTBP1 binding is highlighted in red (Sharma et al., 2008; Amir-Ahmady et al., 2005). Nucleotides known to be important for PTBP1 binding are underlined. (B) Top panel: Diagram of the trans-splicing assay between the N1 exon and the 5’ splice site of the first AML intron (5’AML). Complexes assembled on either the WT or MUT N1 exon were mixed with the 5’AML complex and further incubated. Total RNA was extracted and assayed by primer extension analysis with a 32P labeled 3’ exon primer (red arrow). Bottom panel: primer extension products were resolved on 8% urea-PAGE. Spliced (90 nts.) and unspliced (195 nts) products are indicated. Bands marked with a black asterisk (*) resulted from an unexpected RNAse H cleavage of the N1 RNA by the control oligo, while a red asterisk (*) indicates self trans-splicing of the N1 exons. (C) Top panel: Diagram of the trans-splicing assay between the N1 exon and the downstream 3’ splice site of the first AML intron (3’AML). Reaction conditions were as in (B). Bottom panel: urea-PAGE of the primer extension assay as in (B), except using an oligo complementary to the 3’AML exon. Spliced (246 nts.) and unspliced (140 nts.) products are indicated.
Figure 1—figure supplement 1
Distal PTBP1 binding represses splicing of the N1 exon.
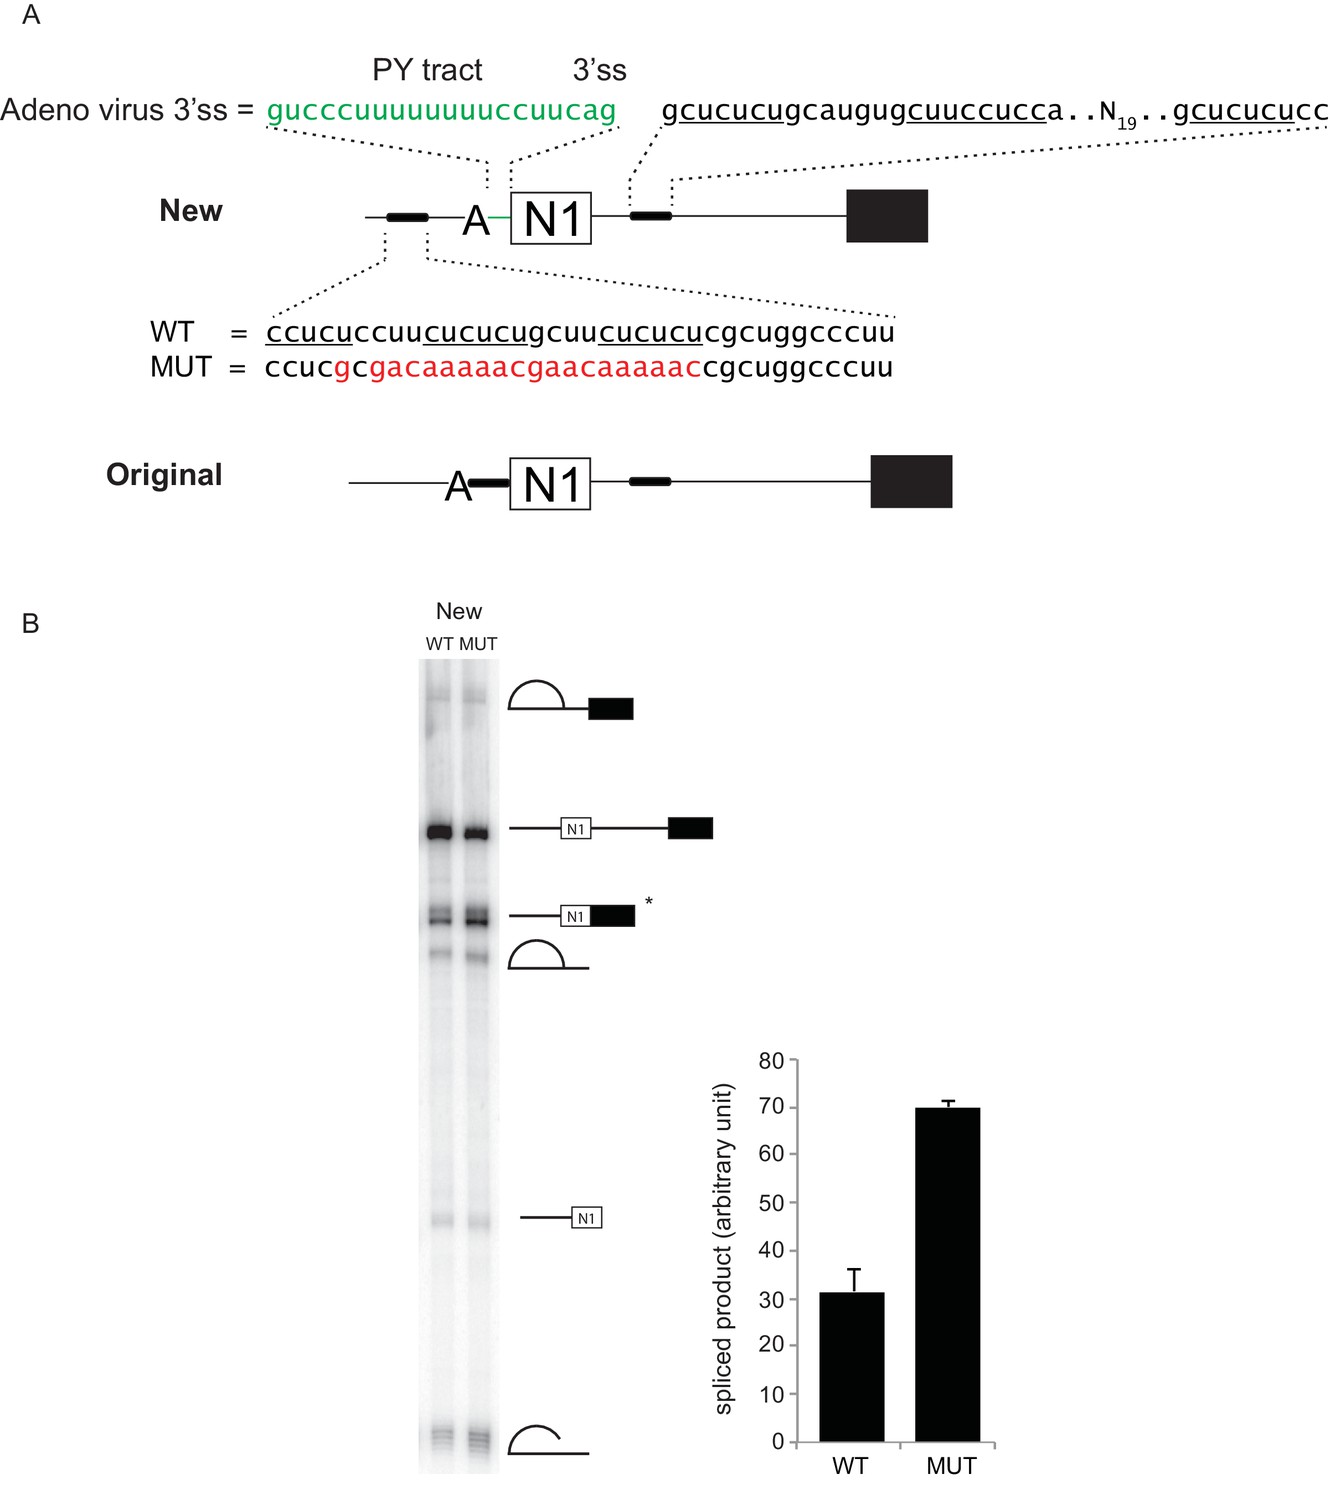
(A) Diagram of new (above) and original (below) Src pre-mRNA substrates containing the N1 exon and a downstream exon 4 (black box). To make the new construct, the upstream PTBP1-binding sites (thick line) were shifted to a site 25-nt upstream of the branch point (A). The polypyrimidine tract (PY tract) and 3’ splice site (3’ss) of the Adenovirus Major Late first intron (green) were added in place of the original 3’ splice site. The same construct carrying a mutation (MUT) in the upstream PTBP1-binding sites was also made (red) (Sharma et al., 2008; Amir-Ahmady et al., 2005). (B) The WT or MUT transcripts were assayed for in vitro splicing in HeLa nuclear extract. Left panel: total RNA extracted from the in vitro splicing reactions was resolved on 8% urea-PAGE, autoradiographed, and the identity of the RNA species indicated. The asterisk (*) marks the spliced exon product. Right panel: quantification of the spliced products from two experiments is plotted.
Figure 2 with 1 supplement
PTBP1 inhibits assembly of the exon definition complex.
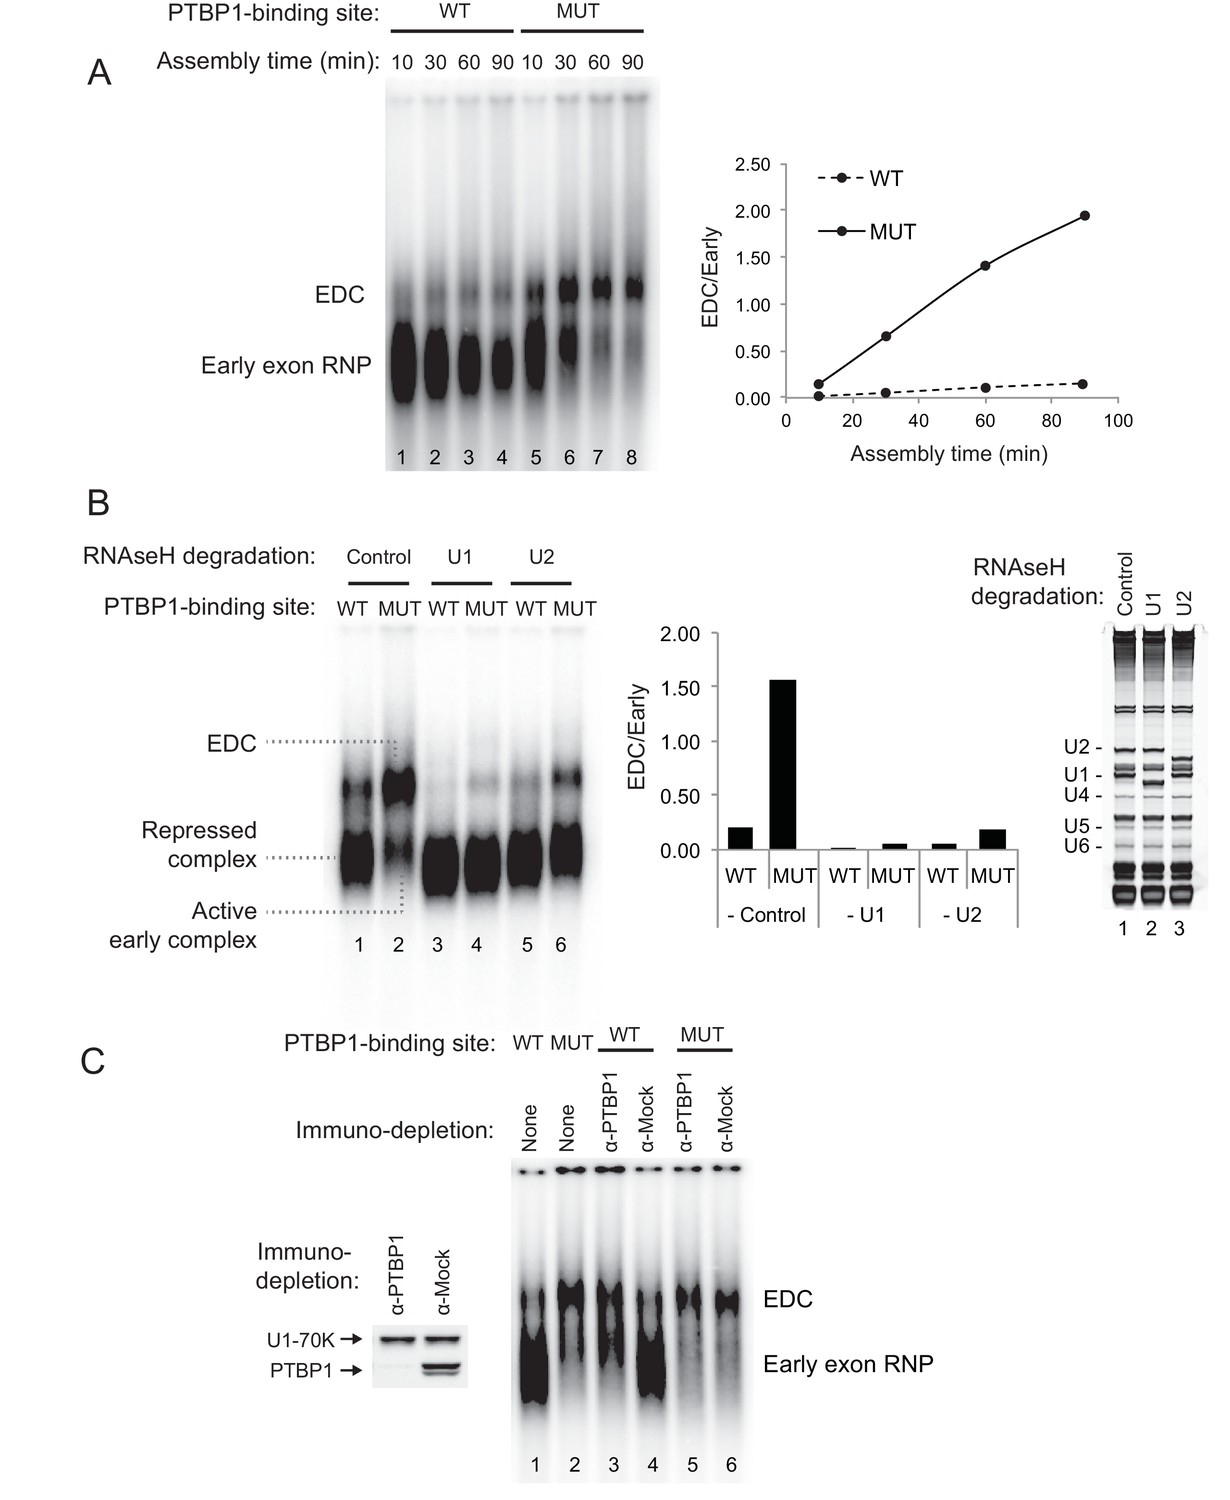
(A) Left panel: Native gel assay of N1 exon RNAs containing WT or MUT PTBP1-binding sites. RNAs were incubated in nuclear extract under splicing conditions for the indicated times to assemble exon RNP complexes. The early exon RNP and the exon definition complex (EDC) are labeled. Right panel: The ratio of the EDC to early exon RNP was plotted over time. (B) The EDC complex is dependent on the U1 and U2 snRNPs. WT and MUT N1 exon RNAs were incubated in nuclear extracts pre-treated with RNAse H and DNA oligos complementary either to the U1 (nt. 1–15), U2 (nt. 1–15) snRNAs or GAPDH mRNA (control). Right panel: SYBR Gold-stained urea-PAGE of total RNA in the extract shows the efficiency of snRNA degradation. Left panel: Native gel assay of the WT and MUT N1 exons assembled in different pre-treated extracts for 30 min. The early exon RNP from WT and MUT RNAs are indicated. Middle panel: the ratio of EDC to early exon RNP was plotted for each reaction to the left. (C) Immuno-depletion of PTBP1 allows EDC assembly. Prior to complex assembly, nuclear extracts were either mock-depleted (α-Mock) or PTBP1-depleted (α-PTBP1). An immunoblot on the left shows efficiency of PTBP1 depletion. U1-70K was used as a loading control. The pre-treated extracts were then used for assembling exon complexes as in (B).
Figure 2—figure supplement 1
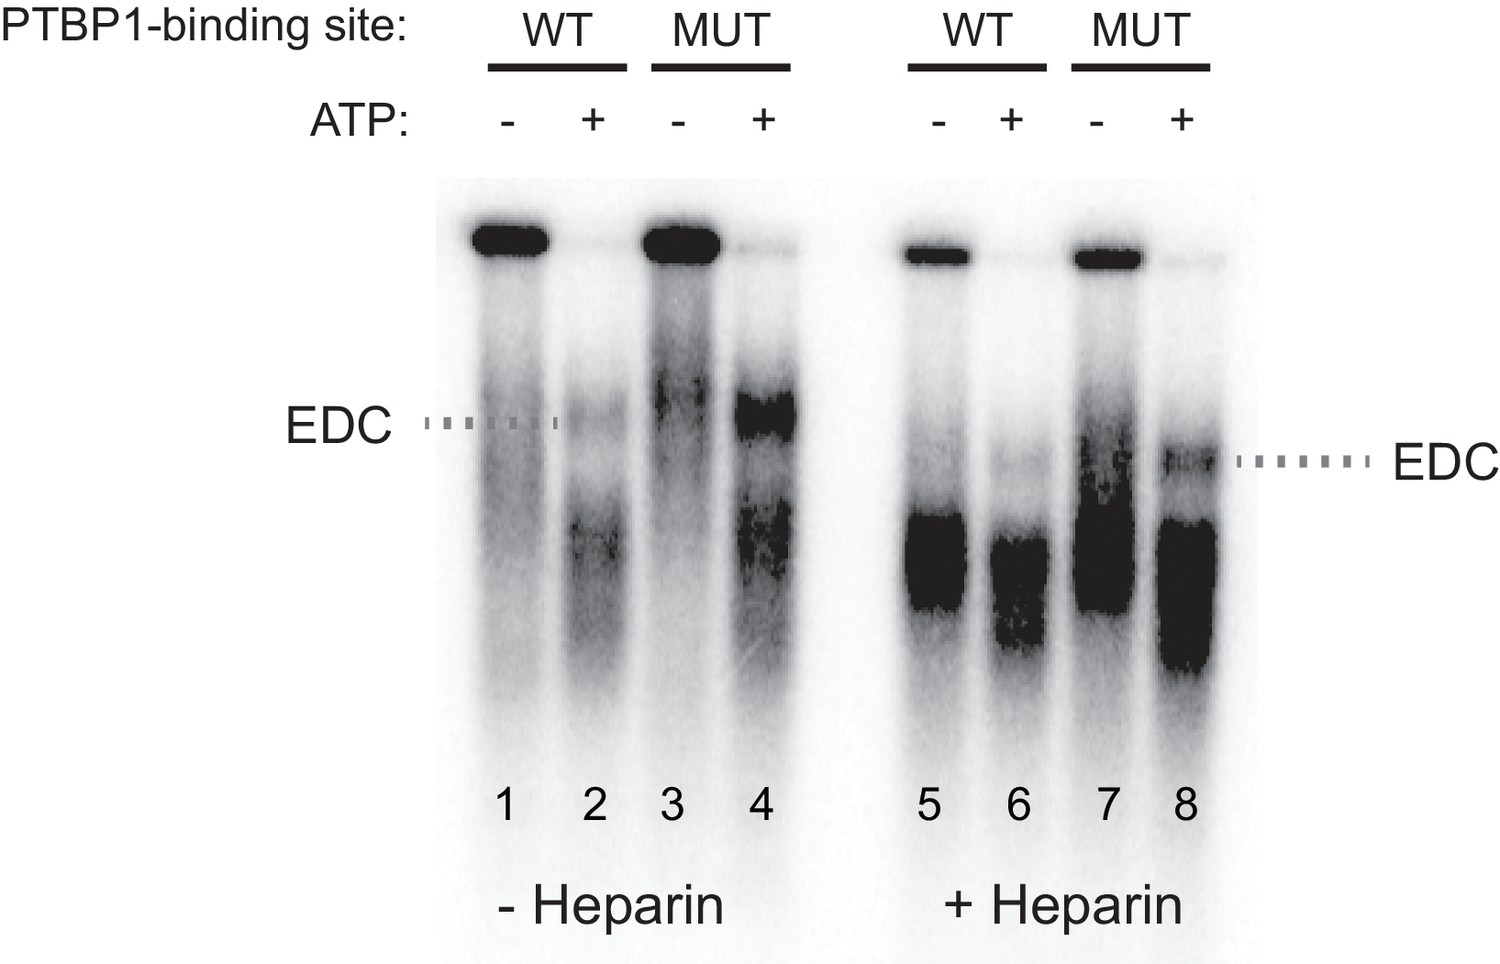
The exon definition complex is ATP-dependent.
Prior to assembling exon complexes, HeLa nuclear extract was incubated at 25°C for 30 min to deplete ATP. WT and MUT N1 exons were then incubated in the extract under standard splicing conditions with or without ATP/creatine phosphate for 50 min. The reactions were treated with or without 0.067 ug/uL heparin at 30°C for 5 min before separation on a native agarose gel and autoradiographed.
Figure 3 with 1 supplement
PTBP1 blocks assembly of the U2 snRNP but not U2AF65 or the U1 snRNP.
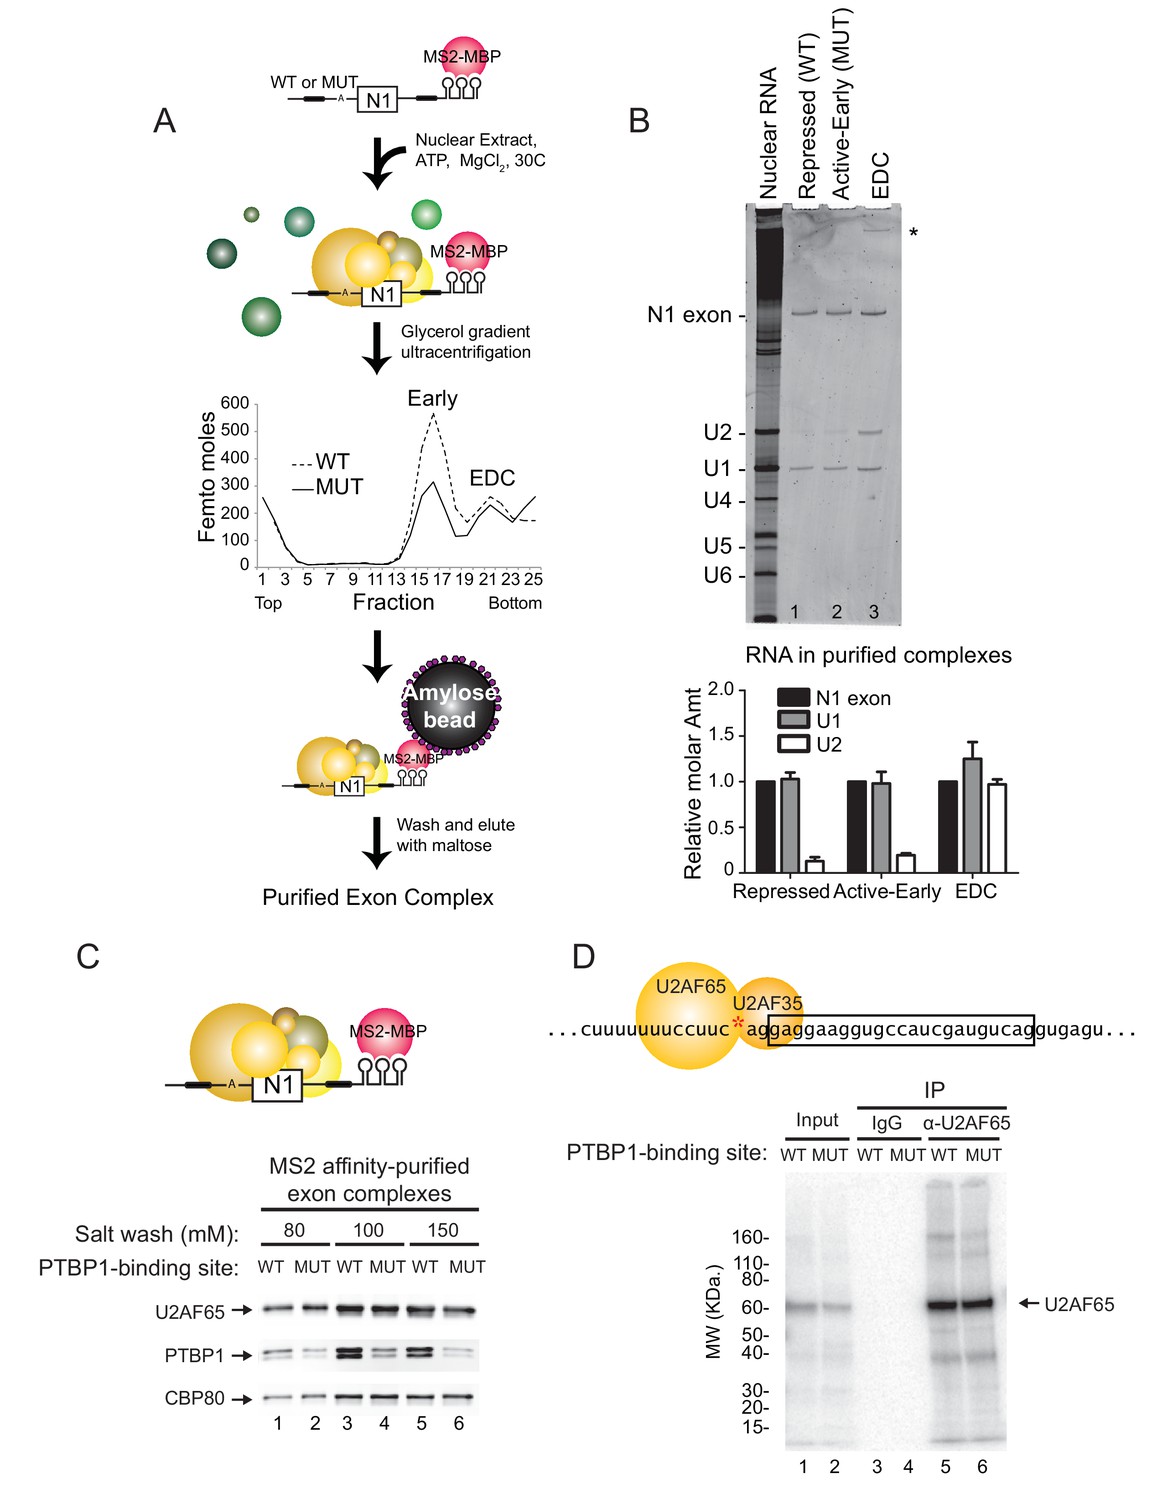
(A) Diagram of exon complex purification. MS2-tagged WT and MUT N1 exons were incubated with the MS2-MBP fusion protein prior to assembling of exon complexes. The reactions were resolved on glycerol density gradients, peak fractions were pooled, and complexes were affinity purified on amylose beads. Note that the MUT RNA also forms larger complexes found at the bottom of the gradient. (B) Top panel: RNA was extracted from exon complexes purified as in (A), resolved on 8% urea-PAGE, and stained with SYBR Gold. Total nuclear RNA is shown to the left with each U snRNA indicated. The asterisk (*) marks uncharacterized band. Bottom panel: Intensities of the N1 exon, U1 and U2 bands normalized by their nucleotide length are plotted relative to the N1 exon for each complex. (C) MS2-tagged WT and MUT N1 exon RNAs were assembled into exon complexes in the absence of ATP to prevent progression to the EDC, purified on amylose beads, washed in increasing concentrations of potassium glutamate (80, 100 or 150 mM) and eluted in maltose. Proteins in each complex were resolved on SDS-PAGE and immunoblotted with antibodies against PTBP1, U2AF65 and CBP80 (loading control). (D) Diagram of the 3’ splice site, labeled at the AG (red asterisk). Labeled WT and MUT RNAs were assembled in splicing reactions for 10 min before irradiation in 254-nm UV to crosslink proteins to the RNAs. Reactions were treated with RNAse T1, denatured in 0.1% w/v SDS at 95°C, immuno-precipitated with α-U2AF65 antibody or mouse IgG (control), resolved on SDS-PAGE, and autoradiographed. The band of crosslinked U2AF65 is indicated.
Figure 3—figure supplement 1
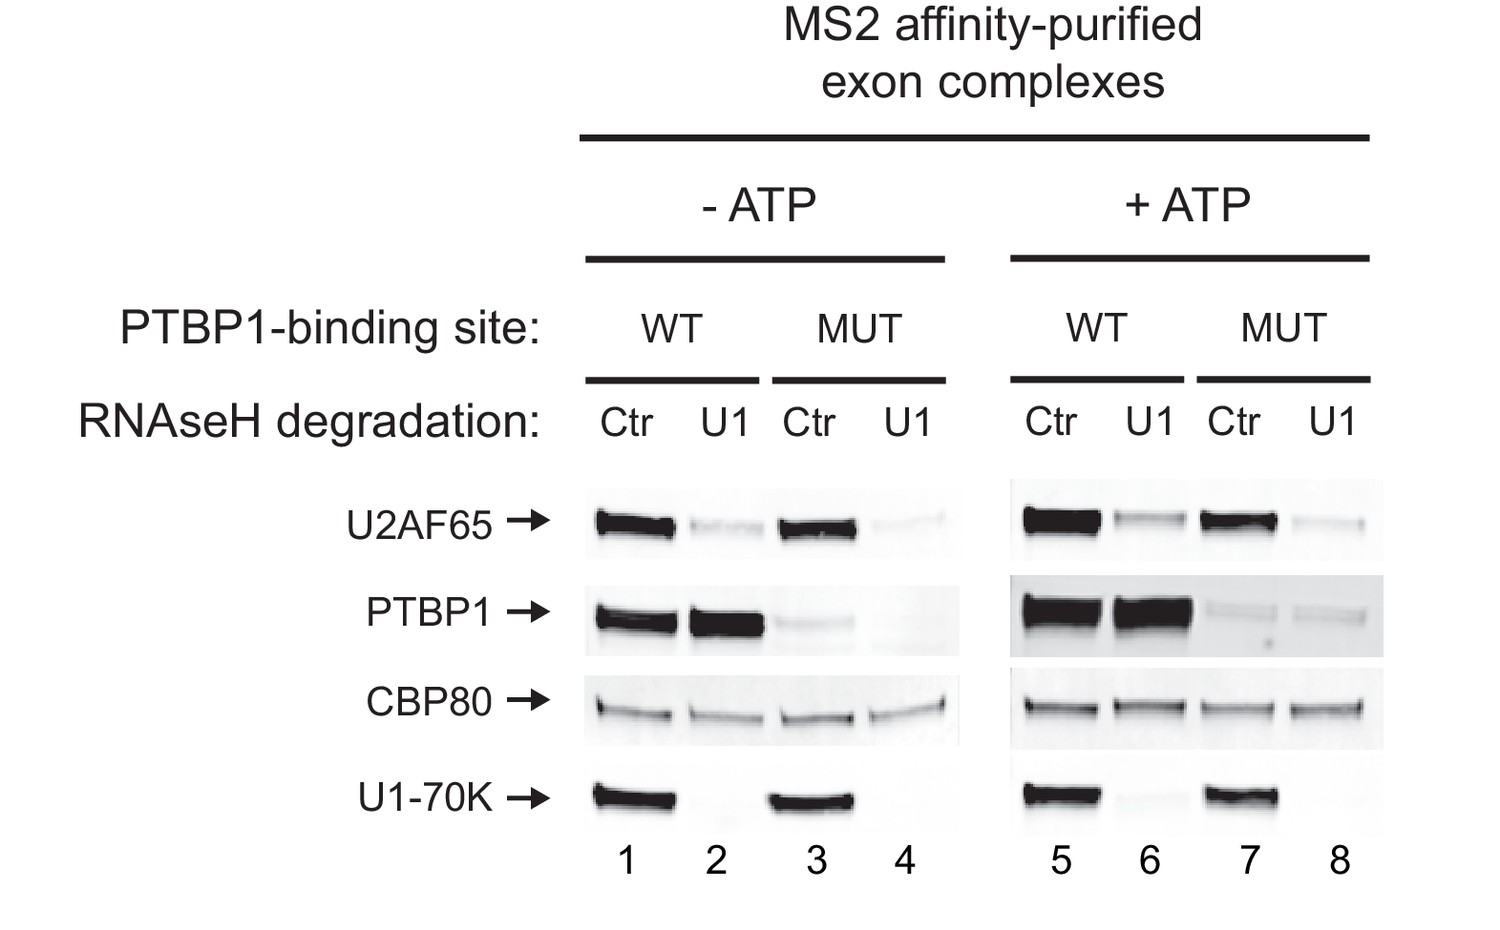
Recruitment of U2AF65 is U1-dependent regardless of the presence of PTBP1.
HeLa nuclear extracts were pre-treated with either anti-U1 or control DNA oligos before incubating with MS2-tagged WT and MUT N1 exon RNAs to assemble exon RNP complexes. ATP was omitted from the reactions in lanes 1-4 to prevent formation of the EDC. The complexes were affinity-purified on amylose beads. Proteins in each complex were resolved on SDS-PAGE and immunoblotted with antibodies against PTBP1, U2AF65, U1-70K and CBP80 (loading control). The same analysis was performed in the presence of ATP with a short 10-minute incubation to reduce EDC formation on the MUT RNA (lanes 5-8). Note that lanes 1-4 and 5-8 were from separate blots.
Figure 4
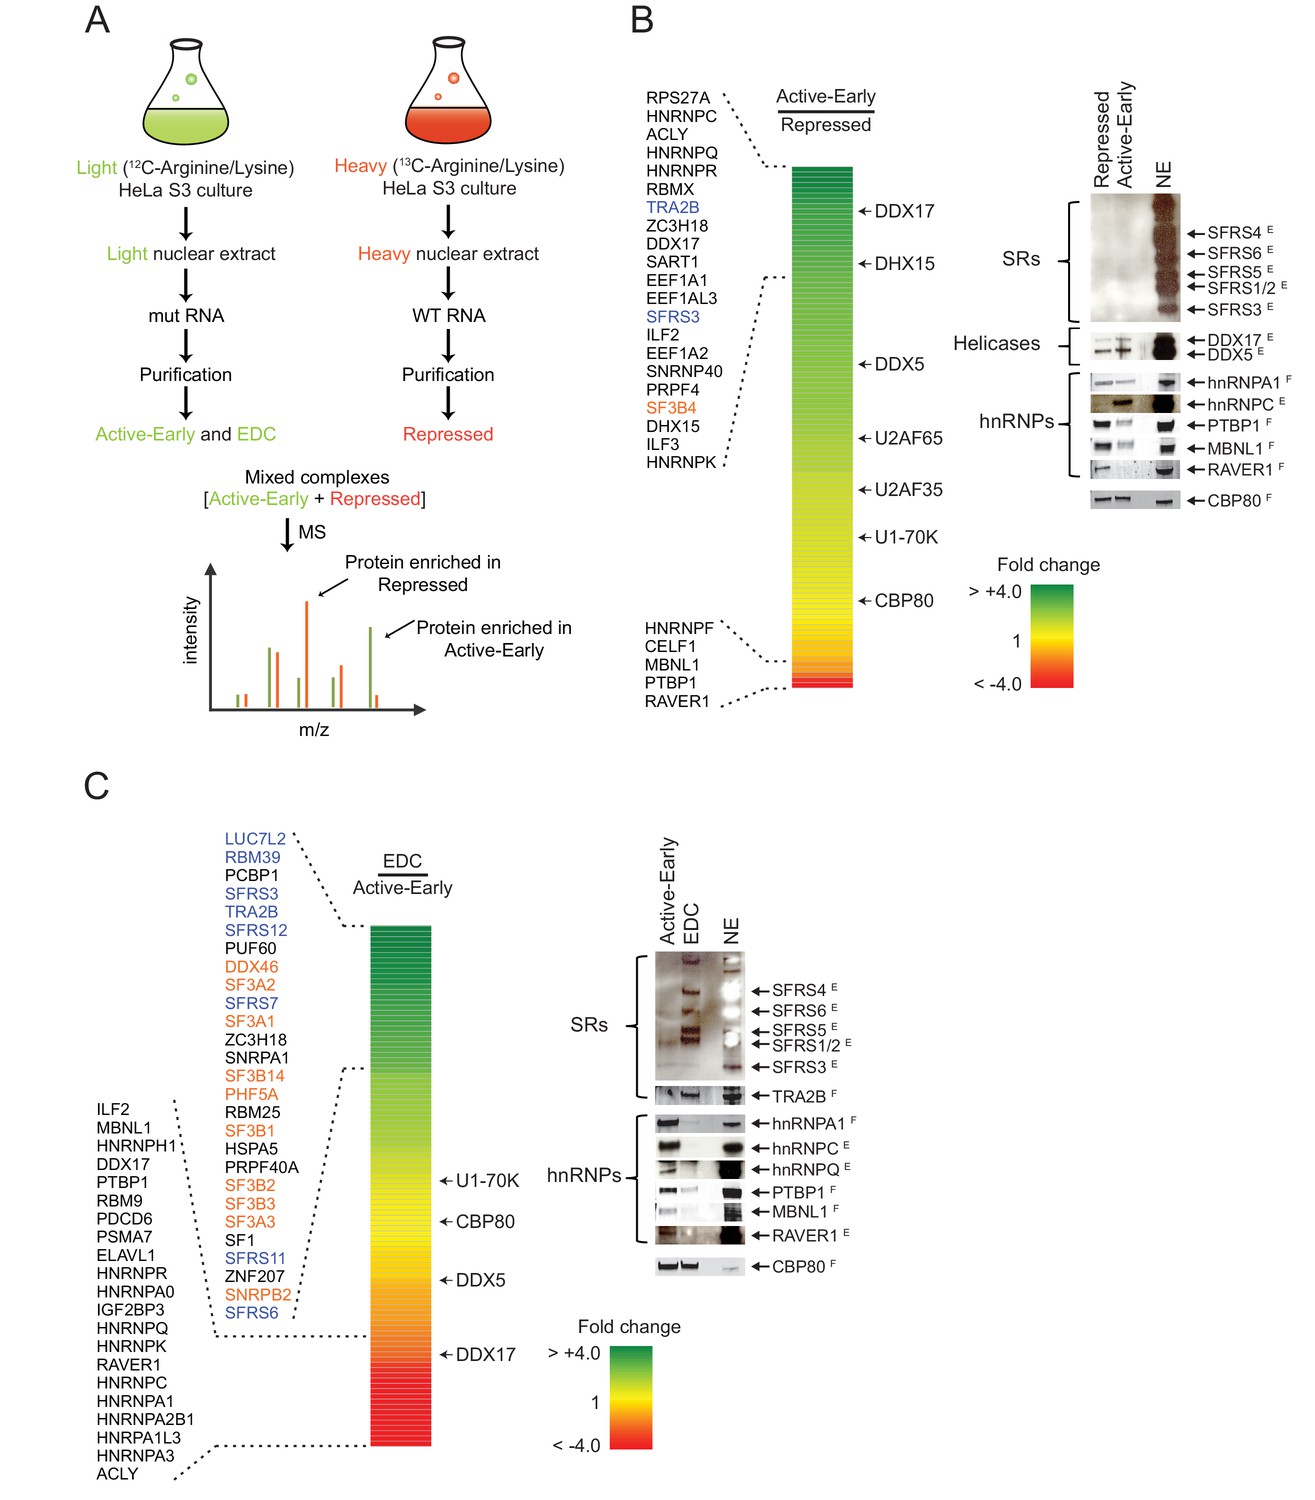
Distal PTBP1 binding causes dramatic compositional changes in exon complexes.
(A) Diagram of the SILAC-MS experiment. MS2-tagged WT and MUT N1 exons were used for assembling exon complexes with heavy (red) and light (green) nuclear extracts, respectively. The heavy repressed and light active early complexes were purified as in Figure 3A, and then mixed in a 1:1 molar ratio and subjected to MS analysis. (B) The relative abundance of proteins in the active early over the repressed complex. Left panel: A heat map showing the fold changes of individual proteins found in both complexes. Fold changes were calculated by dividing a normalized SILAC ratio from the active complex by the SILAC ratio from repressed complex. A color scale for the fold-change scale is shown. Proteins enriched in the active early complex are in green; those enriched in the repressed complex are in red, and proteins equally present in the two complexes are in yellow. Proteins with substantial fold changes are labeled on the left (blue: SR proteins; orange: U2 snRNP proteins). Right panel: Immunoblot of proteins of interest in the repressed and active early complexes. CBP80 was used as a loading control. Superscripted ‘E’ indicates ECL (enhanced chemiluminescence) detection, while ‘F’ indicates fluorescent secondary antibodies. Note that changes in band intensity seen by ECL are less quantitative than for fluorescence. ECL was used to increase the signal for antibodies that were less effective. (C) Relative abundance of proteins in the EDC over the active early complex. Left panel: A heat map showing the fold change of individual proteins found in both complexes. A color scale is below. Proteins are labeled on the left as in (B). Right panel: Immunoblot of proteins of interest in the EDC and active early complexes. NSAF values for all proteins are given in Supplementary file 1.
Figure 5 with 1 supplement

RAVER1 and MBNL1 are required for full N1 exon repression, while DDX5/17 and TRA2B activate N1 exon splicing.
(A) Diagram of the minigene splicing reporter. The WT N1 exon was inserted into the intron between constitutive exons 1 and 2 of human β-globin (black boxes). The reporter was inserted into the Flp recombinase site of Flp-In HeLa cells (Life Technologies). Transcription of the reporter was induced by doxycycline. (B) SiRNA knockdown of splicing factors. The reporter cell line was transfected with the indicated siRNAs 48 hr before inducing reporter expression with doxycycline. Top panel: Total cellular RNA was harvested and assayed for reporter splicing by primer extension. Primer extension products were resolved on 4% urea-PAGE and autoradiographed. The exon-included and exon-skipped products are indicated, with the percent exon inclusion plotted below. Bottom panel: Averages of three experiments were plotted with standard deviations. p-values were calculated by comparing each knockdown to the control using a two-tail t-test. * = p<0.05; ** = p<0.01; **** = p<0.0001. (C) Immunoblots showing the efficiency of siRNA knockdown. Primer extension assays for siRNA set 2 is in Figure 5—figure supplement 1. GAPDH or β-actin served as loading controls. The superscripted ‘F’ indicates fluorescent secondary antibodies used for detection.
Figure 5—figure supplement 1
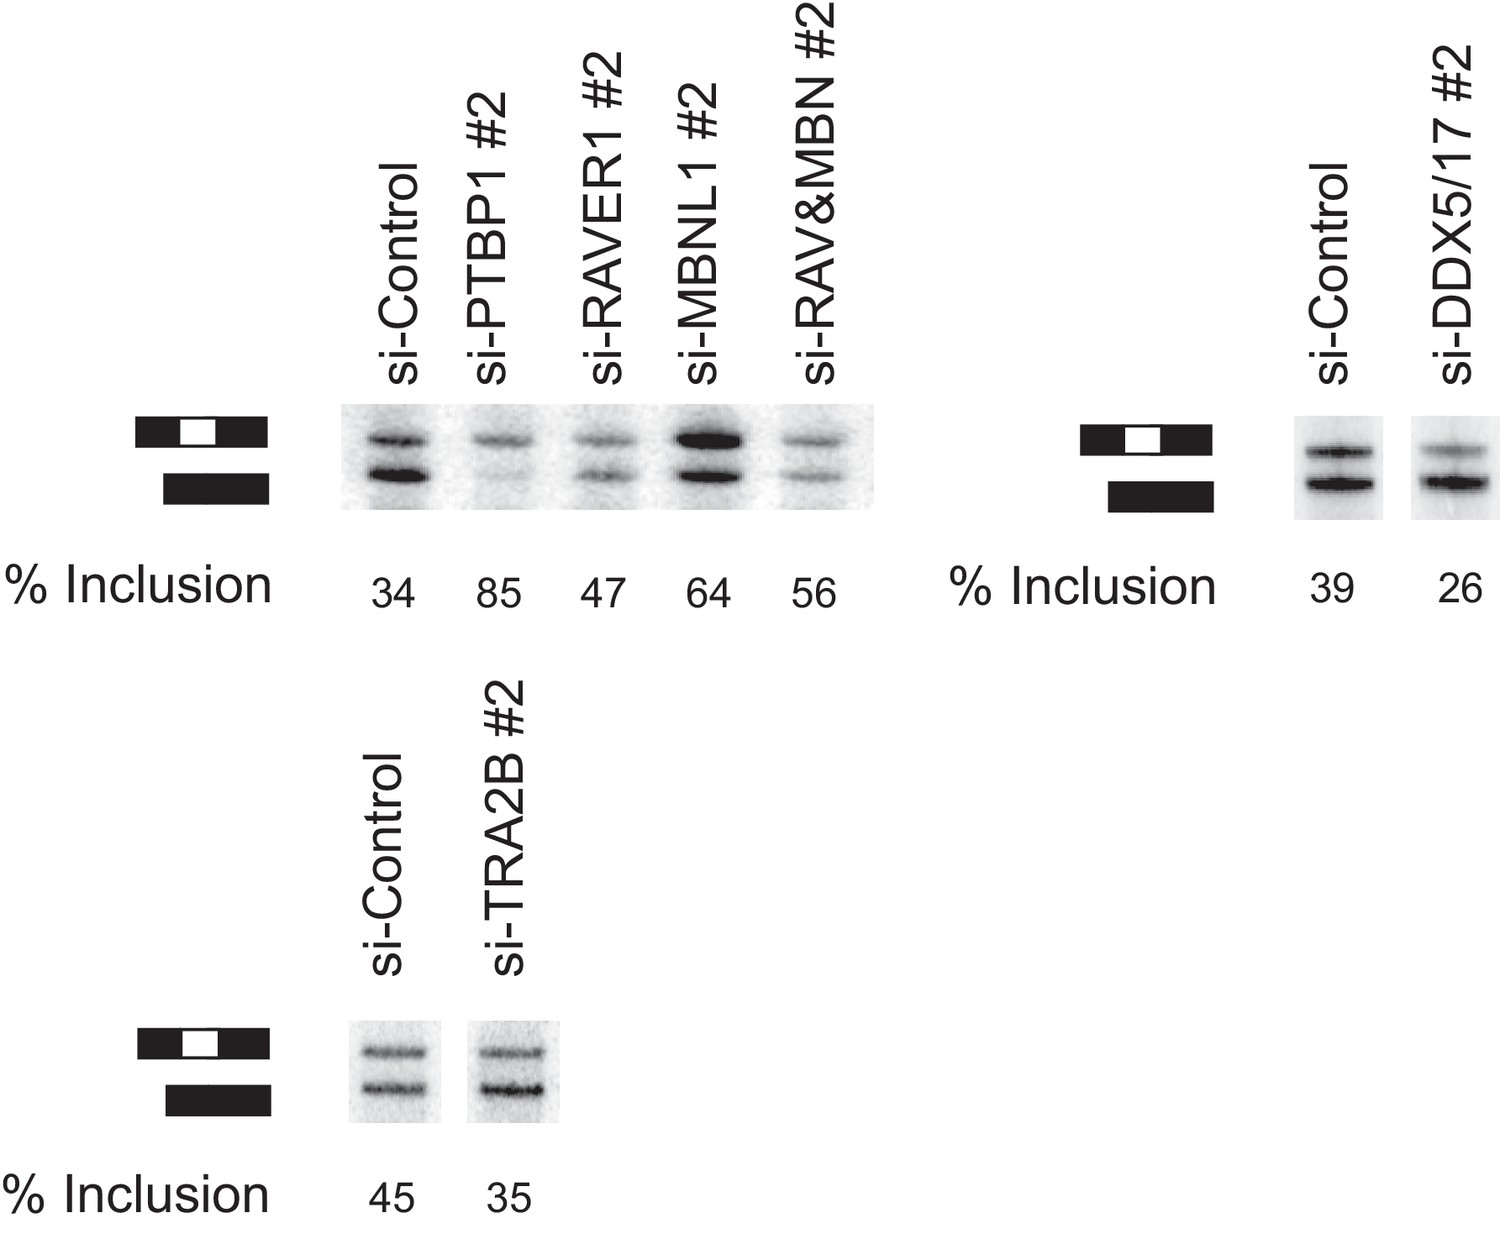
A second set of siRNAs affects splicing similarly to the first set.
HeLa cells containing the N1 splicing reporter minigene were transfected with siRNAs 48 hr before inducing reporter expression with doxycycline. Eight hours after induction, total RNA was harvested and assayed by primer extension as in Figure 5. The exon included and exon skipped products are indicated, with measured percent exon inclusion.
Figure 6
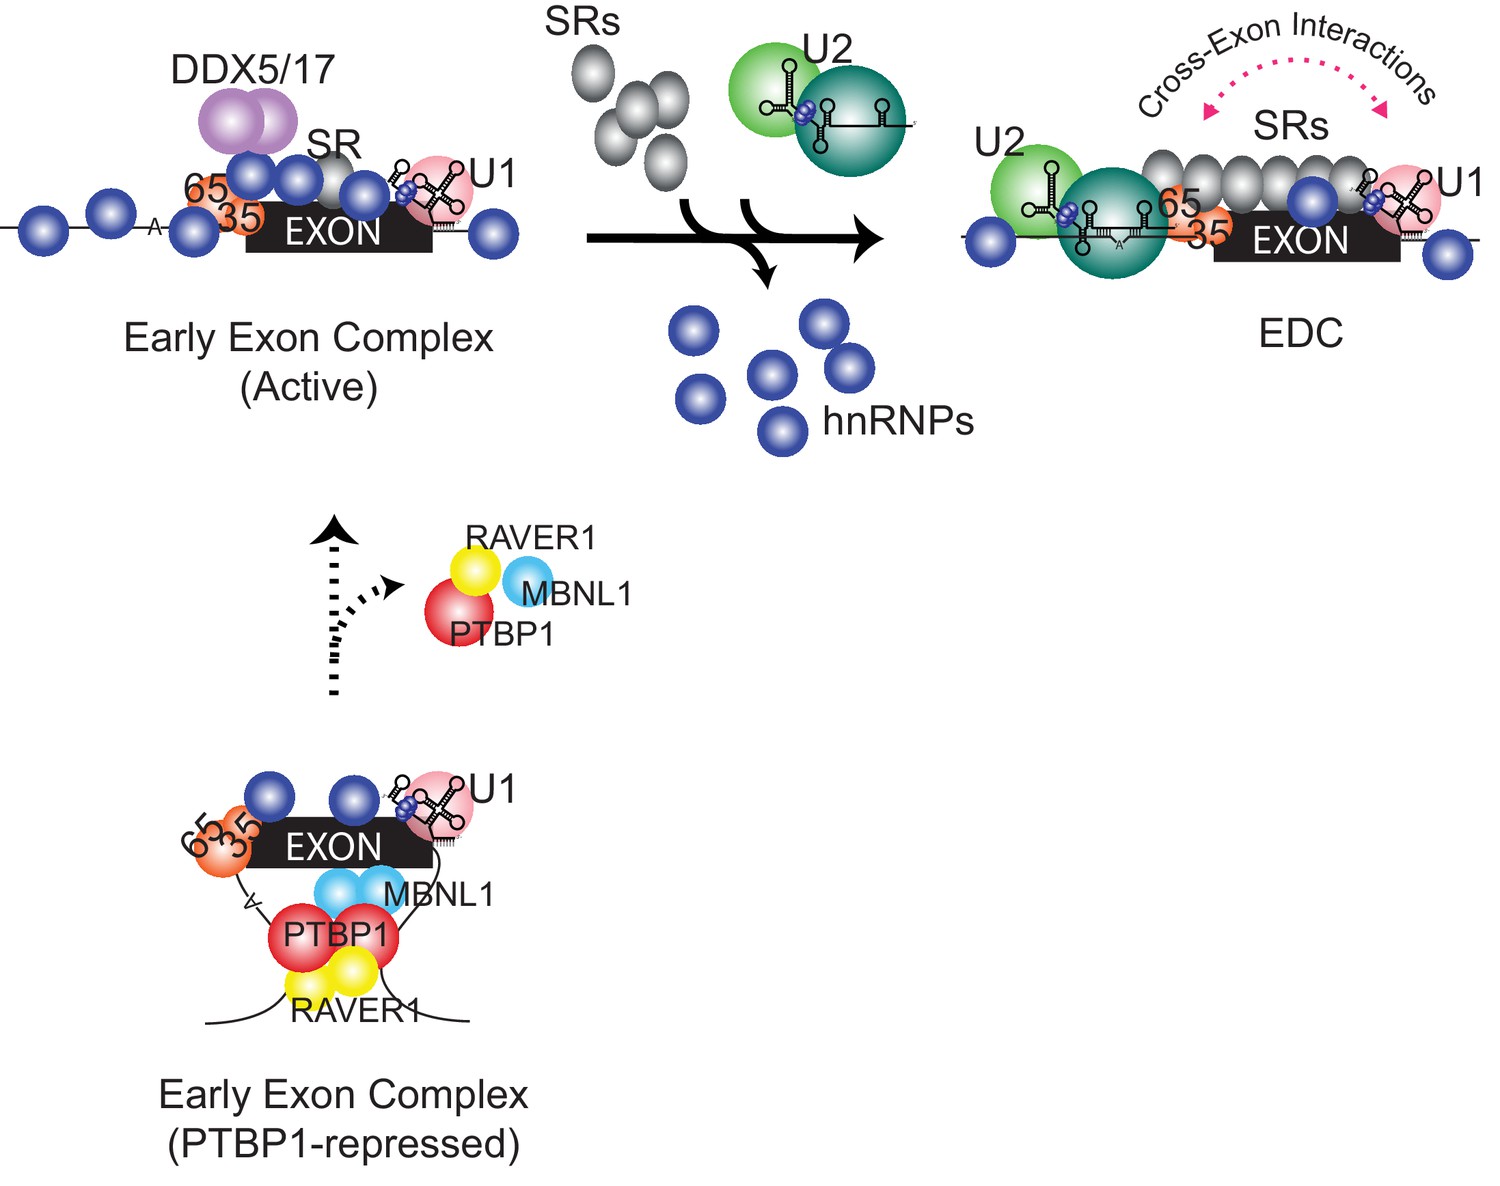
Compositional remodeling of a PTBP1-regulated exon RNP.
The unrepressed exon is bound by abundant RNA-binding proteins including U2AF, the U1 snRNP, hnRNPs, and other factors to form the active early exon complex. This complex progresses to an exon definition complex with the loss of hnRNP proteins, the recruitment of SR proteins, and the assembly of the U2 snRNP at the branch point. The ATP-dependent RNA helicases DDX5 and DDX17 associate with the early exon complex and may contribute to the protein rearrangements. In the presence of PTBP1 (below) the exon is sequestered in a repressed state that still allows U2AF and U1 snRNP assembly but not the association of many early factors including hnRNPs, RNA helicases, and early bound SR proteins. This repressed exon complex cannot progress to the EDC.
Additional files
-
Supplementary file 1
(a) Proteins present in the PTBP1-repressed (WT), the active (MUT) and the EDC complexes in SILAC experiment 1. (b) Proteins present in the PTBP1-repressed, the active-early and the EDC complexes in SILAC experiment 2. (c) Comparison of protein enrichments seen in SILAC experiment 1 and SILAC experiment 2. (d) NSAF scores of proteins identified in SILAC experiment 1. (e) NSAF scores of proteins from SILAC experiment 2. (f) Positions of PTBP1 crosslinking sites on validated PTBP1-repressed exons.
- https://doi.org/10.7554/eLife.19743.012
Download links
A two-part list of links to download the article, or parts of the article, in various formats.
Downloads (link to download the article as PDF)
Open citations (links to open the citations from this article in various online reference manager services)
Cite this article (links to download the citations from this article in formats compatible with various reference manager tools)
Large-scale remodeling of a repressed exon ribonucleoprotein to an exon definition complex active for splicing
eLife 5:e19743.
https://doi.org/10.7554/eLife.19743


