Adult-born neurons modify excitatory synaptic transmission to existing neurons
- University of Alabama at Birmingham, United States
Figures
Figure 1 with 2 supplements

Increasing neurogenesis reduces EPSCs in mature GCs.
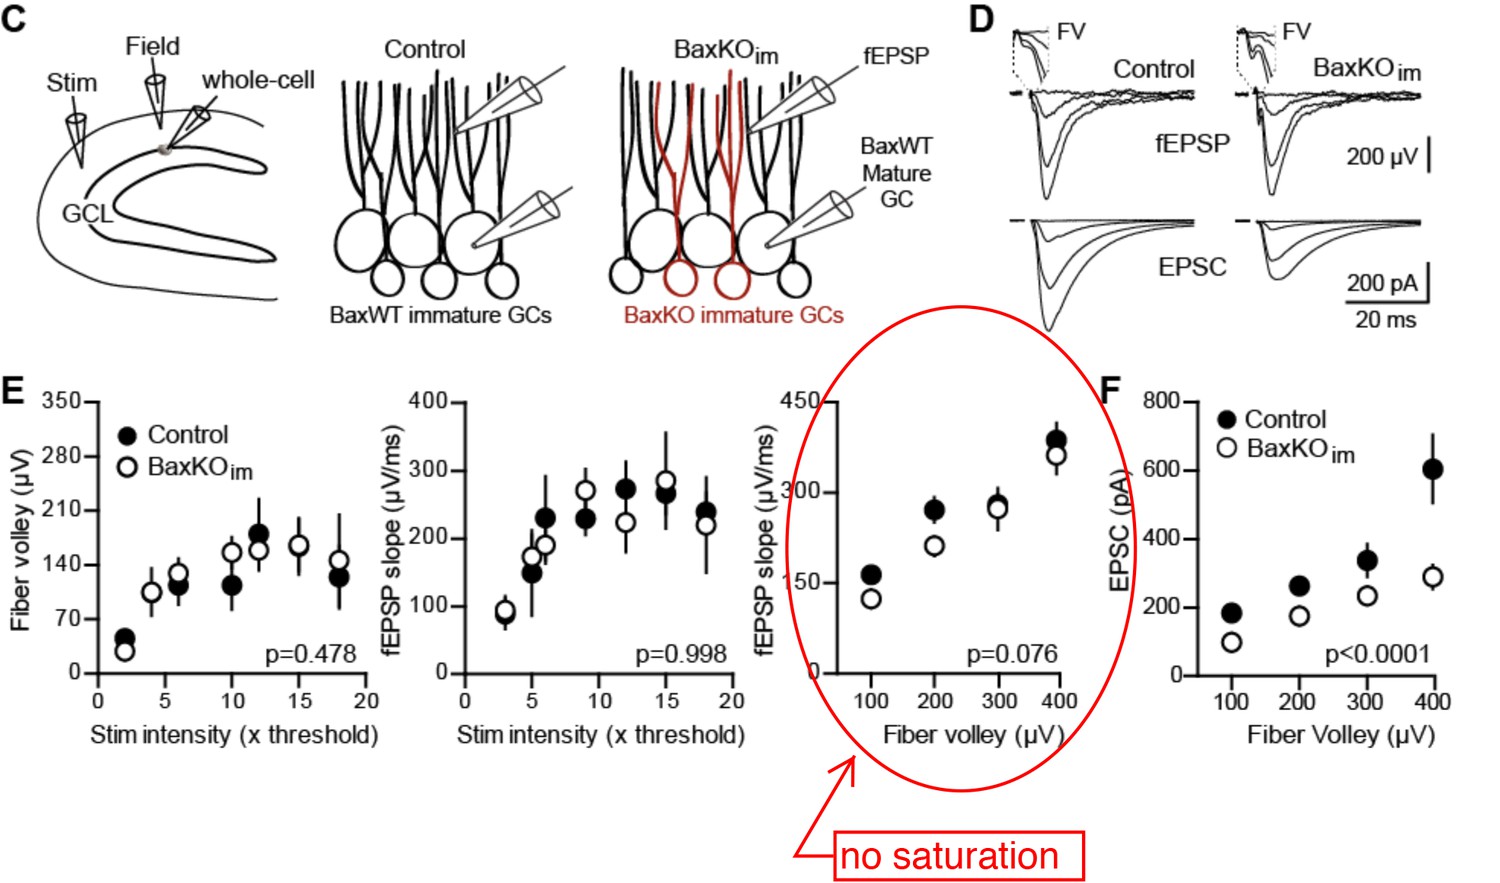
(A) The experimental timeline showing recording 4–6 weeks after tamoxifen (TMX)-induced Bax deletion in Nestin-expressing progenitors. (B) Confocal images of newborn neurons expressing eGFP in fixed sections (50 μm) from control and BaxKOim mice. (C) Stereological cell counts of eGFP+ newborn cells revealed neurogenesis was enhanced by 41% (control 16,881 ± 1422 cells, n = 4; BaxKOim 23,756 ± 2166 cells, n = 4; unpaired t-test p=0.038). (D) Schematic showing experimental paradigm, with simultaneous fEPSPs and whole-cell recordings of EPSCs from mature GCs. All experiments were performed in the presence of picrotoxin to block GABAA receptor-mediated currents. (E) Examples of fEPSPs (top) with the fiber volley (FV, top inserts) and EPSCs (bottom) in slices from control and BaxKOim mice. Synaptic responses were evoked by increasing intensity stimulation by a patch pipette placed in the middle molecular layer. fEPSPs and EPSCs were binned by FV amplitude. Stimulus artifacts are blanked for clarity. (F) The fEPSP versus FV plot illustrates the effectiveness of FV normalization, with fEPSP increasing linearly with axonal recruitment. There was no difference in fEPSPs in slices from BaxKOim and control mice (two-way ANOVA, 0.076). FVs are binned by 100 μV and each symbol denotes the mean and SEM of 10–38 responses from 15 control and 14 BaxKOim slices (with four responses in the largest 300–400 μV FV control bin). (G) Left, a decrease in synaptic strength to mature GCs was revealed by the EPSC plotted against FV amplitude (two-way ANOVA, Fgenotype (1,167)=54.41 p<0.0001; p<0.05 for all bins with Bonferroni post-tests). Right, the overall EPSC/FV ratio was reduced in BaxKOim slices (unpaired t-test, n = 86, 95).
Figure 1—figure supplement 1
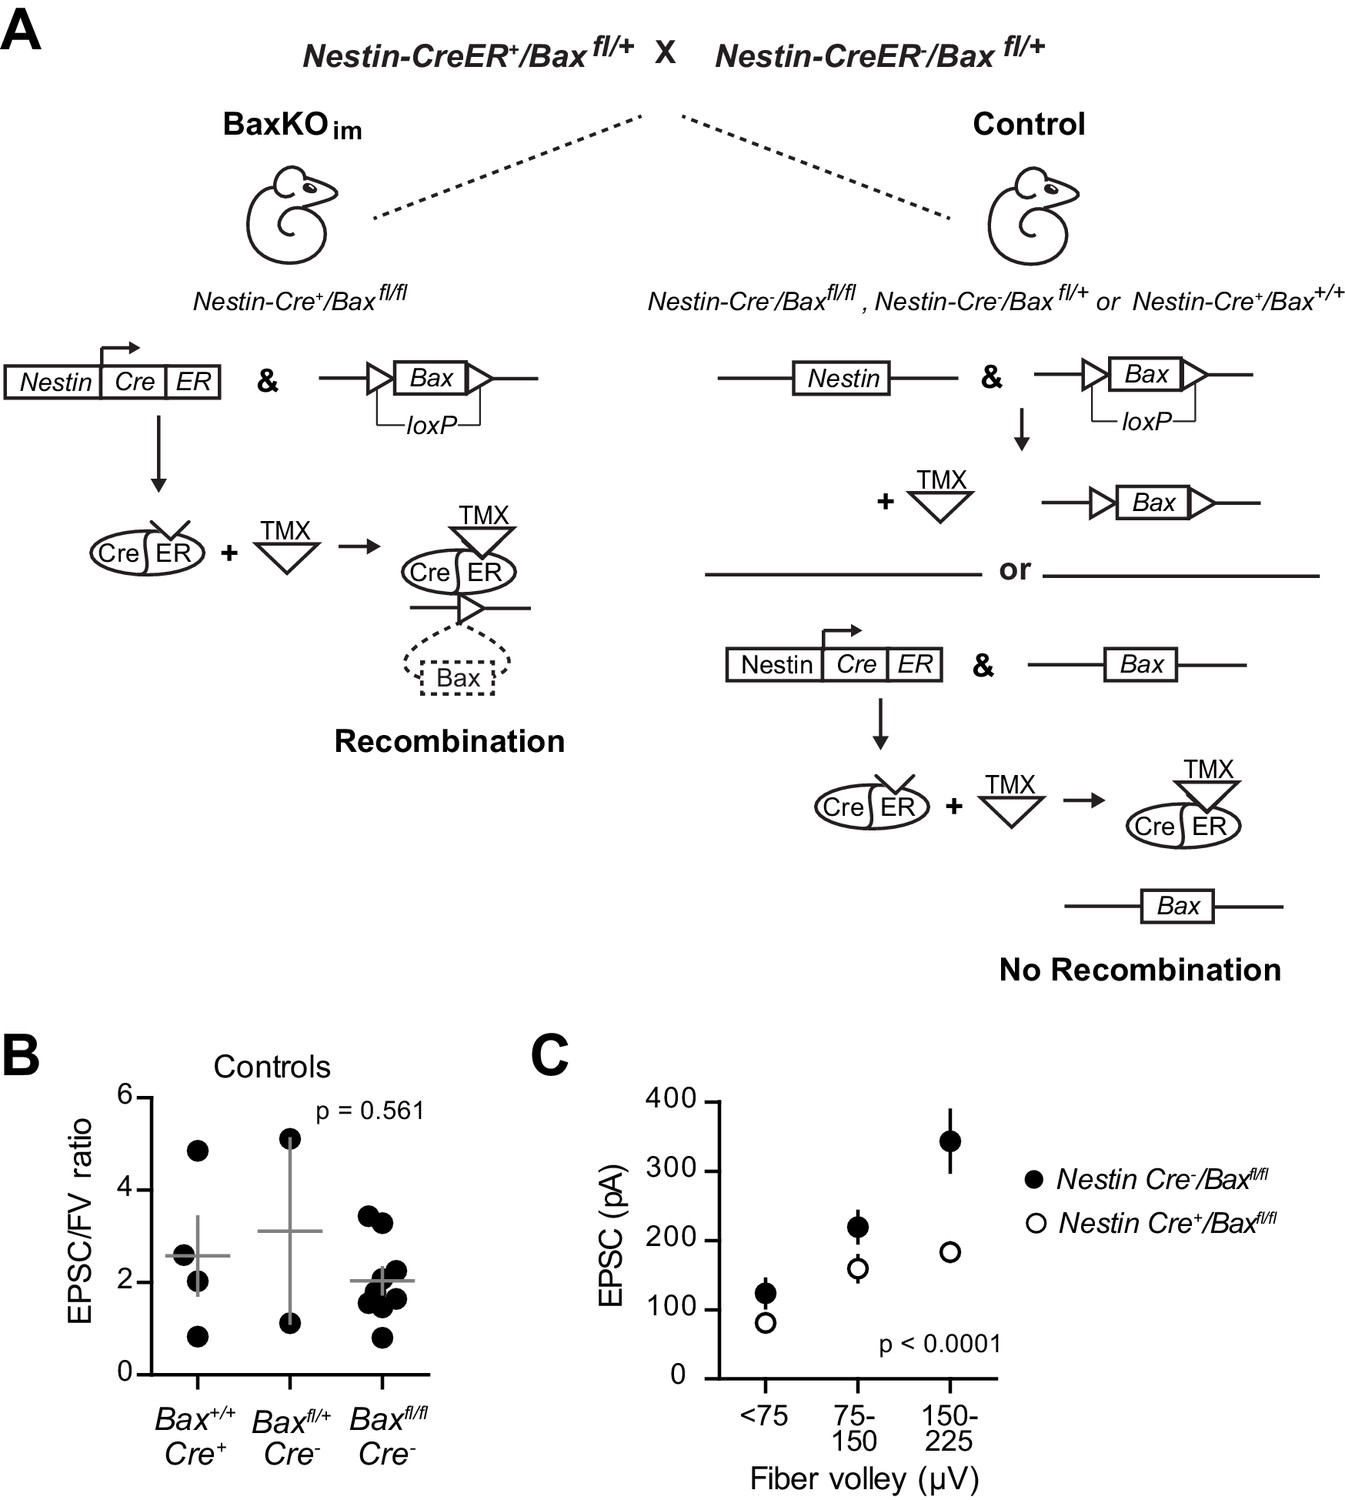
Generation of BaxKOimmature mice.
(A) Schematic illustrating tamoxifen (TMX)-induced excision of the lox-p flanked Bax locus to generate BaxKOimmature mice (BaxKOim). Control mice included Nestin-Cre-/Baxfl/fl , Nestin-Cre-/Baxfl/+ and Nestin-Cre+/Bax+/+ mice that all received TMX. (B) There was no difference in the averaged EPSC/FV ratio between different control genotypes (n = 4, 2, nine experiments; one-way ANOVA, Fgenotype (2,12)=0.61, p=0.561). (C) The EPSC amplitude in mature GCs from Nestin-Cre-/Baxfl/fl control mice was significantly greater than Nestin-Cre+/Baxfl/fl mice, confirming that differences in EPSCs persist comparing only Bax fl/fl genotypes (two-way ANOVA, Fgenotype (1,106)=27.42, p<0.0001, n = 11–26 responses from 9 controls and 14 BaxKOim slices).
Figure 1—figure supplement 2
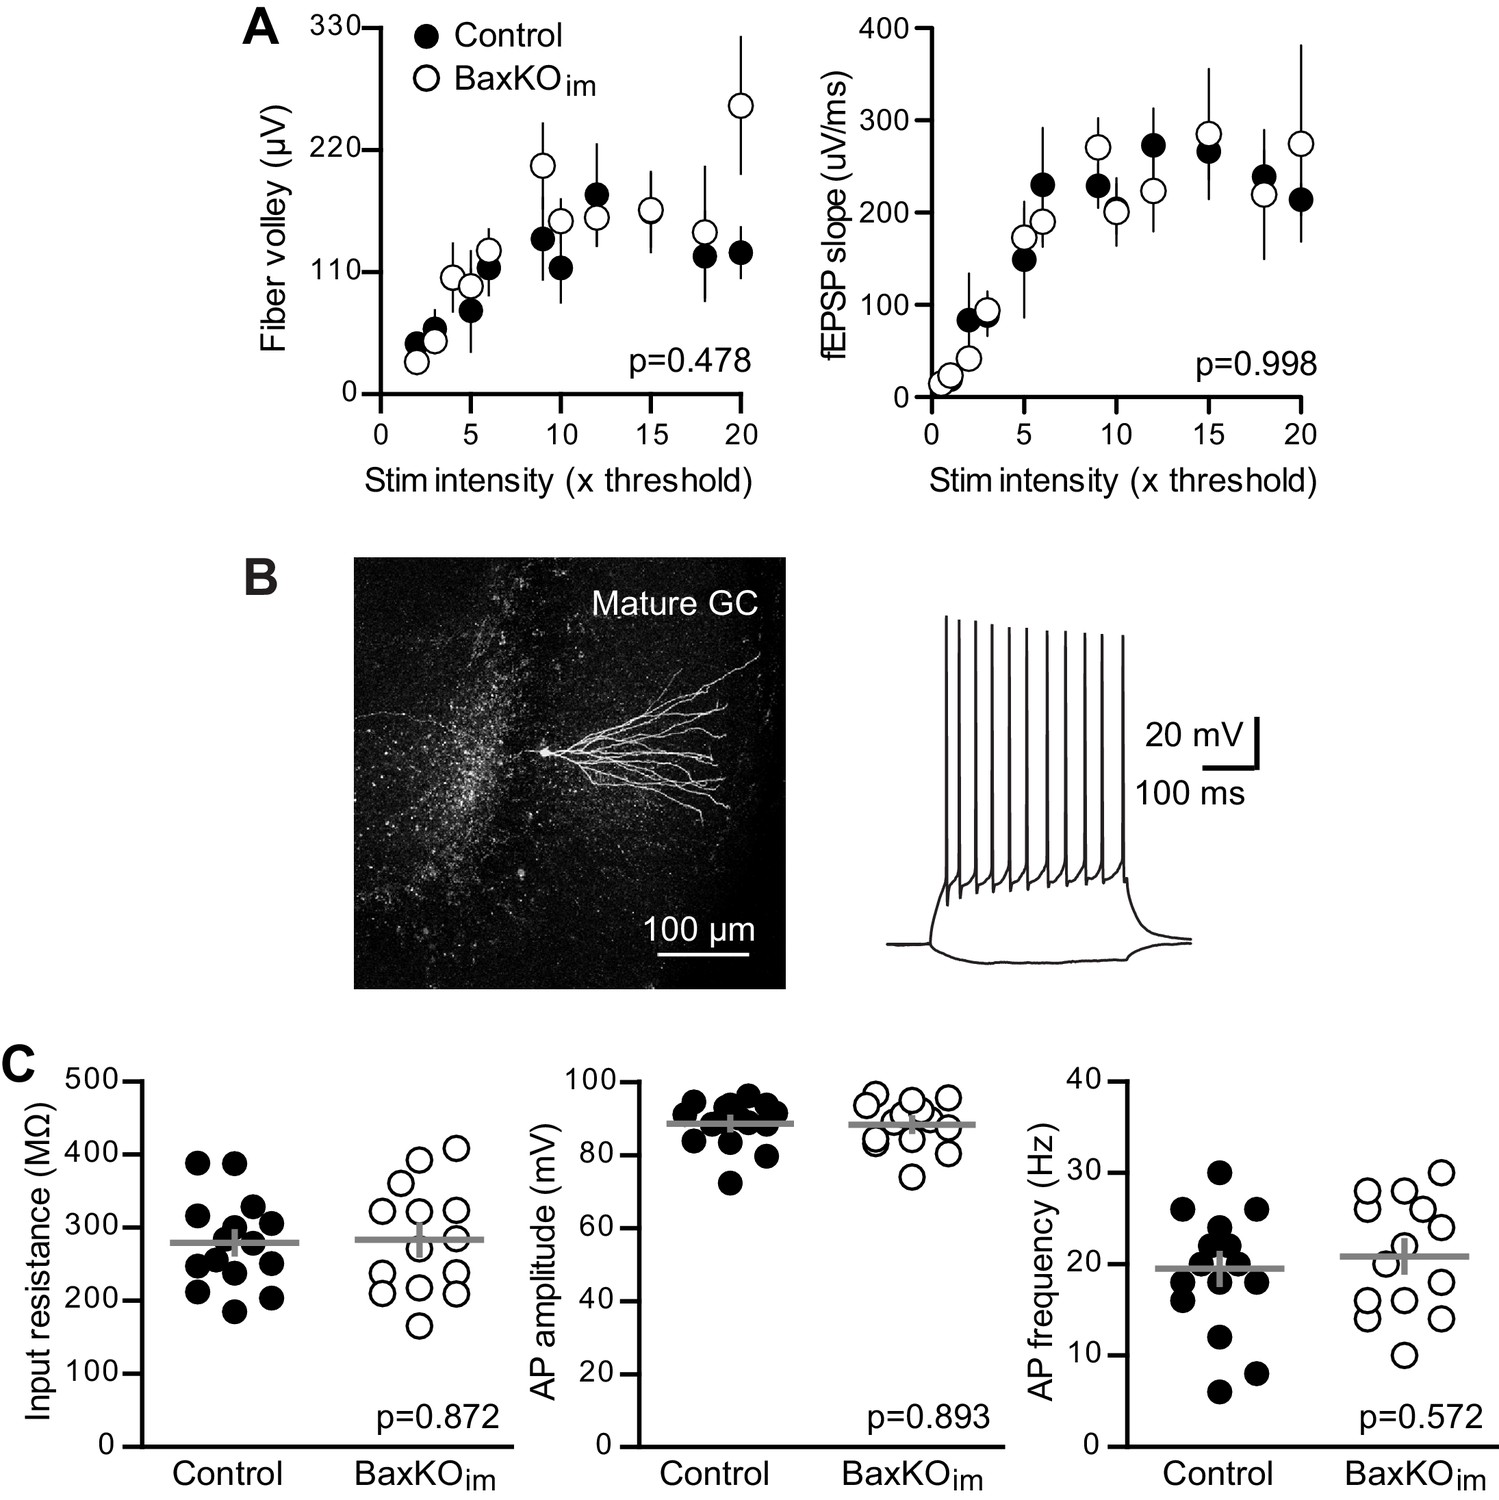
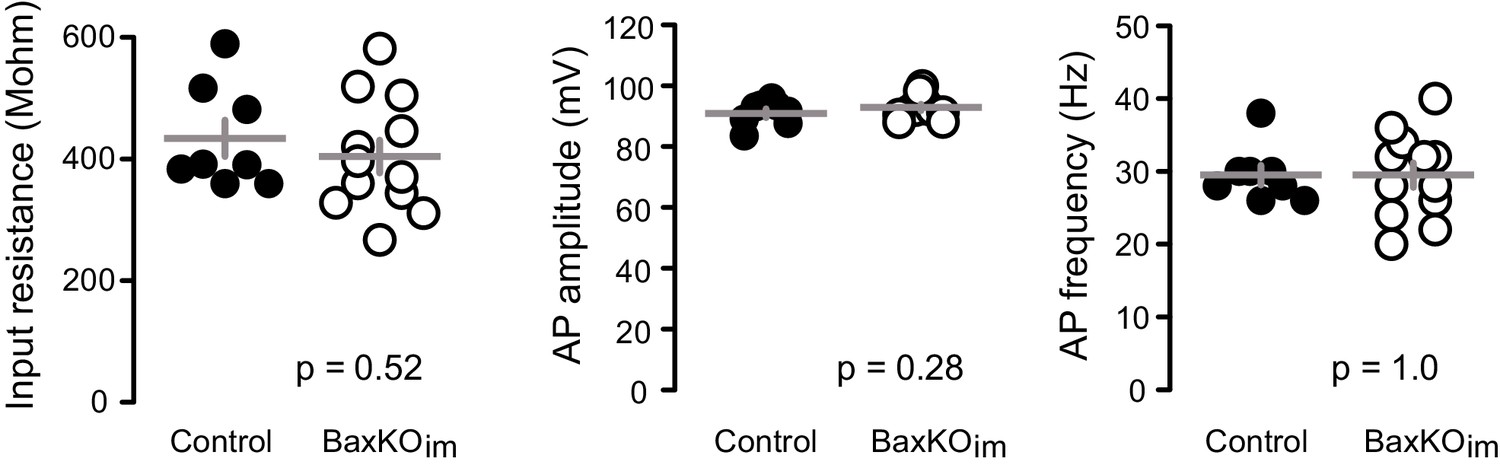
No change in fEPSPs or mature GC intrinsic excitability in BaxKOim mice.
(A) There was no difference in FVs or fEPSPs between BaxKOim and control mice (2-way ANOVA, p=0.478 or 0.998). Note that individual responses that exhibit saturation drop out of the analysis, such that there are fewer values at high stimulus intensities (see Materials and methods). Each symbol represents 3–14 responses. (B) An example of a mature GC targeted for whole cell recordings that was reconstructed after recording. The intrinsic properties of GCs were tested using step current injections in current clamp prior to voltage clamp experiments. (C) Mature unlabeled GCs in BaxKOim mice had similar intrinsic properties as in control mice, including input resistance, action potential amplitude and action potential frequency, measured at 100 pA current injections (unpaired t-tests, p=0.872, 0.893 and 0.572 respectively, n = 15 controls and 14 BaxKOim).
Figure 2
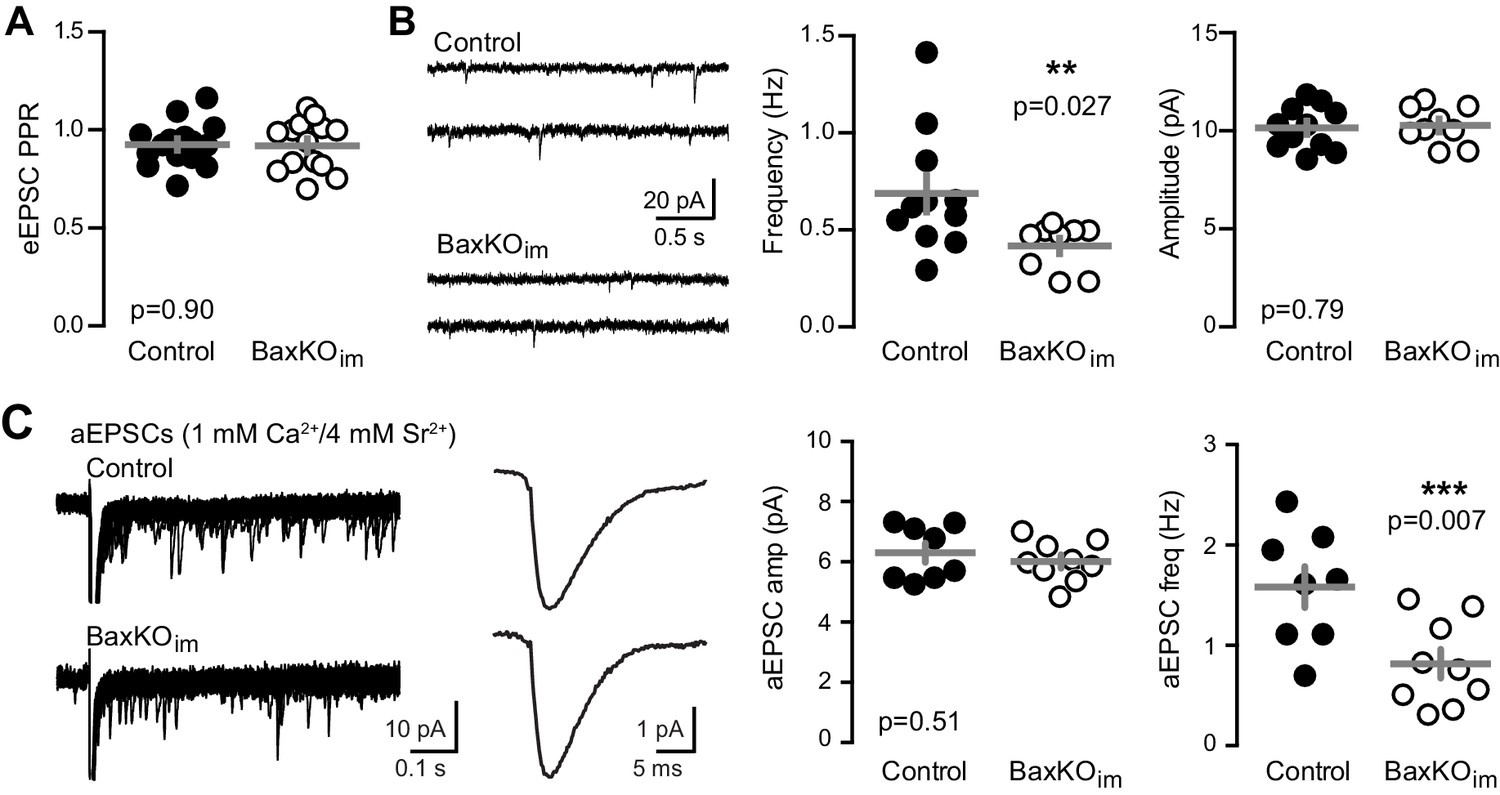
Fewer functional synapses on mature GCs in BaxKOim mice.
(A) The paired-pulse ratio of evoked EPSCs (100 ms ISI) was similar in BaxKOim and control mature GCs (unpaired t-test p=0.90; n = 15 controls,14 BaxKOim). (B) Spontaneous EPSCs in mature GCs from BaxKOim mice had lower frequency and similar amplitudes as sEPSCs in mature GCs from control mice (unpaired t-test p=0.027 and 0.79, respectively; n = 11 controls, 9 BaxKOim). (C) Asynchronous EPSCs were generated by desynchronizing synaptic release with 1 mM Ca2+ and 4 mM Sr2+. Uniquantal aEPSCs were detected following the synchronous EPSC. Left, 40 traces overlaid with examples of averaged aEPSCs. Middle, there was no difference in the average amplitude across genotypes but a reduction in the frequency of aEPSCs (1743 events in 8 GCs from controls, 1015 events in 9 GCs from BaxKOim; unpaired t-test p=0.51 and 0.007 respectively). There was no difference in the average rise time or decay of aEPSCs (not shown).
Figure 3 with 1 supplement
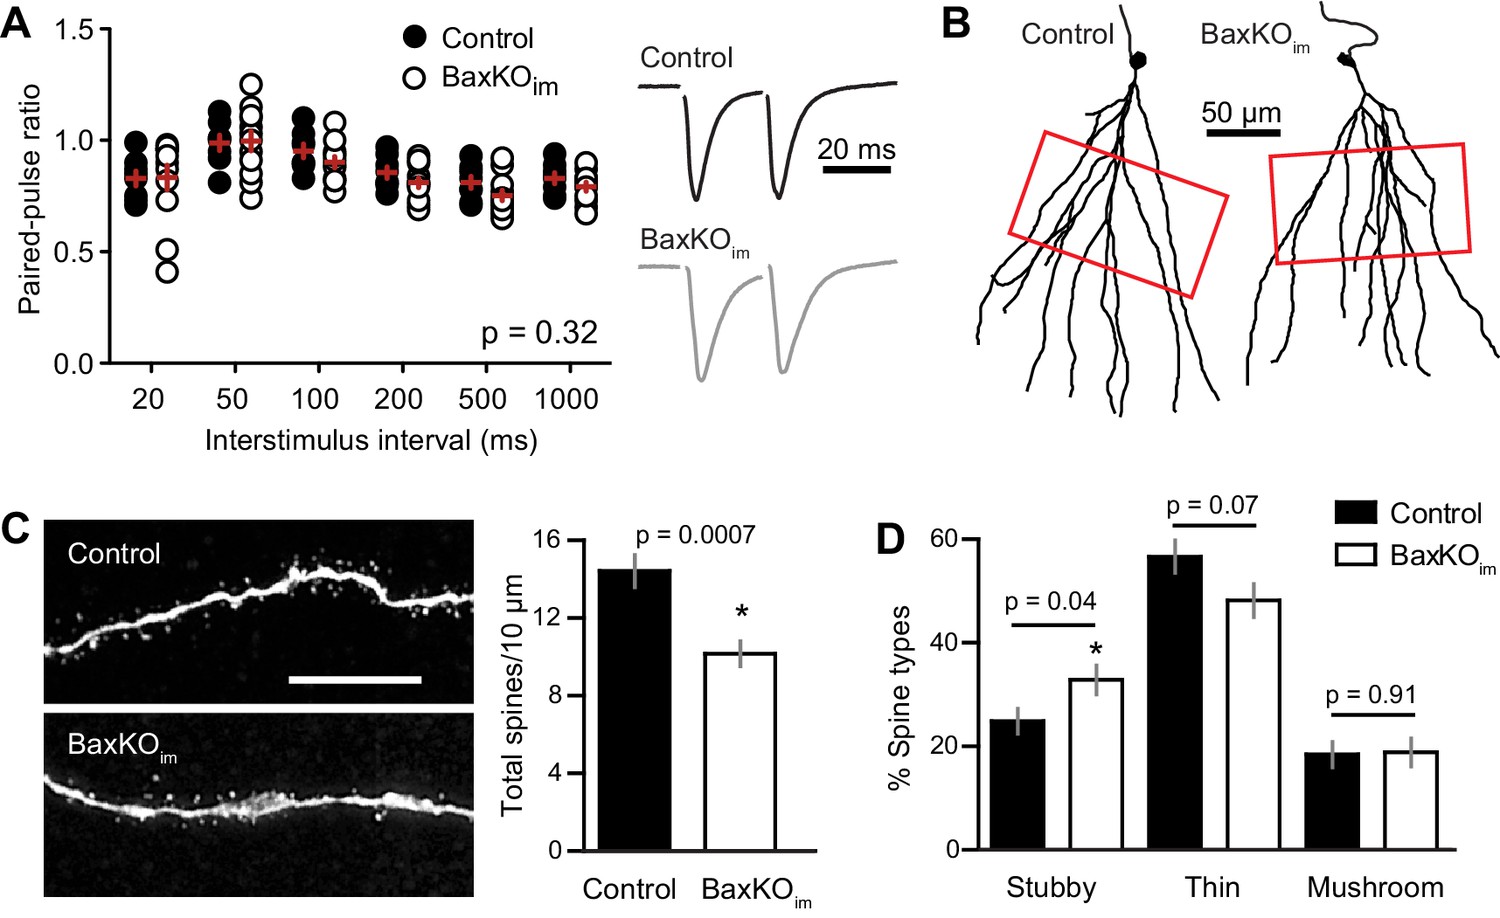
Mature GCs in BaxKOim mice exhibit low spine density.
(A) There was no difference in the paired-pulse ratio of EPSCs in mature GCs from BaxKOim and control mice across a range of interstimulus intervals (2-way ANOVA, p=0.31, n = 8,12 mature GCs). (B) Examples of reconstructed mature GCs from the recordings in (A). Red boxes indicate regions used for spine analysis. (C) Left, example images of dendritic spines from mature GCs. Scale bar, 10 μm. Middle, the density of dendritic spines was lower in BaxKOim mice (14 ± 0.8 spines/10 μm, 936 total spines counted on 15 dendritic segments in two control mice; 10 ± 0.6 spines/10 μm, 676 total spines on 12 dendritic segments from 3 BaxKOim mice; p=0.0007 unpaired t-test). (D) Classifying spines as stubby, thin and mushroom revealed a significant increase in the percentage of stubby spines in mature GCs from BaxKOim mice (p=0.04 unpaired t-test) with no change in the percentage of thin spines (p=0.07 unpaired t-test) or mushroom spines (p=0.45 unpaired t-test).
Figure 3—figure supplement 1
Intrinsic properties of mature GCs for PPR and spine analysis.
The intrinsic properties of unlabeled GCs in the PPR experiments and spine analysis confirmed their maturity. There were no differences in input resistance, AP amplitude and AP frequency, measured at 200 pA current injection (unpaired t-tests, n = 8 control and 12 BaxKOim). The patch pipette intracellular solution for these experiments was slightly modified from that reported in the Materials and methods, containing 8 rather than 28 mM Cl- and 0.2% biocytin.
Figure 4 with 2 supplements
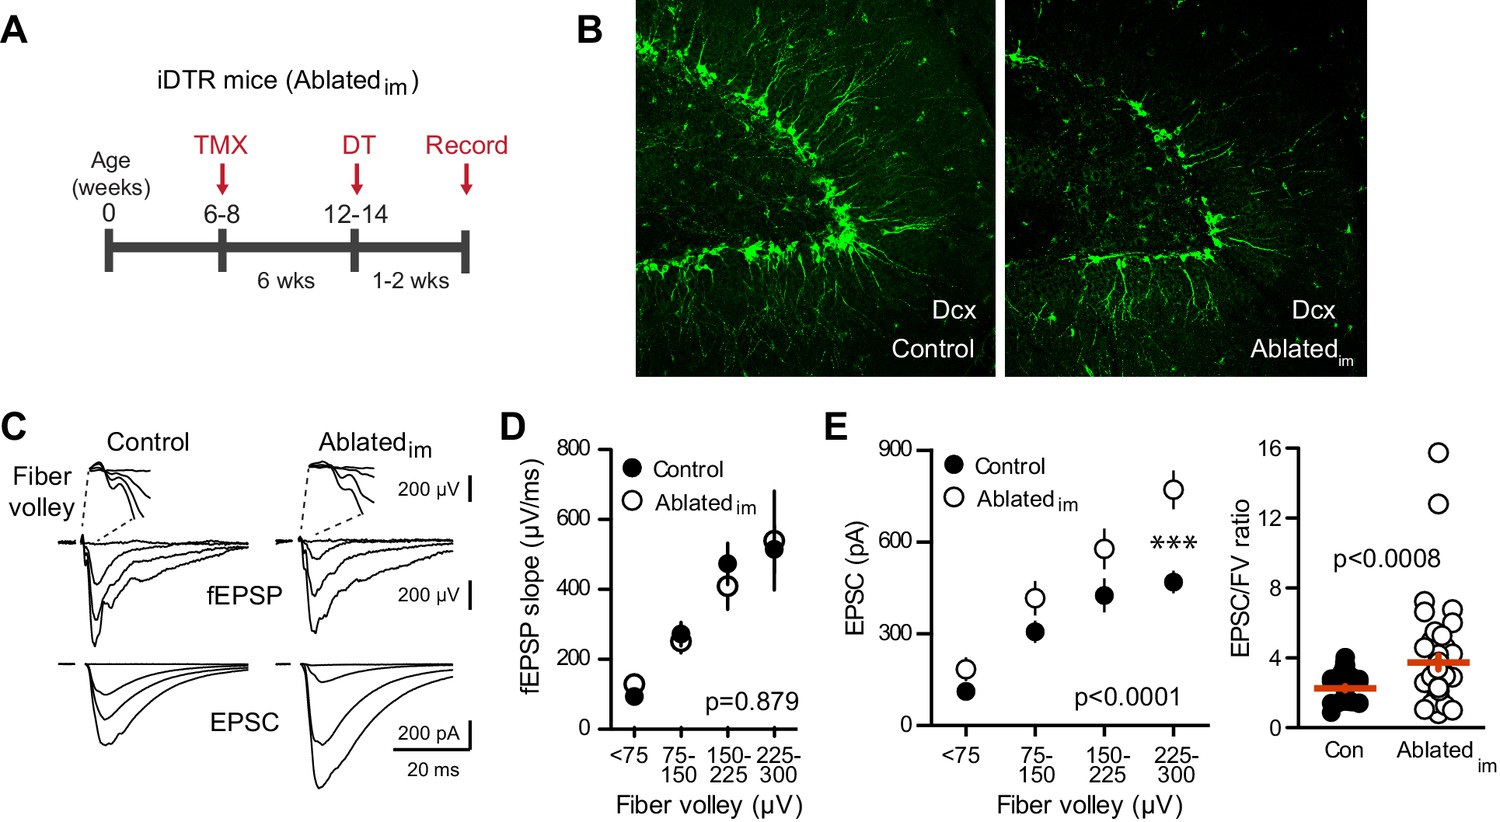
Ablating neurogenesis increases synaptic transmission to mature GCs.
(A) Experimental timeline showing ablation of immature GCs that are <6 weeks of age. Recordings from mature GCs were done 1–2 weeks after ablation. (B) Confocal images of Dcx-expressing immature neurons in control and Ablatedim mice. (C) Example of fEPSPs (top) with fiber volleys (FV, top insets) and simultaneously recorded EPSCs from mature GCs (bottom) in control and Ablatedim mice. (D) There was no difference in the fEPSP slope versus FV between Ablatedim and control mice (two-way ANOVA p=0.879, each symbol represents 8–22 responses from 7 control and 7 Ablatedim mice; FVs were binned by 75 μV). (E) The EPSC amplitude plotted against FV was larger in mature GCs from Ablatedim mice compared to controls (two-way ANOVA, Fgenotype (1,91)=30.31 p<0.0001; ***p<0.001 Bonferonni post-test). There was an increase in the overall EPSC/FV ratio in mature GCs from Ablatedim mice (unpaired t-test, p=0.0008, n = 42, 47).
Figure 4—figure supplement 1
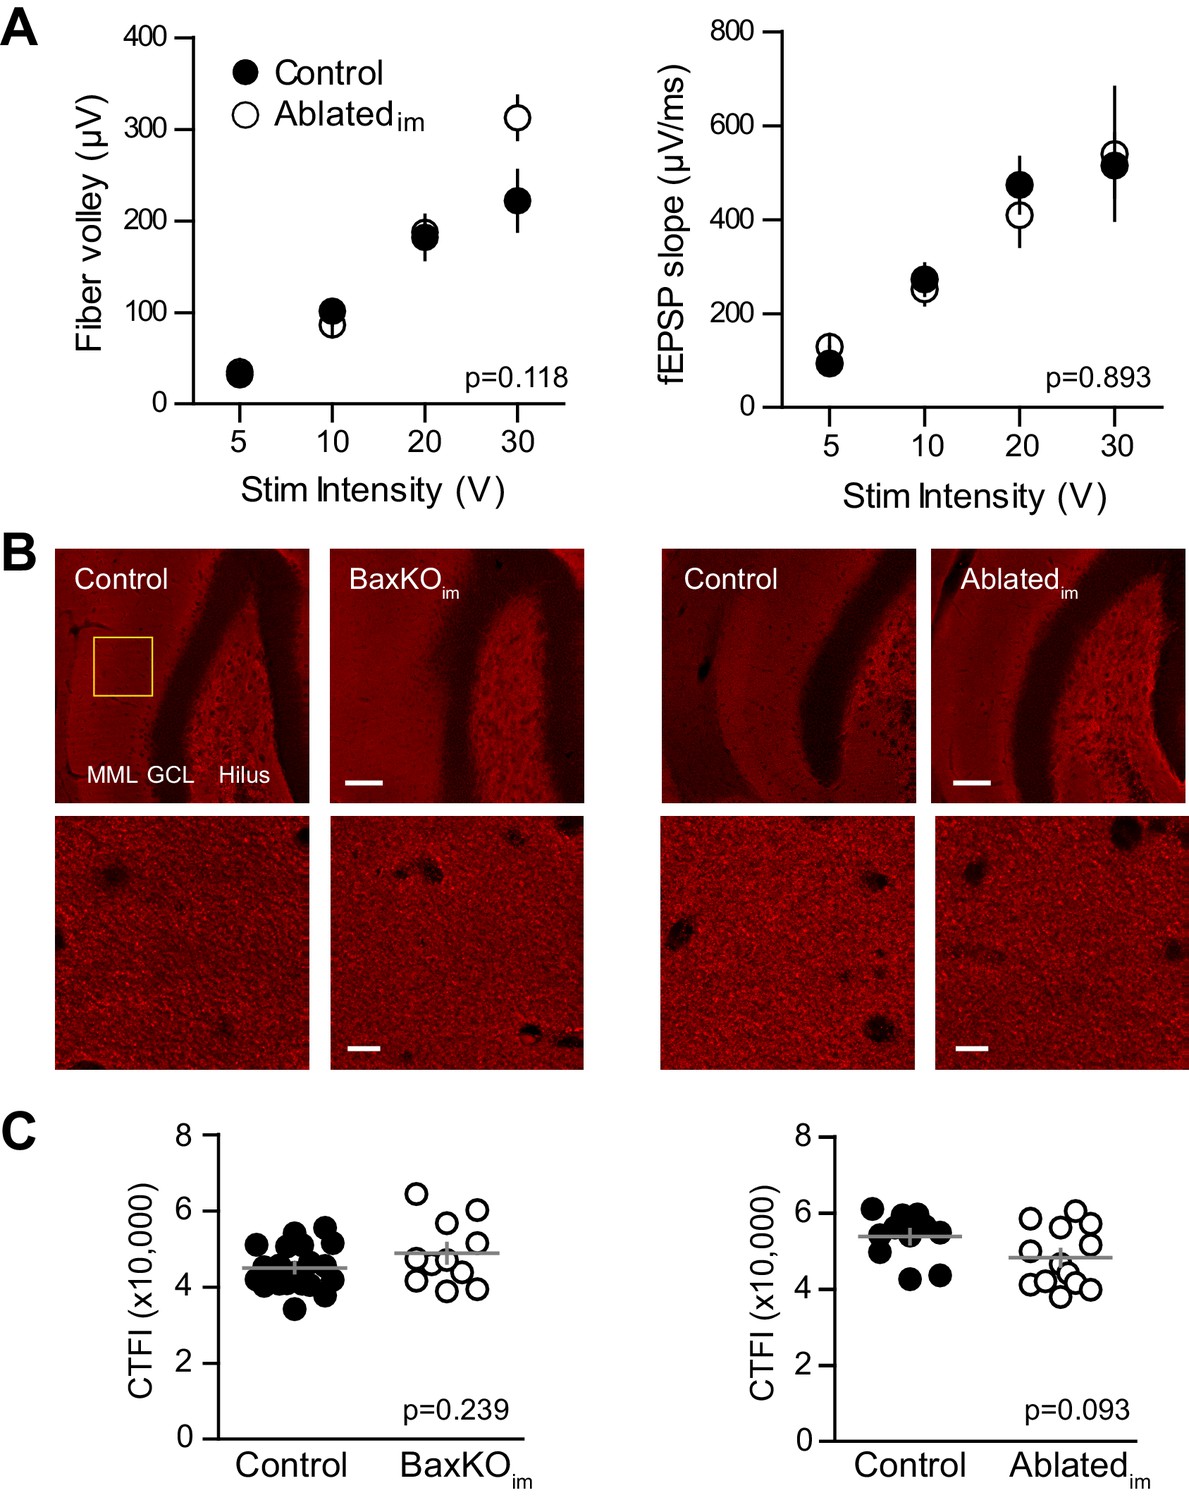
No change in FV, fEPSP slope or vGlut1 expression.
(A) There was no difference in the FV (left) or fEPSPs (right) in slices from control and. Ablatedim mice (two-way ANOVA p=0.118 and 0.893, n = 9 control slices and 7 Ablatedim slices). (B) There were no differences in vGlut1 expression in the molecular layer between respective controls and BaxKOim mice (left) or Ablatedim mice (right). Top row, 20X images, yellow box shows quantification region, GCL = granule cell layer, MML = middle molecular layer, scale bar = 50 μm. Bottom row, higher magnification image used to measure fluorescence intensity, scale bar = 10 μm. (C) Quantification of corrected total fluorescence intensity (CTFI) showing no difference in the amount of Vglut1 signal between BaxKOim (48,807 ± 2,554, n = 11 images) and control (44,964 ± 1,283, n = 20; unpaired t-test p=0.239) or between Ablatedim (48,247 ± 2,171, n = 13 images) and controls (53,787 ± 1,856, n = 11; unpaired t-test p=0.093).
Figure 4—figure supplement 2
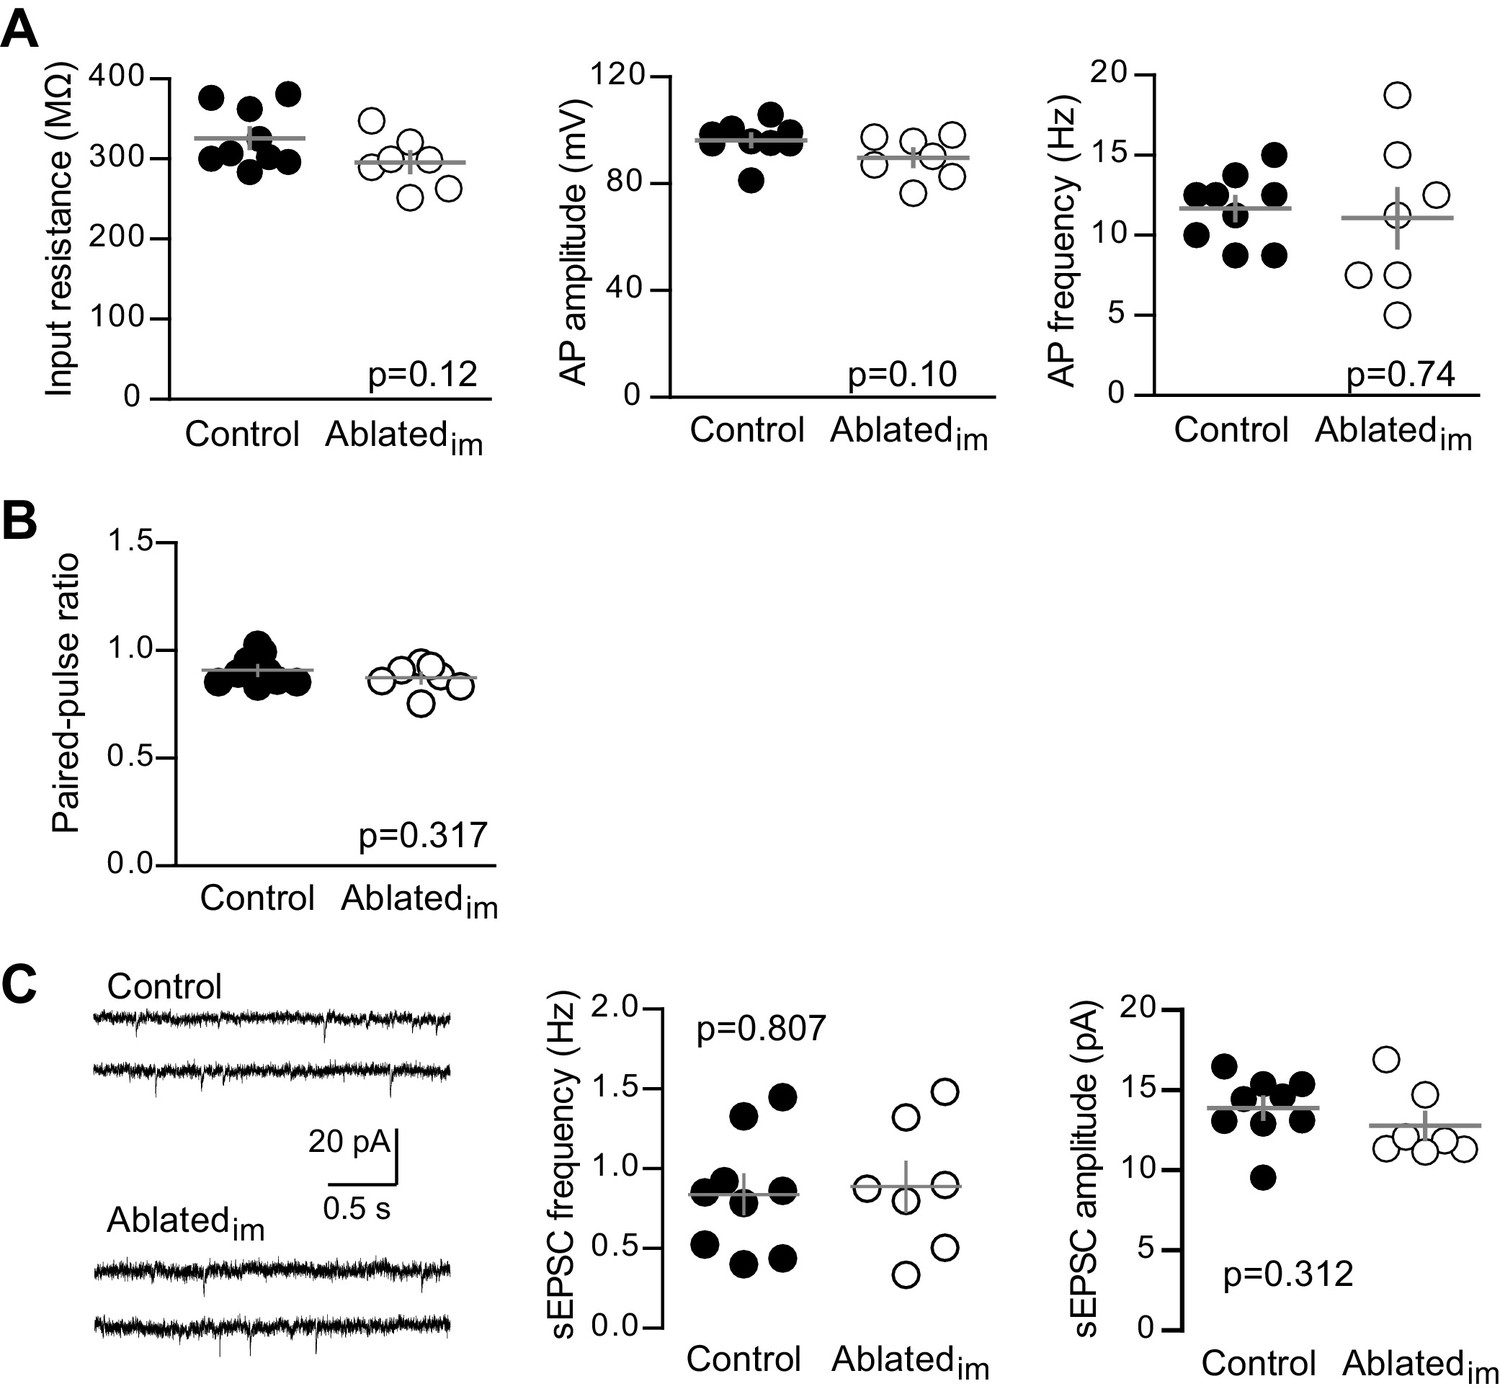
Unlabeled GCs in Ablatedim mice have mature intrinsic properties and no change in PPR or sEPSCs.
(A) Intrinsic properties of mature GCs were assayed by current injections (as in Figure 1—figure supplement 2). Intrinsic properties of mature GCs were similar in Ablatedim and control mice, including input resistance (unpaired t-test p=0.12), action potential (AP) amplitude measured from threshold (p=0.10) and AP frequency, measured in response to 50 pA current injections (p=0.74, n = 9 control, 7 Ablatedim). (B) Control and Ablatedim mice had similar PPR when stimulating at a 100 ms interval (unpaired t-test p=0.317, n = 9 control and 7 Ablatedim). (C) Example traces from spontaneous EPSC recordings (left). Both the frequency (middle) and amplitude (right) of spontaneous events was the same in control and Ablatedim mice (unpaired t-tests p=0.807 and 0.312; n = 9 control and 7 Ablatedim).
Figure 5 with 4 supplements

Bax deletion enhances EPSCs in adult born neurons.
(A) Whole cell recordings were made from immature GCs in control and BaxKOim slices at six weeks post-tamoxifen injection, using picrotoxin to isolate glutamatergic EPSCs. Simultaneous fEPSPs were recorded in the molecular layer as in Figure 1. (B) Immature GCs in control and BaxKOim tdT mice had a similar input resistance that was higher than mature GCs (n = 12, 12, 16, respectively; one-way ANOVA p=0.0004, *p<0.05,***p<0.0001 Bonferroni post hoc test). (C) Left, examples of fEPSPs (top) and EPSCs (bottom) recorded in immature GCs. Middle, an increase in synaptic transmission to immature BaxKO GCs was revealed by the EPSC plotted against fiber volley (two-way ANOVA, Fgenotype (1,143)=18.55 p<0.0001, n = 12 control tdT, 12 BaxKOim tdT; *p<0.05 with Bonferroni post-tests). Right, the EPSC/FV ratio for all stimulus intensities (control 1.24 ± 0.07, n = 80; BaxKOim1.59 ± 0.09, n = 75; unpaired t-test p=0.0029). (D) Schematic showing simultaneous recordings from adjacent tdT- (BaxWT) and tdT+. (BaxKO) GCs in slices from BaxKOim tdT mice at 16 weeks after tamoxifen. (E) Adult-generated BaxKO GCs had larger EPSCs than simultaneously recorded unlabeled mature GCs. EPSCs were normalized to the maximum amplitude of the unlabeled (BaxWT) GC in each slice (two-way ANOVA, Fgenotype (1,94)=11.59 p=0.001, n = 6 pairs), scale bars: 10 ms, 100 pA. Comparing raw EPSCs between pairs of unlabeled and tdT+ GCs across all stimulus intensities confirmed EPSCs were larger in tdT+ GCs (not shown, paired t-test, p<0.0013).
Figure 5—figure supplement 1
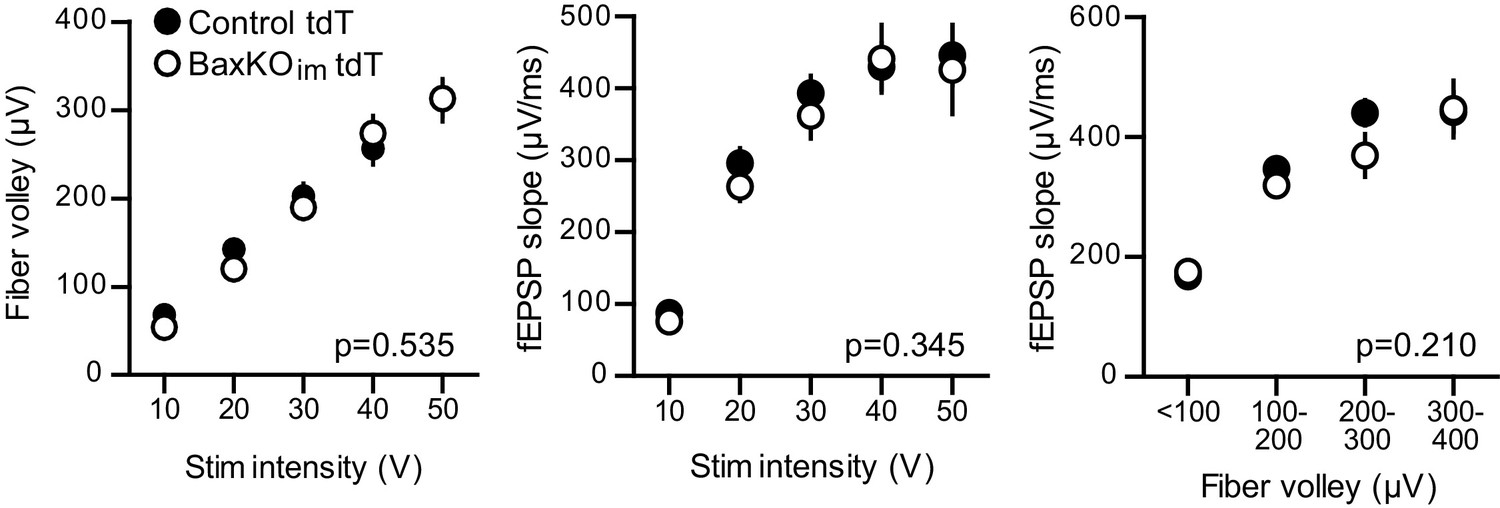
No change in FV or fEPSP in slices from BaxKOim tdT mice.
There was no difference in the FVs (left) or fEPSPs (middle) in BaxKOim mice with tdT-labeled immature neurons (two-way ANOVA p=0.535 and 0.345, stim intensity binned by 10 V). The fEPSP slope plotted against the FV also suggested no change in total synapse number (right, two-way ANOVA p=0.210, FVs binned by 100 μV). Data from 12 control slices and 12 BaxKOim slices. These results replicate those from Figure 1, showing that addition of tdT expression in immature GCs has no effect on the measures obtained in BaxKOim mice.
Figure 5—figure supplement 2
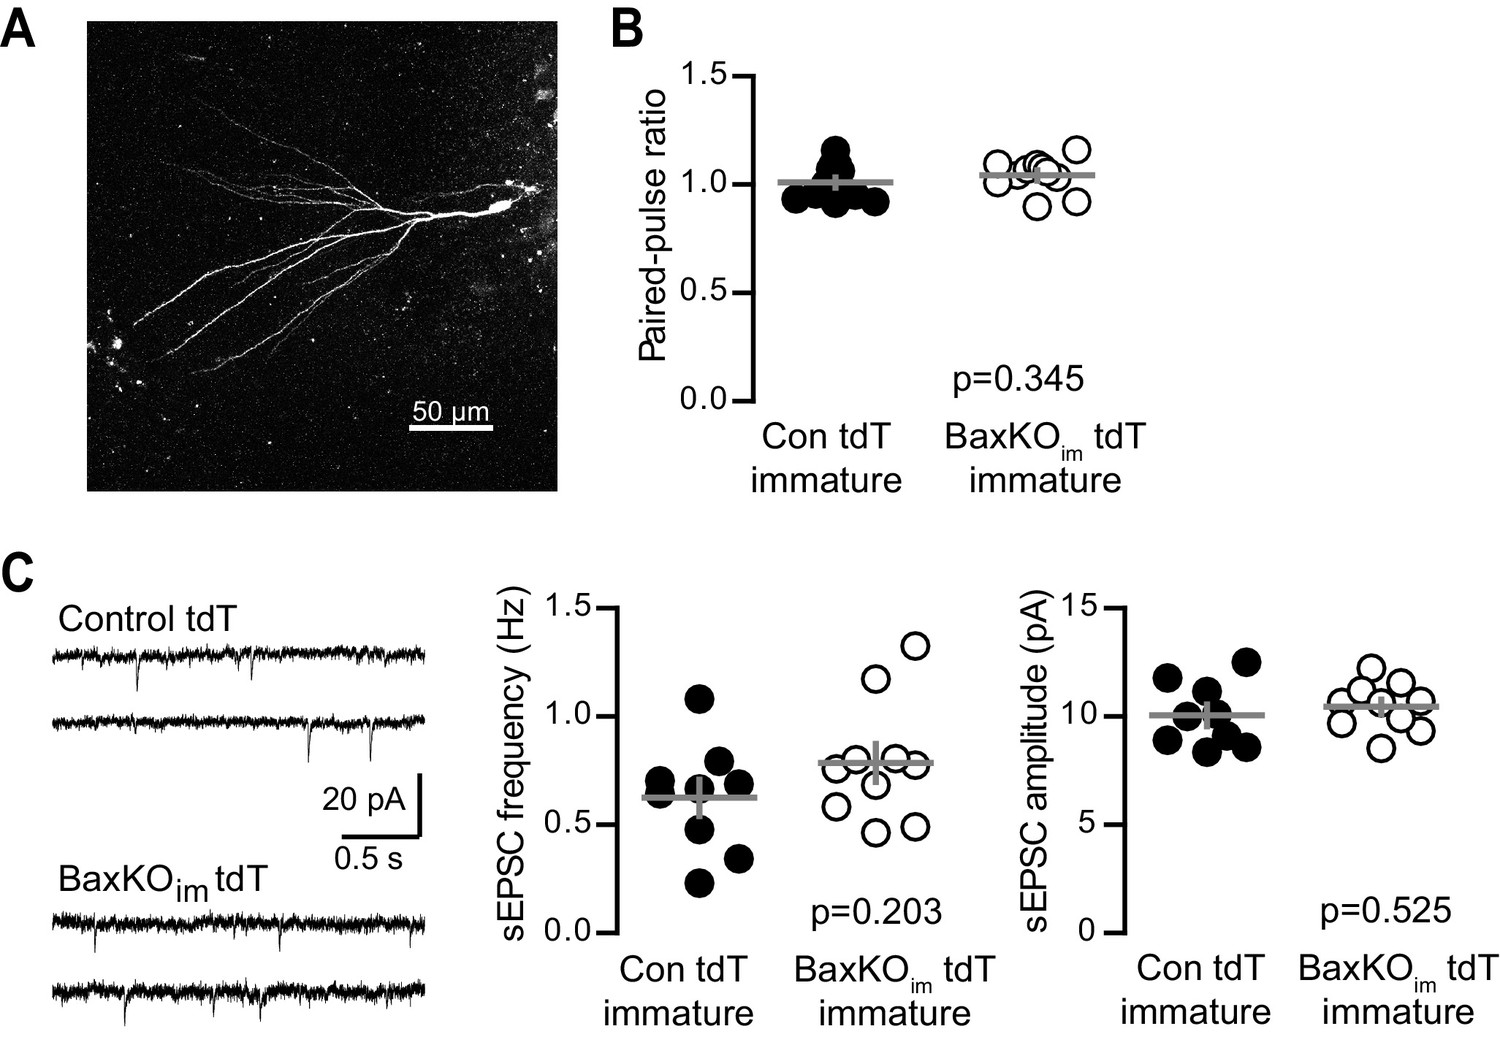
No change in PPR or sEPSCs in immature GCs from BaxKOim tdT mice.
(A) A representative immature GC filled with biocytin during recording. Note the small dendritic tree compared to mature GCs (shown in Figure 1—figure supplement 2; Dieni et al., 2013, 2016). (B) Immature GCs in control and BaxKOim tdT cells had similar paired-pulse ratio (100 ms ISI). Unpaired t-test p=0.345; n = 12 control tdT and 11 BaxKOim tdT. (C) Example traces from spontaneous EPSC recordings (left). The frequency (middle) and amplitude (right) of spontaneous events were similar in control and BaxKOim tdT cells (unpaired t-tests, p=0.203 and 0.525 respectively, n = 9 control tdT and 10 BaxKOim tdT).
Figure 5—figure supplement 3
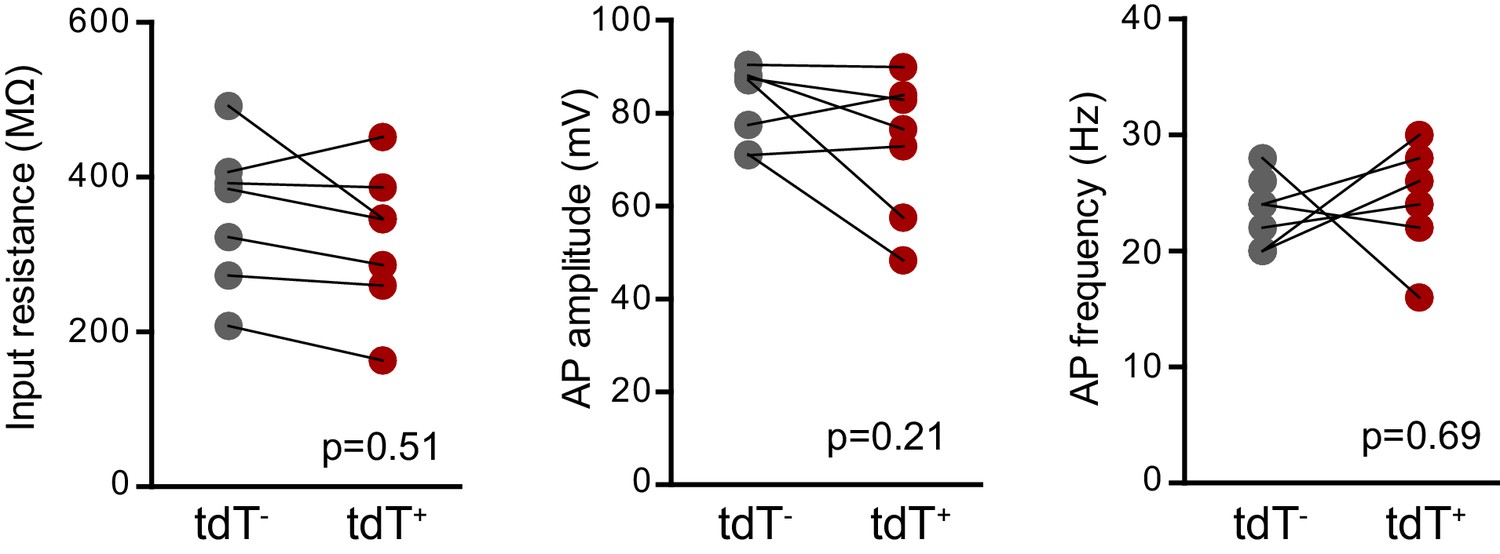
No differences in intrinsic properties between adult-born mature tdT+ (Bax -/-) and unlabeled mature GCs.
There were no differences in the input resistance (unpaired t-test, p=0.51, control n = 21, BaxKOimn = 14), AP amplitude or AP frequency (unpaired t-tests, p=0.21 and 0.69 respectively, control n = 13, BaxKOimn = 11) between unlabeled mature GCs and tdT+ adult-born GCs in BaxKOim tdT mice. Note that this data is from16 weeks after TMX induced recombination, such that adult-born tdT+ GCs have mature intrinsic properties.
Figure 5—figure supplement 4
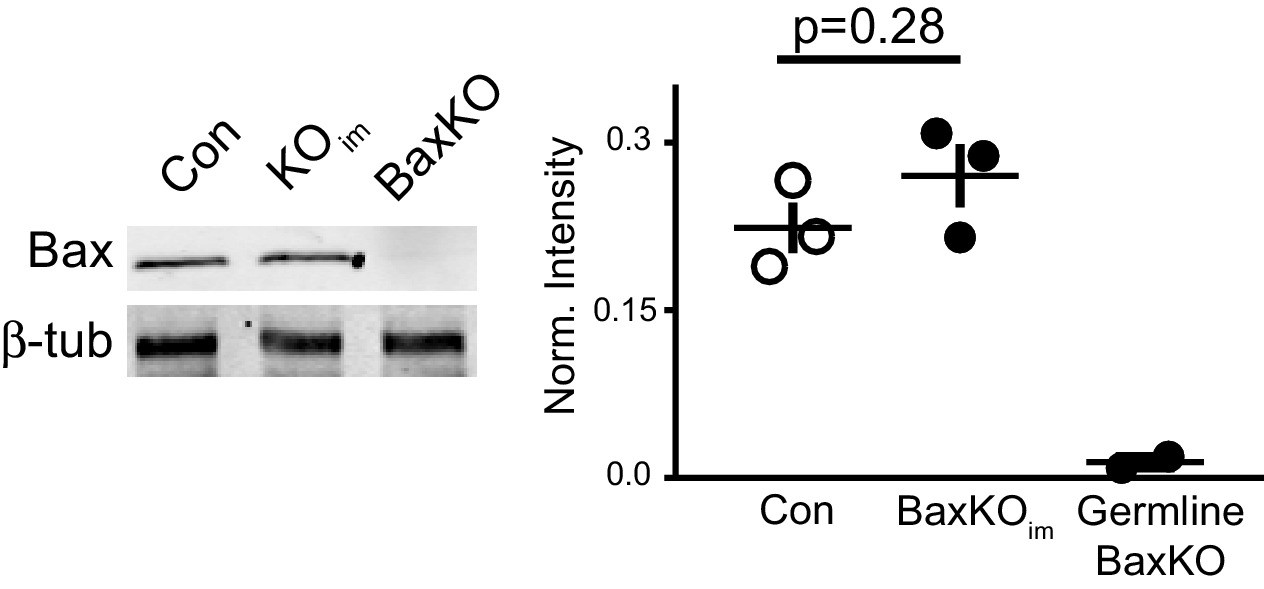
Global Bax levels are unaltered in BaxKOim hippocampus.
Representative hippocampal western blot from control (Con), BaxKOim (KOim), and germ line Bax -/- hippocampal lysates for Bax protein and control β-tubulin. Band intensity was quantified and normalized to control protein. Unpaired t-test, p=0.28 (n = 3 mice, ± SEM).
Figure 6 with 2 supplements
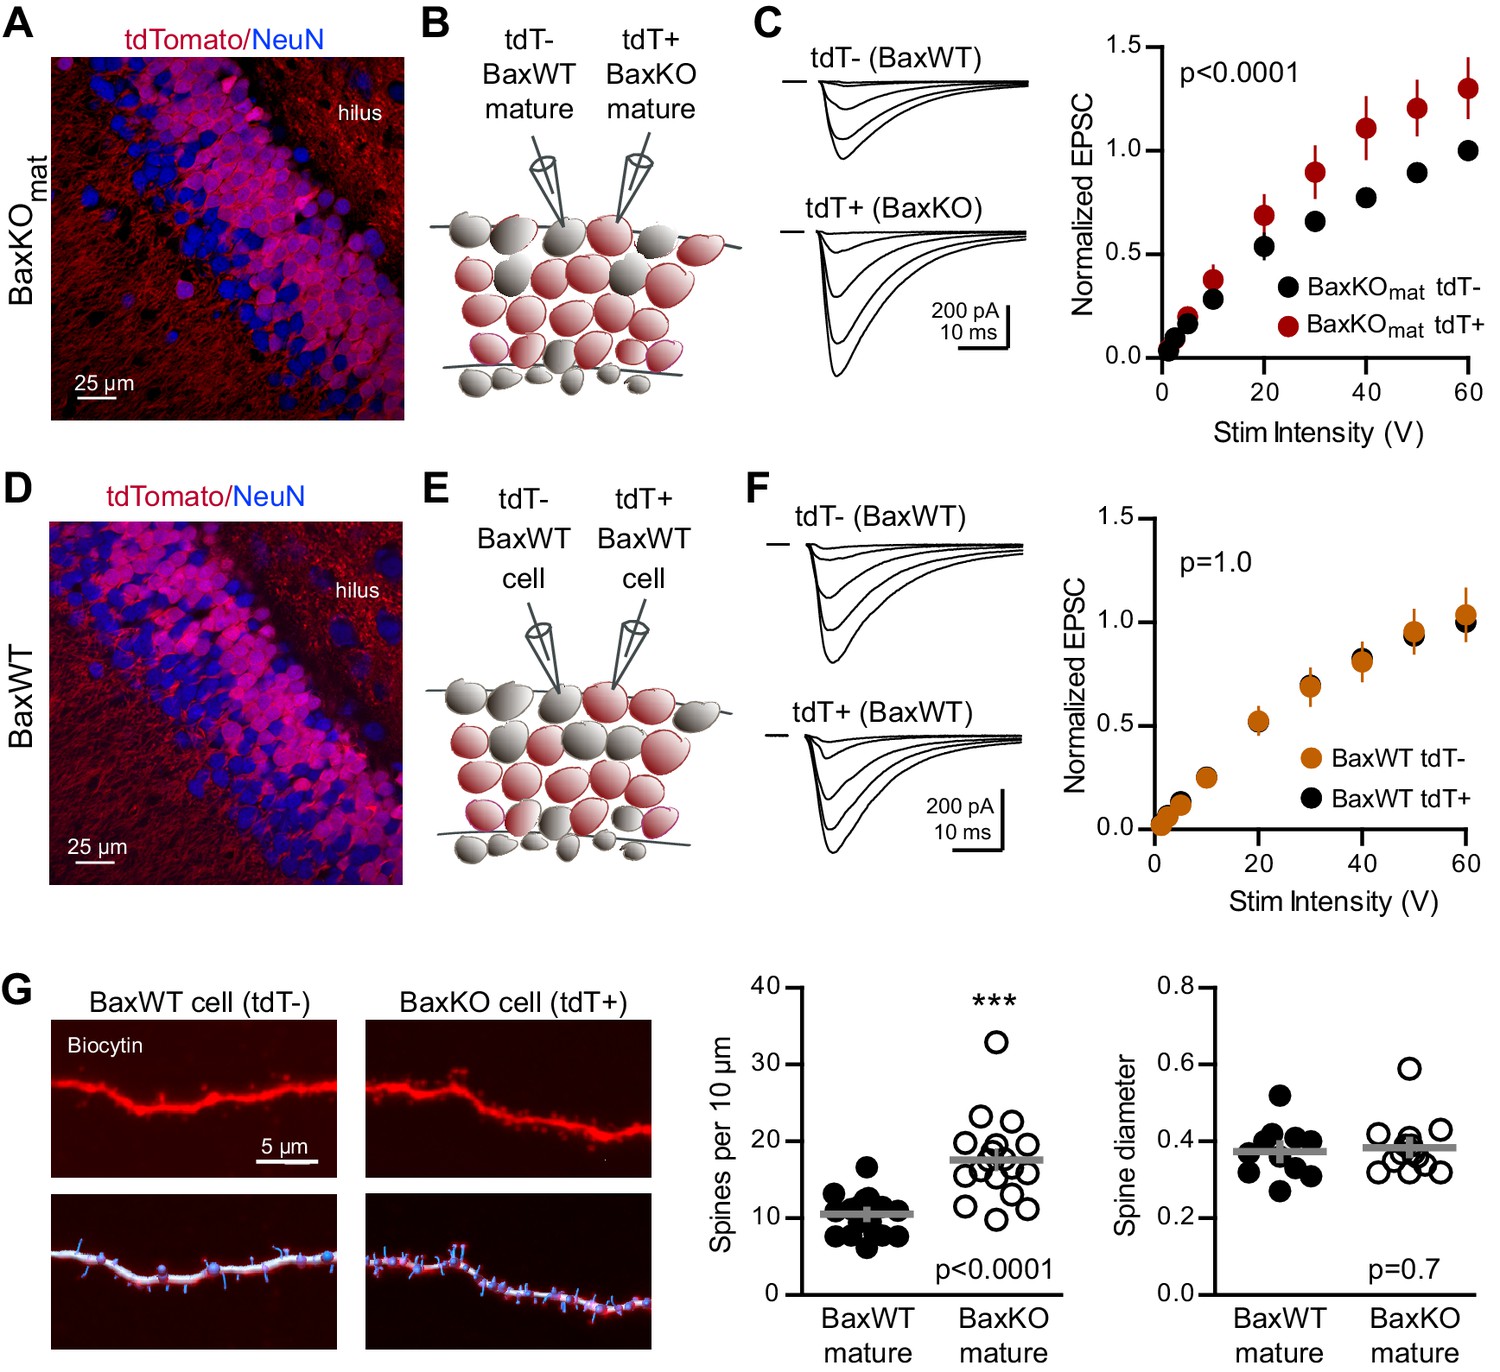
Bax deletion increases EPSCs and spine density of mature GCs.
(A) Confocal image of fixed tissue from a BaxKOmat /tdTomato mouse showing tdT (red) and NeuN (blue). Note the larger fraction of tdT+ GCs compared to (D), consistent with enhanced survival of GCs that lack Bax (confirmed in Figure 7A). (B) Adjacent tdT- (BaxWT) and tdT+ (BaxKO) mature GCs were recorded simultaneously. (C) Examples of EPSCs in tdT- and tdT+ mature GCs to the same stimuli. EPSCs were normalized to the maximum EPSC of the unlabeled cell in each slice. EPSCs were larger in tdT+ GCs (two-way ANOVA, Fgenotype (1,198)=21.14 p<0.0001, n = 12 cell pairs). (D) Confocal image of fixed tissue from a BaxWT/POMC-Cre+/tdTomato mouse, in which both tdT+ and unlabeled GCs are BaxWT(red tdT, blue NeuN). (E) Adjacent tdT+ and unlabeled mature GCs were recorded simultaneously. (F) There was no difference in EPSCs between BaxWT tdT+ and unlabeled cells (two-way ANOVA p=1.0, n = 8 cell pairs), confirming the difference in panel C requires the Bax -/- genotype. (G) Posthoc dendrite reconstructions (top) revealed higher spine density in BaxKO GCs from (A) (10.5 ± 0.53 spines/10 μm in BaxWT compared with 17.60 ± 1.3 BaxKO, unpaired t-test p<0.0001) with no change in spine head diameter (unpaired t-test, p=0.7, n = 21 segments from 5 BaxWT, 18 segments from 9 BaxKO). Lower images illustrate spine analysis.
Figure 6—figure supplement 1
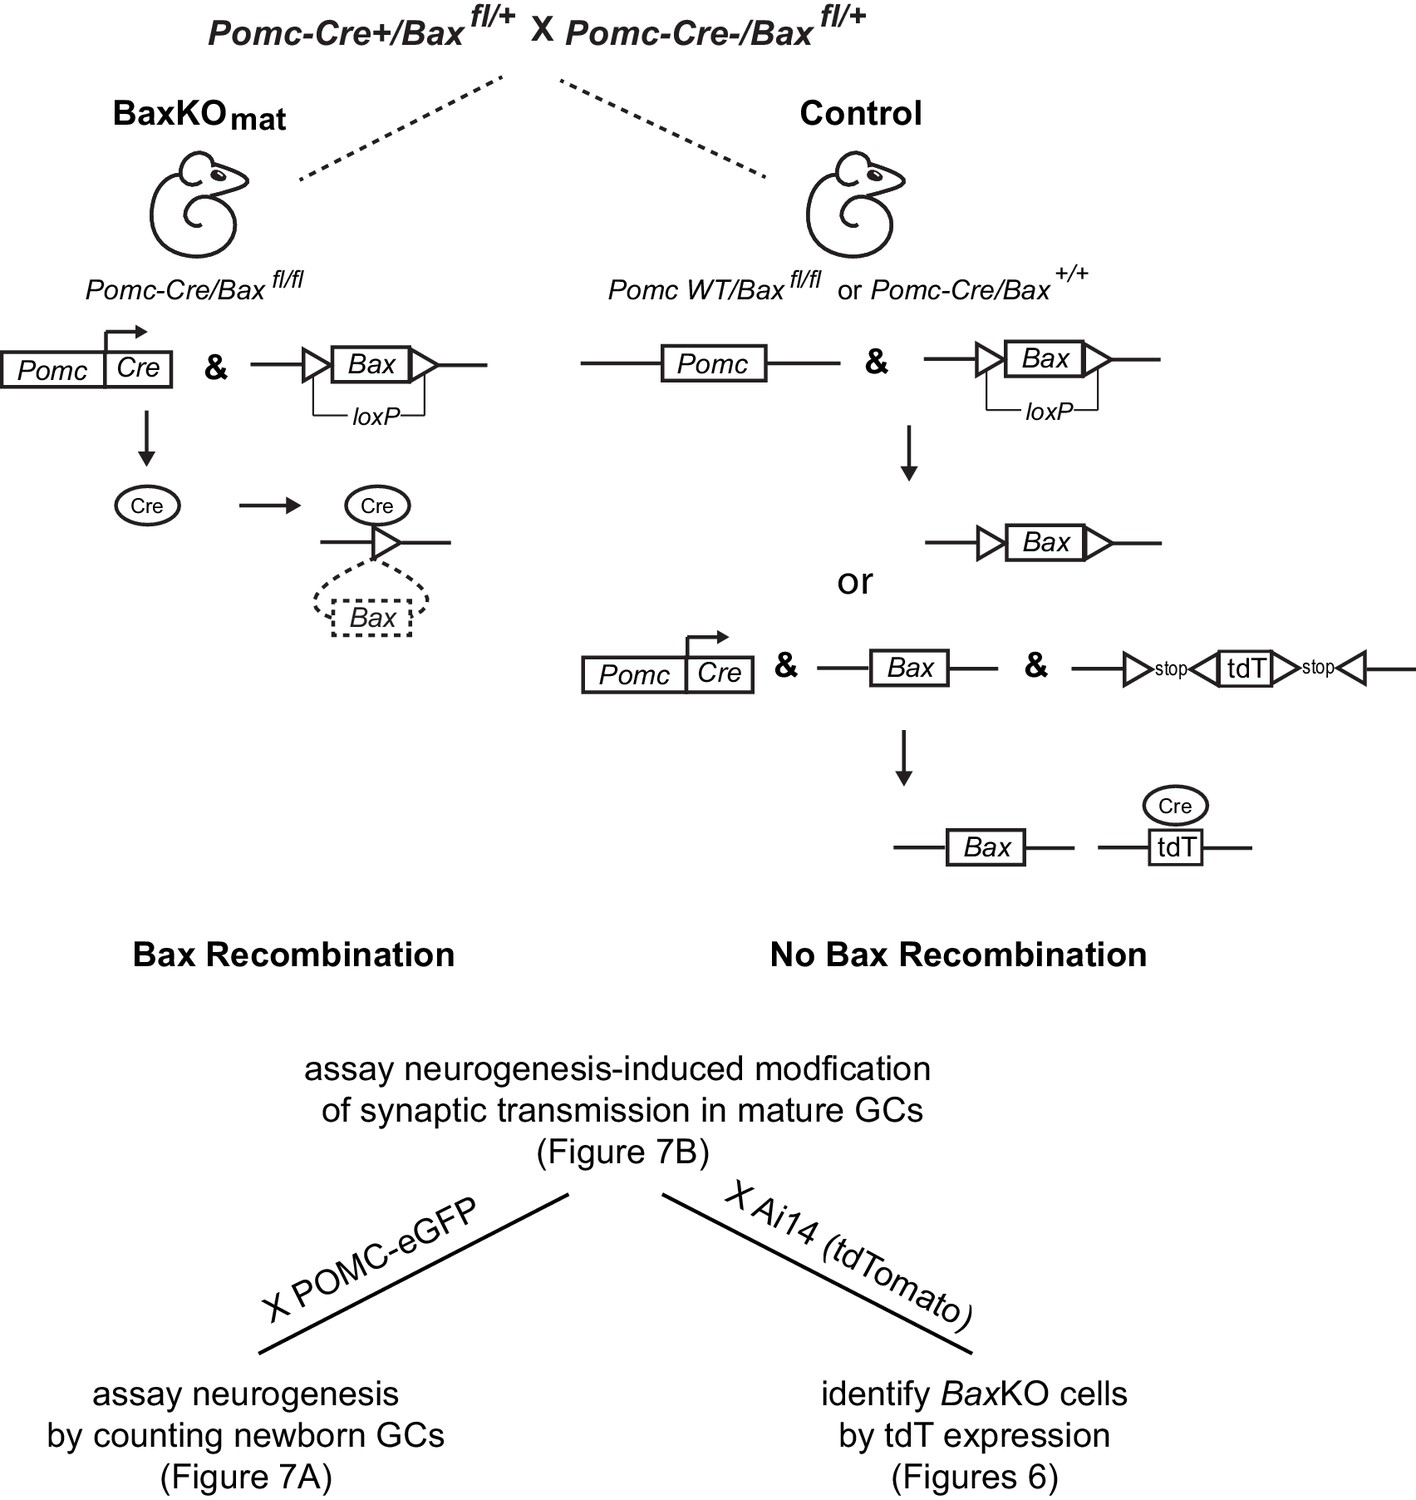
Generation of BaxKOmature mice.
Schematic illustrating the conditional excision of the lox-p flanked Bax locus using POMC-Cre/Baxfl/+ mice to generate BaxKOmature mice (BaxKOmat). Controls were POMC-Cre-/Baxfl/fl . Additional breeding to reporter mice was used in the experiments shown in the indicated figures: POMC-eGFP to label newborn GCs or Ai14 (tdTomato) to identify recombined BaxKO cells. In the latter case, controls expressing tdTomato were POMC-Cre+/Bax+/+..
Figure 6—figure supplement 2

No difference in Ca2+-dependence of evoked EPSCs in BaxKOmat mice.
(A) Evoked EPSCs in mature GCs in control and BaxKOmat mice were tested across a range of extracellular Ca2+ concentrations, with the average EPSC from 50 trials in each [Ca2+] normalized to the amplitude of EPSCs in 2 mM Ca2+. As expected, the EPSC amplitude was highly sensitive to extracellular Ca2+, and there was no difference between EPSCs across genotype (p=0.44, n = 4–11 cells per [Ca2+]). (B) The PPR (100 ms ISI) was inversely related to [Ca2+], but there was no difference between genotypes (p=0.08, n = 4–17 cells per [Ca2+]). Normalizing the PPR in each cell to the PPR in 2 mM Ca2+ likewise revealed no difference between genotypes (p=0.11), suggesting that the Ca2+ dependence of release is similar in control and BaxKOim mice.
Figure 7 with 2 supplements
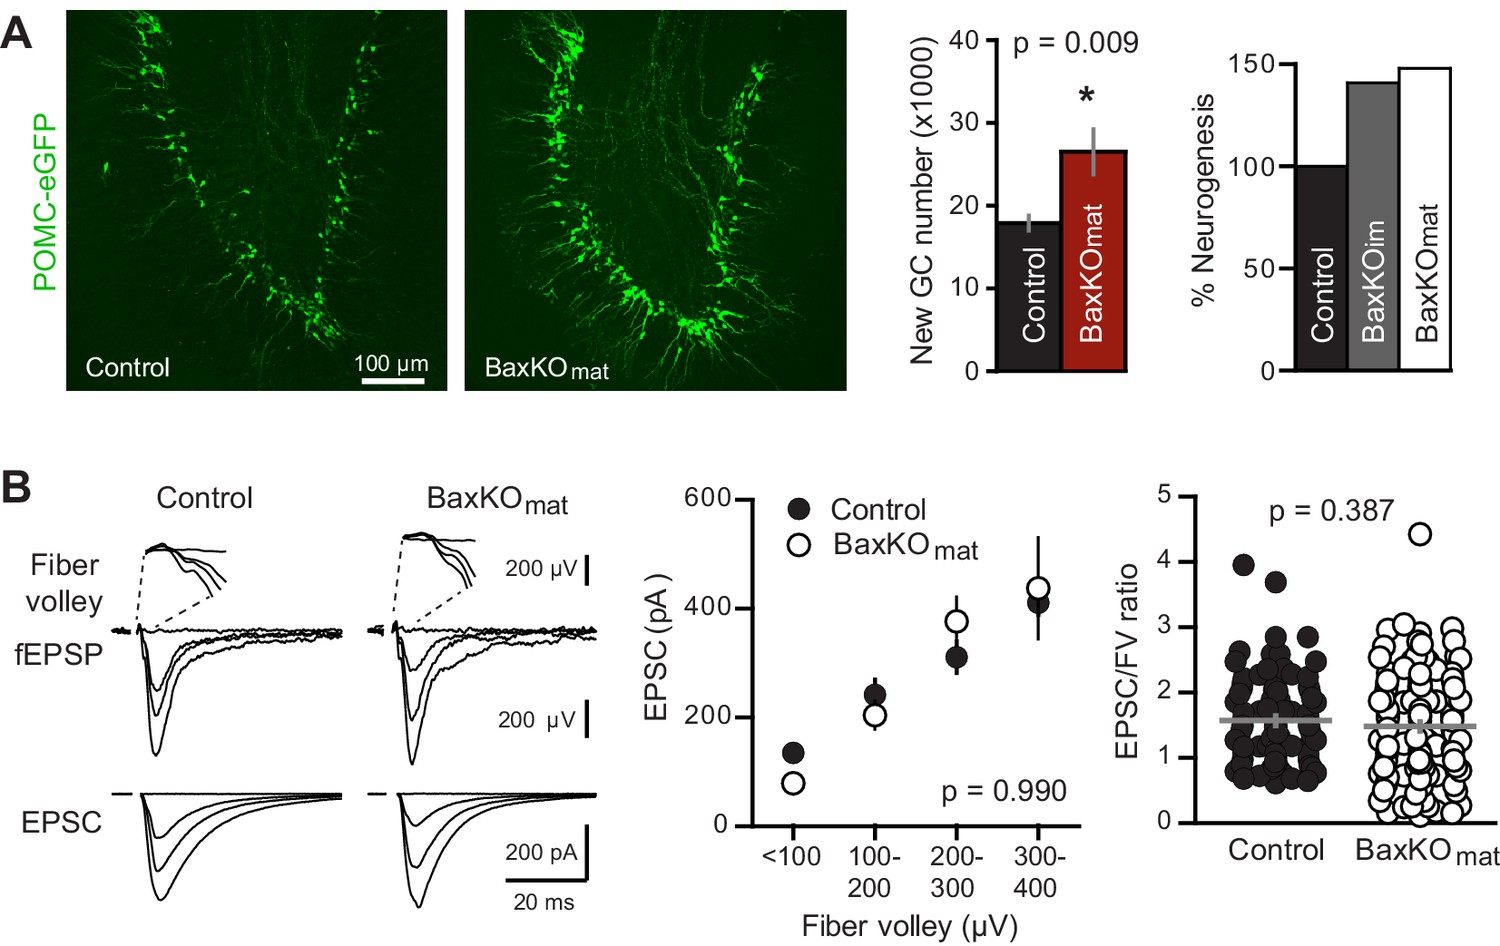
Neurogenesis-induced loss of synaptic transmission requires Bax in mature GCs.
(A) Confocal images of newborn neurons expressing eGFP in BaxKOmat mice. Stereological cell counts revealed neurogenesis was enhanced by ~48% (control 17,910 ± 900 cells, n = 7; BaxKOmat26,508 ± 2728 cells, n = 6; unpaired t-test), similar to enhanced neurogenesis in BaxKOim mice. (B) Left, examples of fEPSPs (top) and EPSCs in mature GCs (bottom) from control and BaxKOmat mice. Middle, there was no difference in EPSCs across FVs (two-way ANOVA p=0.990, n = 12 control, 19 BaxKOmat GCs) or in the EPSC/FV ratio (unpaired t-test p=0.387, n = 88 control, 129 BaxKOmat), although there was greater variability in the BaxKOmat group (CV = 52% vs. 43%) consistent with a mixed population of mature Bax -/- and Bax +/+ GCs (as shown in Figure 6).
Figure 7—figure supplement 1
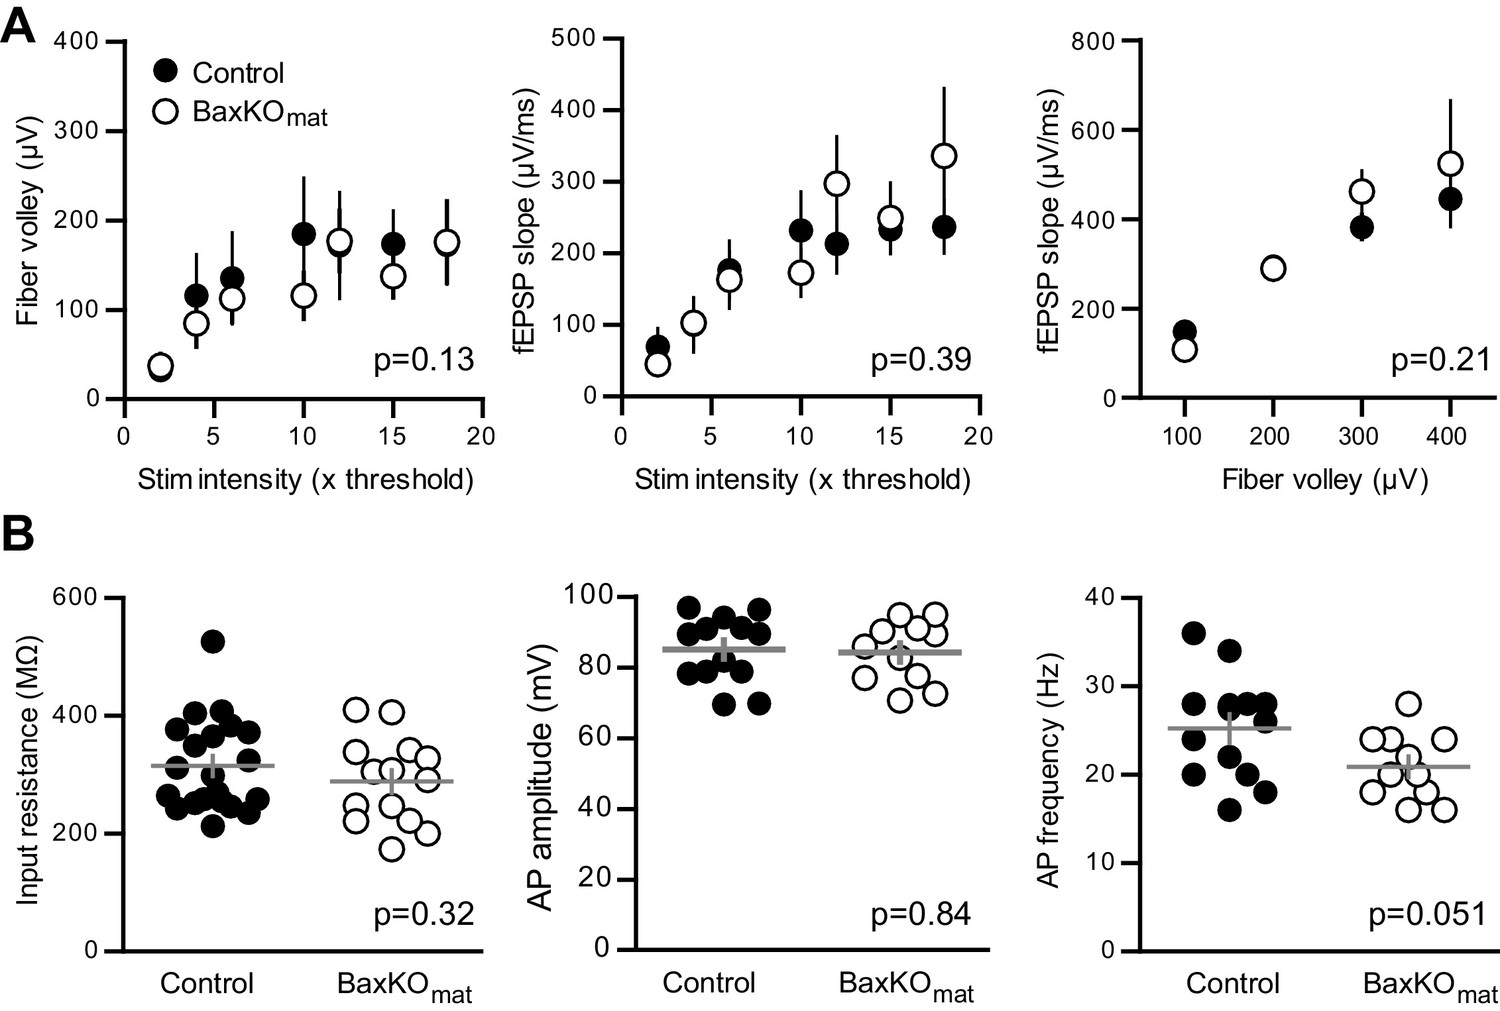
No differences in FVs, fEPSP slopes and intrinsic properties of mature GCs in BaxKOmat mice.
(A) There was no difference between slices in BaxKOmat and control mice in FV amplitudes, fEPSP slopes, or fEPSP slope plotted against FVs (two-way ANOVA, p=0.13, 0.39 and 0.21 respectively). FVs were binned by 100μV, control n = 13 slices, BaxKOmatn = 18 slices). (B) There were no differences in the input resistance (unpaired t-test p=0.32, control n = 21, BaxKOmatn = 14), AP amplitude or AP frequency (unpaired t-tests. p=0.84 and 0.051 respectively, control n = 13, BaxKOmatn = 11) in mature GCs from BaxKOmat mice.
Figure 7—figure supplement 2
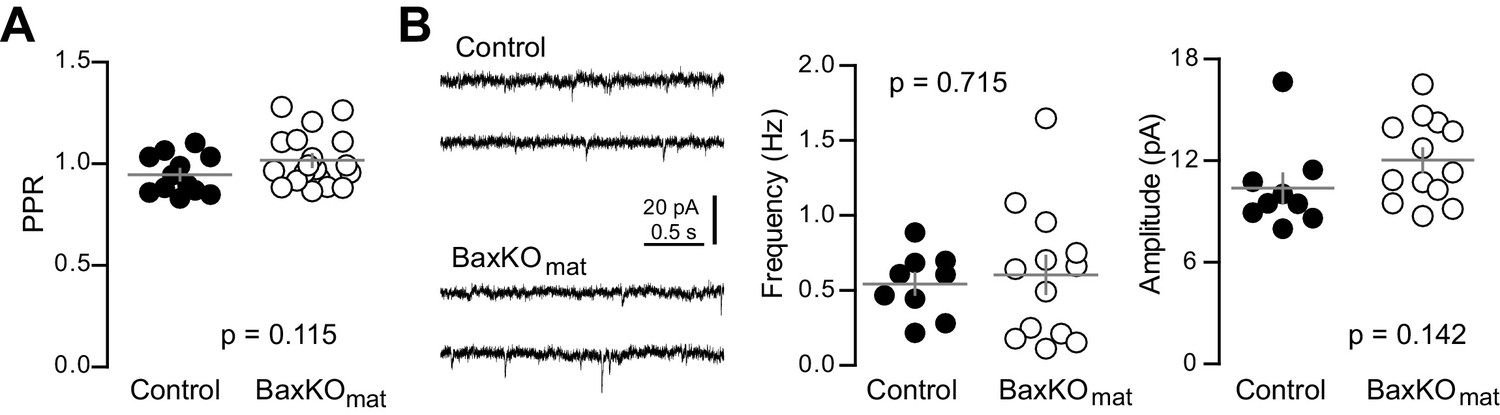
Similar PPR and sEPSCs in mature GCs from BaxKOmat mice.
(A) The PPR of EPSCs in mature GCs was similar in BaxKOmat and controls (unpaired t-test, p=0.115, n = 12 controls and 19 BaxKOmat). (B) The frequency of spontaneous EPSCs in mature GCs from BaxKOmat mice was similar to controls (unpaired t-test p=0.715) but with higher variance (p=0.04, not shown). The sEPSC amplitude was similar (p=0.142, n = 9 control, 13 BaxKOmat).
Figure 8 with 1 supplement
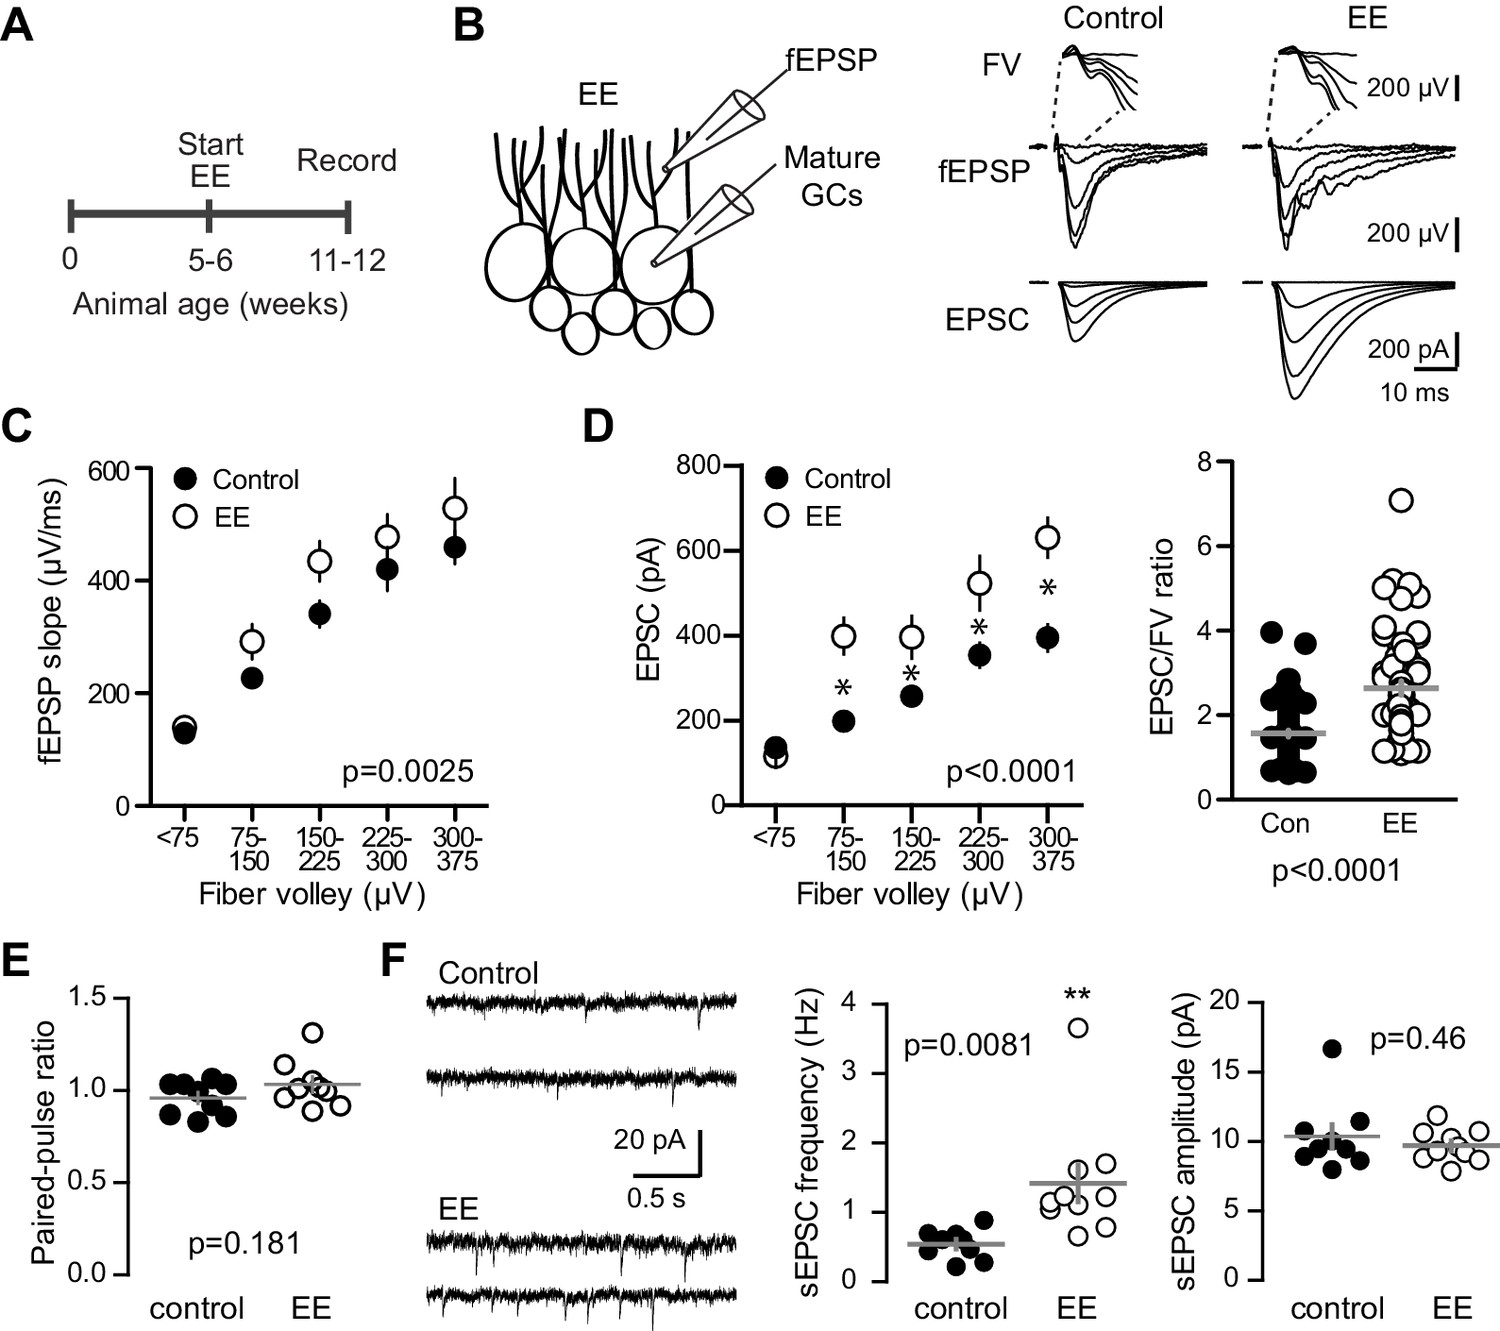
Environmental enrichment increases synaptic transmission to mature GCs.
(A) The experimental timeline showing recordings performed 4–6 weeks after EE. (B) Left, simultaneous fEPSPs and whole-cell recordings from mature GCs, as shown in Figure 1. Examples of fEPSPs (top) with FV (insert) and EPSCs in mature GCs (bottom) in slices from control and EE mice. (C) Slices from EE mice exhibited an increase in the fEPSP slope plotted against FV amplitude (two-way ANOVA, Fmanipulation (1,116)=9.59, p=0.0025, n = 11 control, 9 EE). FVs were binned by 75 μV. (D) Left, an increase in synaptic transmission to mature GCs was revealed by the EPSC plotted against FV (two-way ANOVA, Fmanipulation (1,150)=52.88, p<0.0001, n = 11 control, 9 EE). *p<0.01with Bonferroni post-tests. Right, the overall EPSC/FV ratio was enhanced by EE (unpaired t-test, p<0.0001). (E) The paired-pulse ratio of EPSCs (100 ms ISI) was similar in EE and control mice (p=0.181 unpaired t-test, n = 9 controls, 9 EE). (F) Spontaneous EPSCs in mature GCs from EE mice had higher frequency (p=0.0081 unpaired t-test) but similar amplitude as sEPSCs in mature GCs from control mice (p=0.46, n = 9 controls,10 EE).
Figure 8—figure supplement 1
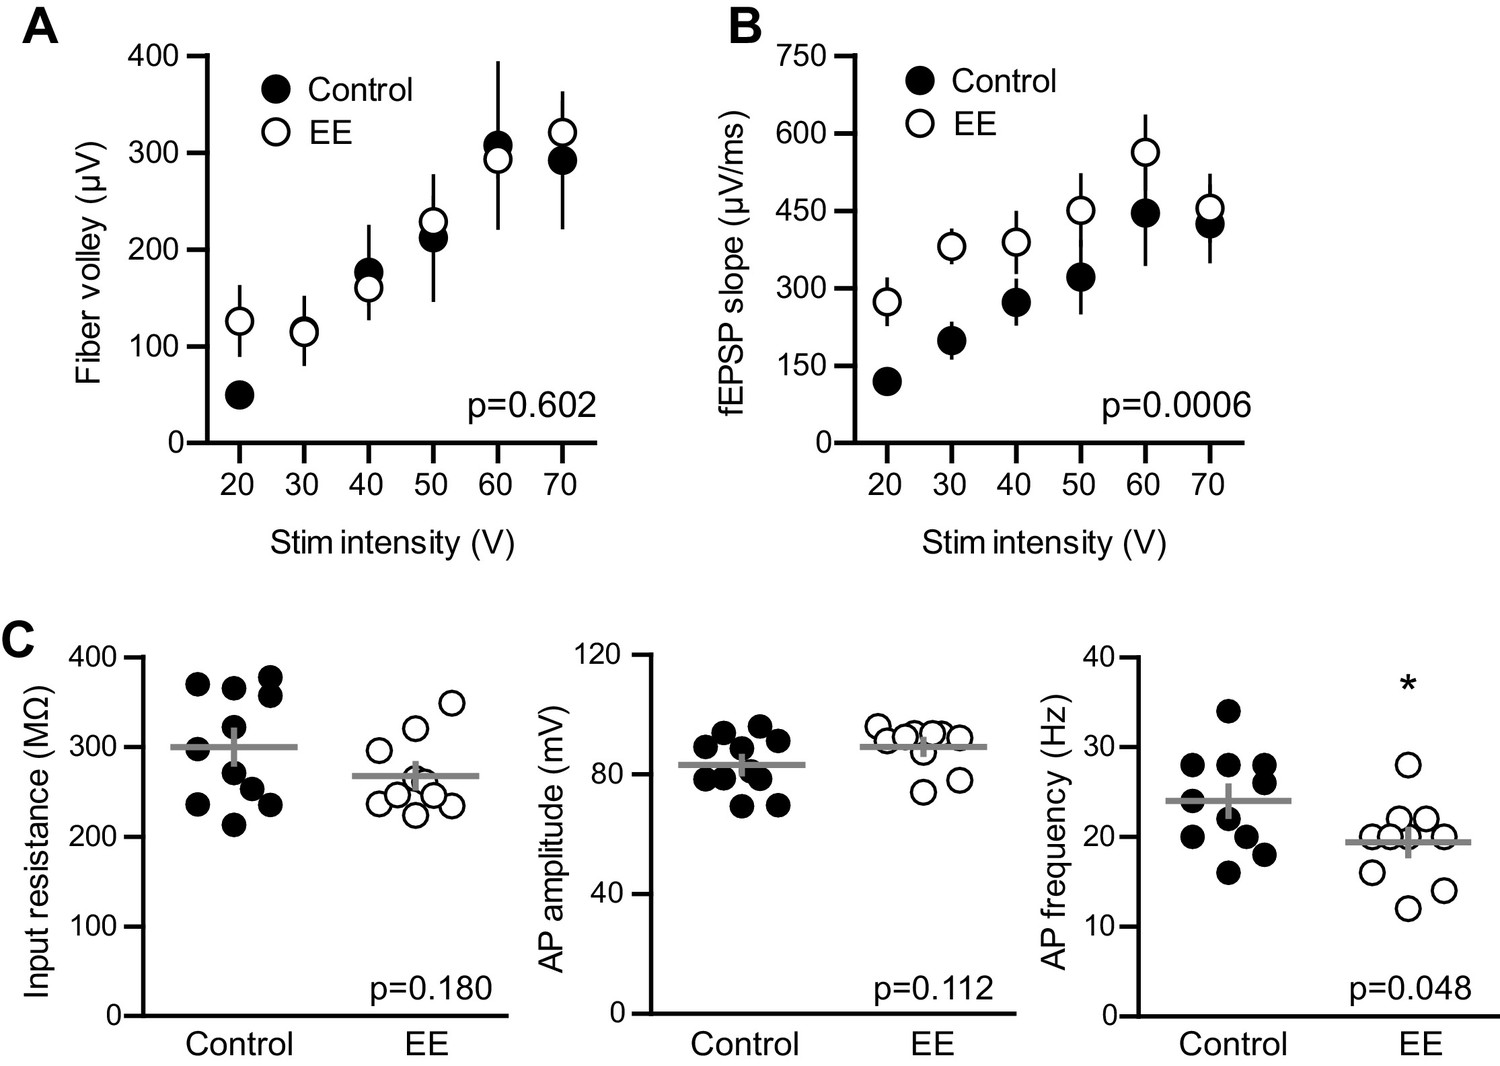
EE enhances the fEPSP with no change in fiber volley and input resistance of mature GCs.
(A) The FV amplitude plotted across stimulation intensity revealed no difference between. slices from EE and control mice (p=0.602 two-way ANOVA, n = 11 control and 13 EE). (B) In the same recordings, the fEPSP slope was significantly greater in EE mice (p=0.0006). (C) The input resistance of mature GCs in whole-cell recordings confirmed the mature status of GCs after EE. Input resistance; control 299 ± 61 MΩ, n = 11; EE 267 ± 41 MΩ, n = 10; p=0.18 unpaired t-test. Action potential (AP) amplitude measured from threshold; control 83 ± 9 mV, EE 89 ± 7 mV, p=0.11 unpaired t-test. There was a significant reduction in the AP frequency measured at 100 pA current injection; control 24 ± 5 Hz, EE 19.4 ± 4.5 Hz; p=0.048 unpaired t-test.
Figure 9 with 1 supplement
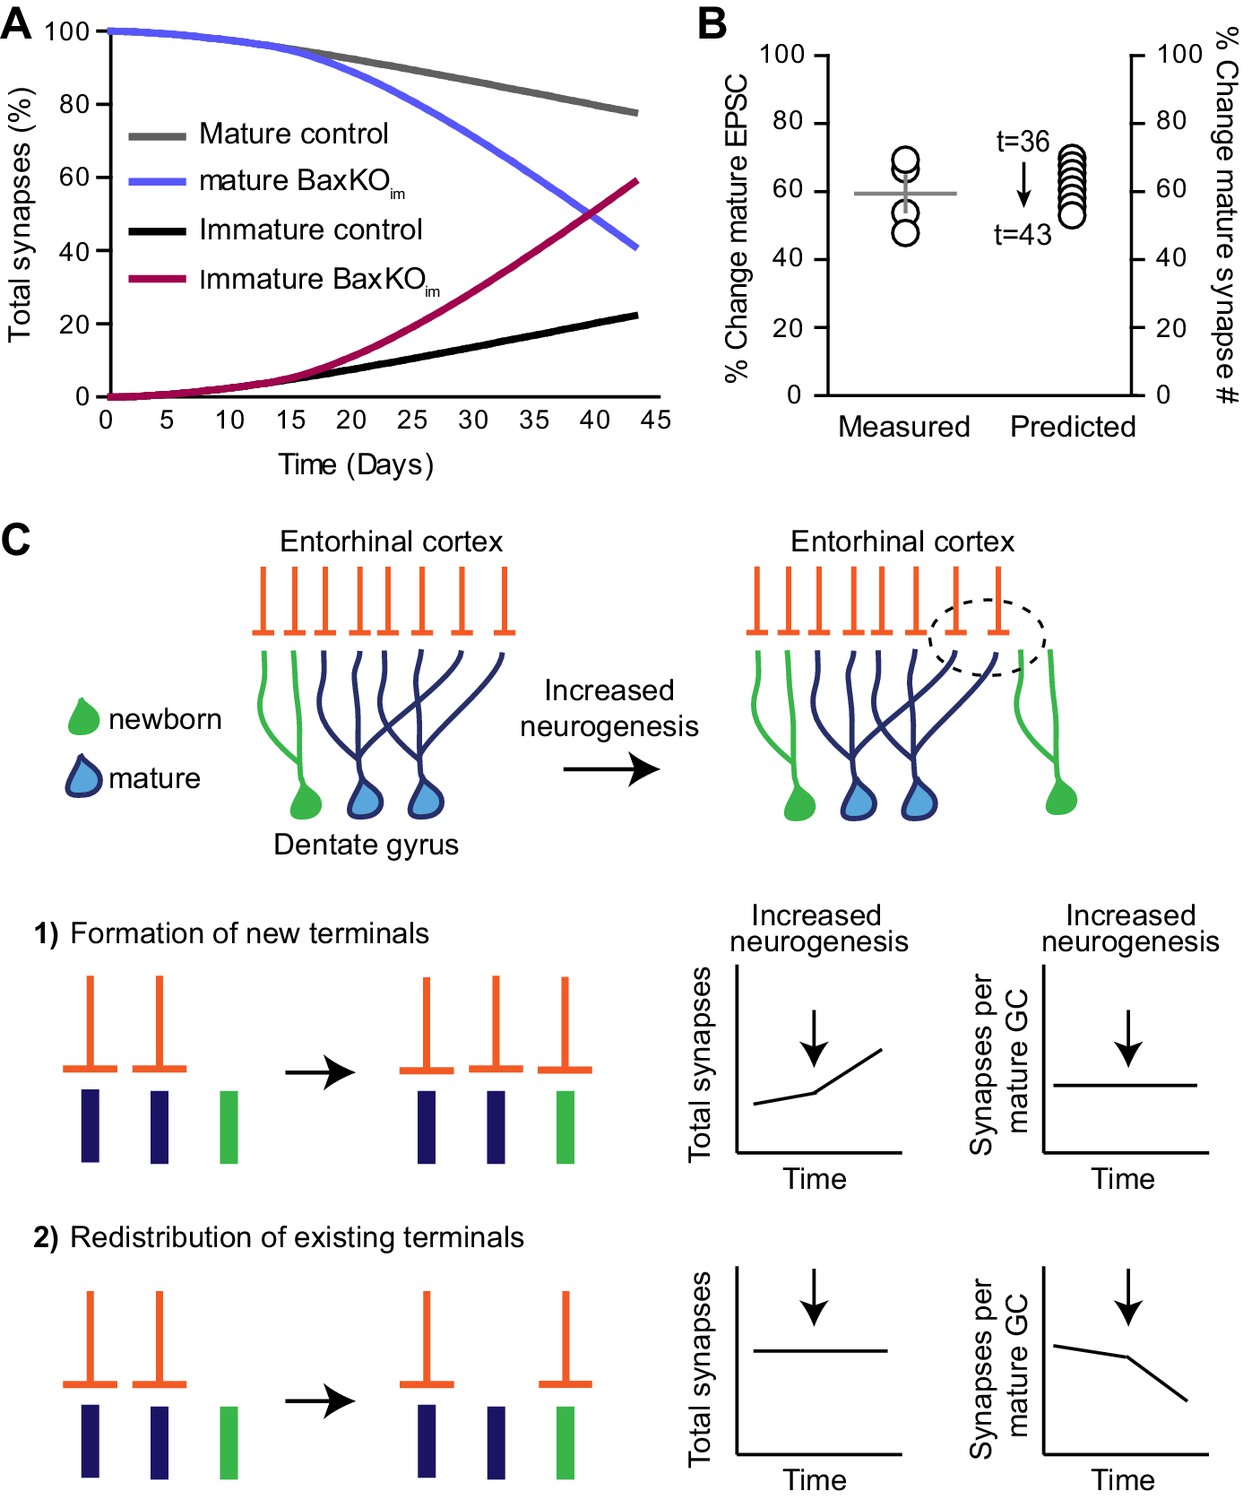
Simulation of neurogenesis-induced synaptic redistribution.
(A) Distribution of synapses occupied by mature and immature GCs using quantitative synaptic transfer simulation (see Materials and methods). Lines indicate the percentage of synapses on mature and immature GCs across the duration of the BaxKOim experiment, with the total number of synapses held constant. (B) Experimentally measured %change in EPSCs in mature GCs (left axis) compared to the %change in mature synapse number predicted by the simulation at time points t = 36 through t = 43 (right axis). Experimental data is the mean mature GC EPSC amplitude in BaxKOim mice normalized to control from each FV bin shown in Figure 1G. (C) Graphic depiction of synaptic integration of adult born neurons showing that new GCs (green) gain EC synapses (orange) through two possible sources: (C1) New EC terminals may form to innervate new GCs. In this case, increasing neurogenesis would increase the total number of synapses over time but the synapses per individual mature GC would remain constant. (C2). Alternatively, new GCs may take over existing EC synapses from surrounding mature GCs. In this case, the total number of synapses would remain constant over time and the number of synapses per mature GC would decrease. The reduced synaptic input to mature GCs in BaxKOim mice coupled with the apparent lack of change in total synapses (Figures 1–3) supports the synaptic redistribution model.
Figure 9—figure supplement 1

Quantitative simulation of synaptic transfer.
Graphic representation of a quantitative simulation of synapse redistribution between mature and integrating new GCs. Control (left) and BaxKOim (right) conditions are illustrated at progressive time points (7, 21, 35 and 42 days), with t = 0 being the day of tamoxifen-induced Cre recombination. There is a static number of EC synapses defined at the beginning of the simulation, and synapses occupied by mature or immature GCs are portrayed as a percent of the total. Proliferation rate multiplied by survival determines the number of new GCs incorporating into the network on each day. As immature GCs age, they each increase in synaptic connectivity represented as the number of synapses relative to mature GCs. The sum of the number of immature GCs at each age multiplied by their number of synapses determines the number of synapses appropriated by the immature population. The proliferation rate decreases with age in both control and BaxKOim conditions, and BaxKO GCs have both increased survival and increased synaptic integration. See Materials and methods for additional parameters.
Author response image 1
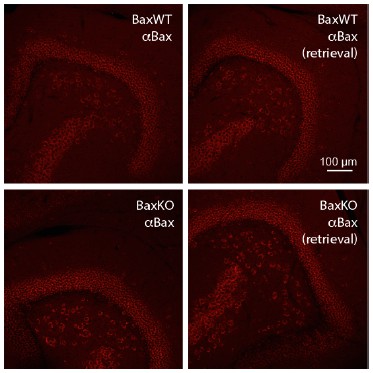
Bax immunostaining from WT slices (top) and germline BaxKO slices (bottom), using both standard (left) and antigen-retrieval methods (right).
We are unaware of an antibody that reliably identifies Bax in hippocampal slices.
Author response image 2

Examples from six randomly selected experiments showing FV versus stimulus intensity relationships.
Although the average graph (bottom right) suggests saturation of FVs around 200 µV (dotted line), the individual experiments reveal high variability in maximum FVs and saturation points (bottom left). We monitored saturation during each experiment and stopped stimulating when saturation was apparent (i.e. slice A,D,E).
Author response image 3
Download links
A two-part list of links to download the article, or parts of the article, in various formats.
Downloads (link to download the article as PDF)
Open citations (links to open the citations from this article in various online reference manager services)
Cite this article (links to download the citations from this article in formats compatible with various reference manager tools)
Adult-born neurons modify excitatory synaptic transmission to existing neurons
eLife 6:e19886.
https://doi.org/10.7554/eLife.19886


