PKCθ links proximal T cell and Notch signaling through localized regulation of the actin cytoskeleton
- University of Bristol, United Kingdom
Figures
Figure 1 with 1 supplement
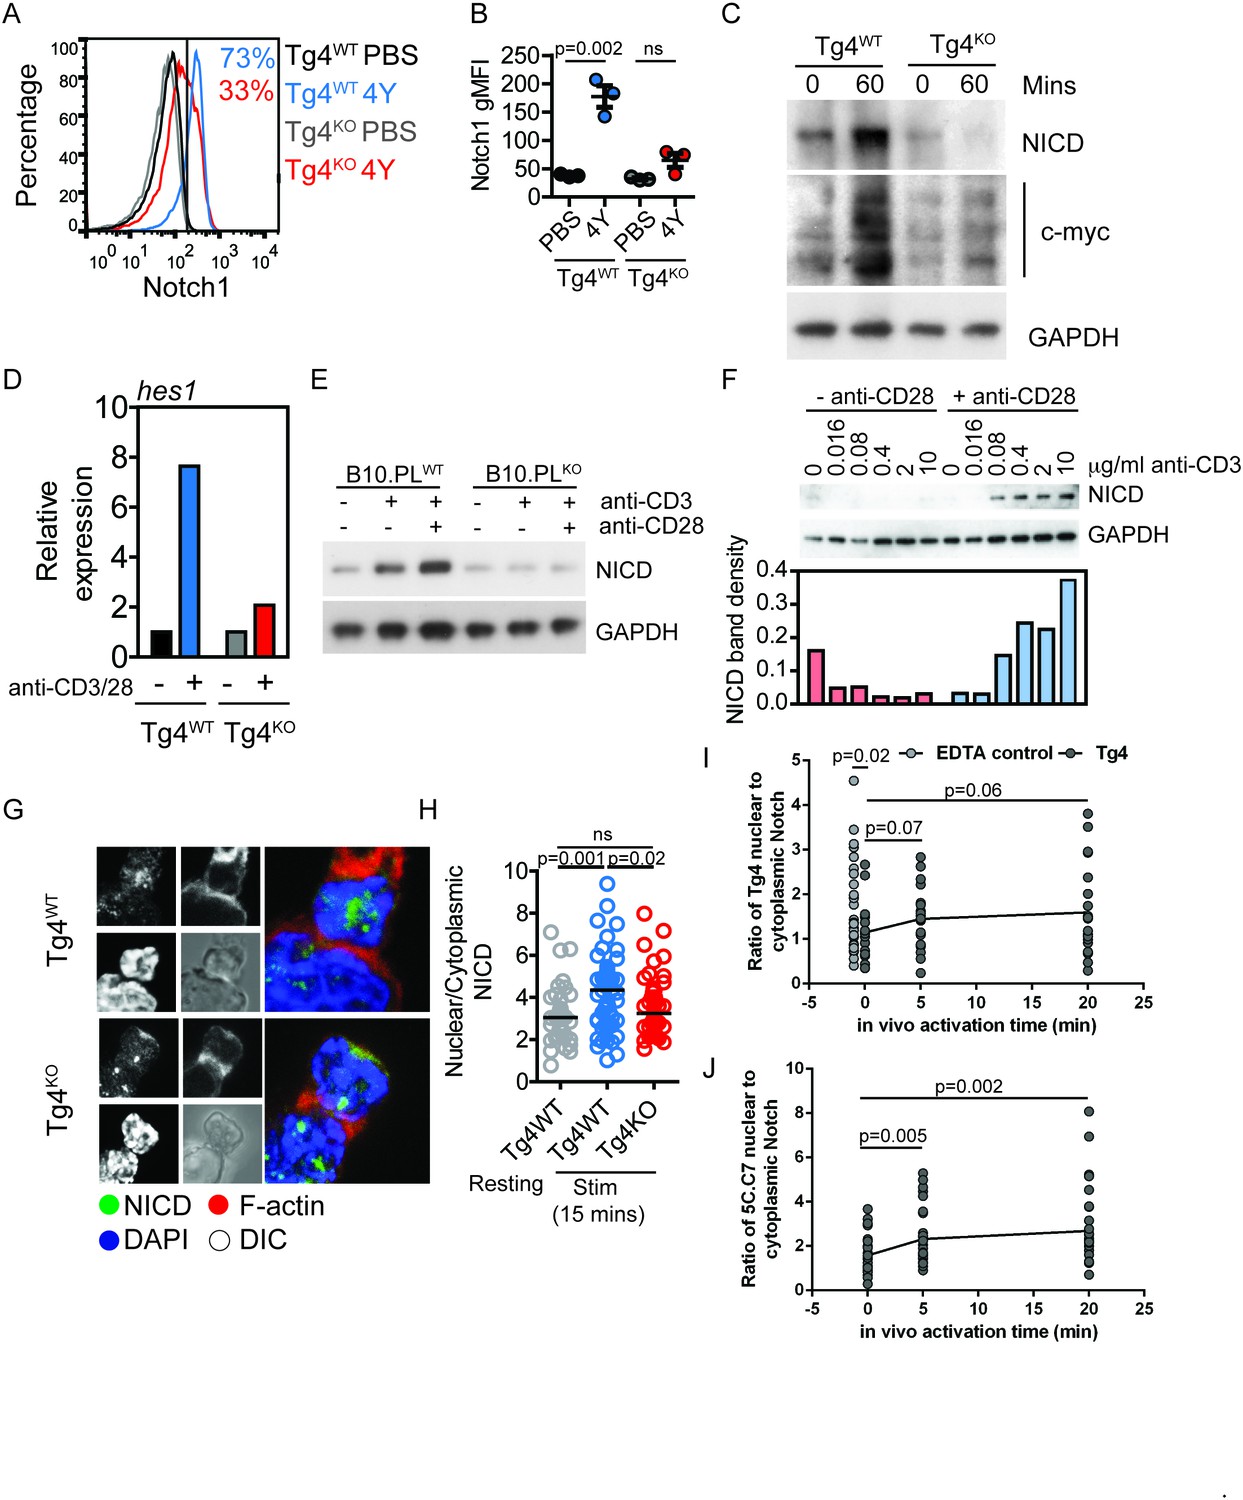
PKCθ enhances antigen-induced Notch activation.
(A) Tg4WT and Tg4KO mice were injected subcutaneously with 80 µg of MBPAc1-9[4Y] peptide or PBS. After 18 hr splenocytes were immunostained to assess intracellular Notch1 expression and analyzed by flow cytometry. Gated on live, CD4+ cells. (B) The expression (geometric mean fluorescence intensity, gMFI) of intracellular Notch1 in CD4+ T cells from spleens of Tg4WT and Tg4KO mice treated as in A is shown as the mean ± SEM. **p=0.002, ns p=0.06 (ANOVA). One experiment of 2, n = 3 mice per condition. (C) Tg4WT and Tg4KO mice were injected subcutaneously with 80 µg of MBPAc1-9[4Y] peptide or PBS. CD4+ T cells were isolated from the spleen after 60 min by MACS and protein extracts analyzed by Western blotting with anti-NICD, anti c-myc and GAPDH. One representative Western blot of three. (D) Naïve Tg4WT and Tg4KO CD4+ T cells were isolated from splenocytes and stimulated with plate-bound anti-CD3 and anti-CD28 for 30 min. Expression of Hes1 was determined by RT-PCR. One representative experiment of four. (E) Naïve CD4+ T cells were isolated from B10.PL PKCθ WT or KO splenocytes by magnetic selection and stimulated for 18 hr with plate-bound anti-CD3 and anti-CD28 as indicated. An equal amount of protein extract from each sample was analyzed for expression of the NICD and GAPDH by Western blotting. (F) Naïve CD4+ T cells isolated from Tg4WT and Tg4KO mice were stimulated for 18 hr with a titration of plate-bound anti-CD3 ±2 µg/ml anti-CD28, as indicated. Expression of NICD and GAPDH was assessed by Western blotting. One representative Western blot of two. (G, H) Tg4WT and Tg4KO T cell blasts were incubated for 15 min with [4Y]-loaded PL8 cells before fixation and immunostaining against the IC domain of Notch1. The cells were counterstained with phalloidin and DAPI before imaging by confocal microscopy. The proportion of NICD staining in the nucleus (defined by DAPI staining) and the cytoplasm (defined by phalloidin staining) was measured and the ratio of nuclear:cytoplasmic NICD calculated. **p=0.0014, *p=0.02, ns p=0.2 (ANOVA). 32–58 cells analyzed per condition, combined data from two independent experiments. (I) Tg4WT mice were injected subcutaneously with 80 µg of MBPAc1-9[4Y] peptide or PBS. CD4+ T cells were isolated from the spleen after 5 or 20 min by MACS, fixed and immunostained against the IC domain of Notch1. The ratio of nuclear:cytoplasmic NICD is given. T cell treatment with 2 mM EDTA serves as a positive control of Notch activation. The difference between the 0 min time point and the EDTA control is significant with p=0.02 (ANOVA). One representative experiment of 4. (J) 5C.C7 mice were injected subcutaneously with 80 µg of MCC (89–103) peptide or PBS. CD4+ T cells were isolated from the spleen after 5 or 20 min by MACS, fixed and immunostained against the IC domain of Notch1. The ratio of nuclear:cytoplasmic NICD is given. Differences between the 0 versus 5 and 20 min time points are significant with p=0.005/0.002, respectively (ANOVA). One representative experiment of 3.
Figure 1—figure supplement 1
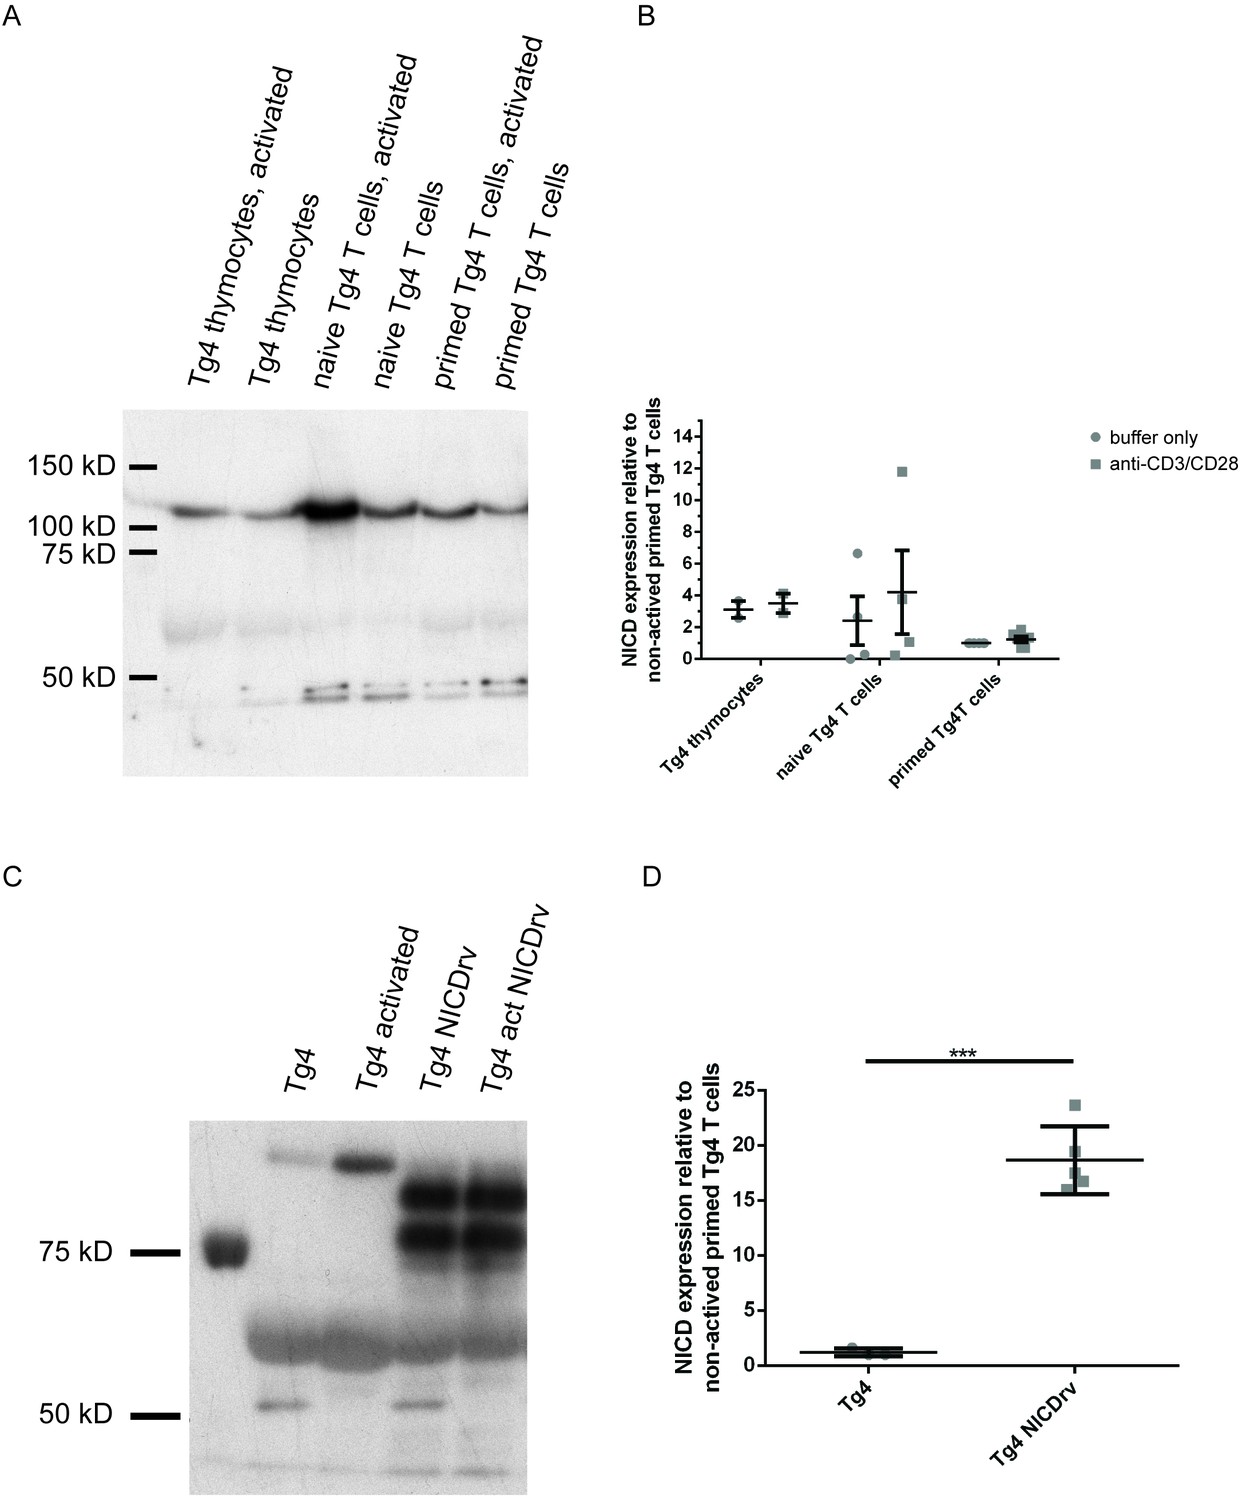
NICD expression is comparable across Tg4 thymocytes, naïve and primed T cells and substantially enhanced upon retroviral expression.
A is a representative NICD Western blot of protein extracts from Tg4WT T cells stimulated or not with plate-bound anti-CD3 and anti-CD28 for 1 hr. (B) Data from four experiments are presented. (C) Tg4WT T cells were retrovirally transduced to express the NICD in parallel with GFP as a sorting marker and GFP positive and negative T cells were analyzed. The retrovirally expressed NICD is slightly smaller than the NICD generated by γ-secretase processing, consistent with the upper band in the NICDrv lanes. The molecular identity and functional capacity of the lower band is uncertain. Both bands are included in the quantification in D. (D) Given is the quantification of three independent experiments, as in C, representing the mean expression of the NICD relative to that in non-activated primed Tg4WT T cells ± SEM. Differences between NICD expression in Tg4WT and Tg4KO T cells were not significant (19 ± 2.5 fold versus 18.5 ± 1 fold) and data were therefore pooled. *** indicates p<0.001 as determined by Student’s t-test.
Figure 2 with 1 supplement
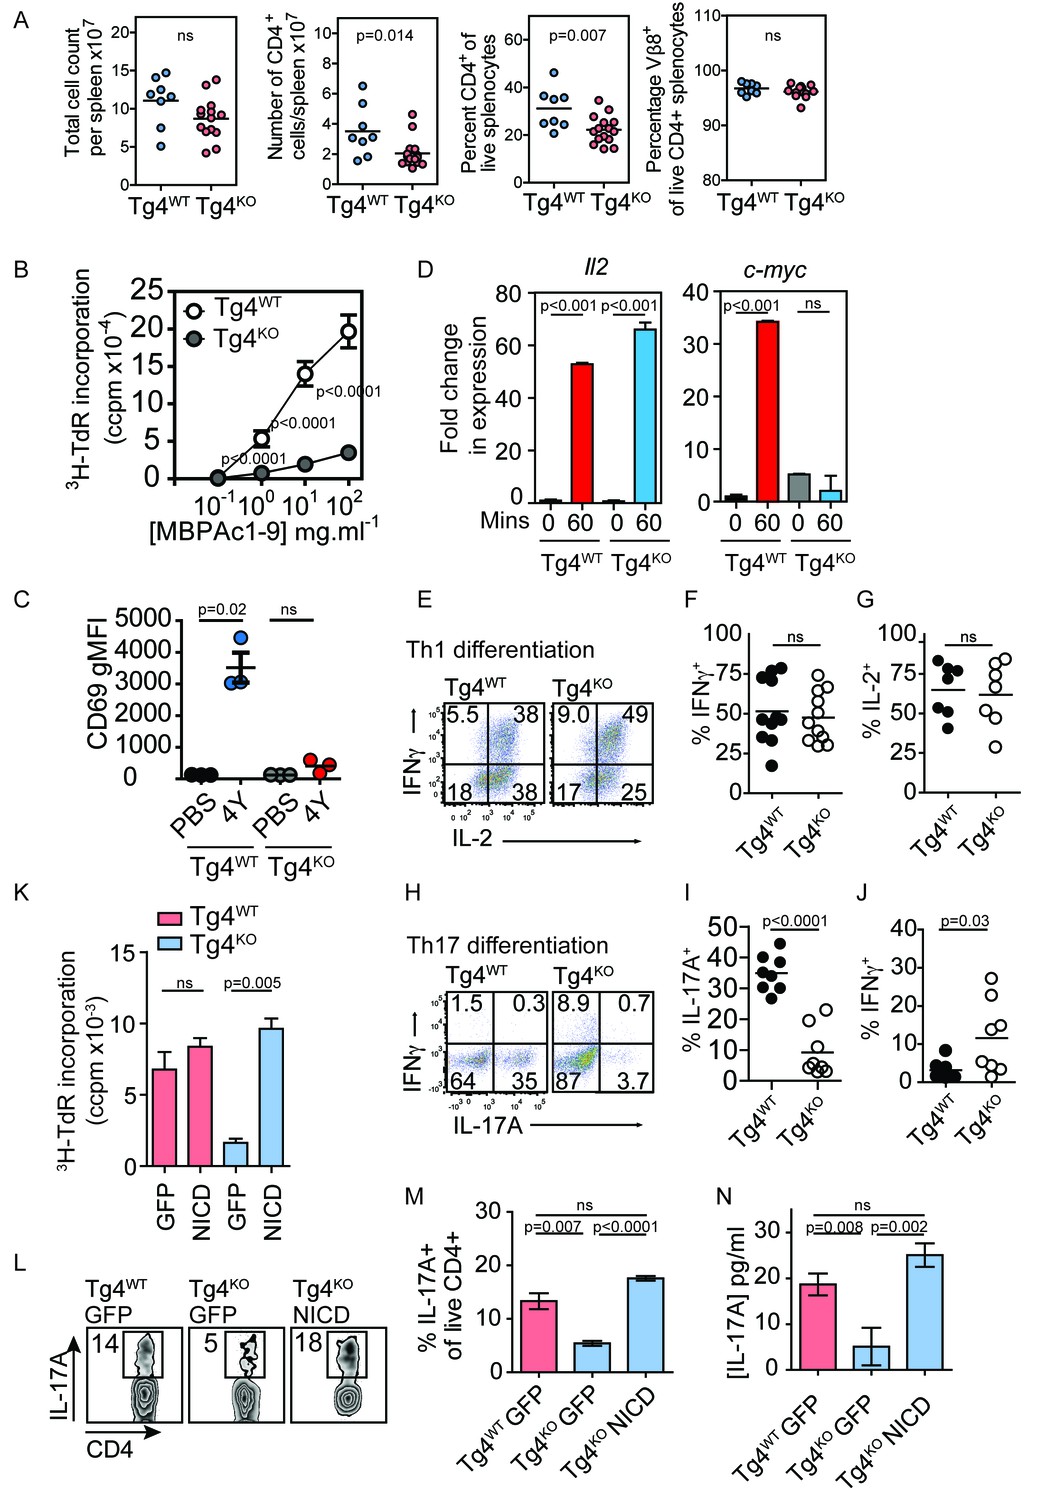
Constitutively active Notch rescues defective proliferation, Th17 polarization and IL-17A secretion in PKCθ deficient T cells.
(A) Splenocytes from Tg4WT and Tg4KO mice were stained for the indicated molecules and absolute cell numbers or percentages are given as indicated. Each data point represents one mouse. Data are combined from mice assayed across three experiments. As previously reported (Gupta et al., 2008; Sun et al., 2000) in non-TCR transgenic mouse strains, PKCθ deficiency in Tg4 mice resulted in a reduced number and proportion of CD4+ T cells. p values by Student’s unpaired two-tailed t-test. (B) The proliferation of naïve Tg4WT and Tg4KO CD4+ T cells stimulated with irradiated B10.PL splenocytes and a titration of MBPAc1-9[4K] is given. n = 8 Tg4WT, n = 15 Tg4KO mice, each assayed in triplicate for each peptide concentration. Shown is the mean ± SEM. ****p<0.0001 by Student’s unpaired two-tailed t-test. (C) Naïve Tg4WT and Tg4KO mice were injected subcutaneously with 80 µg of MBPAc1-9[4Y] peptide or PBS. After 18 hr splenocytes were immunostained to assess CD69 expression and analyzed by flow cytometry. Gated on live, CD4+ cells. The mean expression (geometric mean fluorescence intensity, gMFI) ± SEM of CD69 is given. ns p=0.08. One experiment of 2, n = 3 mice per condition. (D) Tg4WT or Tg4KO mice were injected subcutaneously with 80 µg [4Y] peptide. After 60 min, CD4+ splenocytes were isolated by MACS, RNA was isolated and the expression of c-myc and IL-2 determined by RT-PCR. n = 3 mice per condition, shown is mean ± SEM. ns = 0.68 by unpaired Student’s t-test. (E–G) Splenocytes from Tg4WT or Tg4KO mice were stimulated with 10 µg/ml [4K] peptide, IL-12 and IL-2 for 7–9 days before restimulation with PMA and ionomycin in the presence of monensin. The proportion of IFNγ and IL-2-producing CD4+ T cells was determined by intracellular cytokine staining. Shown are representative FACS plots, gated on live, CD4+ cells and the combined data from all replicates shown as mean ± SEM n = 7–11 independent biological replicates ns = 0.71 (F) and 0.73 (G) by unpaired Student’s t-test. (I–J) Splenocytes from Tg4WT or Tg4KO mice were stimulated with 10 µg/ml [4K] peptide, IL-6, IL-1β, IL-23, anti-IFNγ and anti-IL-4 for 7–9 days before restimulation with PMA and ionomycin in the presence of monensin. The proportion of IFNγ and IL-17A-producing CD4+ T cells was determined by intracellular cytokine staining. Shown are representative FACS plots, gated on live, CD4+ cells and the combined data from all replicates shown as mean ± SEM. n = 8 independent biological replicates, p<0.0001 (I) p=0.03 (J) by Student’s t-test. (K) Splenocytes from Tg4WT and Tg4KO mice were stimulated with [4K] peptide and IL-2 before transduction with a retrovirus encoding NICD and GFP or GFP alone. After 72 hr the incorporation of 3H thymidine was measured. n = 3 replicate transductions per condition, mean values ± SEM. *** = 0.0005, ns = 0.31. One representative experiment of four. (L, M) Splenocytes from Tg4WT and Tg4KO mice were stimulated with [4K] peptide in the presence of IL-6, IL-1β, TGFβ and IL-23 before transduction with a retrovirus encoding NICD and GFP or GFP alone. After 96 hr of further culture with IL-6, IL-1β, TGFβ and IL-23 the cells were restimulated with PMA and ionomycin in the presence of monensin before intracellular staining for the expression of IL-17A. (L) shows representative FACS data. The mean ± SEM of three replicates from one experiment of four is shown in M. ns = 0.06 by Student’s t-test. (N) The mean concentration of IL-17A was measured in supernatants from triplicate cultures of Tg4WT and Tg4KO cells T cells transduced with NICD or GFP alone under Th17-polarising conditions. p values by Student’s t-test. One representative experiment of three.
Figure 2—figure supplement 1
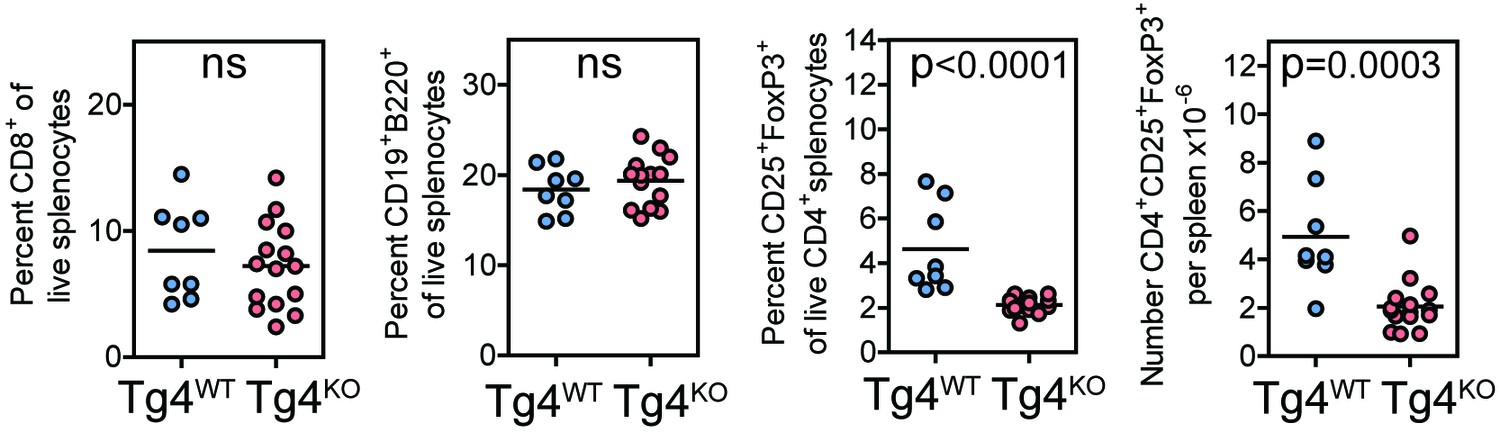
Tg4KO mice display largely unperturbed immune cell distributions.
Splenocytes from Tg4WT and Tg4KO mice were stained for the indicated molecules and absolute cell numbers or percentages are given as indicated. Each data point represents one mouse. Data are combined from mice assayed across three experiments. As previously reported (Gupta et al., 2008; Sun et al., 2000) in non-TCR transgenic mouse strains, PKCθ deficiency in Tg4 mice resulted in no defect in the proportion of peripheral CD8+ T cells or B cells but did result in a reduced number of FoxP3+ Treg.
Figure 3 with 2 supplements

PKCθ mediates transient actin-dependent recruitment of ADAM10 to the T cell lamellum.
(A) Tg4WT CD4+ T cells, treated with 40 nM Jasplakinolide (bottom) or not (top), and Tg4KO (middle) CD4+ T cells expressing ADAM10-GFP were activated with PL8 cells presenting the Ac1-9[4Y] peptide. Given are representative images showing pseudocolored (purple to red) maximum projections of the ADAM10-GFP fluorescence and a reference DIC bright field image at times relative to the formation of a tight couple between T cell and APC. The entire image sequences are given in Video 1 (Tg4WT) and 2 (Tg4KO). (B) The graph shows the percentage of T cells with lamellal accumulation of ADAM10-GFP at the time relative to couple formation ± SEM. Differences in lamellal accumulation between Tg4WT and Tg4KO and Jasplakinolide-treated Tg4WT T cells at time points 0:00 and 0:20 were each significant with p≤0.005 (Tg4KO versus Tg4WT 0:00 p=0.001, 0:20 p=0.005; Tg4WT +Jasp versus Tg4WT 0:00 p=0.004, 0:20 p=0.001, by proportions z-test). 18–28 cell couples were analyzed per condition (57 total). Full pattern analysis is given in Figure 3—figure supplement 1A. (C) CD4+ blasts from Tg4WT and Tg4KO mice (four days after stimulation) were restimulated for 18 hr with anti-CD3 and anti-CD28 ±40 nM Jasplakinolide or left unstimulated as indicated. NICD and GAPDH expression in protein extracts was measured by Western blotting. One representative experiment of three. (D) Tg4WT and Tg4KO CD4+ T cells expressing F-tractin-GFP were activated with PL8 cells presenting the Ac1-9[4Y] peptide. Representative images are given as in A. The entire image sequences are given in Video 3 (Tg4WT) and 4 (Tg4KO). (E) The percentage of cell couples with predominantly peripheral F-tractin-GFP accumulation is given as in B. The difference in peripheral accumulation between Tg4WT and Tg4KO T cells at joint time points 0:00 and 0:20 was significant (p=0.01 by proportions z-test, 31, 47 cell couples were analyzed per condition). Full pattern analysis is given in Figure 3—figure supplement 2A. (F) An example image of a T cell exhibiting the ‘bottleneck’ phenotype, defined as having a diameter minimum between the interface and the widest part of the cell body, is given as a grey scale F-tractin-GFP maximum projection together with a matching DIC bright field image. Measurement positions to determine the interface width (yellow) relative to the cell body (red) or the presence of a necking phenotype (blue) are shown. (G) The relative interface diameter was determined by relating the interface diameter to the widest part of the cell body and is given relative to the time of tight cell coupling. Shown is the mean ratio ± SEM. ns p=0.33 (0 s) and 0.149 (20 s) by unpaired, two-tailed Student’s t-test. 49 (WT) 35 (KO) cell couples were analyzed per condition. (H) The percentage of T cells displaying a bottleneck phenotype in at least one timepoint during the first 60 s after coupling is given. ***p<0.001 by proportions z-test. 35 cell couples were analyzed per condition.
Figure 3—figure supplement 1
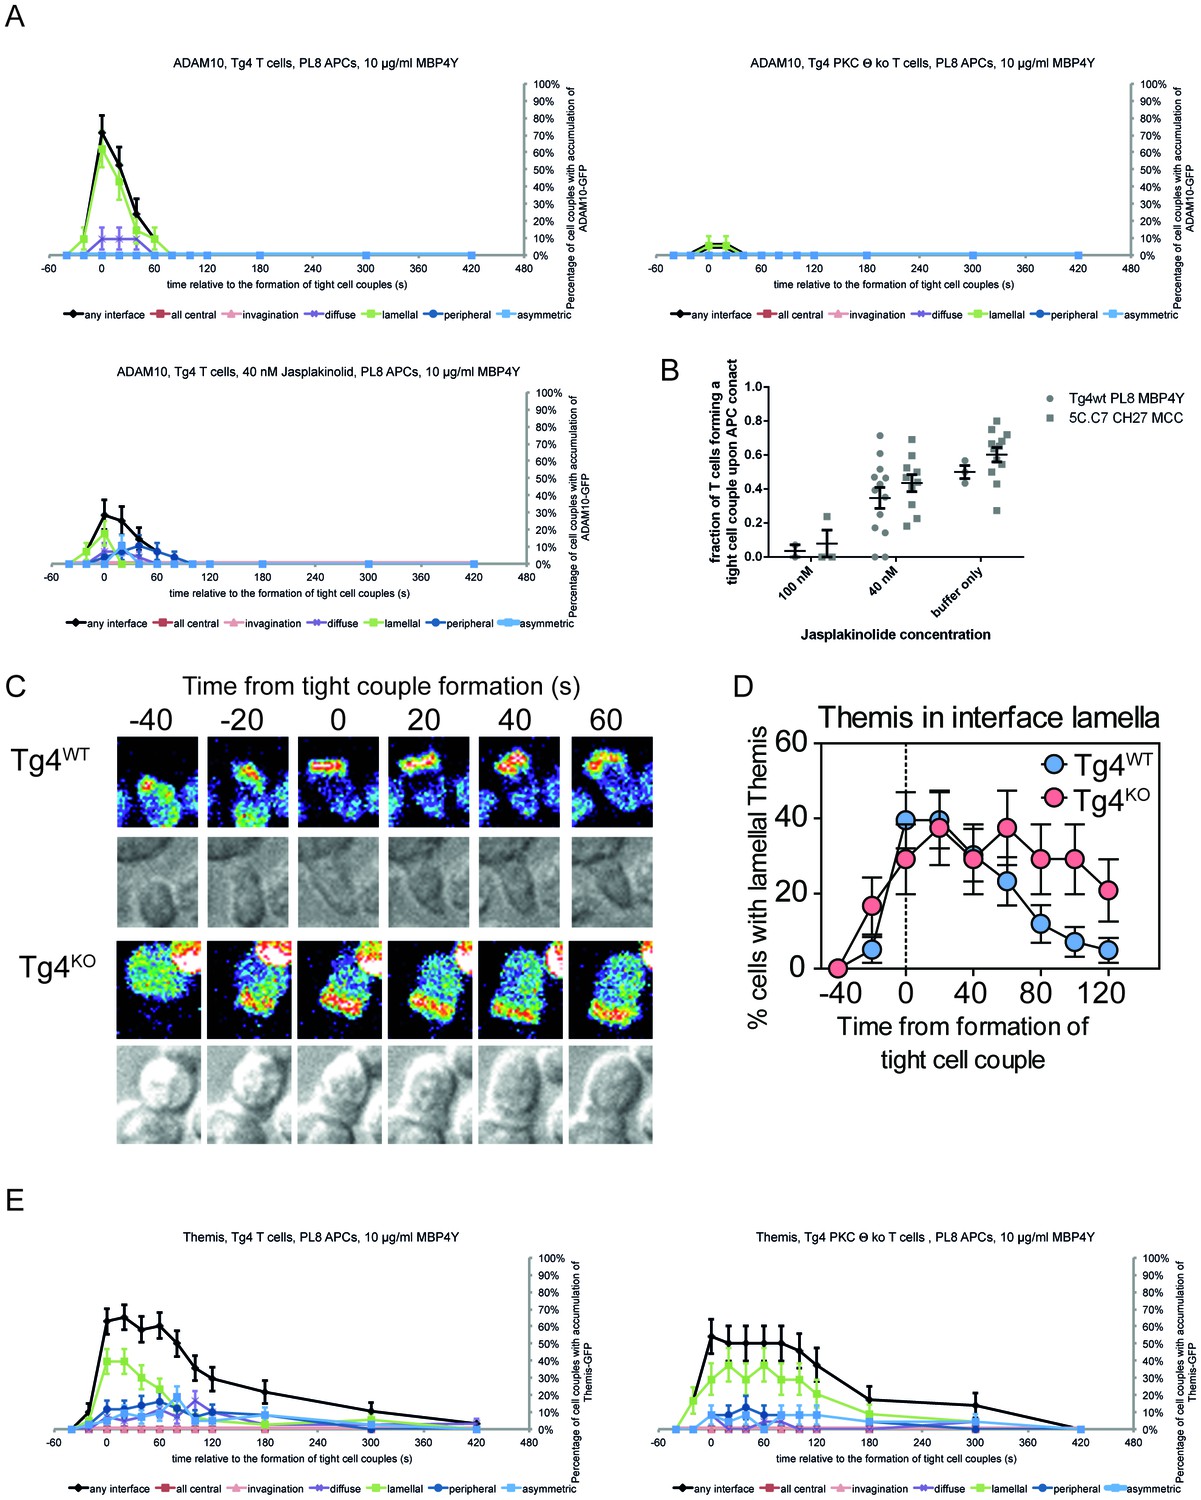
PKCθ enables transient recruitment of ADAM10 to the T cell lamellum.
(A) For the ADAM10-GFP experiments displayed in Figure 3A,B the proportion of T cells with accumulation in one of the six interface patterns at the time relative to couple formation is given ± SEM. (B) Given are fractions of T cells forming a tight cell couple upon contact with an activating APC in the presence of Jasplakinolide at the indicated concentrations for Tg4WT T cells activated with PL8 APCs presenting the Ac1-9[4Y] peptide and 5C.C7 T cells activated with CH27 APCs presenting the MCC peptide (5C.C7 data are taken from [Roybal et al., 2015a]). Differences in cell coupling between Tg4WT and 5C.C7 T cells at each Jasplakinolide concentration were not significant. The cell coupling data establish that Tg4 and 5C.C7 T cells respond comparably to increasing concentrations of Jasplakinolide. The extensive characterization of the effect of 40 nM Jasplakinolide on T cell actin dynamics in (Roybal et al., 2015a) thus applies to the Tg4WT T cells. (C) Tg4WT and Tg4KO CD4+ T cells expressing Themis-GFP were activated with PL8 cells presenting the Ac1-9[4Y] peptide. Representative images are given as in Figure 3A. (D) The percentage of cell couples with predominantly lamellal Themis-GFP accumulation is given as in Figure 3B. Differences in lamellal accumulation between Tg4WT and Tg4KO T cells are not significant (p>0.05). 43, 24 cell couples were analyzed per condition. Full pattern analysis is given in D. (E) For the experiments displayed in B, C the proportions of T cells with accumulation in one of the six interface patterns at the time relative to couple formation are given ± SEM.
Figure 3—figure supplement 2
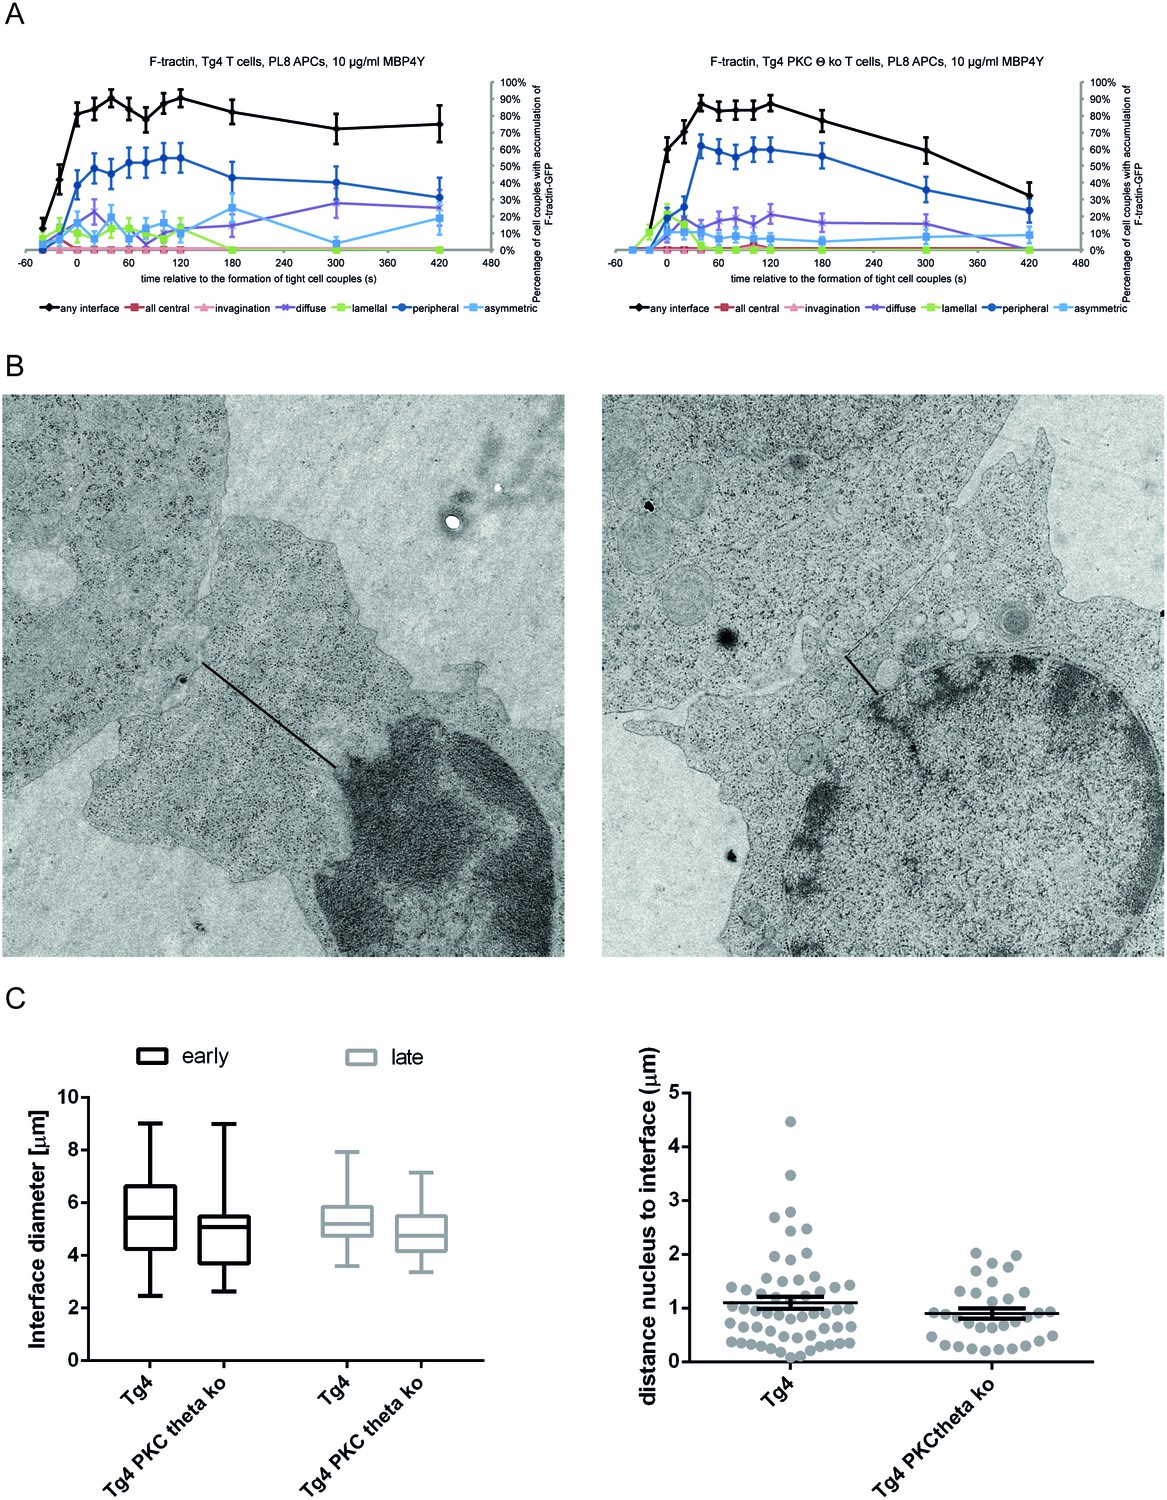
PKCθ enhances interface actin dynamics.
(A) For the F-tractin-GFP experiments displayed in Figure 3D,E the proportions of T cells with accumulation in one of the six interface patterns at the time relative to couple formation are given ± SEM. (B) Representative electron micrographs of Tg4WT and Tg4KO CD4+ T cell:PL8 APC interactions are given. The left image is representative of a large lamellum, the right one of a short and substantially ‘necked’ one. The black lines indicate the distance between the interface and the nucleus as displayed in C. (C) Quantification of electron micrographs is given. On the left, the interface diameters are shown at an early (less than 2 min after cell coupling) and late (3–5 min) time point as a box and whisker plot. Across both time points interface diameters are significantly smaller (p=0.05) in Tg4KO CD4+ T cells. 19 to 62 cell couples were analyzed per time point and condition (total 155). On the right, for the same cell couples the distances between the nucleus and the interface are given as mean ± SEM.
Figure 4 with 1 supplement
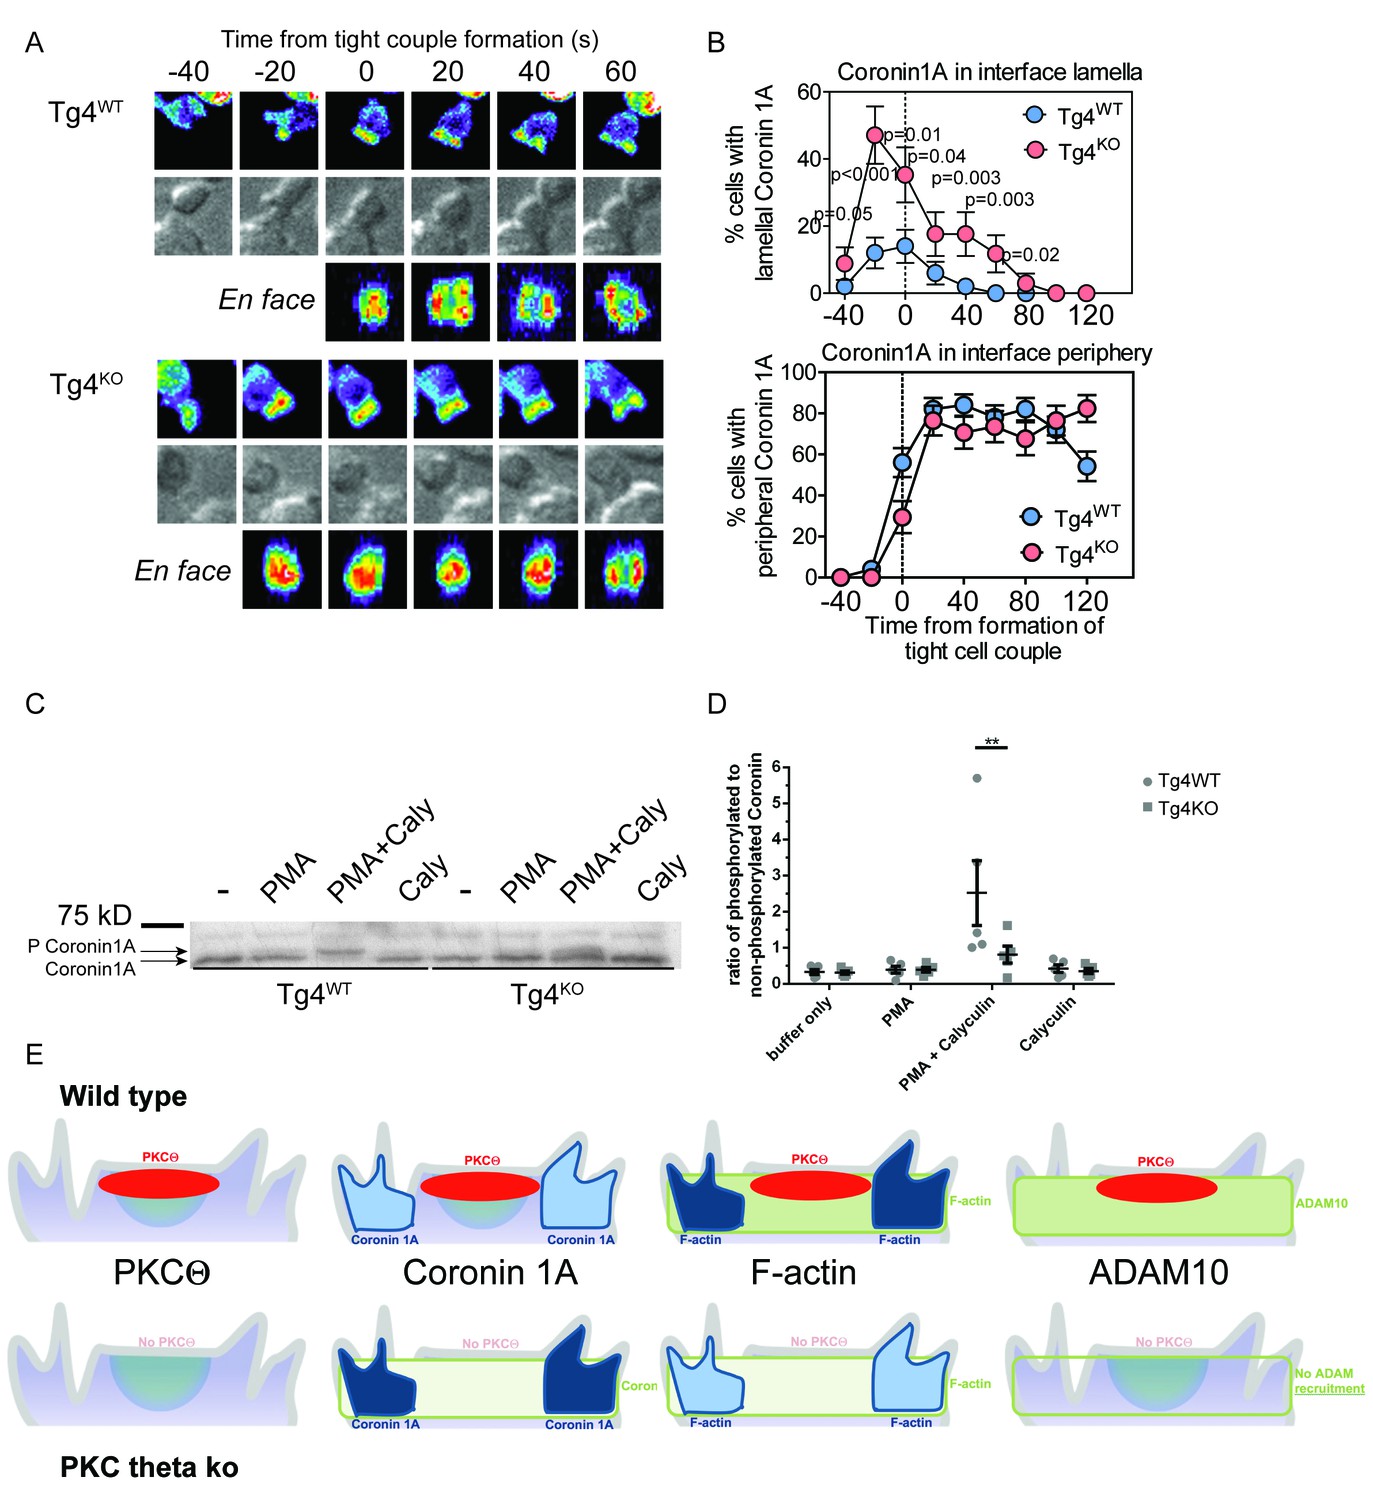
PKCθ phosphorylates and localizes Coronin1A.
(A) Tg4WT and Tg4KO T cell expressing coronin1A-GFP were activated with PL8 cells presenting the Ac1-9[4Y] peptide. Representative images are given as in Figure 3A. The entire image sequences are given in Video 5 (Tg4WT) and 6 (Tg4KO). (B) The percentage of cell couples with predominantly lamellal (top) and peripheral (bottom) Coronin1A-GFP accumulation is given as in Figure 3B. The differences in lamellal accumulation between Tg4WT and Tg4KO T cells at time points −40 to 80 were each significant with p≤0.05 by proportions z-test. 50, 34 cell couples were analyzed per condition. Full pattern analysis is given in Figure 4—figure supplement 1A. (C) Shown is a representative Phos-tag western blot of protein extracts from Tg4WT or Tg4KO T cells stimulated with PMA and/or Calyculin A (Caly) for 5 min as probed with anti-coronin1A. (D) Given is the quantification of four independent experiment as in C as the mean ratio of the top (phospho) and lower (non-phospho) Coronin 1A bands ± SEM. * indicates p<0.05 Tg4WT versus Tg4KO T cells by two-way ANOVA with Sidak’s correction for multiple comparisons. (E) A graphical summary of the proposed mechanism of the enhancement of Notch activation by PKCθ is given. The top and bottom rows illustrate Tg4WT or Tg4KO T cells, respectively. Each individual panel shows the interface part of the T cell that contacts the APC (not shown on top). Separate panels are drawn from left to right for PKCθ (as also included in the other panels), Coronin1A, F-actin and ADAM10. Colors denote preferential accumulation patterns, central (red), lamellal (green) and peripheral (blue). Shade of color denotes the extent of accumulation.
Figure 4—figure supplement 1
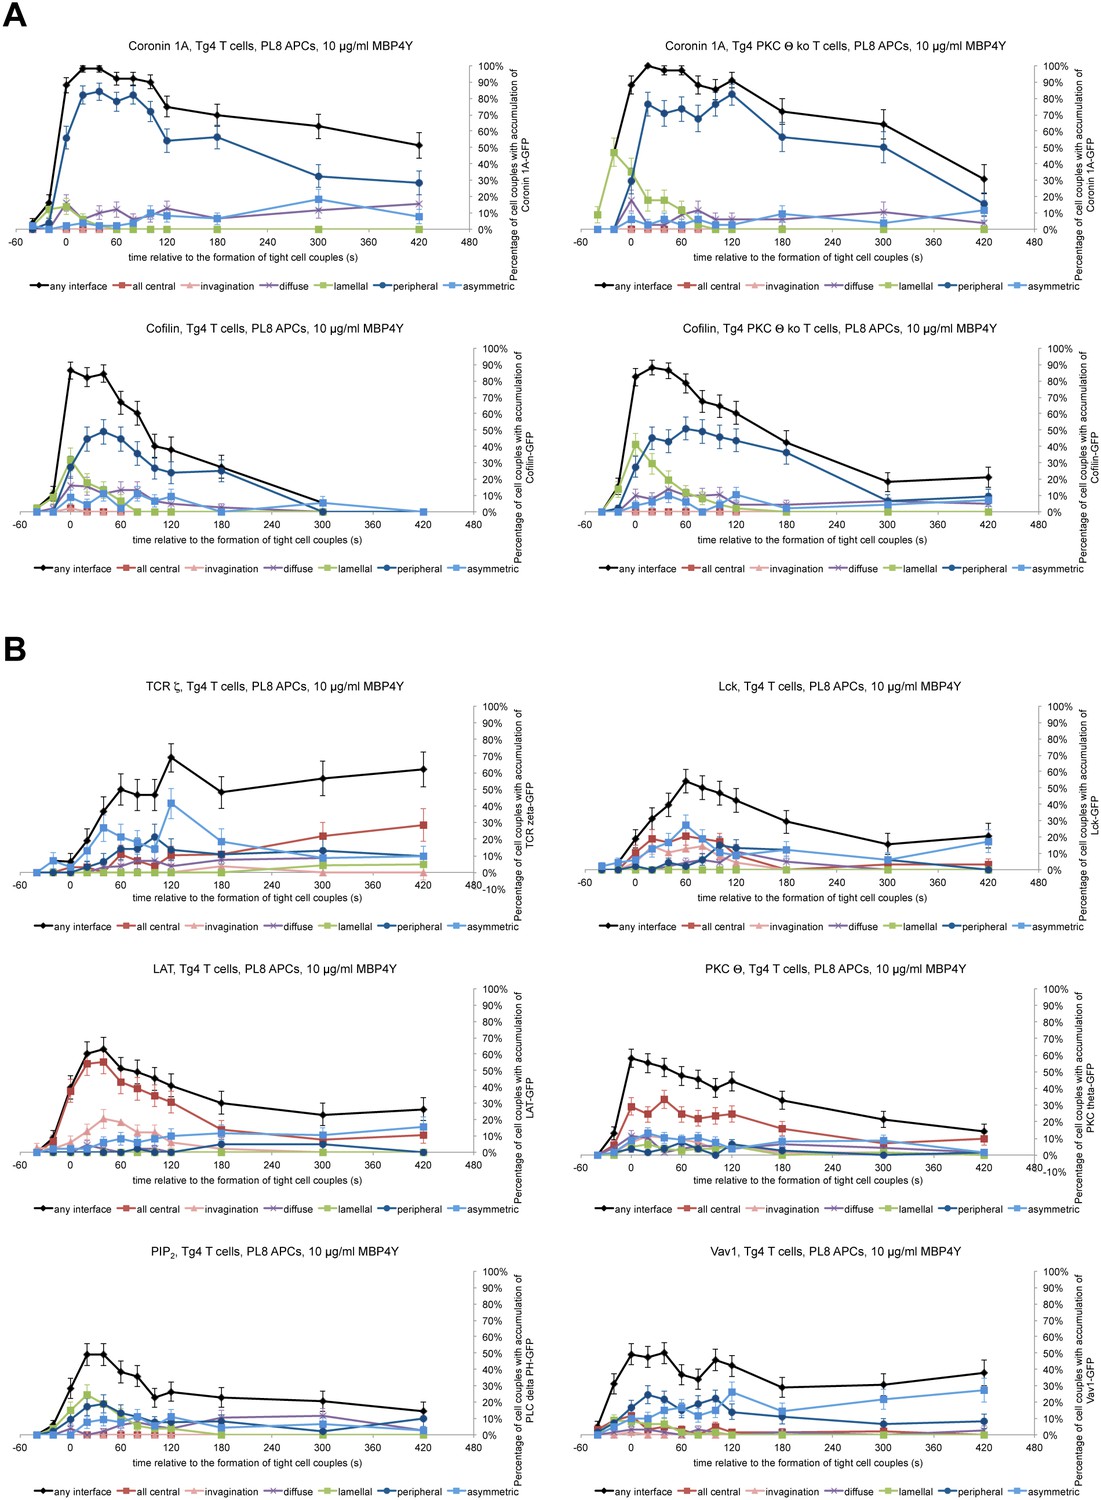
Interface recruitment of signaling intermediates peaks within the first three minutes in Tg4KO CD4+ T cells.
(A) In the top row, for the Coronin1A-GFP experiments displayed in Figure 4A,B the proportions of T cells with accumulation in one of the six interface patterns at the time relative to couple formation are given with SEM. In the bottom row Tg4WT and Tg4KO T cell expressing Cofilin-GFP were activated with PL8 cells presenting the Ac1-9[4Y] peptide and pattern distributions are given. 45, 51 cell couples were analyzed per condition. (B) Tg4WT T cell expressing the indicated sensors was activated with PL8 cells presenting the Ac1-9[4Y] peptide and pattern distributions are given. 31 (TCRζ-GFP), 48 (Lck-GFP), 49 (LAT-GFP), 79 (PKCθ-GFP, a representative image sequence is given as Video 7), 53 (PLCδ PH-GFP for PIP2), and 61 (Vav1-GFP) cell couples were analyzed (321 total).
Videos
Video 1
ADAM10-GFP accumulates rapidly and transiently at the interface between Tg4WT CD4+ T cells and PL8 APCs.
A representative interaction of a Tg4WT CD4+ T cell expressing ADAM10-GFP with a PL8 APC presenting the Ac1-9[4Y] peptide is shown. Top: DIC images. Bottom: Top-down maximum projections of 3D fluorescence data are shown in a rainbow-like, false-color intensity scale (increasing from blue to red). 20 s intervals in video acquisition are played back as two frames per second. Tight cell coupling occurs in frame 3 (1 s indicated video time).
Video 2
ADAM10-GFP does not accumulate at the interface between Tg4KO CD4+ T cells and PL8 APCs.
A representative interaction of a Tg4KO CD4+ T cell expressing ADAM10-GFP with a PL8 APC presenting the Ac1-9[4Y] peptide is shown as in Video 1. Tight cell coupling occurs in frame 5 (2 s indicated video time).
Video 3
F-tractin-GFP accumulates rapidly at the interface between Tg4WT CD4+ T cells and PL8 APCs.
A representative interaction of a Tg4WT CD4+ T cell expressing F-tractin-GFP with a PL8 APC presenting the Ac1-9[4Y] peptide is show as in Video 1. Tight cell coupling occurs in frame 6 (4 s indicated video time). Immediate spreading of the majority of F-actin to the edge of the interface is visible.
Video 4
F-tractin-GFP accumulates rapidly at the interface between Tg4KO CD4+ T cells and PL8 APCs.
A representative interaction of a Tg4KO CD4+ T cell expressing F-tractin-GFP with a PL8 APC presenting the Ac1-9[4Y] peptide is shown as in Video 1. Tight cell coupling occurs in frame 4 (2 s indicated video time). Delayed spreading of the majority of F-actin to the edge of the interface is visible.
Video 5
Coronin1A-GFP accumulates rapidly at the interface between Tg4WT CD4+ T cells and PL8 APCs.
A representative interaction of a Tg4WT CD4+ T cell expressing Coronin1A-GFP with a PL8 APC presenting the Ac1-9[4Y] peptide is shown as in Video 1. Tight cell coupling occurs in frame 4 (2 s indicated video time). Immediate spreading of the majority of Coronin1A-GFP to the edge of the interface is visible.
Video 6
Coronin1A-GFP accumulates rapidly at the interface between Tg4KO CD4+ T cells and PL8 APCs.
A representative interaction of a Tg4KO CD4+ T cell expressing Coronin1A-GFP with a PL8 APC presenting the Ac1-9[4Y] peptide is shown as in Video 1. Tight cell coupling occurs in frame 3 (1 s indicated video time). Transient lamellal accumulation of the majority of Coronin1A-GFP is visible.
Video 7
PKCθ-GFP accumulates at the center of the interface between Tg4WT CD4+ T cells and PL8 APCs.
A representative interaction of a Tg4WT CD4+ T cell expressing PKCθ-GFP with a PL8 APC presenting the Ac1-9[4Y] peptide is shown as in Video 1. Tight cell coupling occurs in frame 4 (2 s indicated video time). Central accumulation of the majority of PKCθ-GFP is visible.
Download links
A two-part list of links to download the article, or parts of the article, in various formats.
Downloads (link to download the article as PDF)
Open citations (links to open the citations from this article in various online reference manager services)
Cite this article (links to download the citations from this article in formats compatible with various reference manager tools)
PKCθ links proximal T cell and Notch signaling through localized regulation of the actin cytoskeleton
eLife 6:e20003.
https://doi.org/10.7554/eLife.20003


