A saturation hypothesis to explain both enhanced and impaired learning with enhanced plasticity
- Stanford School of Medicine, United States
- Stanford University, United States
Figures
Figure 1 with 3 supplements
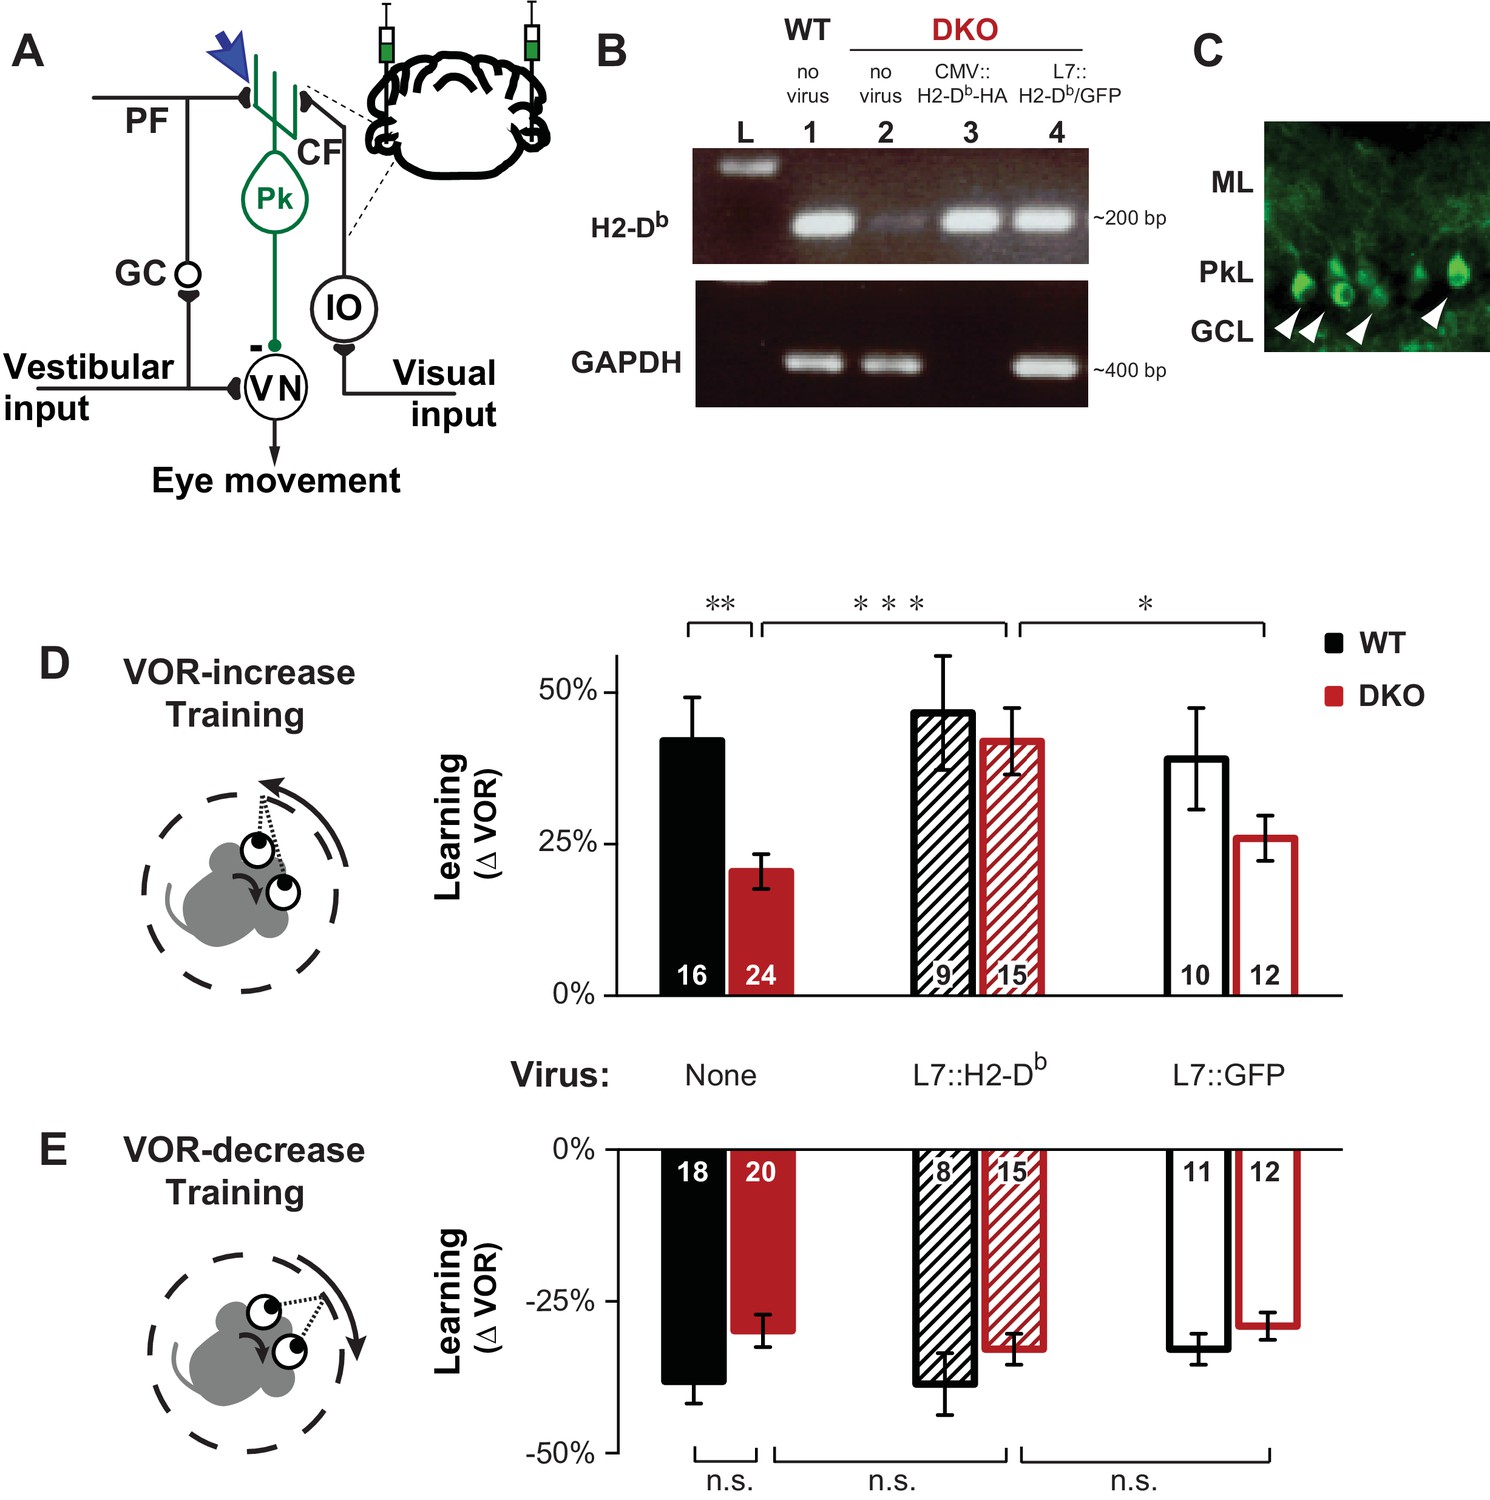
Rescue of H2-Db expression in adult Purkinje cells rescues learning impairment in DKO mice with enhanced cerebellar plasticity.
(A) Circuit for VOR learning. Vestibular input drives eye movements via a direct pathway through the vestibular nuclei (VN), and a side-loop through the granule cells (GC), parallel fibers (PF), and Purkinje cells (Pk) of the cerebellar flocculus. The climbing fiber (CF) input to the Purkinje cells from the inferior olive (IO) carries visual signals, and can trigger LTD in the parallel fiber-to-Purkinje cell synapses (blue arrow), which is enhanced in mice deficient in the Class-I major histocompatibility molecules H2-Kb and H2-Db (KbDb−/−; referred to as double knockout, DKO). A lentiviral construct expressing H2-Db under the control of the Purkinje cell-specific L7 promoter was injected bilaterally into the flocculi of adult mice (see Materials and methods for details). (B) RT-PCR confirmed the presence of H2-Db mRNA in the cerebellar flocculus of DKO mice injected with the L7::H2-Db-T2A-GFP virus (lane 4). Lane 1: Positive control, WT (thalamus); Lane 2: Negative control, DKO (spleen); Lane 3: DKO (flocculus) infected with CMV::H2-Db-HA; Lane 4: DKO (flocculus) infected with L7::H2-Db-T2A-GFP. Ladder in the left lane. (Lane 3, CMV::H2-Db-HA, is a positive control for detection of H2-Db expression in cerebellum, but because it was not restricted to Purkinje cells, it was not used further in this study; GAPDH was not loaded; full details in Materials and methods). (C) Floccular Purkinje cells of DKO mice infected with L7::H2-Db-T2A-copGFP virus (white arrowheads) and stained with anti-copGFP immunohistochemistry. Molecular layer (ML), Purkinje cell layer (PkL), Granule cell layer (GCL). (D) Training to increase the VOR. Left, A vestibular stimulus was paired with oppositely directed visual stimulus motion. Right, DKO mice (solid red) were impaired on VOR-increase learning compared to wild type mice (WT; solid black) (**p=0.004, t(38) = 3.08). Virally-mediated expression of H2-Db in Purkinje cells of the adult cerebellar flocculi (L7::H2–Db) rescued the learning deficit in DKO mice (hatched red; ***p=0.0005, t(37) = 3.81 vs DKO without virus, solid red), so that they learned as well as WT mice injected with the same virus (hatched black; n.s. p=0.65, t(22) = 0.46) and better than DKO mice that received virus expressing only GFP (L7::GFP, open red, *p=0.03, t(25) = 2.290). Virally-mediated expression of H2-Db had no significant effect on learning in the WT mice (hatched vs. solid black, n.s. p=0.70, t(23) = 0.39), and expression of GFP had no effect in DKO mice (open vs solid red; n.s. p=0.26, t(34) = 1.13) or WT mice (open vs. solid black; n.s. p=0.79, t(24) = 0.26). Mean ± s.e.m. In this and all figures, numbers in bars indicate n = number of animals. (E) Training to decrease the VOR. Left, A vestibular stimulus was paired with a visual stimulus that moved with the head. Right, VOR-decrease learning in DKO mice (solid red) was not significantly different from WT (solid black) (n.s. p=0.08, t(36) = 1.86). Expression of H2-Db had no significant effect on VOR-decrease learning in DKO mice (hatched vs. solid red; n.s. p=0.43, t(33) = 0.79), and was not different from mice that received control virus expressing only GFP (hatched vs. open red; n.s. p=0.29, t(25) = 1.08). Mean ± s.e.m.
-
Figure 1—source data 1
Rescue of H2-Db expression in adult Purkinje cells rescue learning impairment in DKO mice with enhanced cerebellar plasticity.
Data show VOR learning, after thirty minutes of either VOR-increase training or VOR-decrease training, for both DKO and WT mice in three different conditions (without virus, with L7::H2-Db virus, or control L7::GFP virus). The eye movement response to the vestibular stimulus alone, i.e. the VOR, was measured in total darkness, and learning was calculated as the percentage change in the VOR gain after training relative the baseline VOR gain measured before training. Positive values indicate increase VOR learning and negative values indicate decrease VOR learning corresponding to the respective training stimuli. Each number corresponds to the learning in an individual animal.
- https://doi.org/10.7554/eLife.20147.004
Figure 1—figure supplement 1
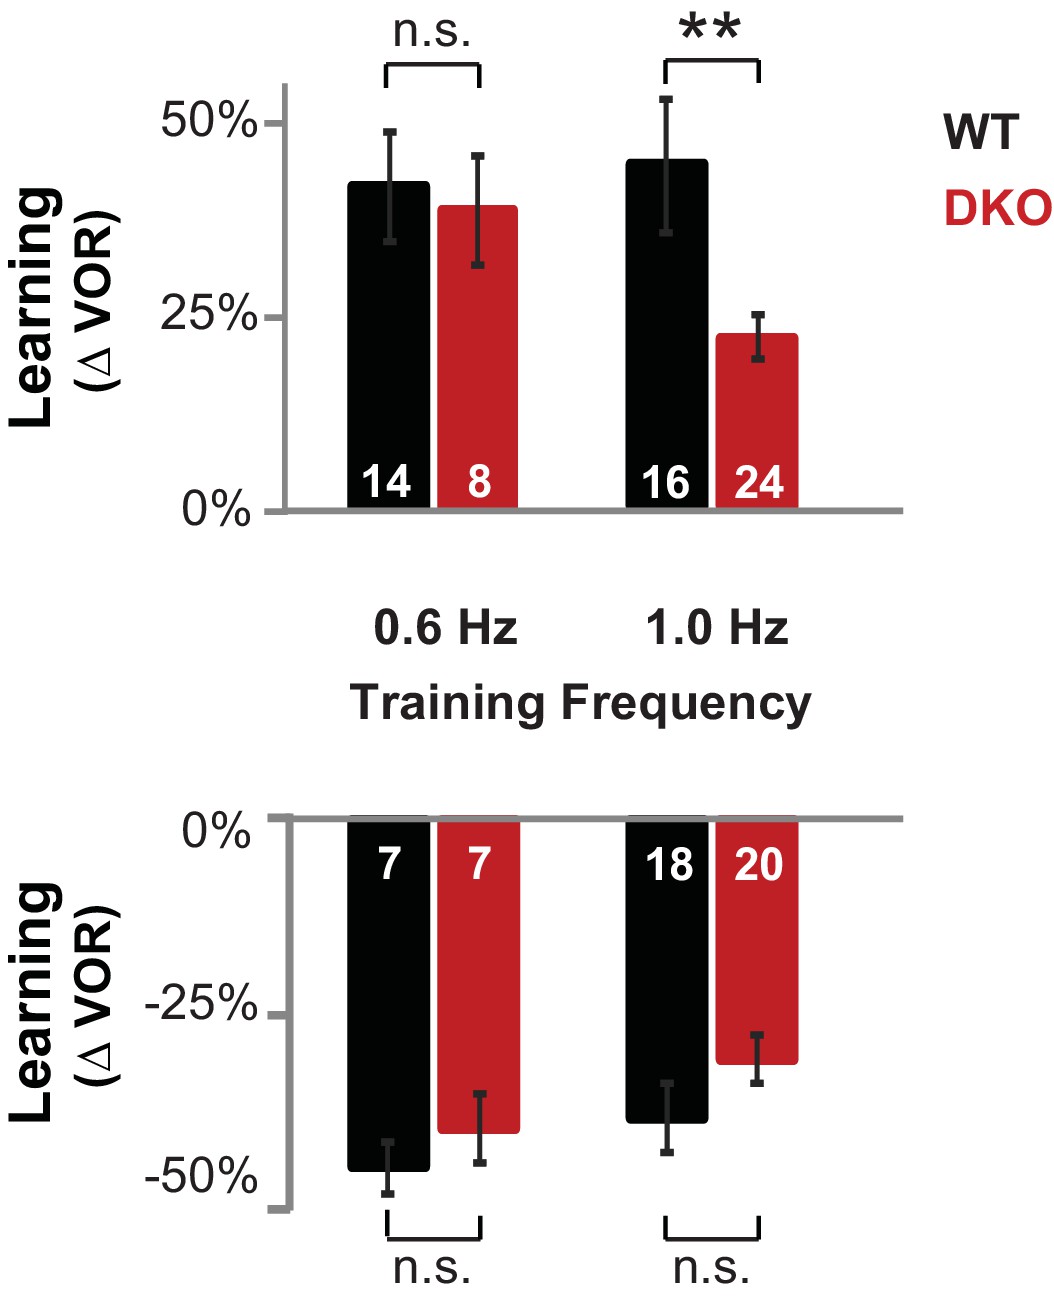
DKO mice were selectively impaired on high-frequency VOR-increase learning.
Top, DKO mice (solid red) were impaired on VOR-increase learning compared to WT mice (solid black) only when training and testing were performed using vestibular and visual stimuli at a stimulus frequency of 1.0 Hz (**p=0.004, t(38) = 3.08), but not 0.6 Hz (p=0.33, t(20) = 1.00). Bottom, VOR-decrease learning in DKO mice was not significantly different from WT at either frequency (0.6 Hz, p=0.43, t(12) = 0.88; 1.0 Hz, p=0.08, t(36) = 1.86). Data for training and testing at 1.0 Hz reproduced from Figure 1D,E. Mean ± s.e.m. Number in bars represent n = number of animals.
Figure 1—figure supplement 2
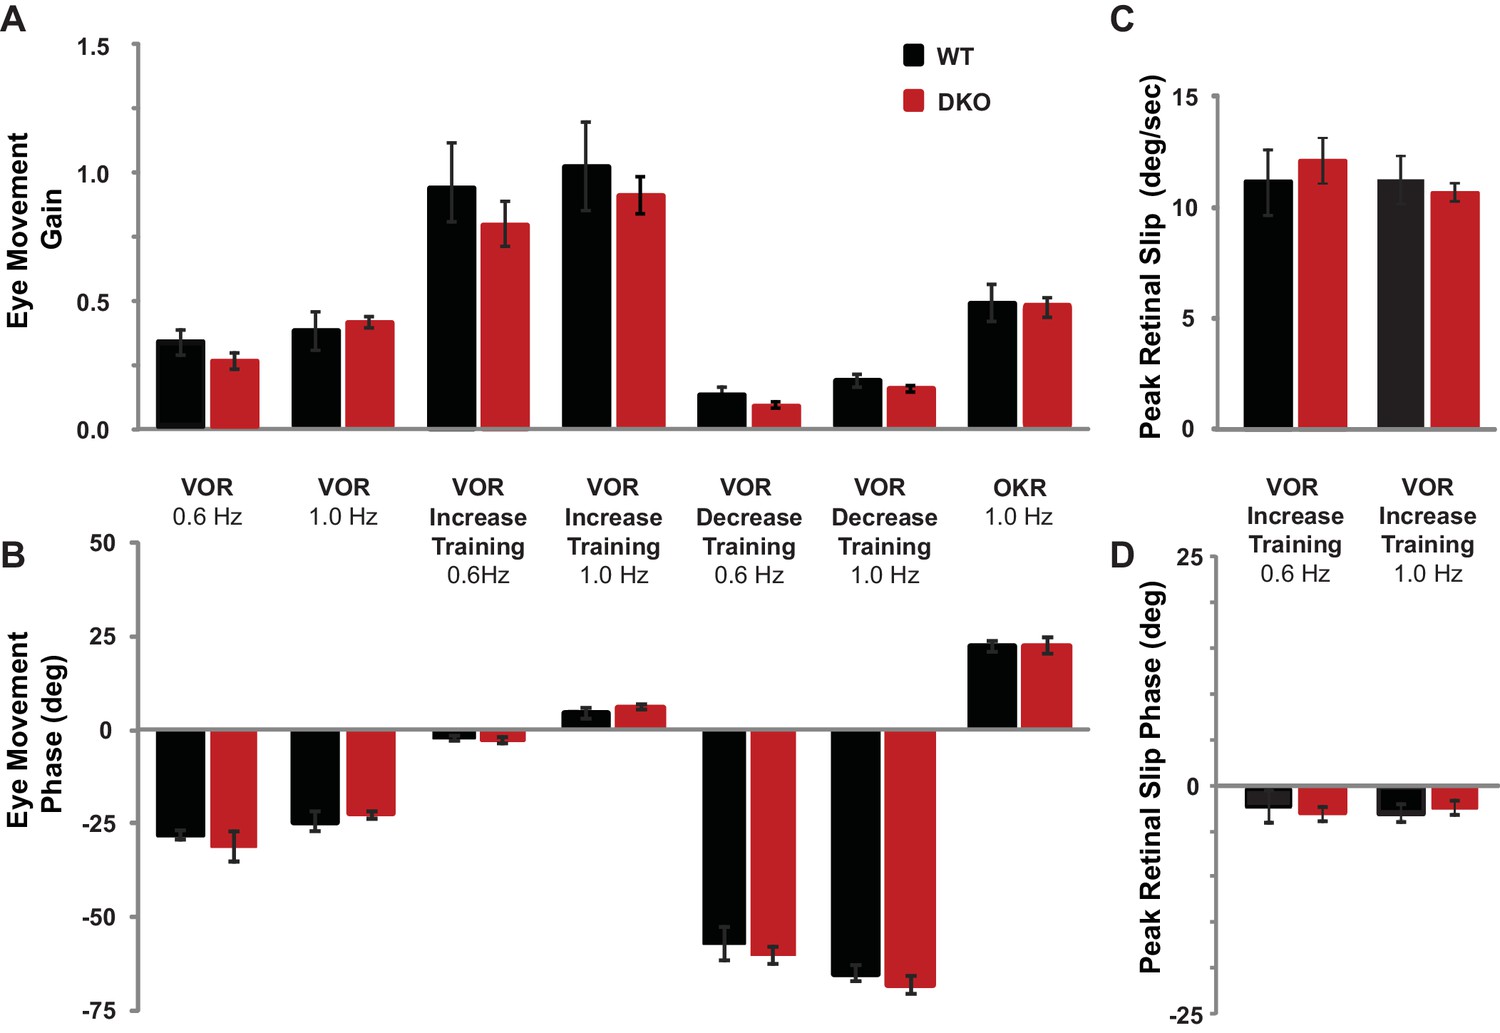
Baseline oculomotor performance was normal in DKO mice.
(A) Gain of the eye movement responses during performance of the VOR in the dark (VOR: 0.6 Hz, p=0.27, t(22) = 1.12; 1.0 Hz, p=0.62, t(31) = 0.49), in the presence of the visual-vestibular training stimuli used to induce VOR-increase learning (VOR-increase training: 0.6 Hz, p=0.45, t(22) = 0.63; 1.0 Hz, p=0.60, t(38) = 0.53), in the presence of the visual-vestibular training stimuli used to induce VOR-decrease learning (VOR-decrease training: 0.6 Hz, p=0.17, t(12) = 1.44; 1.0 Hz, p=0.09, t(19) = 1.79), and during the optokinetic response to visual stimulus motion with the head stationary (OKR: 1.0 Hz, p=0.84, t(12) = 0.20). The baseline, pre-training eye movement performance of the DKO mice (red bars) was indistinguishable from WT mice (black bars), suggesting there was no sensory or motor deficit that could account for the VOR-increase learning impairment in DKO mice. Mean ± s.e.m. (B) Eye movement phase (relative to the vestibular stimulus for VOR, VOR-increase, and VOR-decrease training and relative to the visual stimulus for OKR), during the same stimuli as in (A) was also normal in DKO mice (VOR: 0.6 Hz, p=0. 57, t(22) = 0.57; 1.0 Hz, p=0. 28, t(31) = 1.10; VOR-increase training: 0.6 Hz, p=0.78, t(22) = 0.27; 1.0 Hz, p=0. 32, t(38) = 1.00; VOR-decrease training: 0.6 Hz, p=0.61, t(12) = 0.52; 1.0 Hz, p=0.94, t(19) = 0.08; OKR: 1.0 Hz, p=0.51, t(16) = 0.67). Positive (negative) values indicate phase lag (lead). Mean ± s.e.m. (C) Peak retinal-slip velocity (image motion on the retina) was not significantly different between DKO and WT mice during VOR-increase training, confirming that the two genotypes experienced similar sensory errors during training (0.6 Hz, p=0.75, t(18) = 0.33; 1.0 Hz, p=0.57, t(37) = 0.57), although there was a difference in learning at 1 Hz (Figure 1D). Mean ± s.e.m. (D) Phase of retinal slip relative to the vestibular stimulus was not significantly different between DKO mice and WT controls during VOR-increase training (0.6 Hz, p=0.78, t(18) = 0.28; 1.0 Hz, p=0.70, t(37) = 0.39). Mean ± s.e.m.
Figure 1—figure supplement 3
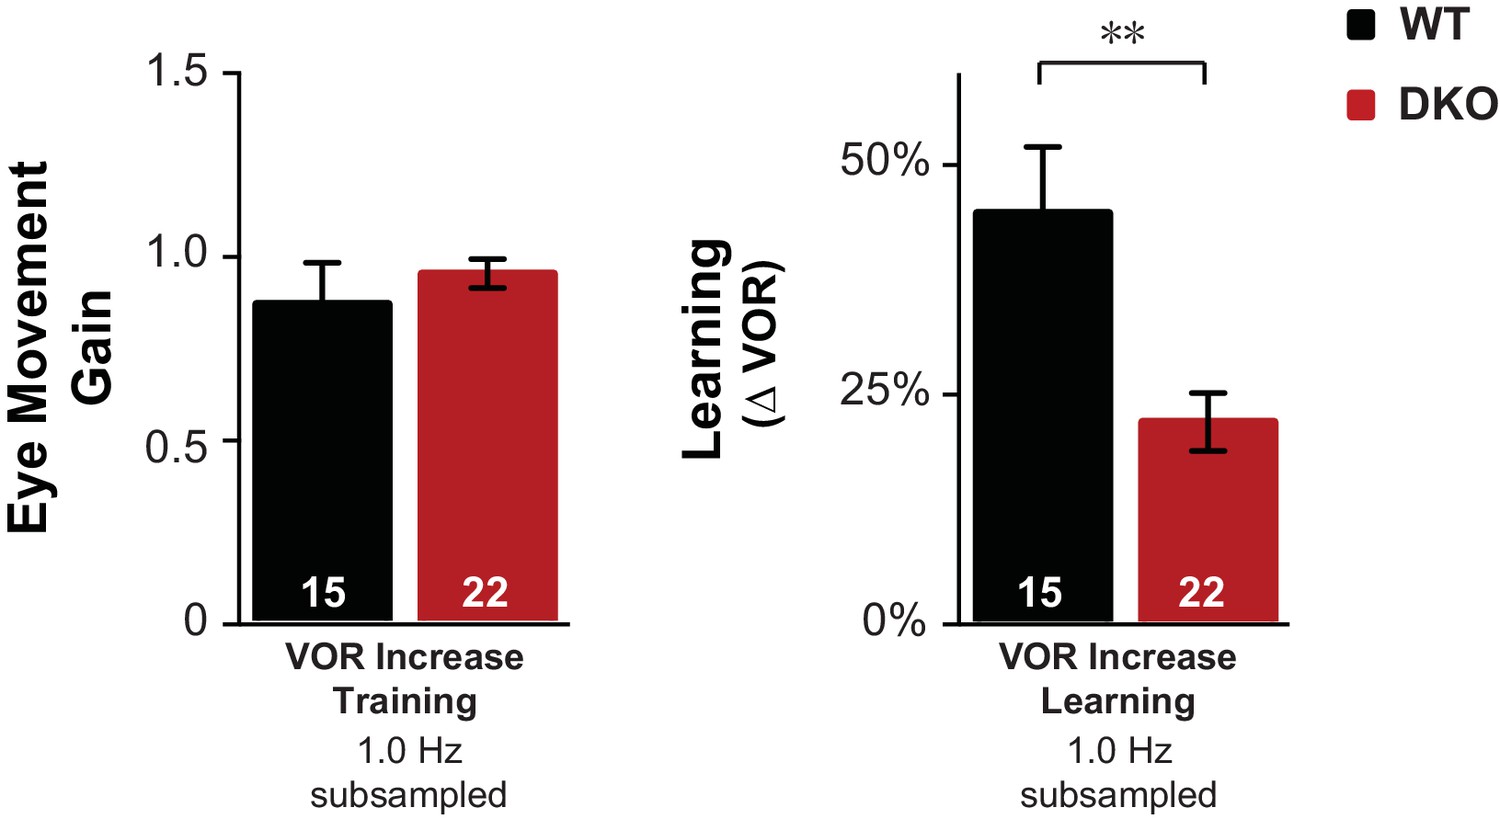
Control for eye movements during training.
Subsampling was performed on the data from Figure 1D to test whether the impaired learning phenotype in DKO mice could result from the trend (n.s., p=0.60, t(38) = 0.53) for the DKO mice to have a lower mean eye movement gain during the visual-vestibular training stimuli used to induce learning (see Figure 1—figure supplement 2A, fourth pair of bars from left, VOR Increase Training 1.0 Hz). Data from Figure 1D were subsampled by alternately dropping data from the DKO mouse with the smallest eye movements during training, and from the WT mouse with the largest eye movements during training, until the trend for the DKO mice to have a smaller mean gain during training was eliminated, which was achieved after dropping data from two DKO mice and one WT mouse (left). Even after controlling for eye movement performance during training, DKO mice (red) exhibited a significant deficit relative to WT (black) in VOR-increase learning (right; p=0.003, t(35) = 3.22).
Figure 2 with 2 supplements
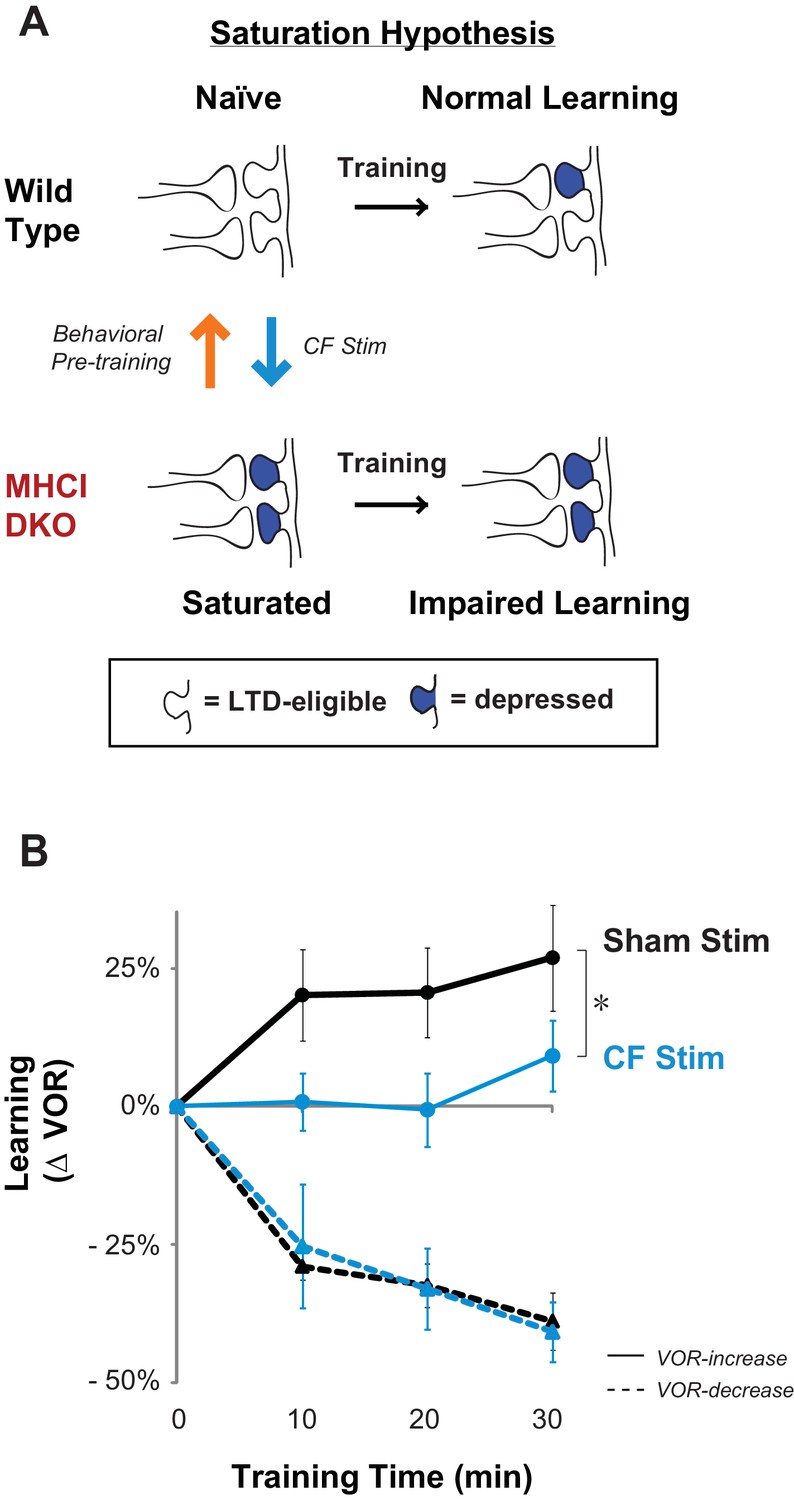
Elevated LTD before training impairs LTD-dependent learning.
(A) Saturation hypothesis to explain impaired learning with enhanced synaptic plasticity. Top, In naïve WT mice, at the start of training, synapses are presumably available (white synaptic spines) to selectively undergo associative synaptic plasticity (long-term depression, LTD; blue spines) during training, thereby supporting normal learning. Bottom, In DKO mice, the lower induction threshold for LTD could enable spontaneous activity in the circuit to aberrantly recruit LTD at a random subset of spontaneously active synapses before training, thereby depleting the pool of synapses eligible to undergo LTD, and preventing normal learning. Behavioral pre-training (orange arrow) restores the capacity for LTD-dependent learning in the DKO mice (Figure 3). We tested whether LTD saturation and impairment of LTD-dependent learning can be induced in WT mice with climbing fiber stimulation (cyan arrow; Figure 2B). (B) Climbing fiber stimulation in WT mice before VOR training recapitulates the learning impairment in the DKO mice. Optogenetic stimulation of climbing fibers for 30 min, to induce pf-Pk LTD in the flocculus of WT mice, blocked subsequent VOR-increase learning (solid cyan trace; *p=0.03, F(1,10) = 5.912, two-factor repeated measures ANOVA, CF stim n = 6, Sham n = 6) but had no effect on VOR-decrease learning (dashed cyan trace; n.s. p=0.68, F(1,5) = 0.20) relative to sham stimulation controls in animals that did not express ChR2 in the climbing fibers (black). Mean ± s.e.m.
-
Figure 2—source data 1
Elevated LTD before training impairs LTD-dependent learning.
Climbing fiber stimulation in WT mice before VOR training recapitulates the learning impairment in the DKO mice. Data show time course of VOR learning in WT mice during 30 min of normal visual-vestibular VOR training following 30 min of optical stimulation to either optogenetically stimulate climbing fibers (CFs) or provide sham controls (light only in WT without ChR2 expressed in the CFs). Learning was calculated as the percentage change in VOR gain measured after each 10 min block of visual-vestibular training relative to the baseline VOR gain measured immediately before visual-vestibular training. Positive values indicate increase VOR learning and negative values indicate decrease VOR learning corresponding to the respective training stimuli. Each row of 4 numbers within the condition columns corresponds to the time course of learning in an individual animal.
- https://doi.org/10.7554/eLife.20147.009
Figure 2—figure supplement 1
Climbing fiber stimulation did not permanently impair VOR-increase learning.
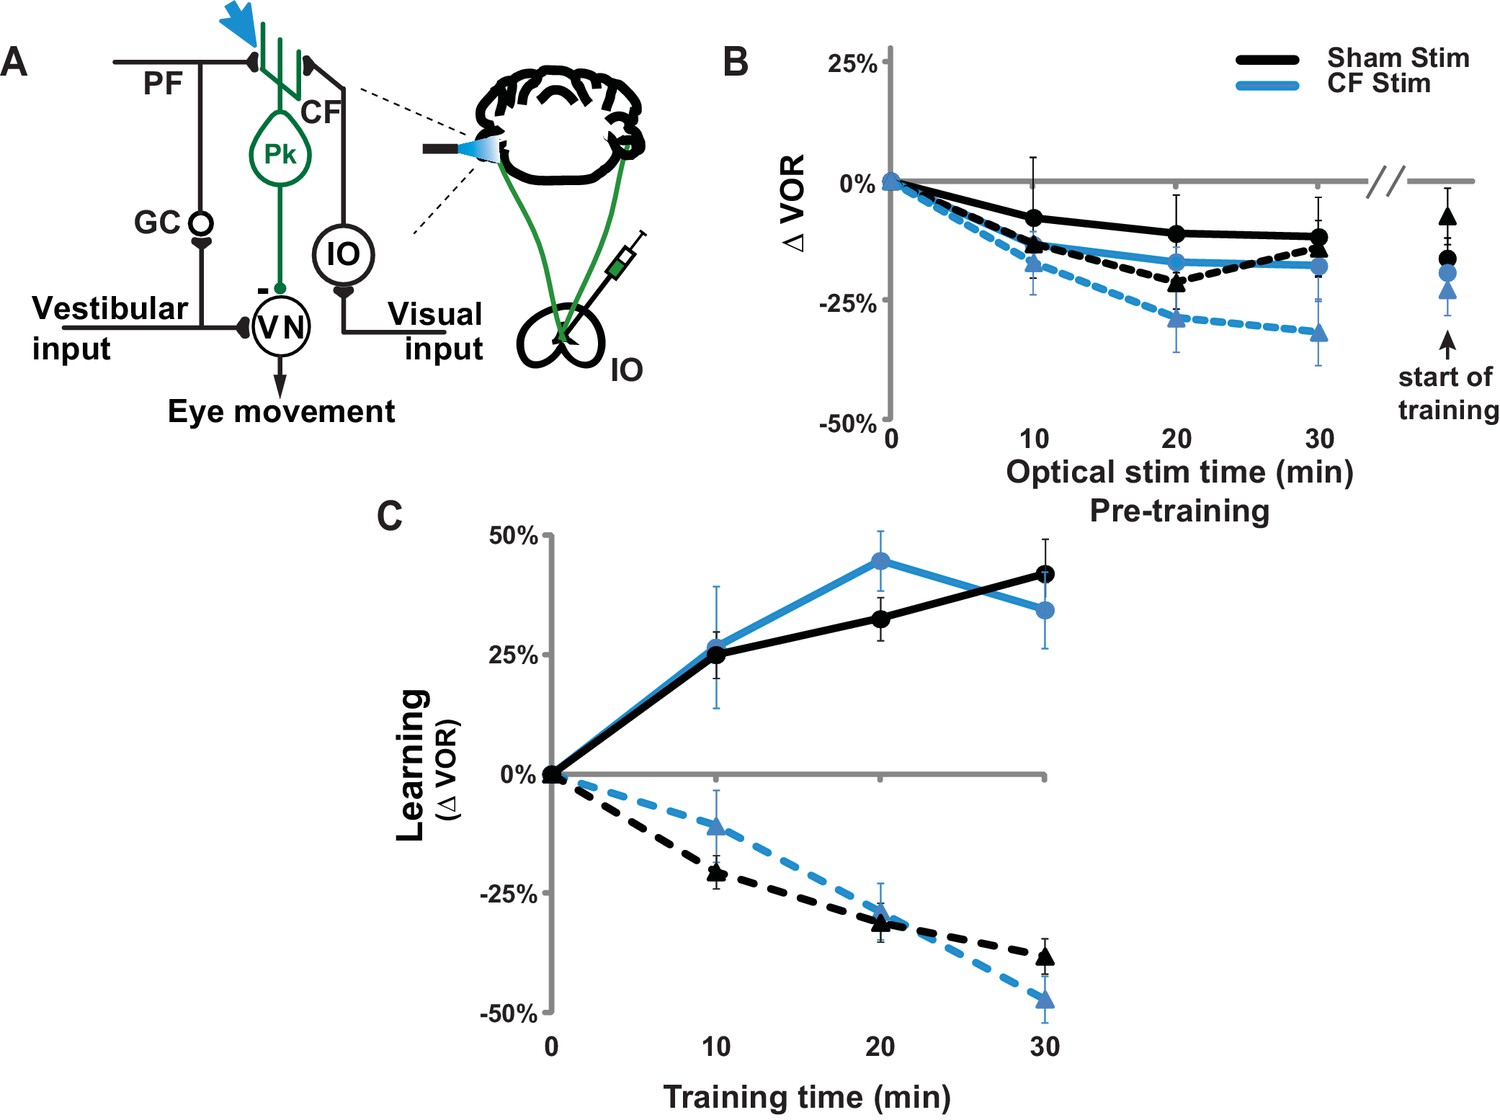
(A) Circuit diagram of the VOR, showing optogenetic stimulation of the climbing fiber inputs to floccular Purkinje cells in the cerebellar flocculus. Expression of ChR2 in climbing fibers was achieved with injections of adeno-associated virus (AAV) carrying ChR2 under the CaMKIIα promoter (CaMKIIα-ChR2(H134R)-EYFP) into the inferior olive (IO). Blue light stimulation was delivered directly to the cerebellar flocculus to activate climbing fibers relevant to VOR learning. CF: climbing fiber, IO: inferior olive, PF: parallel fiber, GC: granule cell, Pk: Purkinje cell, VN: vestibular nuclei. (B) Thirty minutes of pre-training with climbing fiber stimulation did not significantly affect the VOR at the start of VOR-increase (circles/solid traces) or VOR-decrease (triangles/dashed traces) training. Blue: mice with ChR2 expression in the climbing fibers (n = 6). Black: Sham stimulation control mice experiencing the same illumination of the cerebellar flocculus during pre-training but not expressing ChR2 in the climbing fibers (n = 6). During pre-training with optogenetic climbing fiber stimulation, animals were restrained with their head stationary in the dark. At 10 min intervals, the optogenetic stimulation was briefly interrupted to test the VOR. All groups exhibited a temporary decrease in the VOR during the pre-training period, but this effect did not depend on climbing fiber stimulation (blue vs. black traces). Mean ± s.e.m. (C) Climbing fiber stimulation immediately before training impaired VOR-increase learning (Figure 2B), but the same animals exhibited normal learning in response to the same visual-vestibular VOR-increase training stimuli several days later when trained without additional climbing-fiber stimulation pre-training (blue circles/solid trace) compared to sham stimulation control animals not expressing ChR2 in the climbing fibers (black circles/solid trace; ANOVA, p=0.79, F(1,70) = 0.074). Thus, climbing-fiber stimulation had no long-lasting adverse effects, but rather created a temporary state of the circuit that was unresponsive to VOR-increase training (Figure 2B). VOR-decrease learning was also normal when tested several days after climbing fiber stimulation (blue triangles/dashed trace; ANOVA, p=0.83, F(1,88) = 0.048 compared to sham controls without ChR2 shown in black triangles/dashed trace). Mean ± s.e.m.
Figure 2—figure supplement 2
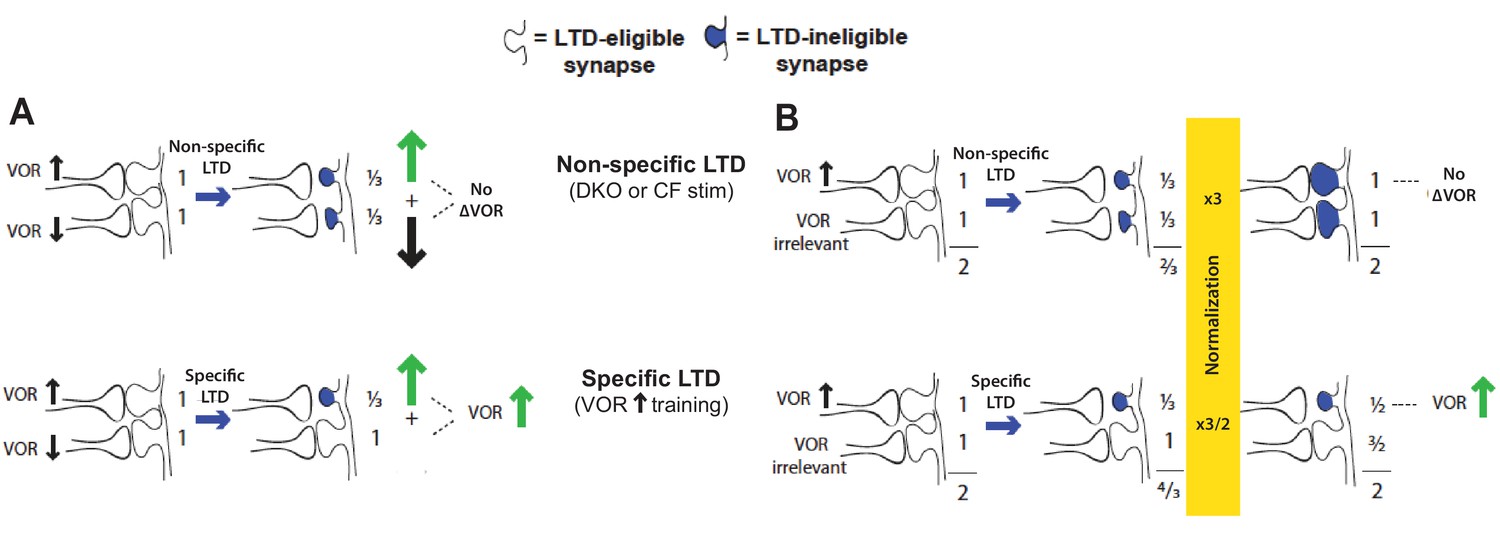
Non-specific LTD may have no immediate effect on behavior, yet deplete the pool of synapses available to support LTD-dependent learning.
For the VOR, non-specific LTD induced by climbing fiber stimulation or the lower threshold for LTD in DKO mice has no effect on the VOR amplitude (Figure 1—figure supplement 2A and Figure 2—figure supplement 1B), yet could saturate LTD in the synapses that support VOR increase learning. This would occur if the LTD is induced both in synapses whose depression contributes to VOR-increase learning, and in additional synapses whose depression could negate the effects of LTD in the first subset. Two specific possibilities are illustrated. (A) There could be some pf-Pk synapses whose depression causes an increase in VOR amplitude (up arrow) and others whose depression causes a decrease in VOR amplitude (down arrow). The latter may not normally undergo LTD in response to the VOR-decrease training paradigms used in our study (since there is no apparent effect of LTD enhancement or impairment on the learning induced by such training; Figure 1E, solid bars, Figure 1—figure supplement 1, bottom, and Boyden et al., 2006). Nevertheless, when they do undergo LTD through a non-specific induction process such as climbing fiber stimulation or a higher spontaneous LTD rate in DKO mice, this would oppose the effects of LTD in the synapses whose depression tends to increase the gain of the VOR, to yield no net change in the gain of the VOR (top). (B) There could be some pf-Pk synapses whose depression causes an increase in VOR amplitude (up arrow) and others whose depression is irrelevant for the VOR, followed by homeostatic normalization. Top: If too many synapses undergo LTD, there could be a homeostatic process, such as synaptic rescaling or an increase in dendritic excitability, that resets all synaptic weights to values close to their original value, without resetting the LTD mechanism or the capacity for additional LTD, so that these synapses remain LTD-ineligible (blue shading). Thus, the VOR would not be altered, but the LTD mechanism would not be available to support learning. Bottom: If LTD is induced selectively in the synapses that contribute to VOR-increase learning, the weight of these specific synapses remain depressed, and hence the gain of the VOR increased, even after homeostatic normalization restores the summed weight across all synapses to the original value.
Figure 3 with 3 supplements

Behavioral pre-training reveals enhanced learning in mice with enhanced LTD.
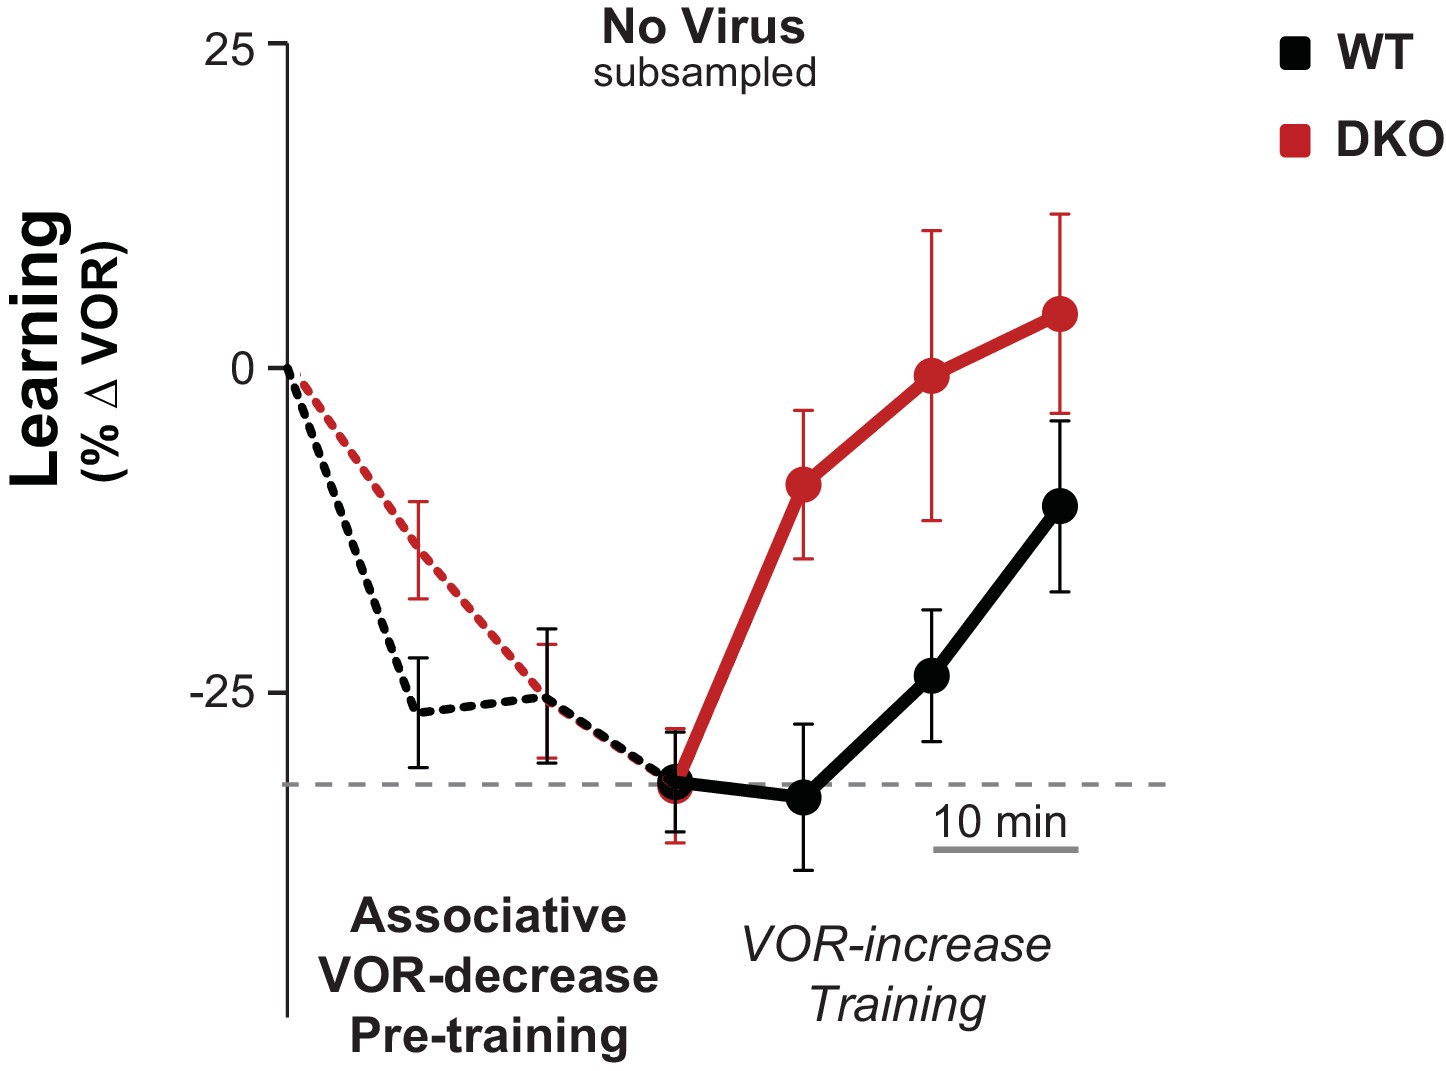
(A) The same VOR-increase training procedure induced dramatically different learning outcomes in the DKO mice with different pre-training procedures (p=0.01, F = 5.153, ANOVA). Left, Without pre-training, DKO mice with enhanced pf-Pk LTD were impaired on VOR-increase learning (**p=0.002, F(1,38) = 11.08, two-factor repeated measures ANOVA; WT n = 16,. DKO n = 24,). Middle, Pre-training with an associative VOR-decrease paradigm that was not significantly different between the genotypes (dotted lines, p=0.19, F(1,29) = 1.79; WT n = 12, DKO n = 19) reversed the learning impairment in DKO mice (red) so that they learned more than WT (black) during subsequent VOR-increase training (*p=0.02, F(1,29) = 5.95; WT n = 12, DKO n = 19). Right, Pre-training with a vestibular stimulus alone decreased the VOR gain comparably between the two genotypes (dotted line, p=0.30, F(1,17) = 1.25; WT n = 6, DKO n = 7), but there was no improvement of subsequent VOR-increase learning in the DKO mice relative to WT mice (p=0.13, F(1,11) = 2.70; WT n = 6, DKO n = 7). In DKO mice, VOR-increase learning was better after associative VOR-decrease pre-training compared with no pre-training (**p=0.005, Fischer’s LSD) or vestibular-only pre-training (*p=0.03) (compare red bar graphs and learning curves). In contrast, in WT mice, VOR-increase learning was worse after associative VOR-decrease pre-training compared with no pre-training (*p=0.037, Fischer’s LSD) or vestibular only pre-training (*p=0.049) (compare black learning curves). Learning is plotted on the same scale in each plot, and aligned on the values at the start of VOR-increase training for DKO mice. Mean ± s.e.m. (B) Virally-mediated rescue of H2-Db expression in floccular Purkinje cells (L7::H2-Db, left) eliminated the enhanced VOR-increase learning in DKO mice after associative VOR-decrease pre-training (compare with middle panel of A), so that learning was indistinguishable from WT mice injected with the same virus (VOR-increase learning, p=0.98, F(1,22) = 0.0004; VOR-decrease pre-training, p=0.53, F(1,22) = 0.40; two-factor repeated measure ANOVA; WT n = 9; DKO n = 15). The enhanced VOR-increase learning phenotype was present in DKO mice that received control virus expressing only GFP (L7::GFP, right, p=0.05, F(1,18) = 4.29; WT n = 9, DKO n = 11) although the VOR-decrease pre-training itself was not significantly different between the two genotypes (p=0.20, F(1,18) = 1.75; WT n = 9, DKO n = 11). Mean ± s.e.m.
-
Figure 3—source data 1
Behavioral pre-training reveals enhanced learning in mice with enhanced LTD.
The same VOR-increase training procedure induced dramatically different learning outcomes in the DKO mice with different pre-training procedures. Data show time course of VOR learning in WT and DKO mice during 30 min of different pre-training conditions (no pre-training, VOR-decrease pre-training, and vestibular only pre-training) followed by 30 min of normal VOR-increase training. Data are separated by pre-training condition and by whether mice received virus for rescue expression of H2-Db in Purkinje cells (without virus, with L7::H2-Db virus, or control L7::GFP virus). Learning was calculated as the percentage change in the VOR gain after each block of 10 min training relative the baseline VOR gain measured before any training occurred. Negative values indicate decrease VOR learning and positive values indicate increase VOR learning. However, in this case with pre-training, a reduction in negative values also indicates increase VOR learning. Each row of numbers within the condition columns corresponds to the time course of learning in an individual animal.
- https://doi.org/10.7554/eLife.20147.013
Figure 3—figure supplement 1
Control for efficacy of VOR-decrease pre-training.
Subsampling was performed on the data from Figure 3A, middle to test whether the enhanced learning phenotype in DKO mice could result from the trend (n.s., p=0.19, F(1,29) = 1.79; WT n = 12, DKO n = 19) for the DKO mice to undergo a smaller mean decrease in VOR gain during the VOR-decrease pre-training. Data from Figure 3A were subsampled by alternately dropping data from the DKO mice with the smallest decrease in VOR gain during pre-training (as measured at the end of the 30 min of pre-training), and from WT mice with the largest decrease in VOR gain during pre-training, until the trend for the DKO mice to have a smaller mean decrease in VOR-gain during pre-training was eliminated. Even after controlling for the efficacy of the VOR-decrease pre-training, there was a trend for DKO mice (red) to learn more than WT (black) during subsequent VOR-increase training (p=0.07, F(1,26) = 3.68; WT n = 11, DKO n = 17). Mean ± s.e.m.
Figure 3—figure supplement 2
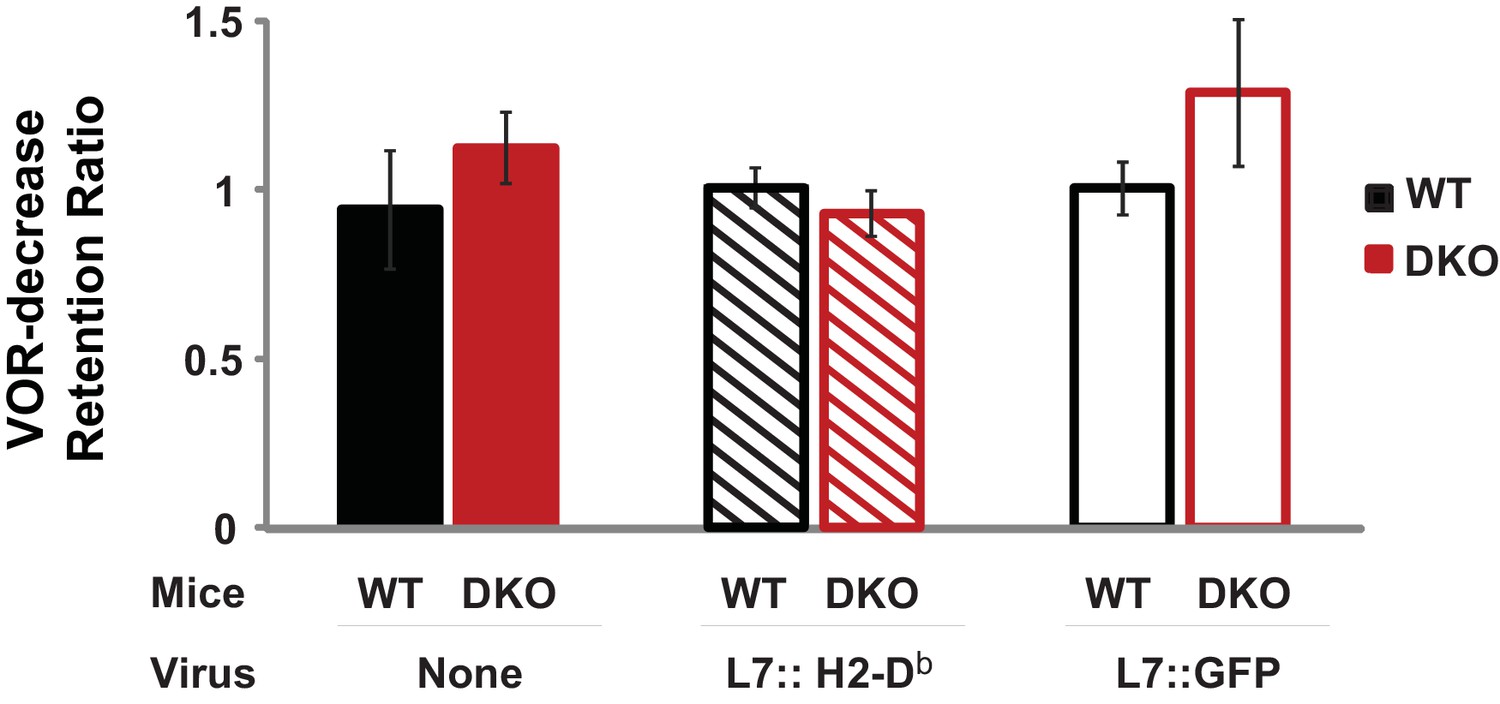
Normal retention of VOR-decrease learning in DKO mice.
DKO mice showed normal induction and retention of VOR-decrease learning in response to the VOR-decrease training protocol that was used for behavioral pre-training in Figure 3. A retention ratio was calculated as the learned percentage change in the VOR (relative to the pre-training baseline) measured after a 10 min retention period, divided by the percentage change in the VOR measured immediately after training. A retention ratio of 1.0 would represent perfect retention of VOR-decrease learning and values less than 1.0 would represent forgetting during the 10 min retention period. DKO mice (solid red bars) exhibited no additional forgetting of VOR-decrease learning (p=0.31, t(5) = 1.11; DKO n = 4, WT n = 3) that could explain the enhanced VOR-increase learning that was observed during the same 10 min period after VOR-decrease training (Figure 3A, middle panel). The retention of VOR-decrease learning was also stable in animals injected either with virus to rescue H2-Db specifically in floccular Purkinje cells (L7::H2-Db, hatched bars, p=0.275, t(11) = 1.148, WT n = 5, DKO n = 8) or with control virus expressing only GFP (L7::GFP, open bars, p=0.99, t(11) = 0.013, WT n = 6, DKO n = 7) (Figure 1E). During the 10 min retention period, mice were restrained in the dark with their head stationary. Mean ± s.e.m.
Figure 3—figure supplement 3
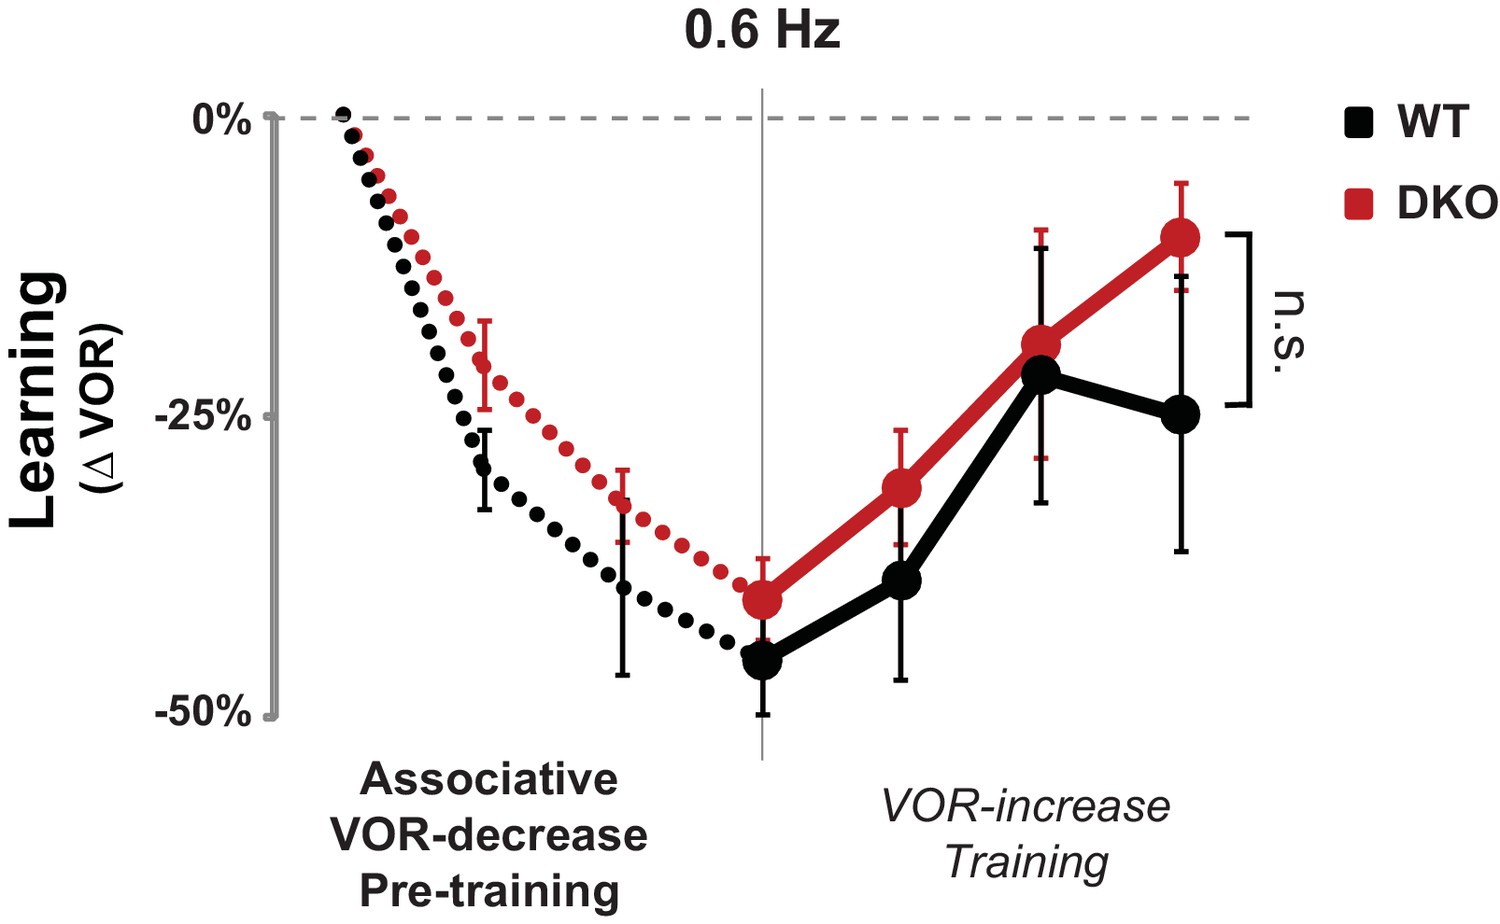
No enhanced learning phenotype was observed in DKO mice when tested using lower visual-vestibular stimulus frequencies.
When testing and training were conducted using visual and vestibular stimuli at a frequency of 0.6 Hz, pre-training with the VOR-decrease paradigm (dotted lines) had no effect on subsequent VOR-increase learning in DKO mice (red) compared with WT mice (black) (ANOVA, p=0.10, F(1,84) = 2.761, WT n = 7, DKO n = 7), in contrast to the enhanced VOR-increase learning after pre-training that was observed when the training and testing were done at a stimulus frequency of 1 Hz (Figure 3A, middle panel). Mean ± s.e.m.
Figure 4
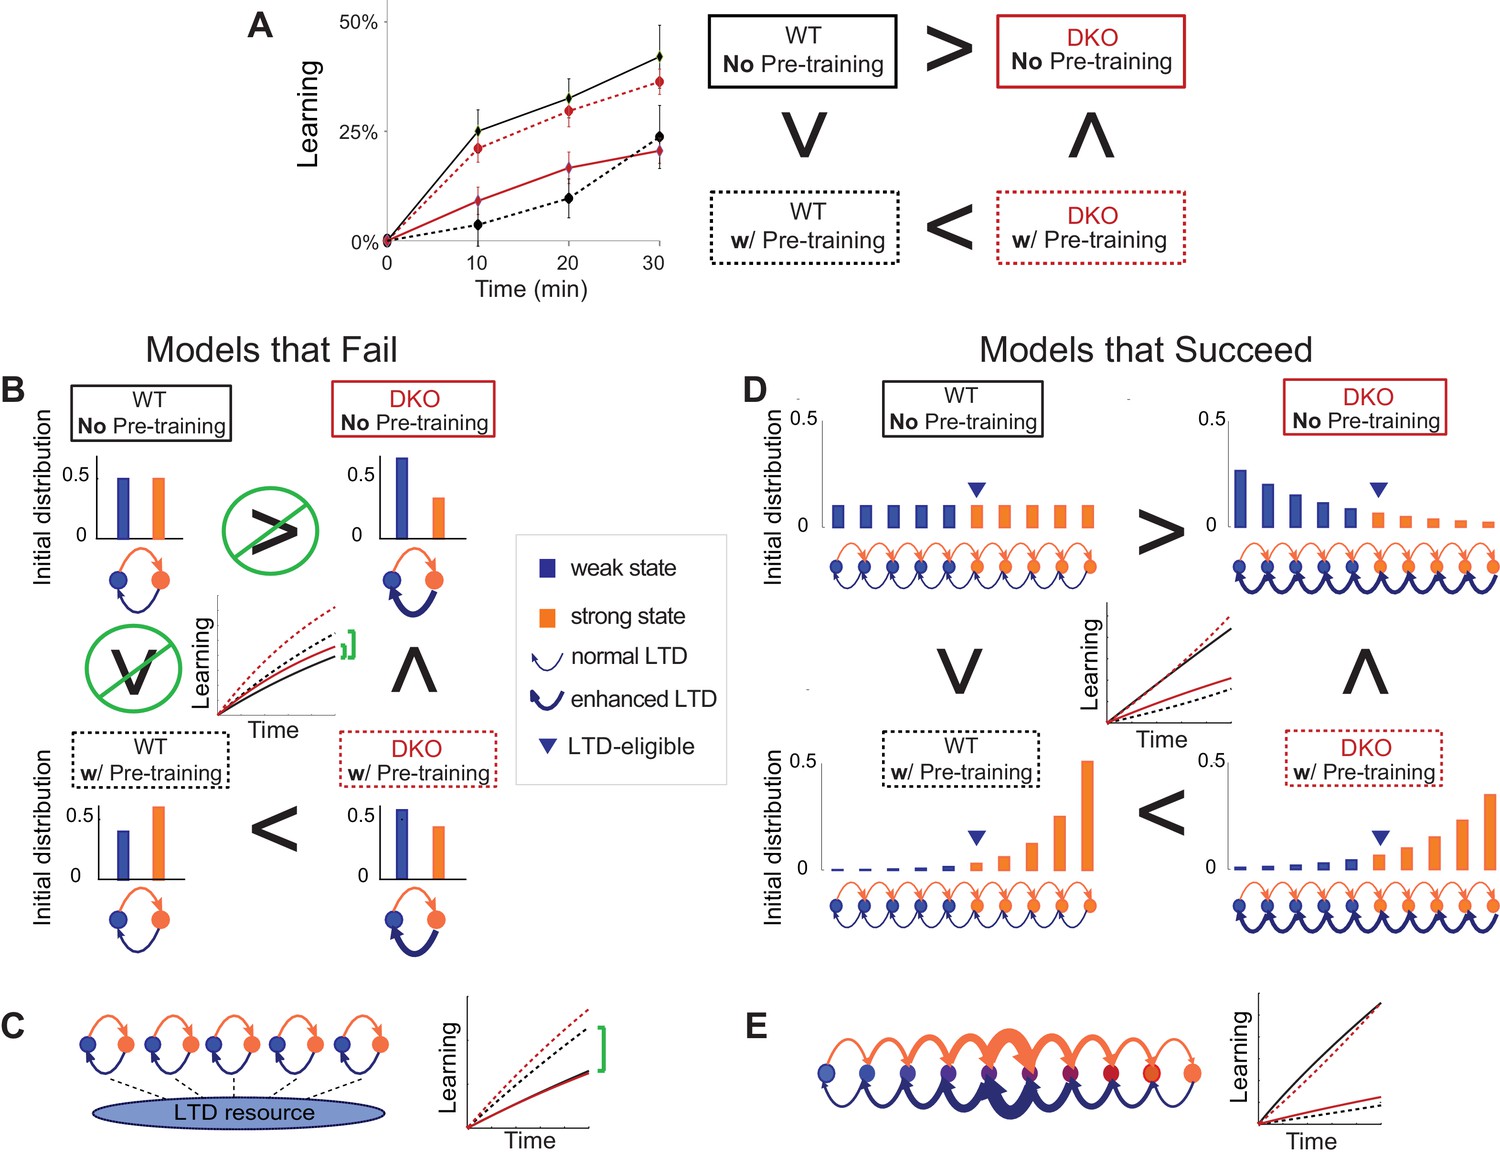
Synaptic models with amplified saturation effects and stubborn synaptic states account for learning in mice with normal and enhanced LTD.
(A) Four empirical comparisons constrain the models. Left, Empirical results replotted from Figure 3, with all curves aligned to the start of VOR-increase training, P values can be found in the legend for Figure 3. Right, Less than and greater than symbols (< and >) indicate which mice exhibited greater VOR-increase learning. In all panels of Figure 4: red, DKO mice; black, WT mice; solid lines, no pre-training; dashed lines, with VOR-decrease pre-training. (B) A binary synapse model with a strong synaptic state (orange) and a weak state (blue). Synapses transition between the two states at the rate of depression (blue curved arrow) and potentiation (orange curved arrow). The fraction of synapses in each state prior to VOR-increase learning is indicated by blue and orange bars. VOR-increase learning is measured by the decrease in synaptic weights during training. For DKO mice, the rate of depression was higher than WT, reflecting the lower threshold for LTD, (thick blue arrow), hence a greater fraction of the synapses were in the weak state (blue bars) prior to any VOR training. VOR-decrease pre-training (bottom panels) increased the fraction of synapses in the strong, LTD-eligible state (orange) in both WT and DKO mice. Center, The binary synapse model predicts enhanced learning in DKO vs. WT mice without pre-training (solid red vs solid black trace) and enhanced learning in WT mice with vs. without pre-training (dashed vs solid black trace), in contradiction to the empirical results in A (green brackets and green Ø). (C) The pooled resource model. Left, The probability of synaptic depression varied with the level of a shared resource that was depleted by the occurrence of depression at other synapses. Right, This model fails to account for the impaired learning in WT mice after pre-training (dashed black vs. solid black; green bracket). (D) The serial synaptic model with multiple strong (orange) and weak (blue) states, but only two values of synaptic strength, can account qualitatively for the effects of enhanced LTD and pre-training on learning (compare center panel with A). Before training, the synapses were strongly biased towards the weak state in the DKO mice, reducing the fraction of LTD-eligible synapses (blue arrowheads), and impairing learning relative to WT (solid red vs. solid black), as observed empirically. VOR-decrease pre-training shifted the bias towards the strong states (bottom panels). In DKO mice, this increased the fraction of LTD-eligible synapses (blue triangle), and enhanced learning (dashed red). In WT mice, pre-training biased the synapses to be too deep into the chain of potentiated states, so that the fraction of LTD-eligible synapses was reduced (blue triangle) and learning impaired (dashed black). (E) The non-uniform multistate model. Left, Each state is of varying strength from strong (orange) to weak (blue), and the transition probabilities between states decay exponentially the further the state is from the center. Right, This model qualitatively reproduced all of the empirical observations of learning.
Appendix 1—figure 1

Transition probabilities for different models.
Potentiation induces transitions indicated by orange arrows, depression indicated by blue arrows. States of strong/weak synaptic weight indicated by orange/blue circles. (A) In the serial model the transition probabilities for potentiation/depression are all equal and it is parameterised by these two values. The synaptic weight takes only two values, . (B) The two-state model is parameterised by the two transition probabilities. (C) In the multistate model the transition probabilities for potentiation/depression are all equal and it is parameterised by these two values. The synaptic weight varies linearly in the interval . (D) In the cascade model, the transition probabilities decay geometrically with a parameter (see Fusi et al., 2005) and synaptic weight takes only two values. (E) In the pooled resource model, Several two-state synapses share resources that are required for potentiation and depression. These resources are depleted as more synapses are potentiated or depressed. This pool of synapses can be modelled as one compound synapse. (F) In the non-uniform multistate model the synaptic weight varies linearly in the interval , similar to the multistate model, but the transition probabilities between adjacent states decays exponentially away from the central transition for both potentiation and depression.
Appendix 1—figure 2
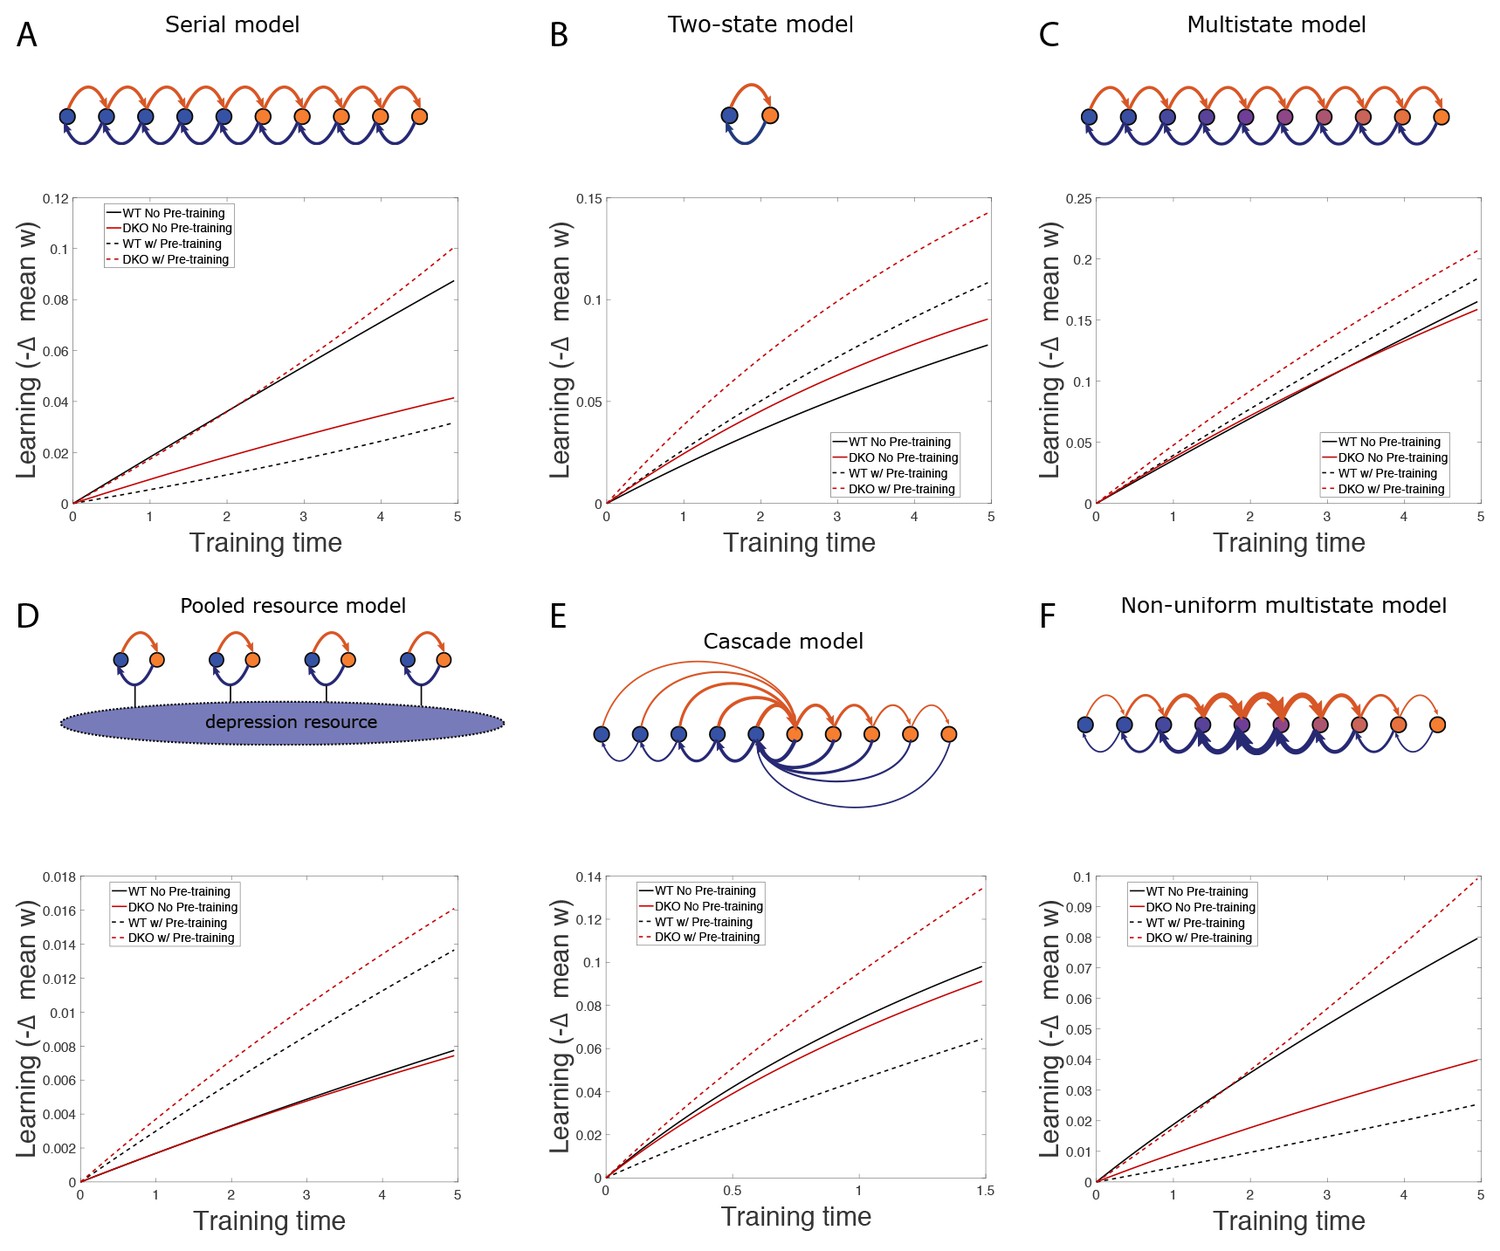
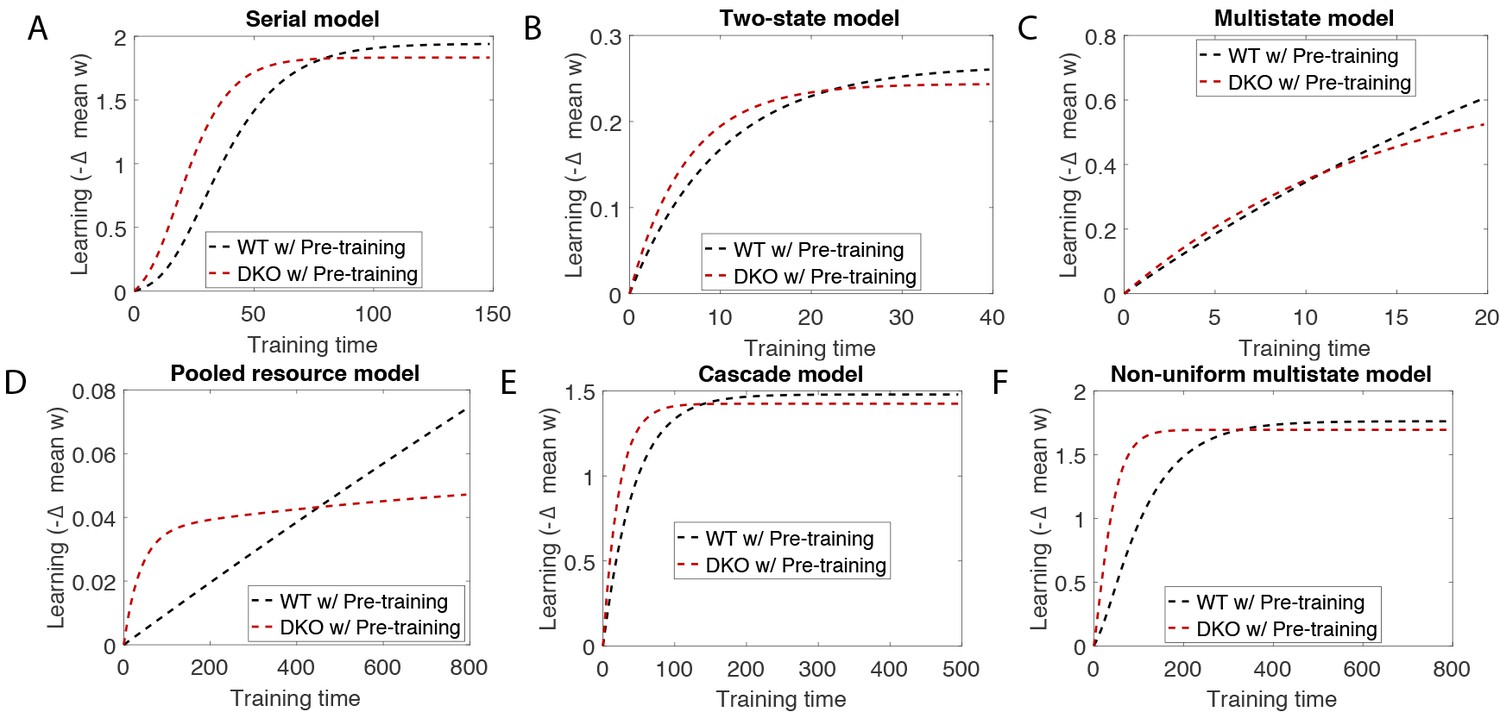
Simulation results.
(A–F) Simulation results for various models, showing decrease in mean synaptic weight over time during gain increase training from the normal state (solid) and after gain-decrease pre-training (dashed) for wild-type (WT; black) and DKO (red) models.
Appendix 1—figure 3
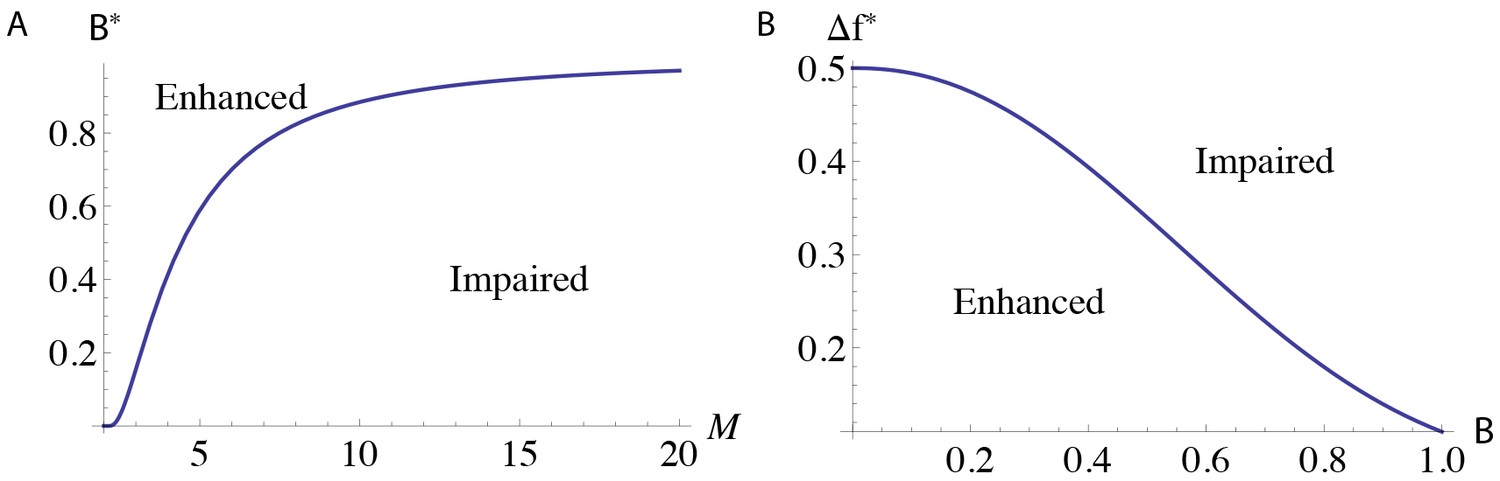
Regions of parameter space with different learning outcomes for the serial model.
The functions (A) , which describes when the DKO models have impaired learning, and (B) for , which describes when pre-training enhances learning.
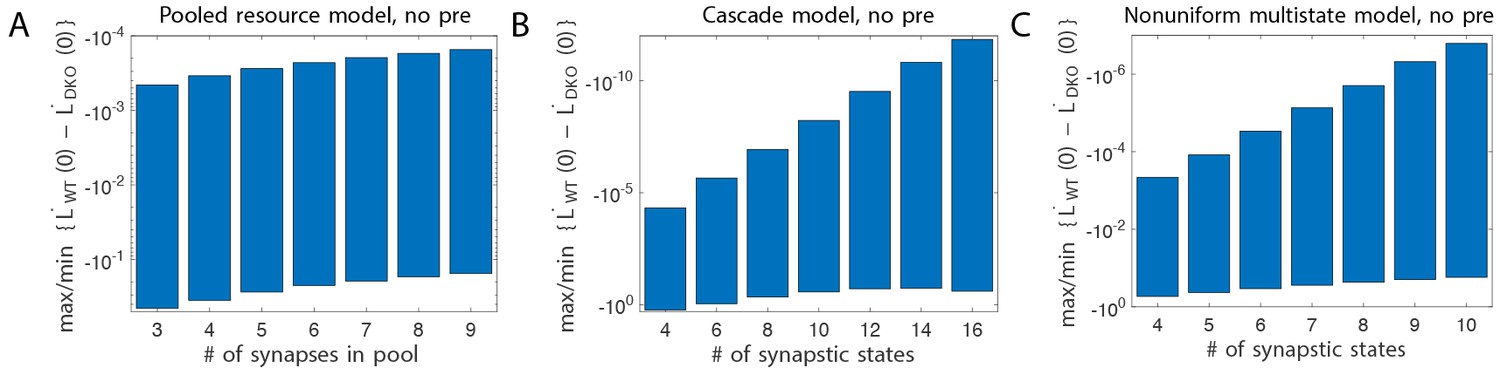
Appendix 1—figure 4
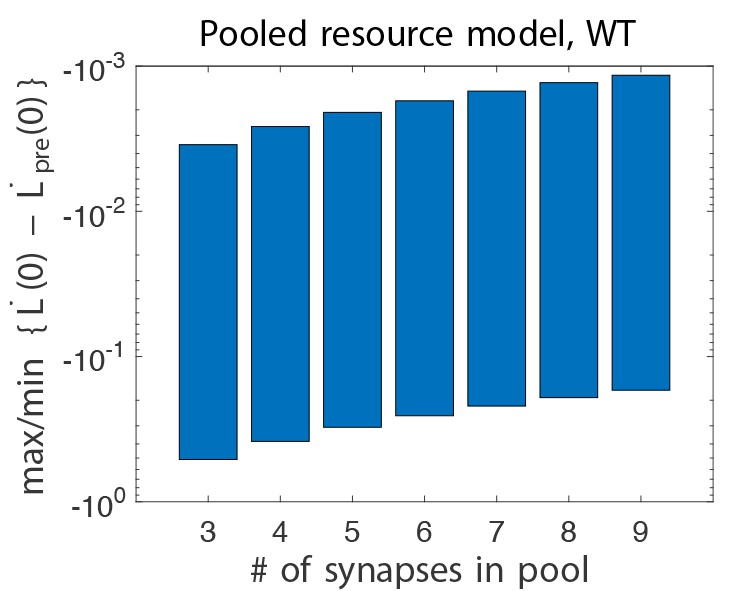
Difference in initial learning rate in wild-type pooled resource models, without and with gain-decrease pre-training.
Learning, is defined in Equation (3). Here, we show the maximum and minimum values of this quantity when scanning all six relevant parameters (see text). We see that this quantity is always negative, whereas it was positive in the experiments.
Appendix 1—figure 5
Simulation of training for long times after pre-training shows that it erases the effect of pre-training.
These simulations were performed with the same parameters as in Appendix 1—table 1, but with much longer training times, for the (A) serial, (B) two-state, (C) multistate, (D) pooled resource, (E cascade and (F) non-uniform multistate models. Compare with Appendix 1—figure 2.
Appendix 1—figure 6
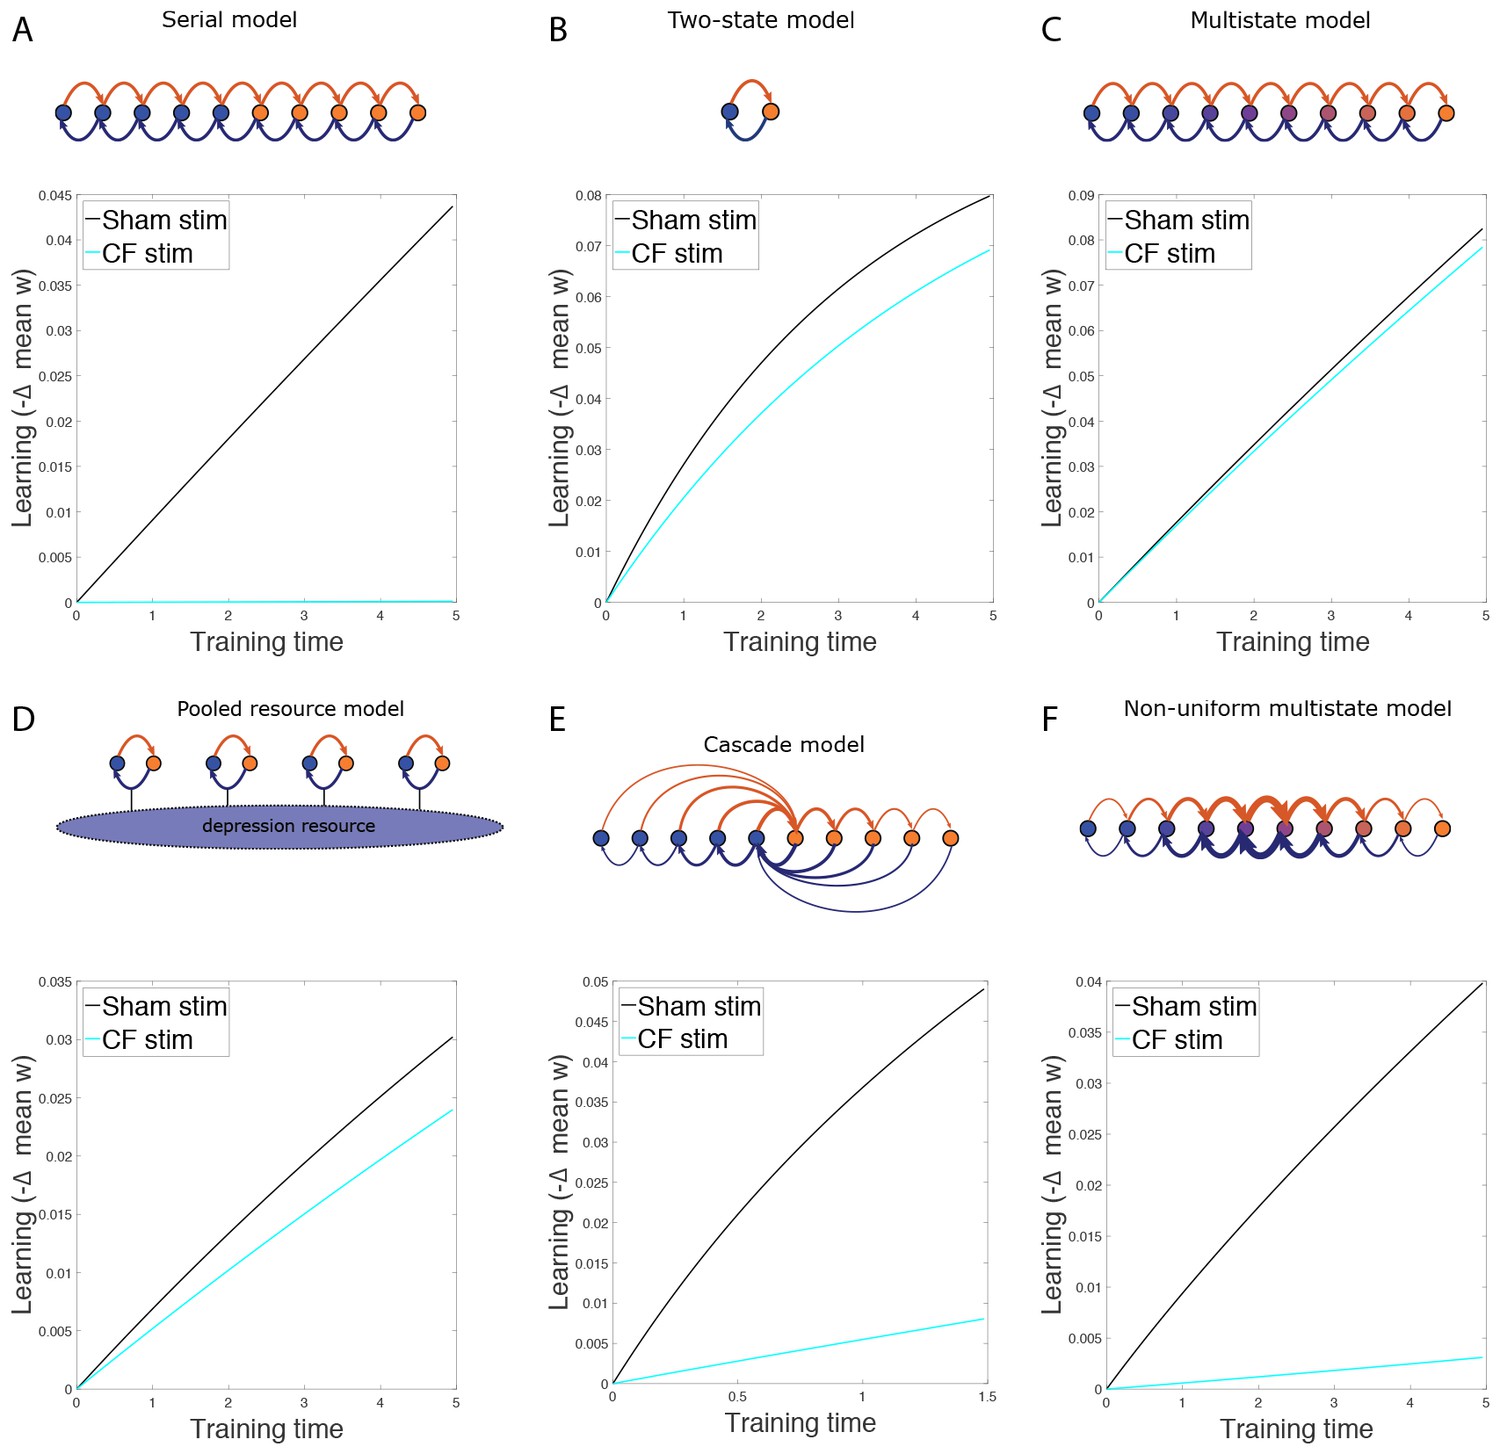
The effect of non-specific CF stimulation.
(A−F) Simulation results for various models, showing decrease in mean synaptic weight over time during gain increase training from the normal state (black) and after non-specific CF stimulation (cyan) for wild-type models.
Appendix 1—figure 7
Balanced potentiation and depression.
Difference in initial learning rate in WT and DKO models, without gain-decrease pre-training. Learning, is defined in Equation (3). Here, we show the maximum and minimum values of this quantity when scanning all 7/5 relevant parameters (see text). We see that this quantity is always negative, whereas it was positive in the experiments.
Tables
Appendix 1—table 1
Parameters used for simulations. For the serial, two state and multistate models, the plasticity parameter listed is the transition probability between adjacent states. For the pooled resource model, the plasticity parameters are the minimum and maximum transition probability for the constituent two-state synapses. For the cascade and non-uniform multistate models, the plasticity parameter is the ratio of adjacent transition probabilities.
| Model | # states | Plasticity parameter | ||||||
|---|---|---|---|---|---|---|---|---|
| Pot | WT dep | DKO dep | Base | Inc | Dec | |||
| Serial | 10 | 0.12 | 0.14 | 0.2 | 0.5 | 0.89 | 0.11 | 100 |
| Two-state | 2 | 0.1 | 0.1 | 0.2 | 0.5 | 0.6 | 0.4 | 5 |
| Multistate | 10 | 0.3 | 0.3 | 0.4 | 0.5 | 0.8 | 0.2 | 5 |
| Pooled res. | 7 | 0.008 | [0.0006, 0.6] | [0.001, 1] | 0.5 | 0.9 | 0.1 | 20 |
| Cascade | 14 | 0.386 | 0.398 | 0.466 | 0.478 | 0.63 | 0.002 | 200 |
| Non-uni. | 12 | 0.4 | 0.4 | 0.53 | 0.5 | 0.7 | 0.1 | 500 |
Appendix 1—table 2
Parameters used for simulations. For the serial, two state and multistate models, the plasticity parameter listed is the transition probability between adjacent states. For the pooled resource model, the plasticity parameters are the minimum and maximum transition probability for the constituent two-state synapses. For the cascade and non-uniform multistate models, the plasticity parameter is the ratio of adjacent transition probabilities.
| Model | # states | Plasticity parameter | |||||
|---|---|---|---|---|---|---|---|
| Pot | Dep | Base | Inc | CF stim | |||
| Serial | 10 | 0.12 | 0.14 | 0.5 | 0.89 | 0.9879 | 100 |
| Two-state | 2 | 0.1 | 0.4 | 0.5 | 0.7 | 0.91 | 5 |
| Multistate | 10 | 0.3 | 0.3 | 0.5 | 0.8 | 0.96 | 5 |
| Pooled res. | 7 | 0.08 | [0.006, 0.6] | 0.5 | 0.9 | 0.99 | 20 |
| Cascade | 14 | 0.386 | 0.398 | 0.522 | 0.63 | 0.99 | 200 |
| Non-uni. | 12 | 0.4 | 0.4 | 0.5 | 0.7 | 0.99 | 500 |
Download links
A two-part list of links to download the article, or parts of the article, in various formats.
Downloads (link to download the article as PDF)
Open citations (links to open the citations from this article in various online reference manager services)
Cite this article (links to download the citations from this article in formats compatible with various reference manager tools)
A saturation hypothesis to explain both enhanced and impaired learning with enhanced plasticity
eLife 6:e20147.
https://doi.org/10.7554/eLife.20147


