Genetic defects in β-spectrin and tau sensitize C. elegans axons to movement-induced damage via torque-tension coupling
- Stanford University, United States
- Technical University of Munich, Germany
Figures
Figure 1 with 2 supplements
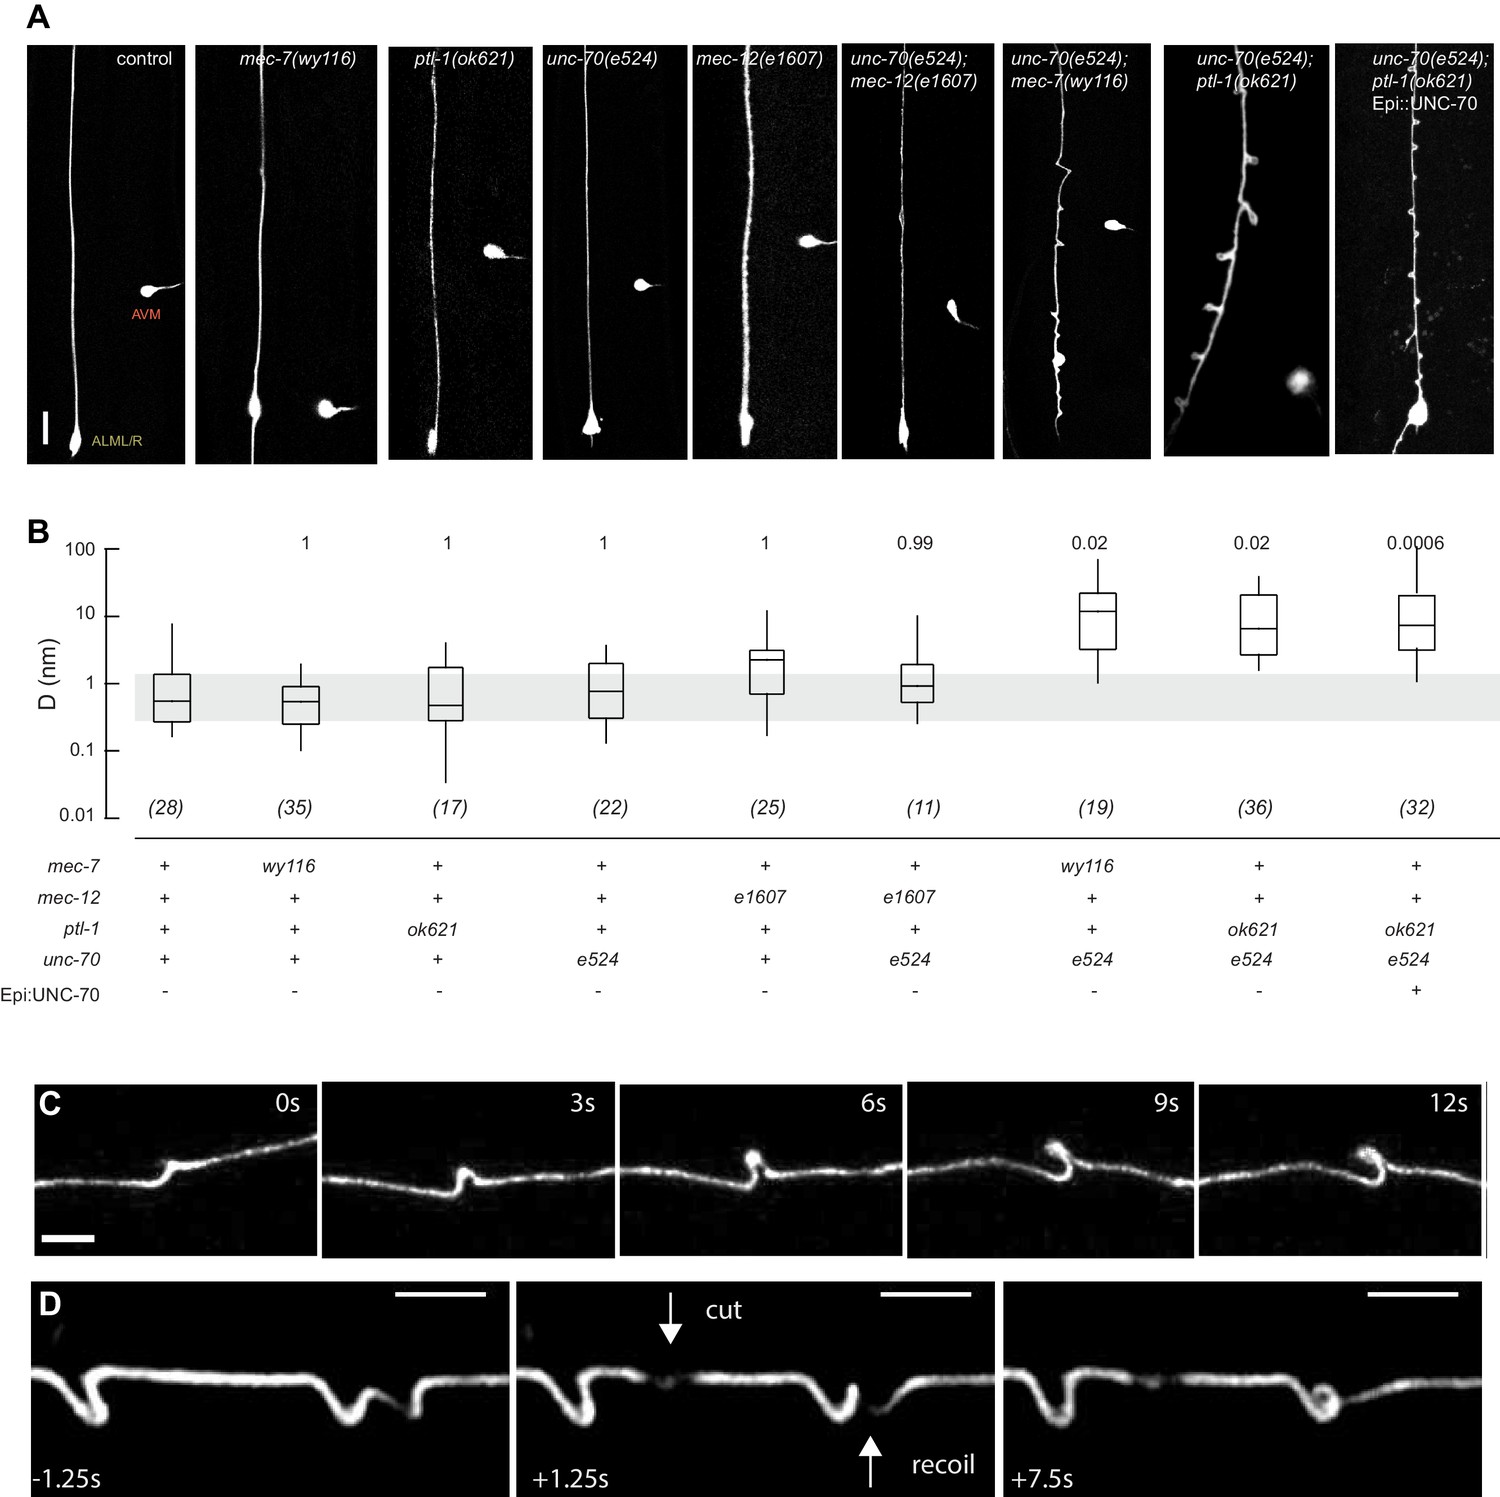
Mutations in the spectrin and microtubule cytoskeletons cause shape defects in C. elegans TRNs.
(A) Representative images of ALM in control and the indicated genotypes; anterior is up and ventral is to the right. All neurons are marked by TRN::GFP encoded by the uIs31[mec-17p::GFP] transgene. Scale = 10 µm. (B) Quantification of ALM shape as local neuron randomness (Methods) in the indicated genotypes. Numbers in parentheses indicate number of animals analyzed and the numbers above each box are p-values derived from a multi-comparison Tukey posthoc t-test. Exact p-values were calculated according to Newman-Keuls. (C) Still images from Video 2 showing the dynamics of the defects in unc-70(e524);ptl-1(ok621) double mutants. (D) Still images of Video 6 showing the dynamics of the defects after stress release by laser cutting. Videos 1–6 are associated with the analyses and still images represented in Figure 1.
Figure 1—figure supplement 1
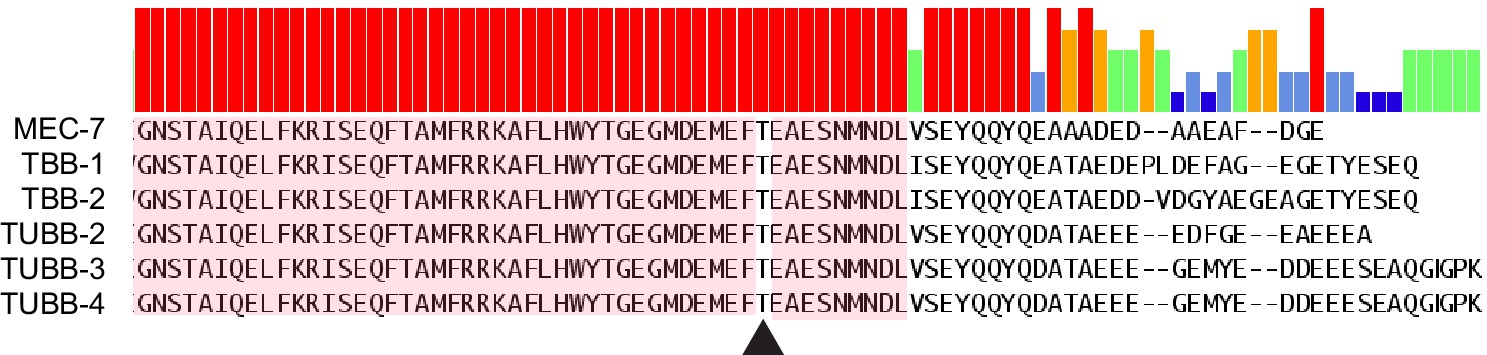
Alignment of the C-terminal tail of three major β-tubulin isoforms expressed in C. elegans TRNs (MEC-7, TBB-1, and TBB-2) and human neurons (TUBB-2,–3, −4) (Leandro-García et al., 2010).
Arrowhead indicates the conserved threonine residue mutated in mec-7(wy116).
Figure 1—figure supplement 2
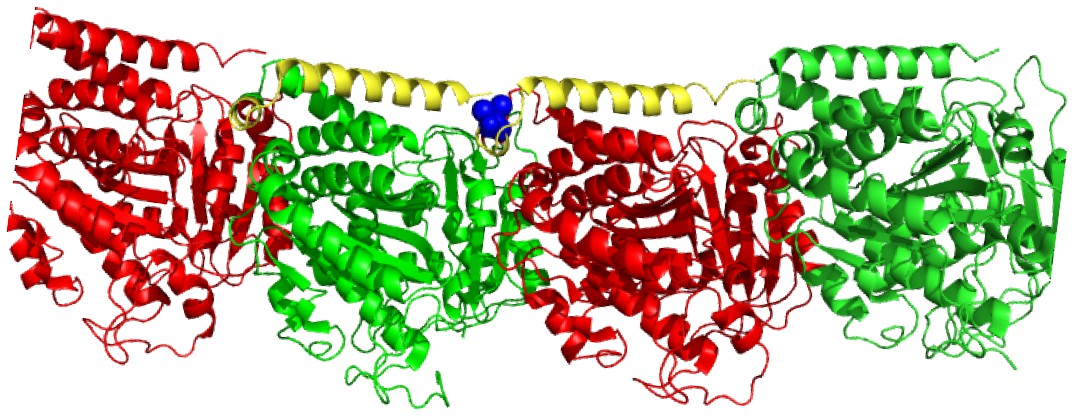
Molecular model of an αβ-tubulin heterodimer (Ravanbakhsh et al., 2013) with the mec-7(wy116[T409I]) substitution shown in space filling representation (PDB accession code 1Z2B).
https://doi.org/10.7554/eLife.20172.004
Figure 2 with 1 supplement

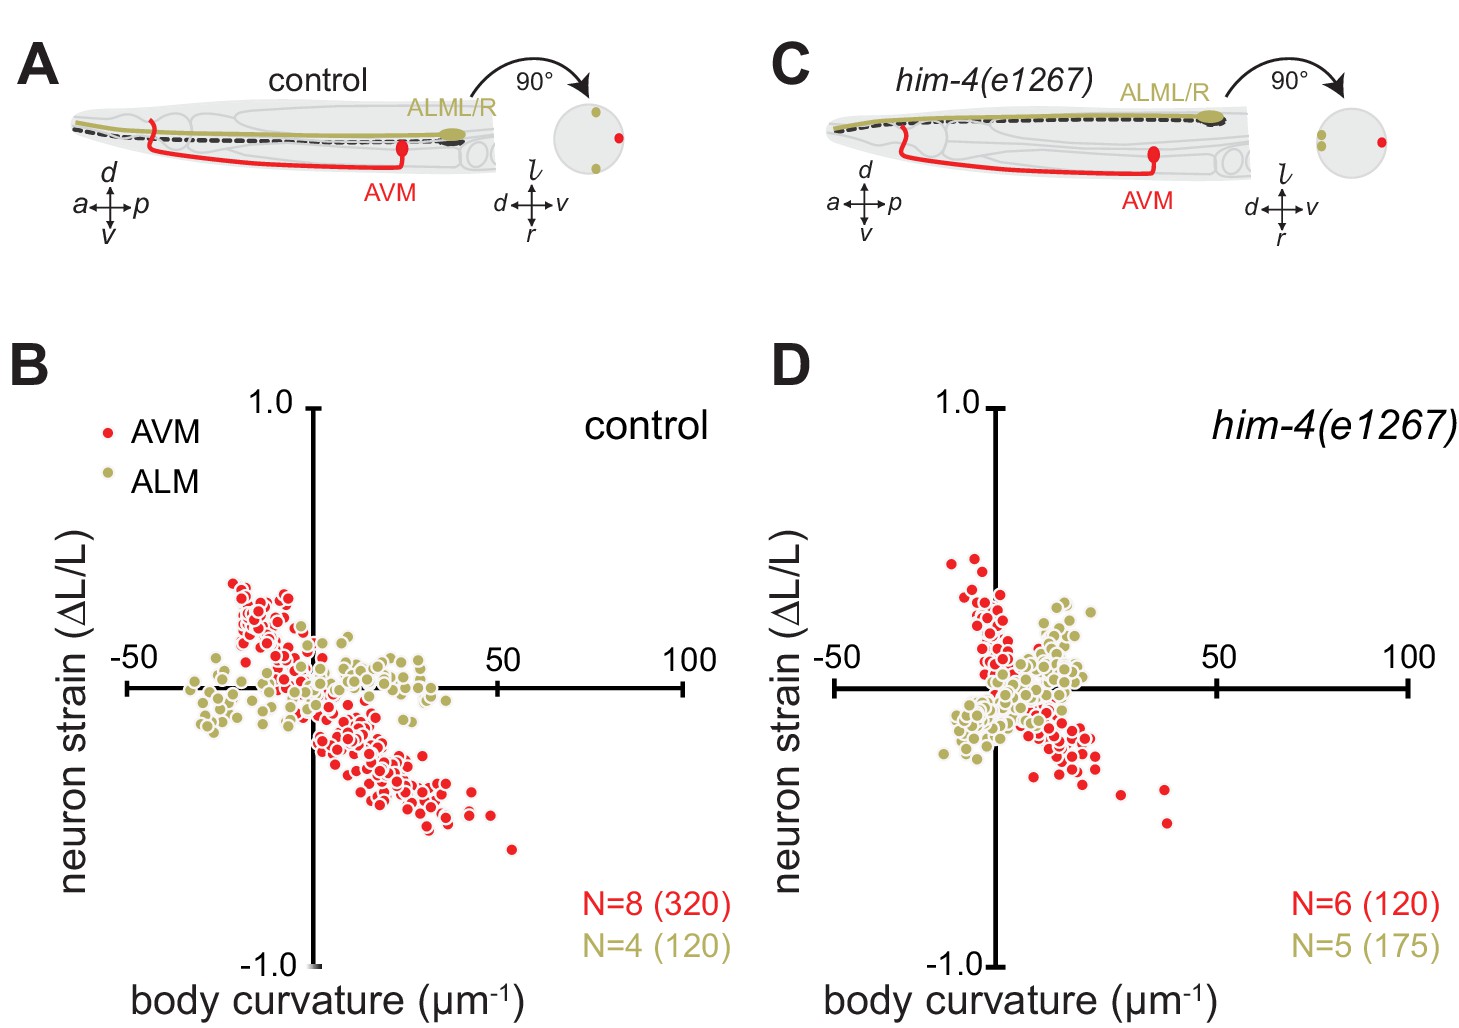
Axon position within tissues determines exposure to mechanical stress.
(A) Schematic showing the position of AVM (red) and ALM (green) from the side (left) and in a cross-section (right) in control animals. (B) Still images of AVM and ALM during dorsal (top) and ventral bending (bottom) in control animals. Scale = 50 µm. Images are from Video 7 (AVM) and Video 8 (ALM). Anterior is to the left and ventral is down. (C) Normalized neuron length change (△L/L, strain) is plotted against the axial component of the bending strain (curvature times distance from centerline, ) during body bending. (D) Schematic showing the position of AVM (red) and ALM (green) from the side (left) and in a cross-section (right) in him-4(e1267) animals. The him-4 mutation displaces ALM to the dorsal surface of the animal’s body. (E) Still images of AVM and ALM during dorsal (top) and ventral bending (bottom) in him-4(e1267) animals. Scale = 50 µm. Images are from Video 9 (AVM) and Video 10 (ALM). (F) Normalized neuron length change (△L/L, strain) plotted against the axial component of the bending strain (curvature times distance from centerline, ) during body bending. AVM and ALM were visualized using the uIs31 transgene driving GFP expression only in the TRNs. Sub-panels in (B) and (E) show a magnified view of the respective neuron taken from the area indicated by the dotted box. In panels (C) and (F), N = total number of axons analyzed per genotype and the number in parentheses gives the number of video frames analyzed. Animals that failed to move during the observation time were excluded from the analysis.
Figure 2—figure supplement 1
The length change (strain) of TRNs axons depends on body posture and anatomical position.
(A, C) Schematic showing the position of AVM (red) and ALM (green) from the side (left) and in a cross-section (right). (B, D) Neuron strain vs. body curvature in (B) control, TRN::GFP animals and (D) him-4(1267) mutants. For each genotype and cell, we examined 4–8 neurons in an equal number of animals over the total number of video frames indicated in parentheses. Animals that failed to move during the observation time were excluded from the analysis.
Figure 3 with 1 supplement
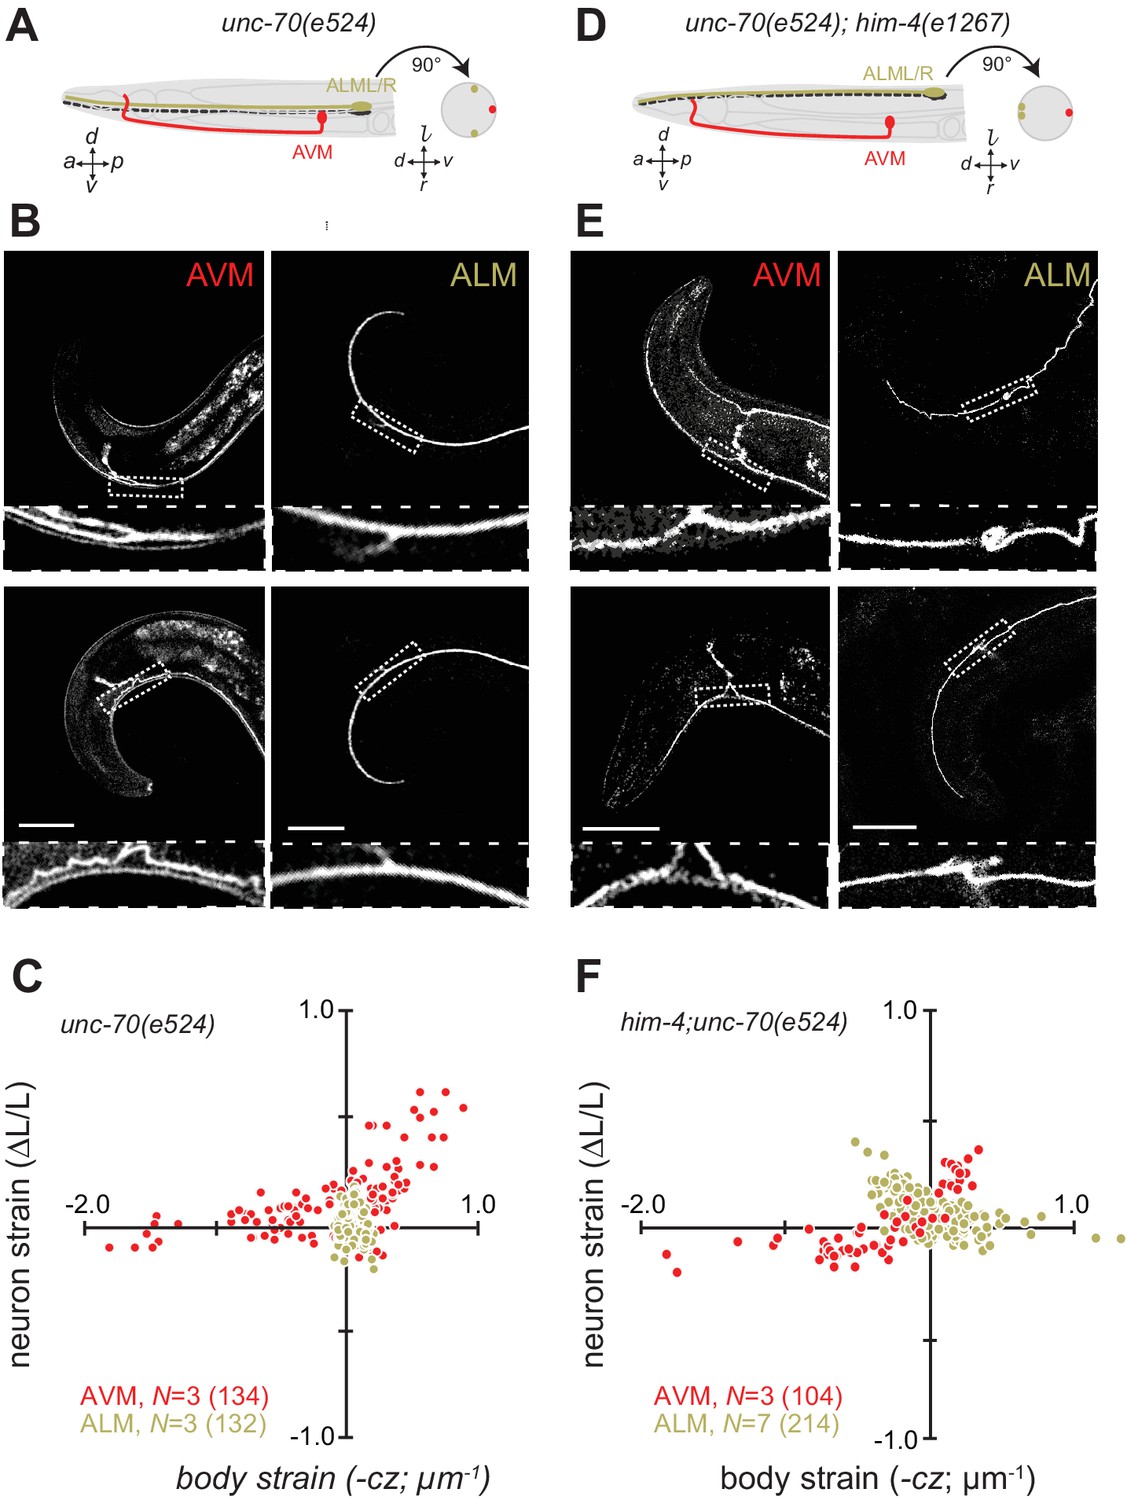
Axons position with tissue determines sensitivity to defects in unc-70 β-spectrin.
(A) Schematic showing the position of AVM (red) and ALM (green) from the side (left) and in a cross-section (right) in unc-70(e524) missense mutants. (B) Still images of AVM and ALM during dorsal (top) and ventral bending (bottom) in unc-70(e524) animals. Scale = 50 µm. Images are from Video 11 (AVM) and Video 12 (ALM). Anterior is to the left and ventral is down. (C) Normalized neuron length change (△L/L, strain) plotted against the axial component of the bending strain (curvature × distance from centerline, ) during body bending. (D) Schematic showing the position of AVM (red) and ALM (green) from the side (left) and in a cross-section (right) in unc-70(e524);him-4(e1267) animals. The him-4 mutation displaces ALM to the dorsal surface of the animal’s body. (E) Still images of AVM and ALM during dorsal (top) and ventral bending (bottom) in him-4(e1267) animals. Scale = 50 µm. Images are from Video 13 (AVM) and Video 14 (ALM). (F) Normalized neuron length change (△L/L, strain) is plotted against the axial component of the bending strain (curvature times distance from centerline, ) during body bending. AVM and ALM were visualized using the uIs31 transgene driving GFP expression only in the TRNs. Sub-panels in (B) and (E) show a magnified view of the respective neuron taken from the area indicated by the dotted box. In panels (C) and (F), N = total number of axons analyzed per genotype and the number in parentheses gives the number of video frames analyzed. Animals that failed to move during the observation time were excluded from the analysis.
Figure 3—figure supplement 1
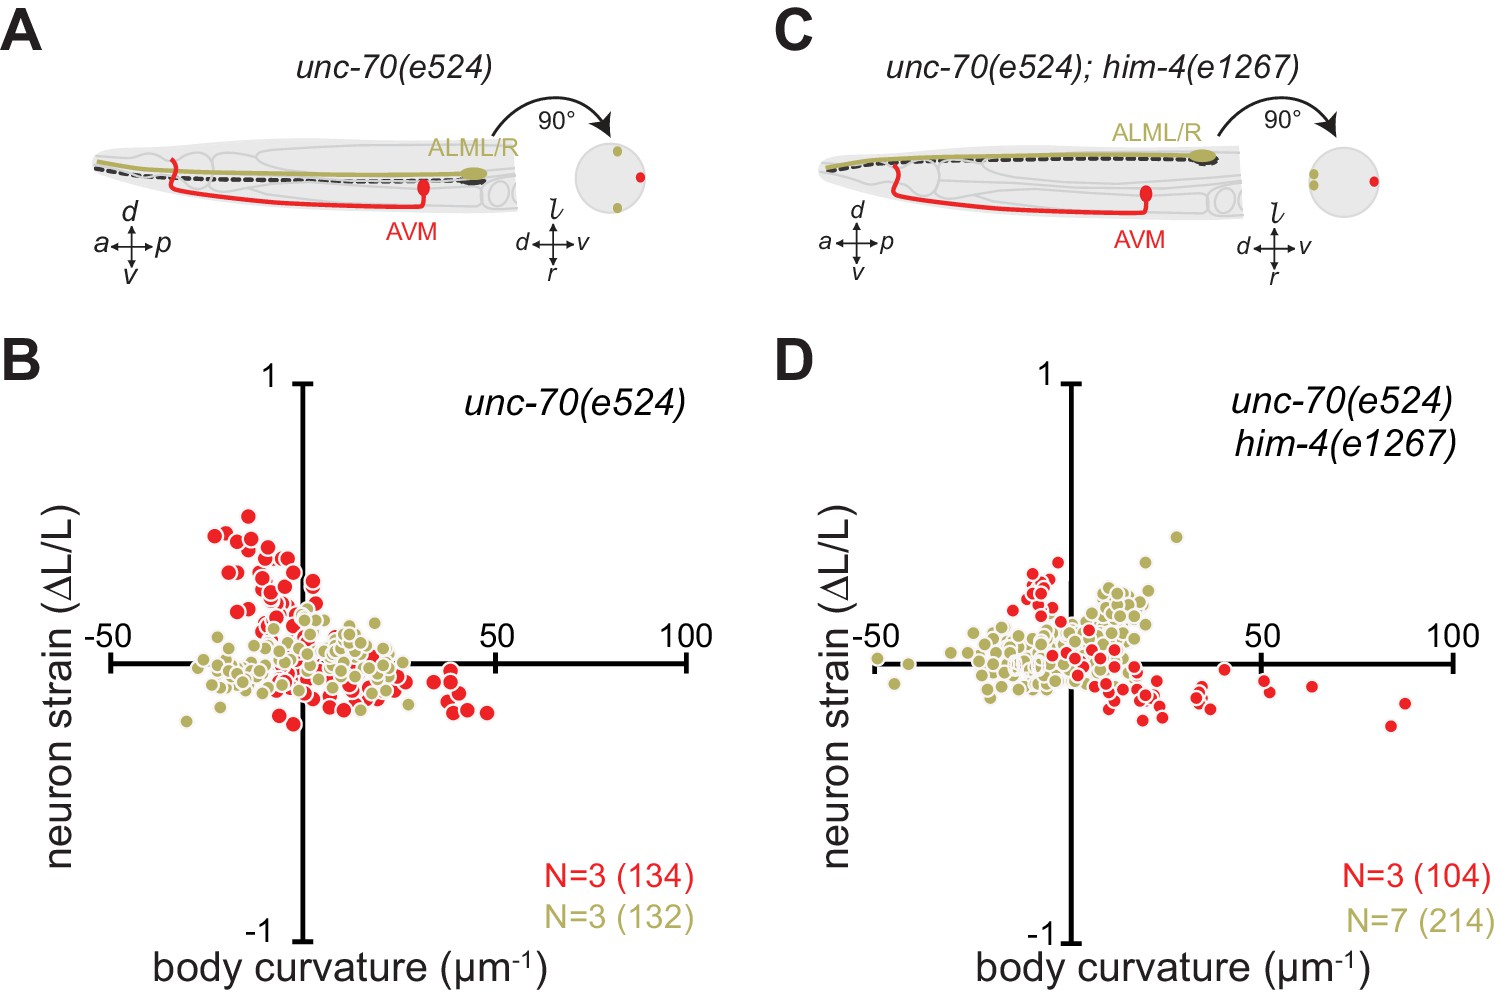
The length change (strain) of TRNs axons depends on body posture and anatomical position.
(A, C) Schematic showing the position of AVM (red) and ALM (green) from the side (left) and in a cross-section (right). (B, D) Neuron strain vs. body curvature in (B) control, TRN::GFP animals and (D) him-4(1267) mutants. For each genotype and cell, we examined 4–8 neurons in an equal number of animals over the total number of video frames indicated in parentheses. Animals that failed to move during the observation time were excluded from the analysis.
Figure 4 with 3 supplements
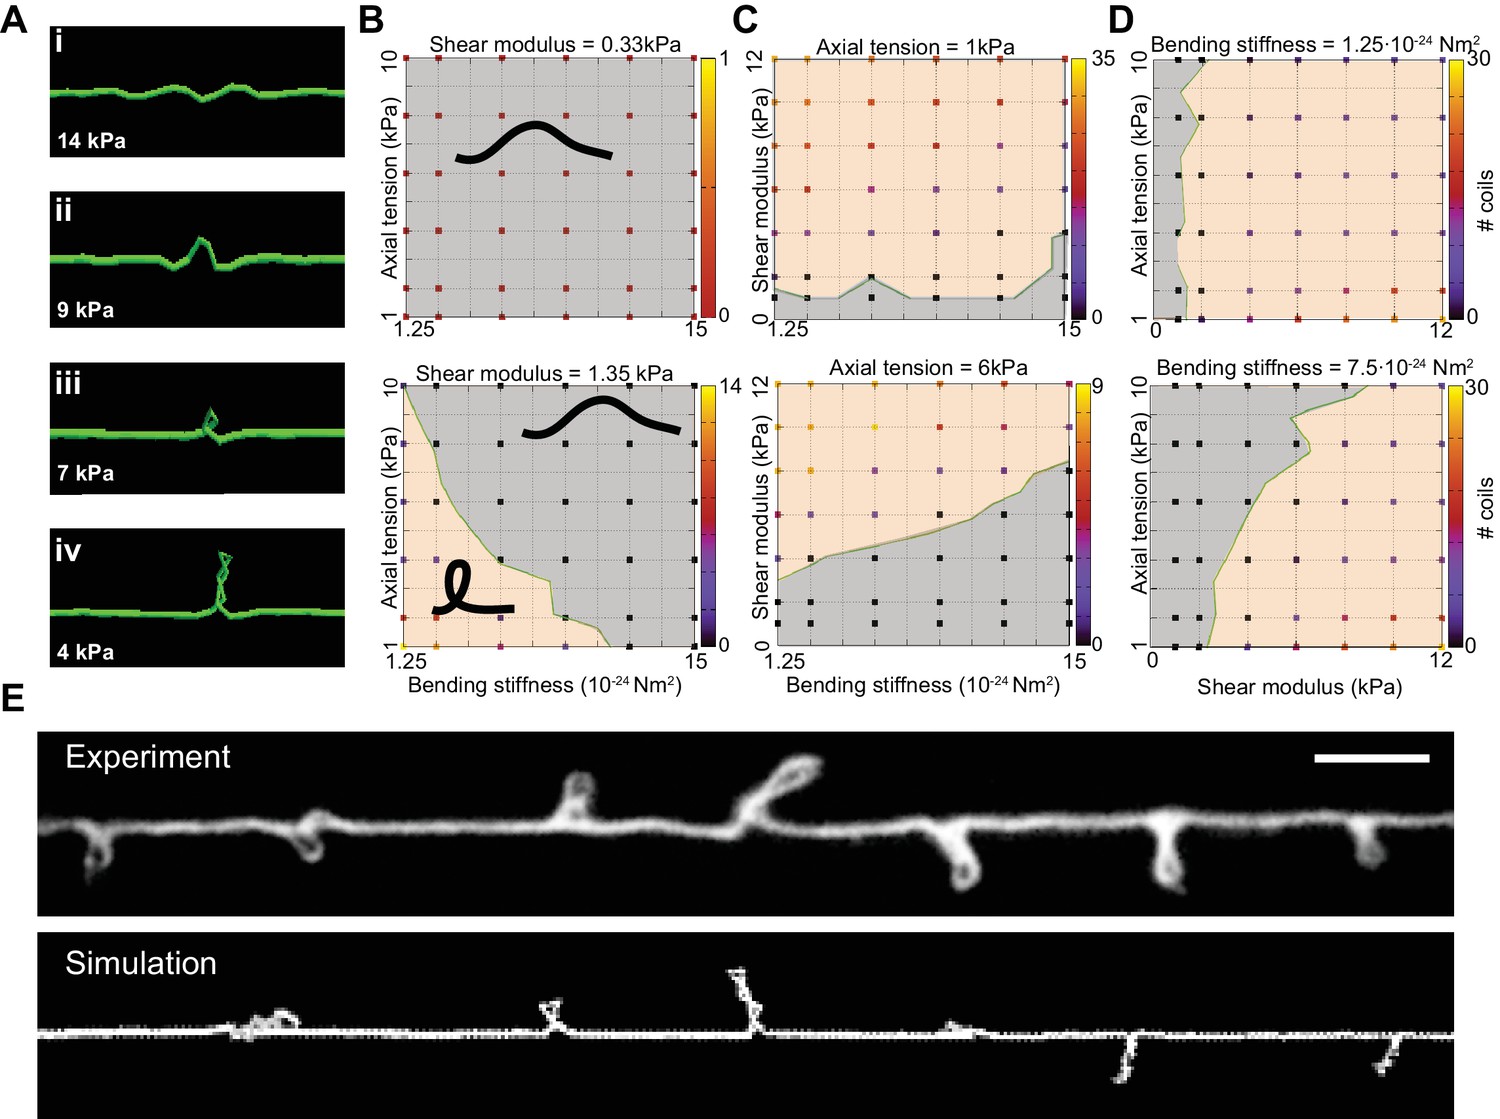
Simulation of axon shape with varying mechanical properties.
(A) Representative images derived from simulations based on a discrete elastic rod or DER model (Methods, Appendix) using the following parameters: B = 510−24 N m2, G = 1.35 kPa and the value of for tension as indicated in each panel. In this example, tension decreases from top to bottom: (i) Stiff and twisted neuron remains straight. (ii) A slight decrease in tension causes local bends and spiraling. (iii) Further reduction in tension leads to the transfer of torsional energy into bending of the rod and the formation of local coils. (iv) Further reduction in tension causes the coils in the model neuron to rotate, leading to plectonemes spaced at regular intervals. (B) Parameter space plot of a simulated neuron subjected to low torque (top, shear modulus, G = 0.33 kPa) or higher torque (bottom G = 1.35 kPa) and varying axial stiffness and bending stiffness. For panels (B–D), vertex color shows the number of coils predicted for pair of values for tensile modulus and bending rigidity, according to the scale to the right of each plot. Gray areas indicate conditions with no coils; beige areas indicate conditions with at least one coil; green line indicates the boundary between the two shape phases. (C) Parameter space plot of a simulated neuron under low (top, 1 kPa) and high tension (bottom, 6 kPa) and varying shear modulus and bending stiffness. (D) Parameter space plot of a simulated neuron with low (top, 1.2510−24 Nm2) and high bending stiffness (bottom, 7.510−24 Nm2) and varying shear and elastic moduli. Bending stiffness was calculated according to B=EI, with I as the second moment of inertia. (E) Comparison of the morphology of an TRN in ptl-1(ok621); unc-70(e524) double mutant animals with a simulation result of our DER model with the following parameters: bending stiffness = 7.510−24 Nm2; shear modulus = 8 kPa; axial stiffness = 1 kPa. Scale = 10 µm.
Figure 4—figure supplement 1
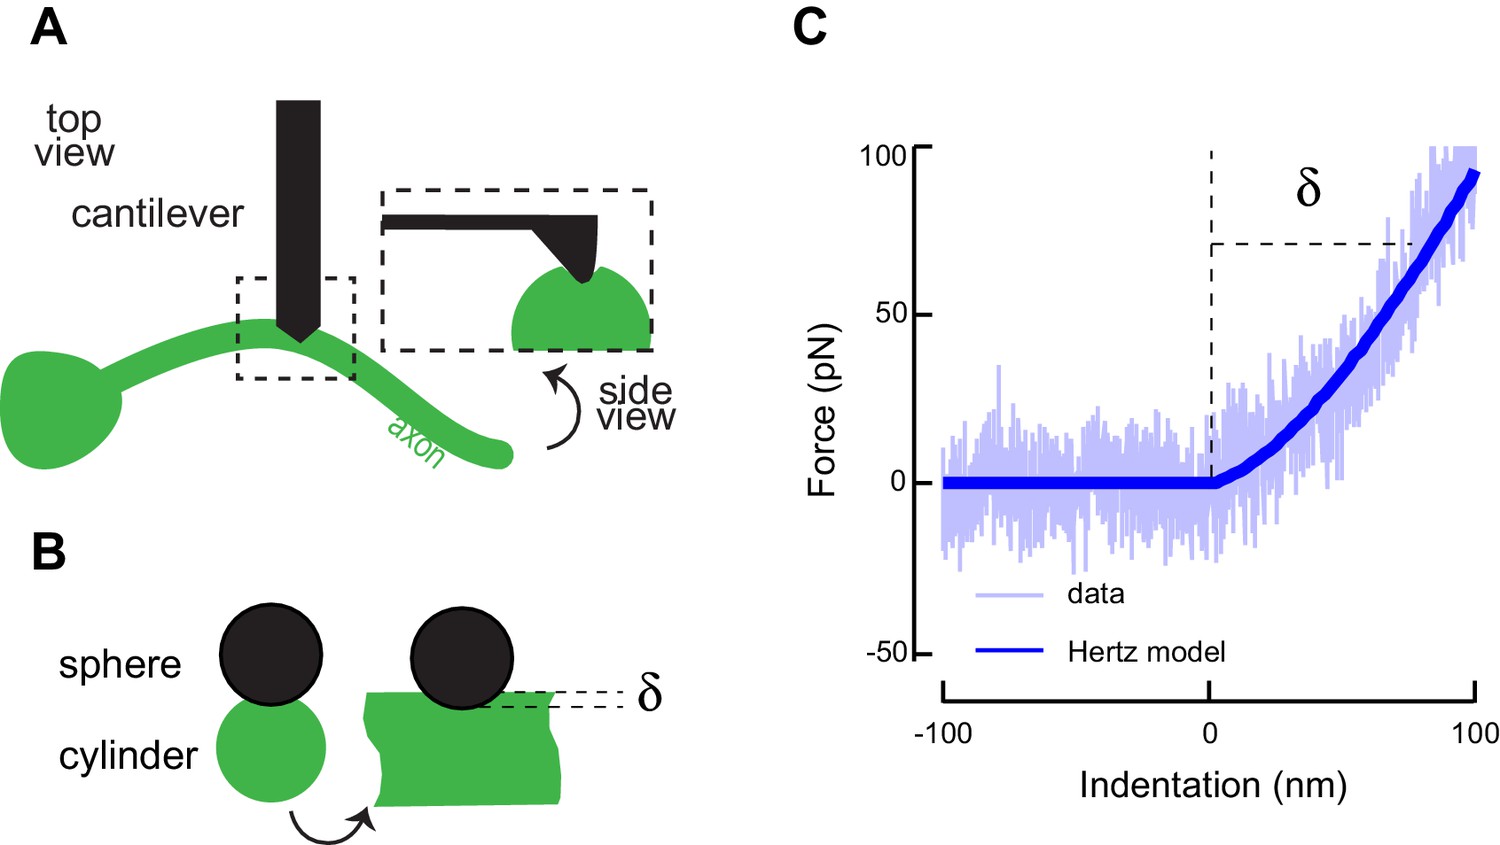
Atomic force microscopy on axons of isolated TRNs.
(A) Schematic representation of the atomic force microscopy assay and contact geometry, following Puttok and Thwaite (Puttock and Thwaite, 1969). (B) Indentation was modeled as a sphere-cylinder contact, with a 60 nm nominal tip diameter of the conical indenter and 100 nm radius for the TRN as determined from TEM images. (C) Representative AFM force-indentation curve taken on TRN axon in vitro. TRNs were identified in the mixed cultures by the expression of GFP. The thick line is a fit of the data with a Hertz contact model of a sphere and a cylinder.
Figure 4—figure supplement 2
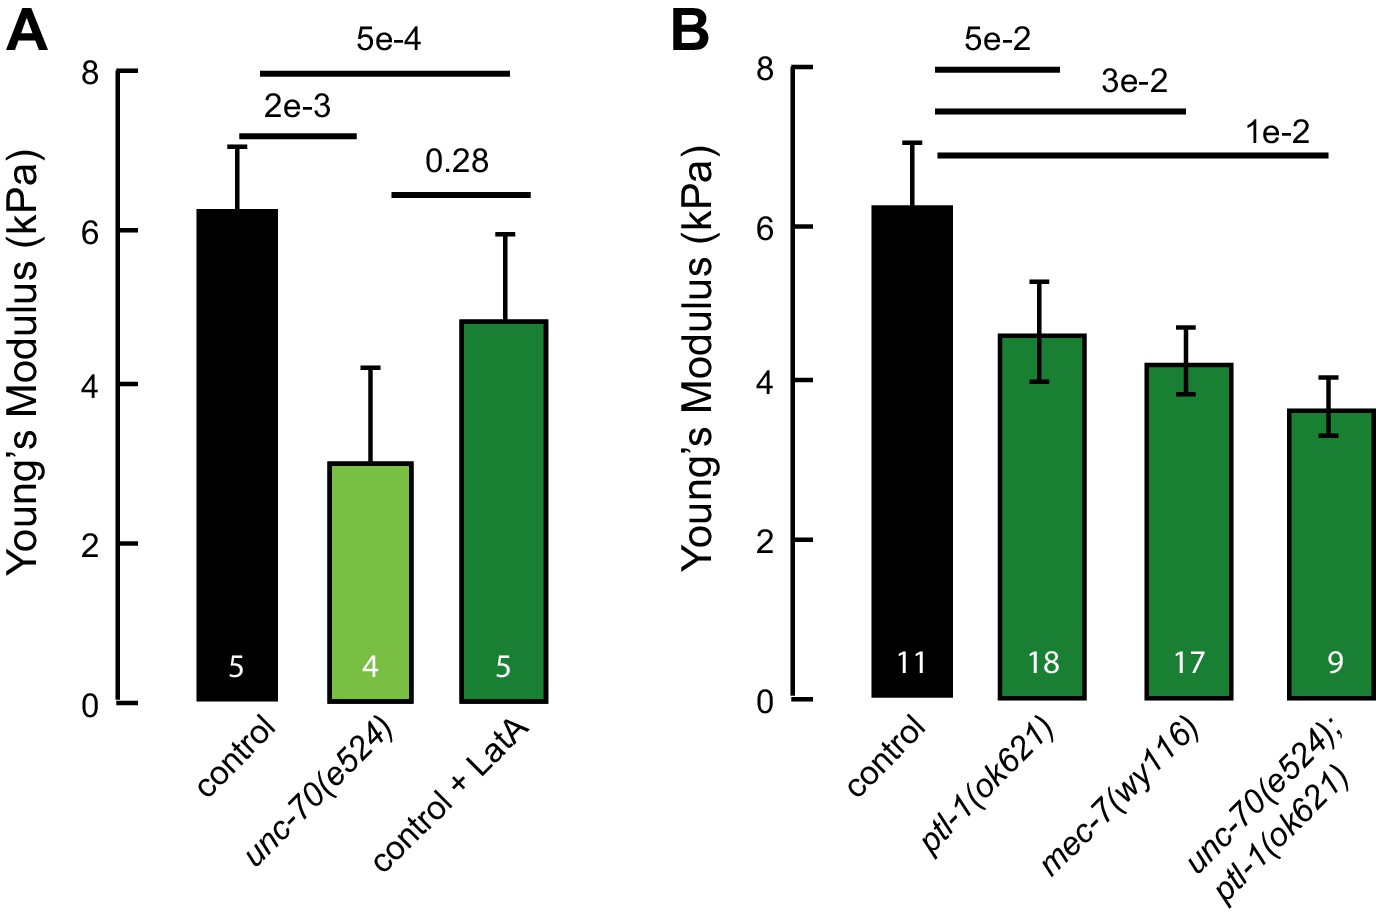
Elastic moduli of axons of touch receptor neurons in vitro.
(A) Elastic (Young’s) modulus for control neurons, neurons treated with 1 µM of the actin depolymerizing drug Latrunculin A, and unc-70(e524) mutant neurons. (B) Elastic (Young’s) modulus for control neurons, ptl-1(ok621), mec-7(wy116) and unc-70(e524);ptl-1(ok621) double mutant neurons. Numbers on each bar indicate the number of axons tested for each genotype or condition.
Figure 4—figure supplement 3
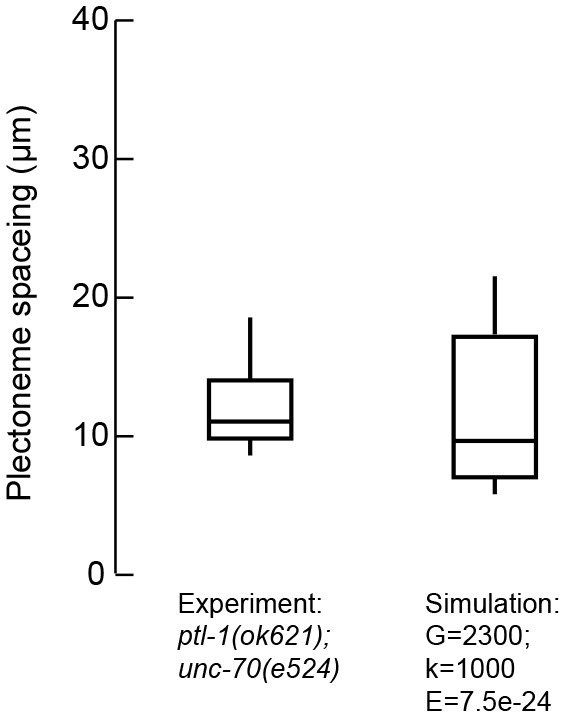
The distance between plectonemes in mutant and simulated axons.
Plectoneme spacing in ptl-1(ok621);unc-70(e524) double mutants (n = 13 animals and 121 plectonemes) and DER simulations with the following parameters: G = 2333 Pa, k = 1 kPa and B = 7.5 N m2.
Figure 5 with 2 supplements

Spectrin forms an actin-dependent, periodic cytoskeleton in vitro.
(A–E) Representative confocal (left), STED super-resolution images (center), and power spectral density (PSD) profiles (right) of TSMod::β-spectrin (A) and α-spectrin SPC-1::GFP (B–E) in C. elegans axons in vitro. In panels (A–E), yellow (β-spectrin) and red (α-spectrin) traces show intensity profiles derived from STED images. Scale bar = 1 µm. A single PSD curve (gray) and Lorentzian fit (black) is shown for each STED image. Cells were dissociated from transgenic embryos and cultured on glass coverslips for three days. Similar images were obtained from at least 20 axons examined per condition (genotype, label, treatment) from at least three biological replicates. (A, B) Spectrin in control axons (left, center) and PSD showing strong peaks at 204 and 207 nm for TSMod::β-spectrin and α-spectrin::GFP, respectively. (C) SPC-1::GFP in control neurons treated with the actin depolymerizing agent, Latrunculin A (1 µM) (left, center). The PSD lacks any strong peaks, indicating that this treatment disrupts spectrin periodicity. (D) SPC-1::GFP in unc-70(s1502) β-spectrin null mutant (left, center). As in panel C, the PSD (right) lacks any clear peaks. (E) SPC-1::GFP in unc-70(e524) β-spectrin missense mutant. The PSD has a single strong peak at 185 nm. (F) Average distance between adjacent spectrin labels for TSMod::β-spectrin (top, n = 27) in control neurons; α-spectrin::GFP (middle, n = 31) in control neurons; and SPC-1::GFP (bottom, n = 20) in unc-70(e524). Spacing computed as the inverse distance of the dominant peak in PSD.
Figure 5—figure supplement 1

Fluorescent labeling strategy on α/β-spectrin.
Schematic showing the labeling strategy we used to investigate the structural organization of the spectrin cytoskeleton in transgenic C. elegans neurons. SPC-1 α-spectrin carries a GFP at the C-terminus and UNC-70 β-spectrin carries TSMod its N-terminus. Fluorescent proteins were detected by antibodies carrying STED-compatible fluorophores (Materials and methods). The separation neighboring C-terminal GFP tags on α-spectrin (Sarov et al., 2012) and neighboring N-terminal TSMod-tags on β-spectrin (Krieg et al., 2014) represent the length of single α2-β2 spectrin tetramer.
Figure 5—figure supplement 2
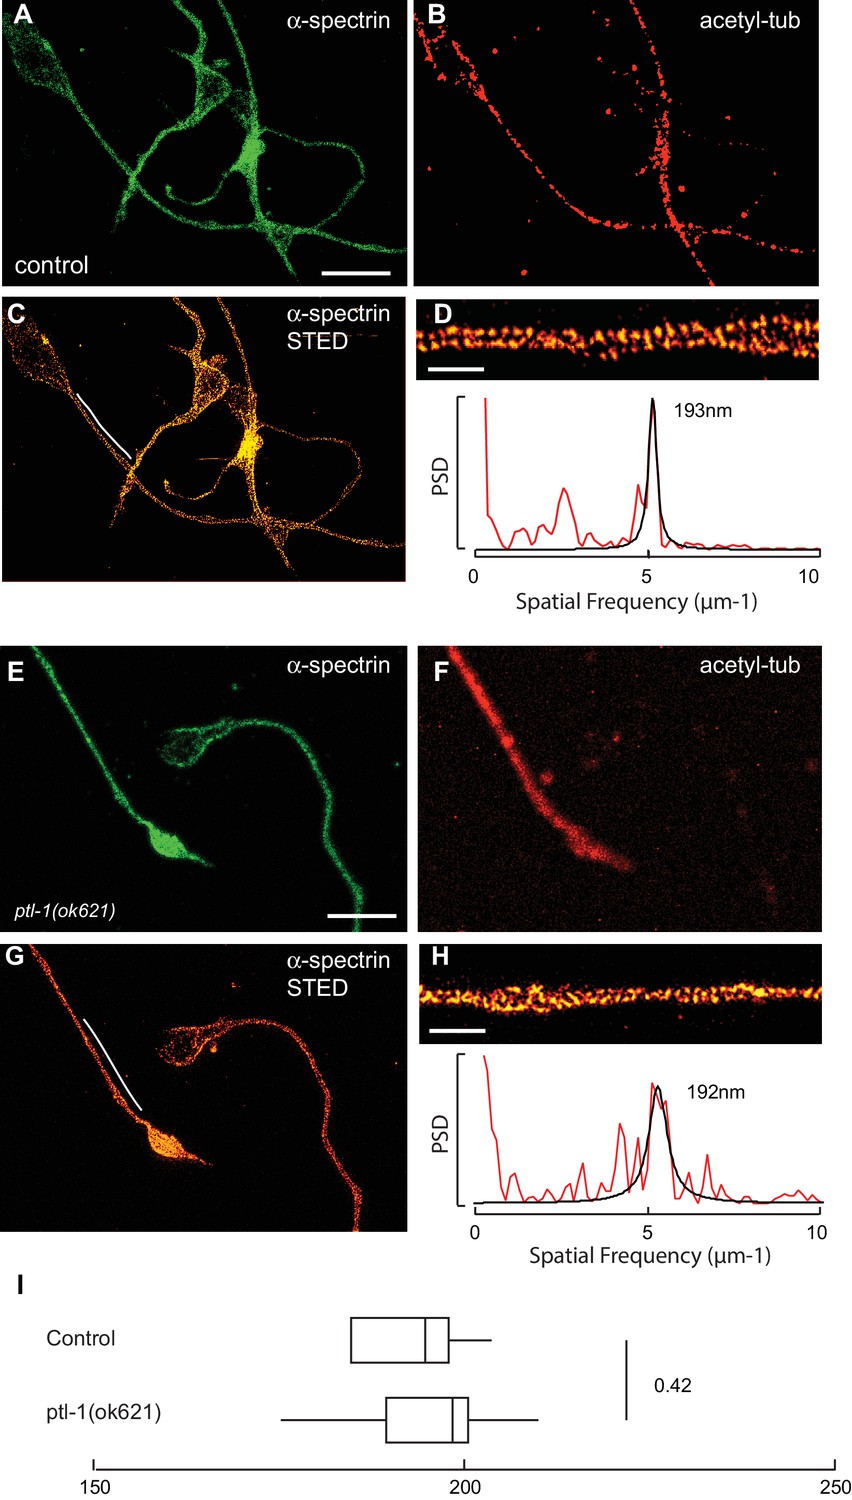
Spectrin network periodicity is similar in control and ptl-1(ok621) TRNs.
(A–C) Confocal (A, B) and STED (C) images of control neurons expressing SPC-1::GFP. TRNs were identified in culture by labeling with antibodies against acetylated α tubulin, which preferentially labels TRNs (Fukushige et al., 1999). Scale = 5 µm (panel a and e); Scale = 1 µm (panel in e and h). (D) Magnified and deconvolved STED image of SPC-1::GFP α spectrin in the TRN segment indicated by the white line in panel c (top) and PSD of the intensity profile of this image (bottom). (E–G) Confocal (E, F) and STED (G) images of ptl-1 mutant neurons expressing SPC-1::GFP. Only one neuron was positive for acetylated α tubulin, which identifies it as a TRN. (H) Magnified and deconvolved image of the TRN segment indicated by the white line in panel g (top) and PSD of the intensity profile of this image (bottom). (I) Box-Whisker plot comparing α-spectrin periodicity in control and ptl-1(ok621) mutant TRNs isolated from embryos and cultured for three days on glass. p-value is computed from a Mann-Whitney U-test.
Figure 6 with 3 supplements
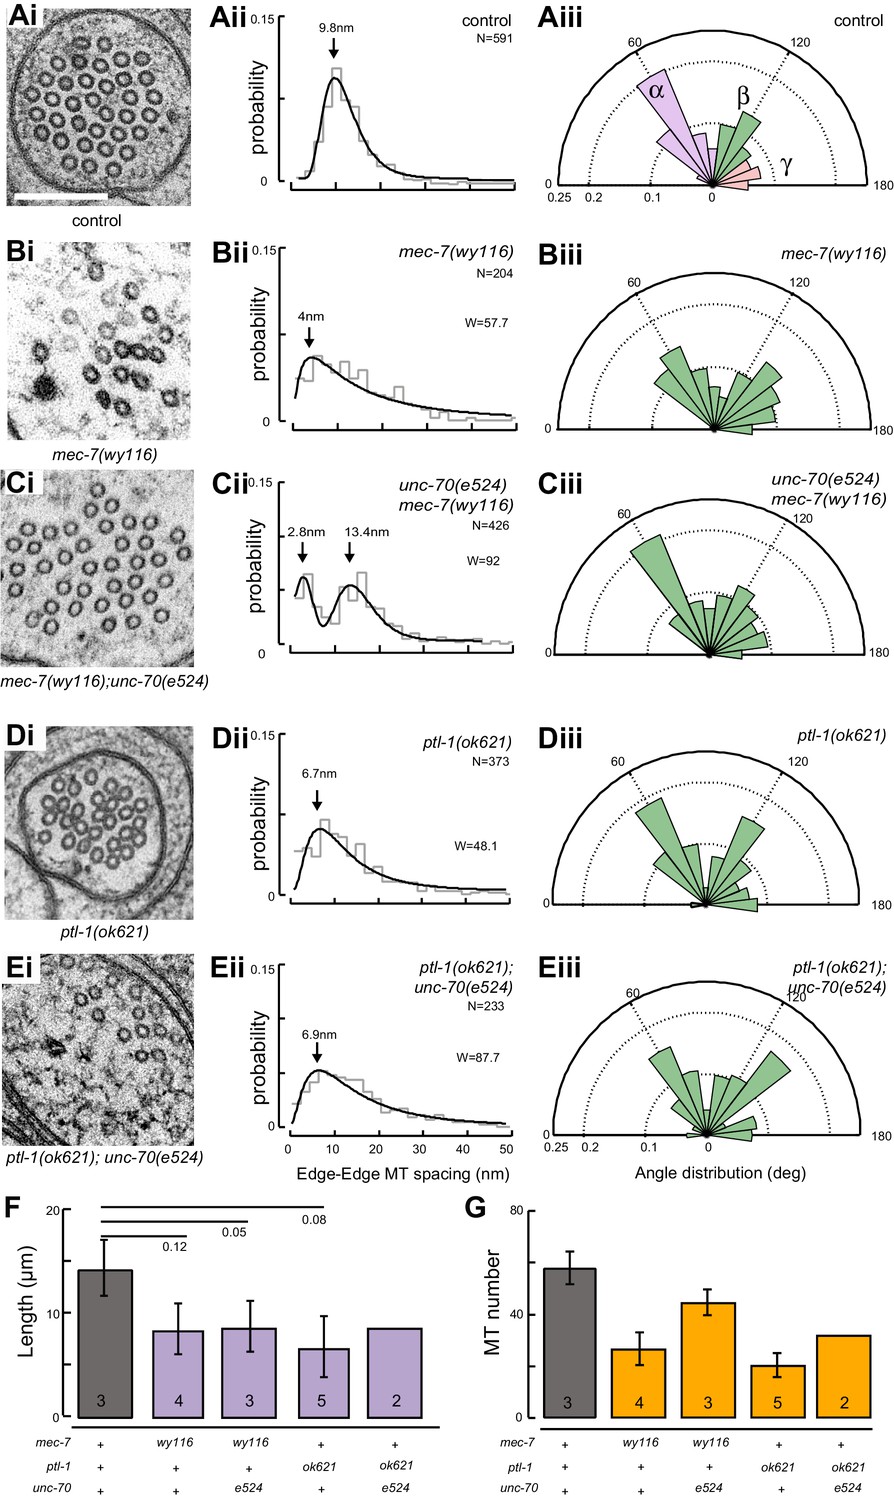
Loss of PTL-1 tau and defects in MEC-7 β tubulin disrupt the organization of microtubule bundles in vivo.
(A–E) Organization of microtubule bundles in control and mutant TRNs illustrated by electron micrographs (sub-panel i), the edge-to-edge distances between adjacent MTs (sub-panel ii), and inter-MT angles (sub-panel iii). The genotypes shown are. (A) Control: uIs31[mec-17p::GFP]. (B) mec-7(wy116); uIs31. (C) unc-70(e524);mec-7(wy116); uIs31. (D) ptl-1(ok621); uIs31. (E) ptl-1(ok621);unc-70(e524); uIs31. For electron micrographs (sub-panels i), the scale bar is 200 nm. Between 13 and 25 sections drawn from at least five datasets/genotype were analyzed to derive the data in sub-panels ii and iii. Inter-MT angles were computed as described in the Materials and methods and illustrated in Figure 6—figure supplement 1. The variances in the distribution of edge-to-edge MT spacing are significantly different if W is larger than the critical value Wc = 3.85 (for p>0.05), using Levene’s test adjusted for the median. The distribution of angles in mutants was not significantly different from wild type according to Watson U2 test for circular distributed data. (F) Average microtubule length as a function of the indicated genotypes. Error bars indicate S.E.M. for the number of datasets indicated on each bar. (G) Average microtubule number for the indicated genotypes. Error bars indicate S.E.M. for the number of datasets indicated on each bar.
Figure 6—figure supplement 1
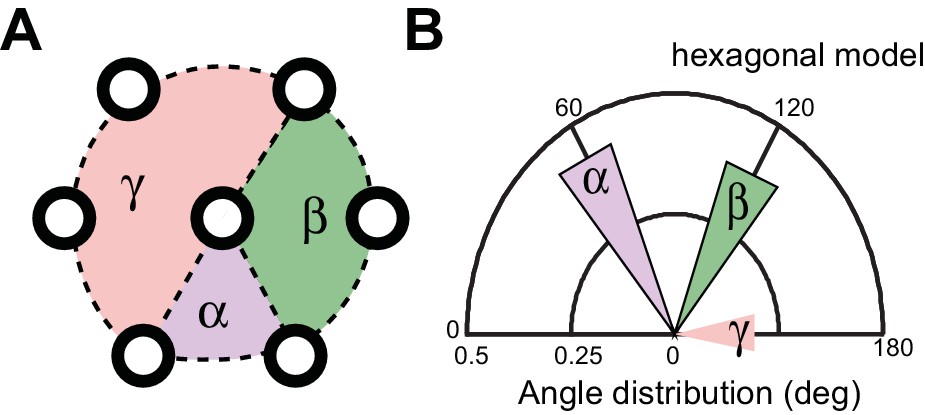
Method for measuring the angles between three neighboring MTs.
(A) Schematic of a hexagonal array, which is characterized by three major angles at 60, 120, and 180°. (B) Distribution of angles expected from an ideal hexagonal array.
Figure 6—figure supplement 2
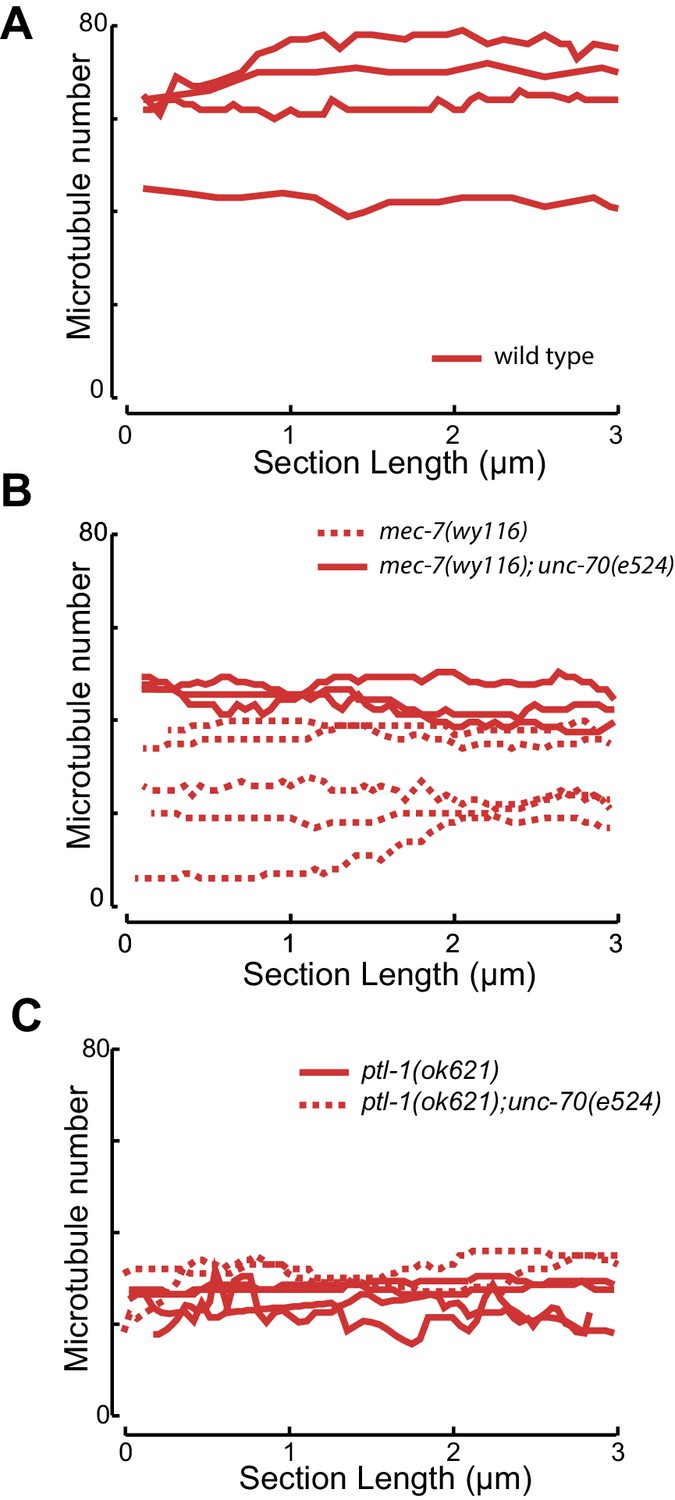
Microtubule number as a function of distance for (A) control and (B) mec-7(wy116) single and mec-7(wy116); unc-70(e524) double mutant and (C) for ptl1(ok621) and ptl-1(ok621); unc-70(e524) double mutants.
https://doi.org/10.7554/eLife.20172.035
Figure 6—figure supplement 3
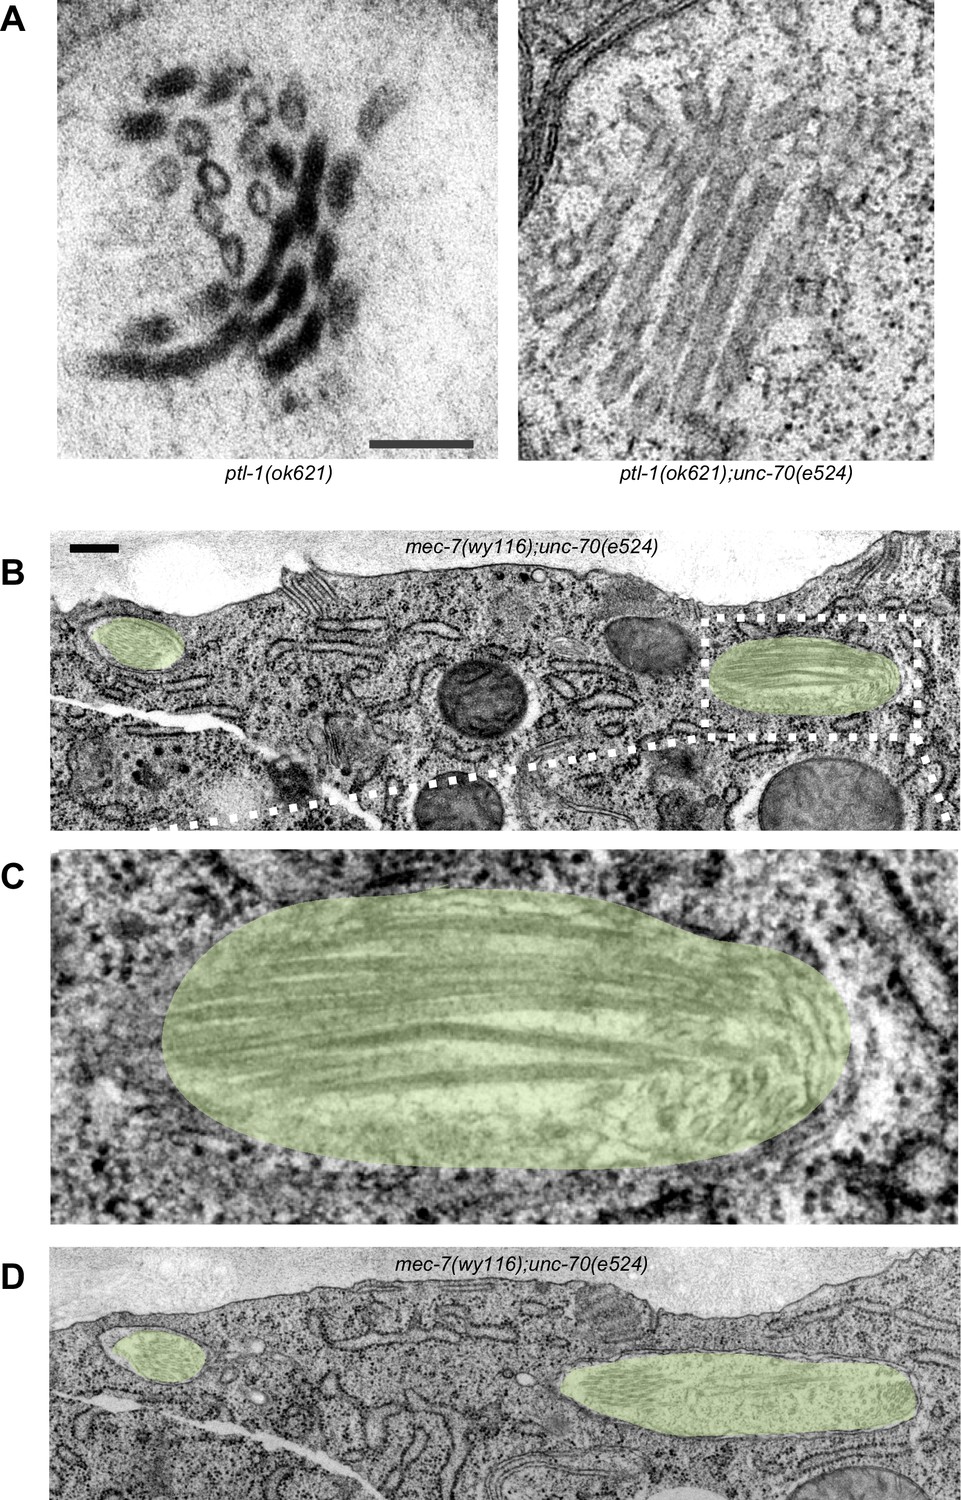
Defects in MT bundle architecture and examples of putative plectoneme structures.
(A) Electron micrographs showing TRNs in ptl-1(ok621) single (left) and ptl-1(ok621); unc-70(e524) double (right) mutants. These images illustrate the distortions of the MT bundle and oblique MT cross-sections that were evident in some, but not all sections. Scale = 100 nm. (B) Transmission electron micrograph of a mec-7(wy116); unc-70(e524) TRN showing a severely deformed bundle that displaces the TRN laterally. Scale = 100 nm. (C) Magnified view of the dotted area in panel B. (D) Transmission electron micrograph of the same mec-7(wy116); unc-70(e524) TRN as in panel B. All panels are from a cross-section well-oriented perpendicular to the anterior-posterior axis of the worm, possibly resolving a plectoneme or coil visible in the fluorescent micrograph. Areas corresponding to TRNs are highlighted by a yellow overlay.
Figure 7
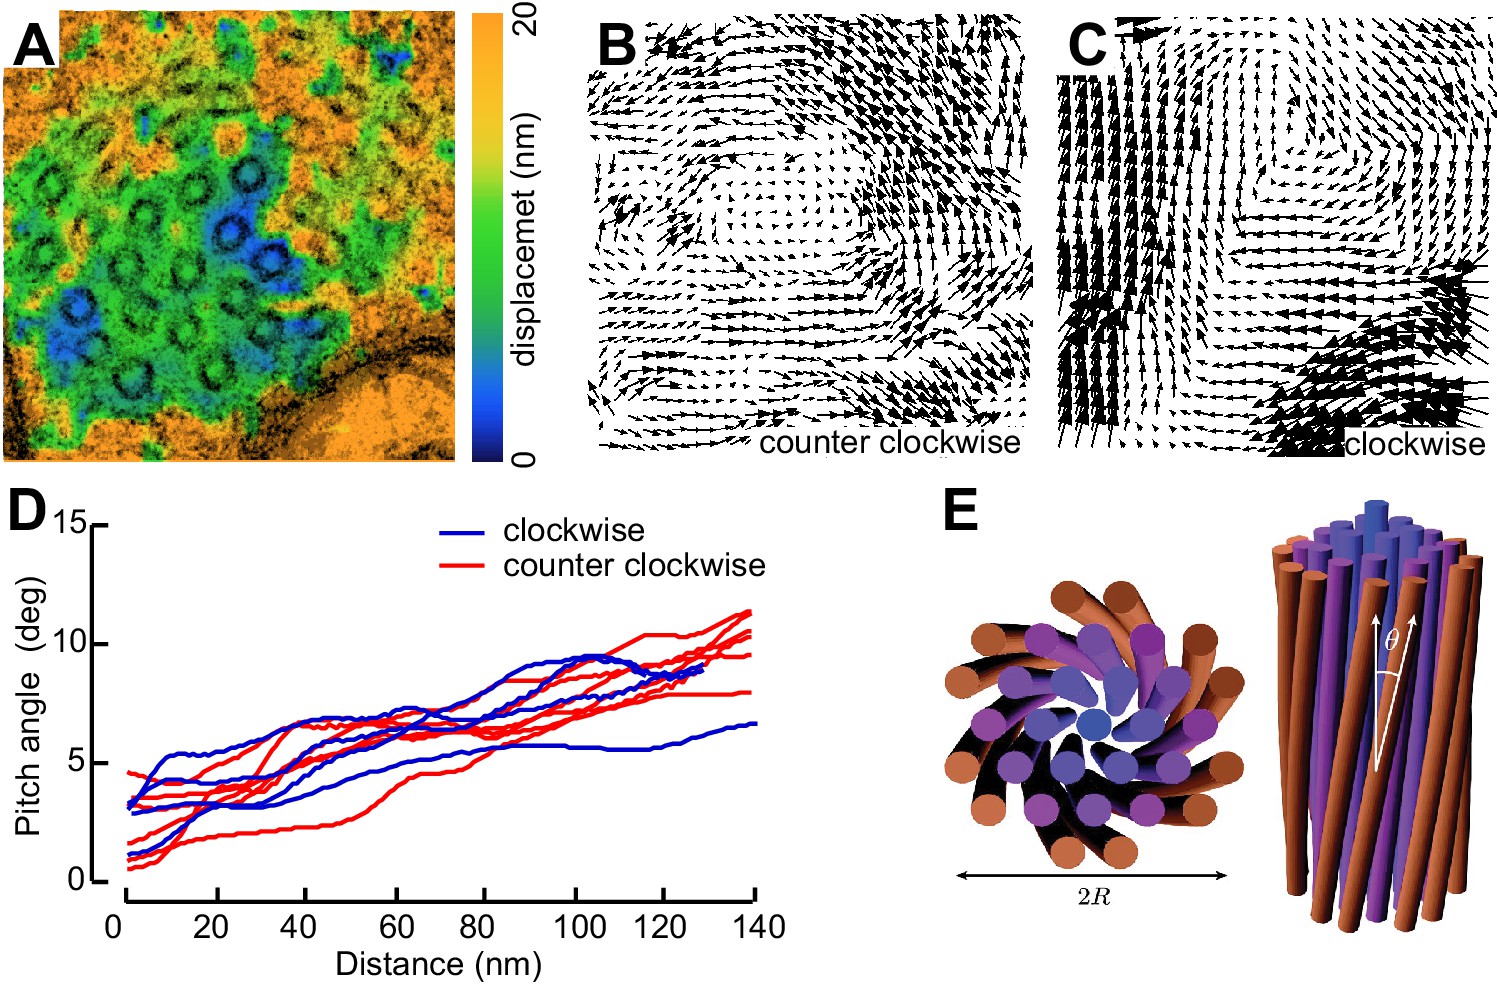
MTs twist around one another in PTL-1 tau mutants.
(A) Minimum intensity projection (MIP) of two consecutive electron micrographs of an unc-70;ptl-1 double mutant TRN superimposed on a heat map showing the magnitude of the displacement vector derived from PIV analysis of this image pair. Color scale indicates displacement magnitude. See also Video 17. (B) Flow field for the pair of sections shown in A. The size and direction of the arrows indicate displacement of the optical density between these frames. Note the counterclockwise rotation of the bundle around the central axis. (C) Flow field for a different pair of consecutive sections, showing clockwise rotation, in agreement with the helical perversion seen in Video 17. (D) Plot of the helical pitch angle as a function of the radius from the center of the bundle. (E) Schematics of the helical pitch angle of a twisted filament bundle.
© 2007 American Physical Society. All Rights Reserved. Reproduced with permission from Figure 1 from Grason and Bruinsma (2007).
Figure 8
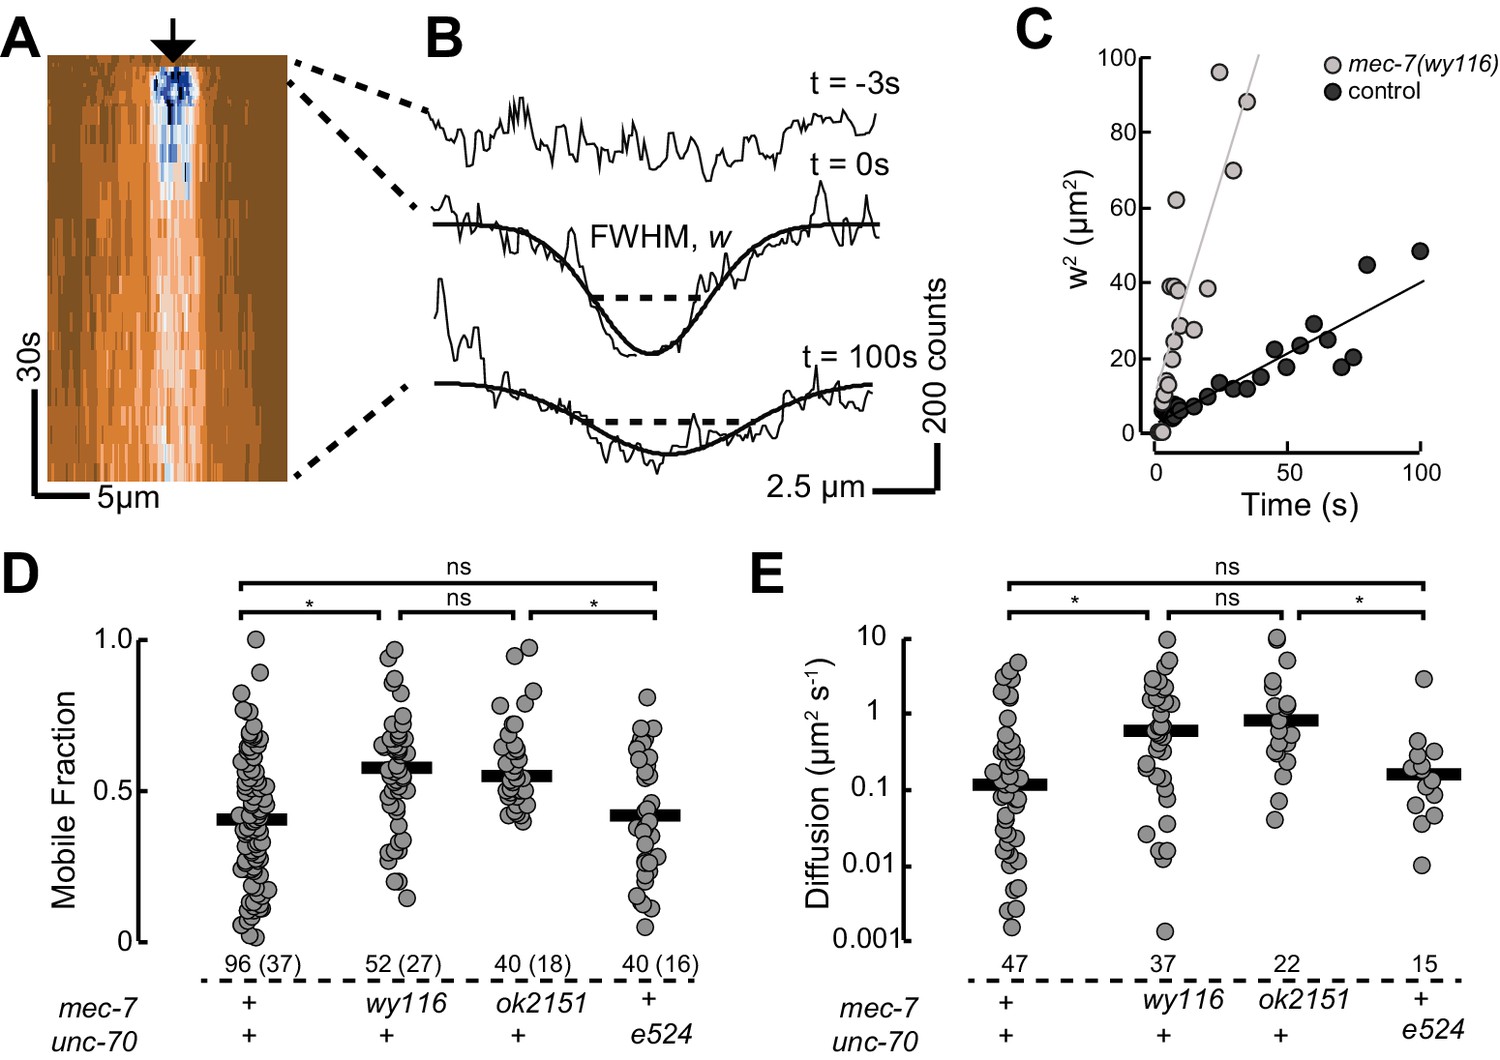
PTL-1 is more mobile in mec-7(wy116) mutants than control.
(A) Representative kymograph of PTL-1::mNG expressing control animals. The arrowhead points to the position, time, and bleaching area (2 µm wide). The color scale encodes low fluorescence in blue and high fluorescence in ochre. (B) Intensity profiles t = 0.7, 2.8, and 21 s after bleaching. Smooth lines are Gaussian fits used to estimate the width of the bleached area. Diffusion of PTL-1::mNG into the bleached area results in an increase of the full-width at half maximum (FWHM). (C) Plot of squared FWHM vs. time. Smooth lines are fits to the data and their slope = 2D, where D is the apparent diffusion constant, which had values of 1 µm2 s−1 (n = 47) and 3 µm2 s−1 (n = 37) for control and mec-7(wy116) animals, respectively. (D) Mobile fraction of PTL-1::mNG in the indicated genotypes. Numbers of FRAP curves and (animals) used for each experiment. Asterisks indicate statistically significant differences according to Dunn-Holland-Wolfe non-parametric test for multiple comparisons. (E) Diffusion constant of PTL-1::mNG in the indicated genotypes for a subset of the data from panel D). FRAP experiments were performed in both ALM and PLM neurons in vivo.
Figure 9 with 2 supplements
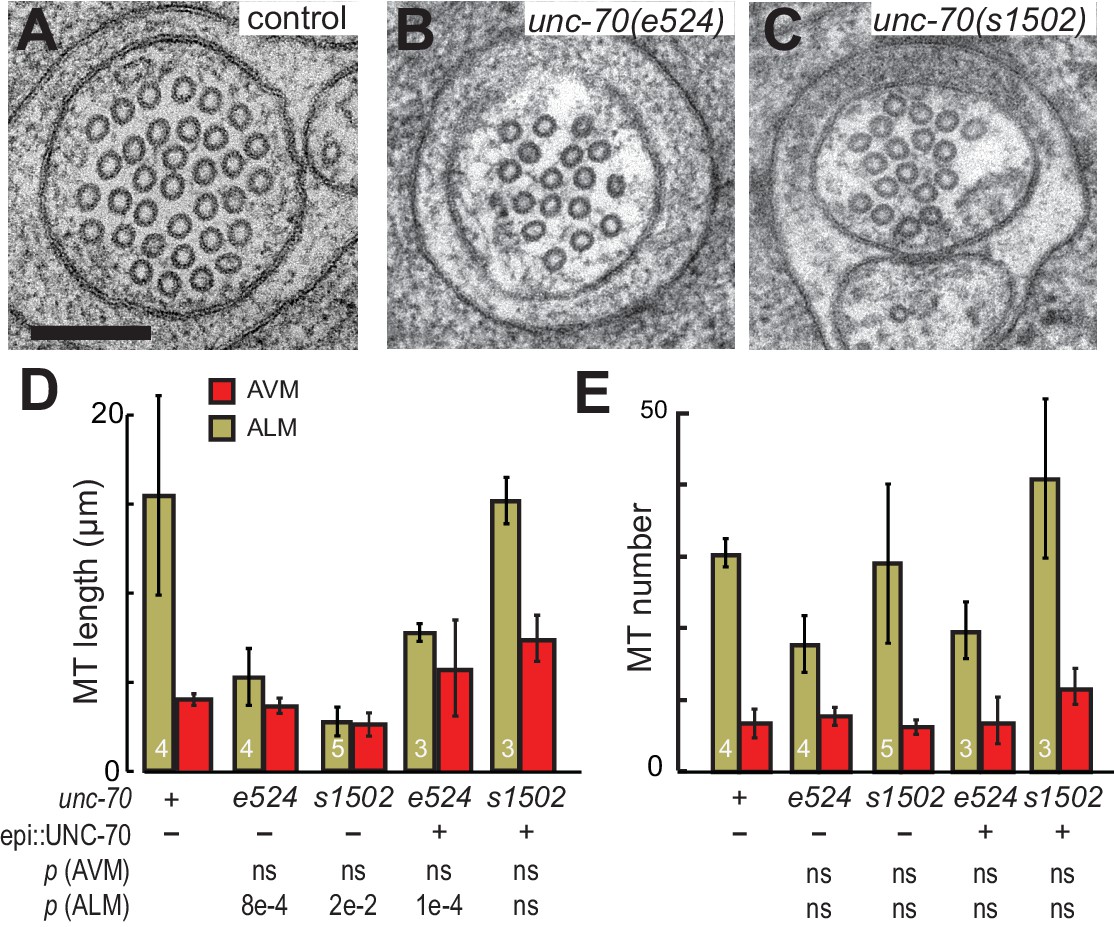
The spectrin cytoskeleton stabilizes microtubule bundles.
(A–C) Representative transmission electron micrographs of control, TRN::GFP animals (A), unc-70(e524) missense mutants (B) and unc-70(s1502) null mutants (C). All animals carry the TRN::GFP transgene. (D) Microtubule length as a function of the indicated genotype in AVM and ALM neurons, including transgenic strains in which wild-type UNC-70 was expressed under the control of an epidermal-specific promoter, epi::UNC-70. A two-way ANOVA of these data revealed a significant effect of both cell-type [F (1, 24)=16.54, p=0.0004] and genotype [F (4, 24)=8.401, p=0.0002] and the results of post-hoc comparisons (α = 0.05) to the control condition are indicated below (ns = not significant with a p-value greater than 0.3). (E) Microtubule number as function of the indicated genotype in AVM and ALM neurons. TEM sections that overlapped with support grids were excluded from analysis. According to a two-way ANOVA, there was a significant effect of cell-type [F (1,25)=28.94, p<0.0001] but not genotype [F(4, 25)=2.139, p=0.1057] on microtubule number. Post-hoc comparisons (α = 0.05) to the control genotype found no significant differences (ns = not significant with a p-value greater than 0.3), as indicated.
Figure 9—figure supplement 1
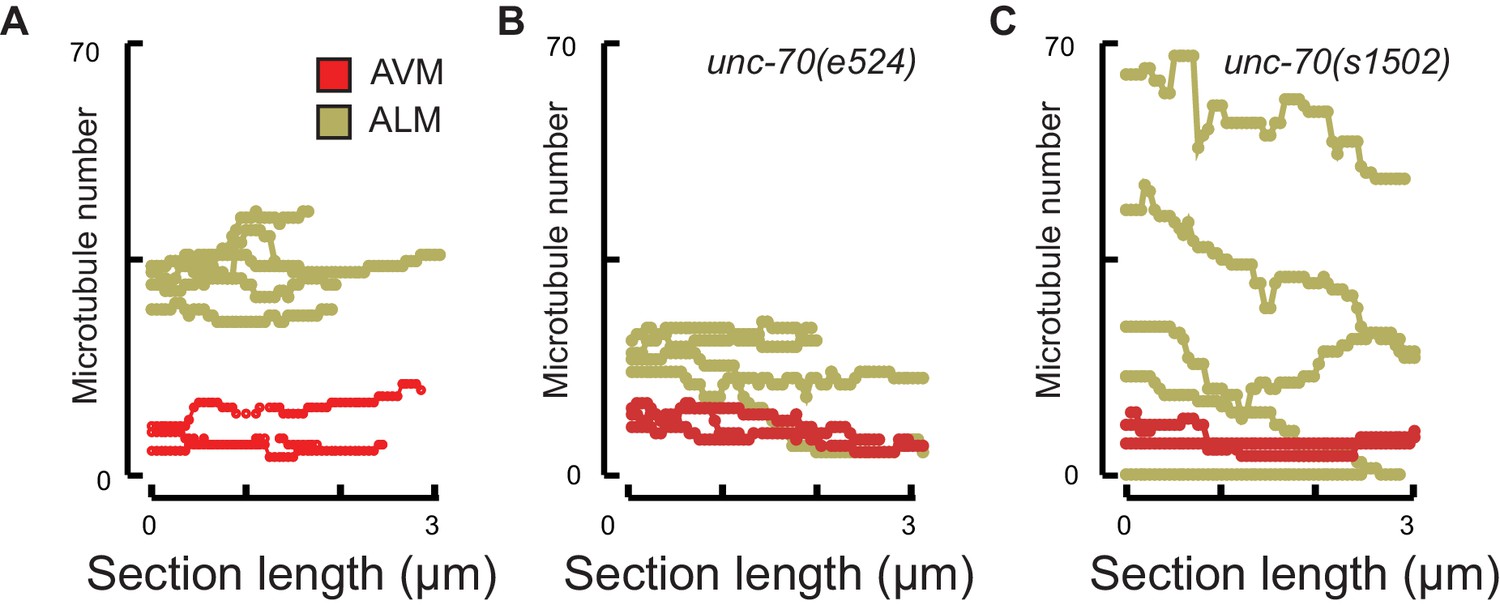
Microtubule number as a function of distance.
(A) control, TRN::GFP, (B) unc-70(e524) missense mutants, (c) unc-70(s1502) null mutants. Each trace shows the data for a single 3 µm ssTEM dataset and points correspond to invididual 50 nm sections.
Figure 9—figure supplement 2
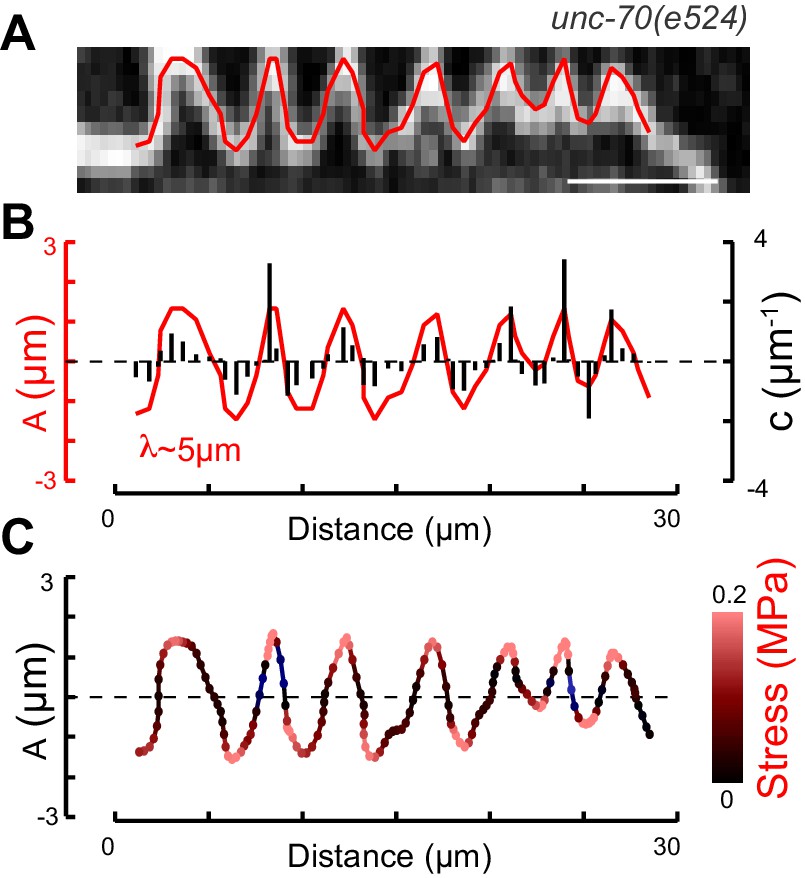
Postbuckling stress distribution in AVM TRN.
(A) Close-up of the buckling deformation seen in AVM neurons in unc-70(e524) mutant animals under compression. Scale bar = 10 µm. (B) Centerline of the neuron in (A) showing the amplitude of the buckling deformation and its characteristic buckling wavelength. Black lines indicate curvature at each pixel. (C) Interpolated centerline showing the stress distribution (red) as a function of x(s). Stresses have been computed according to with Young’s modulus E = 4.5 kPa, distance to the neutral bending axis, d = 21 µm and c as the curvature of the centerline assuming in plane deformation of the neuron.
Figure 10
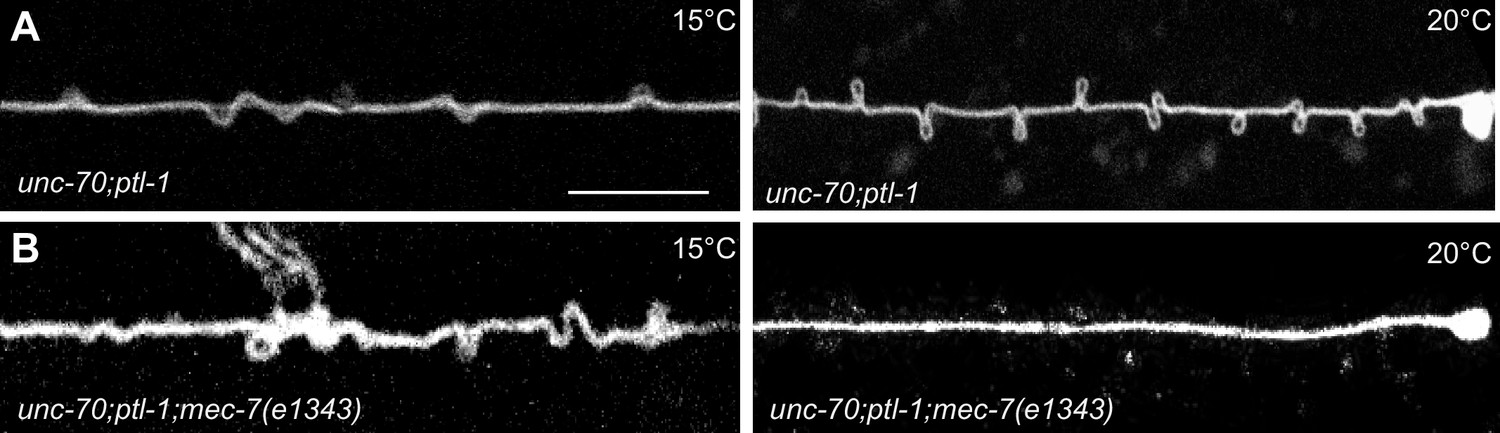
TRNs resemble a twisted thread in ptl-1 mutants.
(A) unc-70(e524); ptl-1(ok621) double mutant ALM TRNs grown at 15°C (left) and 20°C (right). Similar results observed in at least five animals per condition. Scale = 10 µm. (B) unc-70(e524); ptl-1(ok621); mec-7(e1343ts) triple mutant ALMs animal grown at 15°C (left) and 20°C (right). More loops are seen in the permissive temperature of 15°C than at the restrictive temperature of 20°C. Similar results observed in at least 10 animals/condition.
Videos
Video 1
Representative movie related to Figure 1 showing a GFP-labeled ALM neuron in an unc-70(e524); ptl-1(ok621) mutant background.
https://doi.org/10.7554/eLife.20172.006
Video 2
Dynamics of a single axonal defect in a moving unc-70(e524); ptl-1(ok621) animal.
Related to Figure 1.
Video 3
A twisted elastic nylon thread is held under tension.
Upon reduction of the end-end distance (by an increase in slack or reduction in tension), the initially straight thread first forms a continuous spiral, which then deforms into a localized, superhelical defect, called a plectoneme. Related to Figure 1.
Video 4
An untwisted elastic nylon thread is held under tension.
The thread remains straight until the tension is released. Upon further reduction of the end-end distance (effective compression), the thread begins to buckle with a single arc, reminiscent of classical Euler buckling. Related to Figure 1.
Video 5
Example of a laser axotomy that caused rotation along the axon’s longitudinal axis.
Cut occurs at the 10th movie frame. Related to Figure 1.
Video 6
Example of a laser axotomy that triggered the transformation of a localized helix into a loop after cutting.
Cut occurs at the third movie frame. Related to Figure 1.
Video 7
Representative movie related to Figure 2B showing a GFP-labeled AVM neuron in a control animal.
https://doi.org/10.7554/eLife.20172.014
Video 8
Representative movie related to Figure 2B showing a GFP-labeled ALM neuron in a wild-type control animal.
https://doi.org/10.7554/eLife.20172.015
Video 9
Representative movie related to Figure 2E showing a GFP-labeled AVM neuron in a him-4(e1267) mutant animal.
Scale = 50 µm.
Video 10
Representative movie related to Figure 2E showing a GFP-labeled ALM neuron in a him-4(e1267) mutant animal.
Scale = 50 µm.
Video 11
Representative movie related to Figure 3B showing a GFP-labeled AVM neuron in a unc-70(e524);uIs31 animal.
https://doi.org/10.7554/eLife.20172.020
Video 12
Representative movie related to Figure 3E showing a GFP-labeled ALM neuron in a unc-70(e524);uIs31 animal.
https://doi.org/10.7554/eLife.20172.021
Video 13
Representative movie related to Figure 3 showing a GFP-labeled AVM neuron in a him-4(e1267;unc-70(e524);uIs31 animal.
Scale = 50 µm.
Video 14
Representative movie related to Figure 3 showing a GFP-labeled ALM neuron in a him-4(e1267);unc-70(e524);uIs31 animal.
Scale = 50 µm.
Video 15
Numerical simulation of an Euler Kirchhoff rod using the discrete elastic rod model related to Figure 4 (see Figure 4 and Materials and methods) with tension µN/m, bending stiffness N m2, and shear modulus G = 1.35 kPa.
Friction with the surrounding tissue is modeled as a Stoke’s drag (dynamic viscosity = 1 PI). A twist of 360° per 1.5 µm is evenly distributed along the rod similar to the one observed in some ptl-1(ok621) electron micrographs (Figure 6d). Together with clamped boundary conditions this results in the dynamic formation of helical structures that collapse to plectonemes.
Video 16
Animation related to Figure 5 showing an overlay of confocal and STED images showing a TRN identified by anti-acetylated tubulin immunofluorescence together with a cluster of unidentified neurons.
https://doi.org/10.7554/eLife.20172.032
Video 17
Image stack derived from an ssTEM dataset of a ptl-1(ok621); unc-70(e524) mutant ALM neuron, related to Figure 7A and C.
Initially, microtubules twist around one another in a counterclockwise manner and subsequently they twist in the opposite direction, a phenomenon known has helical perversion. Scale = 100 nm.
Tables
Table 1
Mean touch response. Animals assayed as young adults, grown at 20°C (except for strains carrying mec-7(e1343) which were grown at 25°C) and blind to genotype in cohorts of ~25 animals. Except for ptl-1(ok621);unc-70(e524);uIs31, at least two independent cohorts were tested for each genotype. There was a significant effect of genotype (one-way ANOVA, F(9, 1019)=305.3, p<0.0001) and the indicated genotypes differed from control at p<0.05 (*), p<0.001 (***) level according to a Dunnett’s posthoc comparison (ns = denotes no significant difference).
Genotype | Touch response (mean±SD) | # of worms |
|---|---|---|
control (uIs31[mec-17p::GFP]) | 9.35 ± 1.15 | 75 |
unc-70(e524);uIs31 | 6.33 ± 2.12* | 203 |
ptl-1(ok621);uIs31 | 8 ± 1.4* | 50 |
ptl-1(ok621);unc-70(e524);uIs31 | 5.3 ± 2.65*** | 75 |
ptl-1(ok621);unc-70(e524);mec-7(e1343);uIs31 | 1.5 ± 1.2*** | 25 |
mec-7(wy116);unc-70(e524);uIs31 | 4.3 ± 0.77*** | 50 |
mec-7(wy116);uIs31 | 8.6 ± 0.6ns | 142 |
mec-7(wy116);ptl-1(ok621);uIs31 | 9.5 ± 0.3ns | 154 |
mec-7(e1343);uIs31 | 1.2 ± 1.3*** | 137 |
ptl-1(pg73[ptl-1::mNeonGreen]) | 9.6 ± 0.77ns | 50 |
Table 2
Microtubule numbers and length in wild type and mutant touch receptor neurons. Values are mean ± standard deviation for the number of neurons indicated in parentheses. Serial-section TEM data sets consisted of between 38 and 68 thin sections covering between 1.9 and 3.4 µm in length. Length is estimated from the number of microtubules per cross-section (), series length (a) and the number of endpoints () detected in the series: (Chalfie and Thomson, 1979). A one-way ANOVA on the ranks (Kruskal-Wallis test) shows a significant effect (α = 0.05) of genotype on microtubule number (p=0.0465) and length (p=0.0420) in ALM, but no effect of genotype on microtubule number (p=0.827) and length (p=0.232) in AVM. *p<0.05 different from control, Mann-Whitney test.
Genotype | Neuron | Number | Length, µm | Source | ||||||
|---|---|---|---|---|---|---|---|---|---|---|
N2 (Bristol) | AVM | 12.8 ± 3.3 (8) | 9.40 ± 0.4 (3) | |||||||
control, uIs31 [mec-17p::GFP] | AVM | 7 ± 3.6 (3) | 4.1 ± 0.6 (3) | This study | ||||||
unc-70(e524); uIs31 | AVM | 8 ± 2 (3) | 3.8 ± 0.4 (3) | This study | ||||||
unc-70(s1502); uIs31 | AVM | 23 ± 10 (5) | 2.7 ± 0.7 (2) | This study | ||||||
N2 (Bristol) | ALM | 28.6 ± 4.1 (9) | 22.2 ± 3.6 (5) | |||||||
N2 (Bristol) | ALM | 57 ± 11 (3) | 14 ± 4.3 (3) | This study | ||||||
control, uIs31 | ALM | 31 ± 2 (4) | 16 ± 4.5 (4) | This study | ||||||
unc-70(e524); uIs31 | ALM | 17.9 ± 3.4 (4)* | 5.3 ± 1.3 (4) | This study | ||||||
unc-70(s1502); uIs31 | ALM | 24 ± 11 (5) | 2.8 ± 0.9 (5)* | This study | ||||||
mec-7(wy116);wyIs97; uIs31 | ALM | 27 ± 13 (4) | 11 ± 6 (4) | This study | ||||||
ptl-1(ok621); uIs31 | ALM | 20 ± 10 (5) | 6.95 ± 6.6 (5) | This study | ||||||
ptl-1(ok621);unc-70(e524); uIs31 | ALM | 32 ± 0.8 (2) | 8.9 ± 3.5 (2) | This study | ||||||
mec-7(wy116);unc-70(e524); uIs31 | ALM | 44 ± 4 (3) | 8.9 ± 3 (3) | This study | ||||||
Table 3
Strains and transgenes used in this study.
Strain | Genotype | Source or citation | RRID |
|---|---|---|---|
N2 Bristol | N2 | CGC | WB_RWK40N2 |
TU2769 | uIs31 [mec-17p::GFP] | WB_TU2769 | |
CB524 | unc-70(e542) | CGC | WB_CB524 |
EG4492 | unc-70(s1502); oxIs95 [myo-2p::GFP; pdi-2p::UNC-70)] | N/A | |
CB1343 | mec-7(e1343) | CGC | N/A |
RB1708 | mec-7(ok2152) | CGC | WB_RB1708 |
TV1838 | wyIs97 [unc-86p::myrGFP, unc-86p::mCherry::RAB-3] | N/A | |
TH230 | WRM0620A_C08(pRedFlp-Hgr)(spc-1[28275]::S0001_pR6K_Amp_2xTY1ce_EGFP_FRT_rpsl_neo_FRT_3xFlag)dFRT::unc-119-Nat | WB_TH230 | |
GN061 | him-4(e1267); uIs31 | This study | N/A |
GN400 | unc-70(e524); uIs31 | N/A | |
GN401 | unc-70(s1502); uIs31; oxIs95 | N/A | |
GN444 | unc-70(e524); uIs31; oxIs95 | N/A | |
GN600 | pgIs22 [unc-70p:: UNC-70(N-TSMod)]; oxIs95 | WB_GN600 | |
GN507 | him-4(e1267); unc-70(e542) | N/A | |
GN514 | unc-70(s1502); uIs31 | N/A | |
GN643 | ptl-1(ok621)uIs31;unc-70(e524) | This study | N/A |
GN644 | uIs31; unc-70(e524); mec-7(wy116) | This study | N/A |
GN119 | ptl-1(ok621)uIs31 | This study | N/A |
GN115 | uIs31; mec-7(wy116) | This study | N/A |
GN645 | ptl-1(ok621)uIs31; mec-7(e1343ts) | This study | N/A |
GN704 | WRM0620A_C08(pRedFlp-Hgr)(SPC-1[28275]::S0001_pR6K_Amp_2xTY1ce_EGFP_FRT_rpsl_neo_FRT_3xFlag)dFRT::unc-119-Nat; unc-70(e524) V | This study | N/A |
GN658 | WRM0620A_C08(pRedFlp-Hgr)(SPC-1[28275]::S0001_pR6K_Amp_2xTY1ce_EGFP_FRT_rpsl_neo_FRT_3xFlag)dFRT::unc-119-Nat; unc-70(s1502) V; oxIs95 IV | This study | N/A |
GN659 | WRM0620A_C08(pRedFlp-Hgr)(SPC-1[28275]::S0001_pR6K_Amp_2xTY1ce_EGFP_FRT_rpsl_neo_FRT_3xFlag)dFRT::unc-119-Nat; uIs31 | This study | N/A |
GN660 | WRM0620A_C08(pRedFlp-Hgr)(SPC-1[28275]::S0001_pR6K_Amp_2xTY1ce_EGFP_FRT_rpsl_neo_FRT_3xFlag)dFRT::unc-119-Nat; ptl-1(ok621) III | This study | N/A |
GN655 | ptl-1(pg73[PTL-1::mNeonGreen]) | This study | N/A |
GN647 | ptl-1(pg73); mec-7(ok2152) | This study | N/A |
GN648 | ptl-1(pg73); unc-70(e524) | This study | N/A |
GN649 | ptl-1(pg73); mec-7(wy116) | This study | N/A |
GN705 | ptl-1(ok621) uIs31; unc-70(e524); oxIs95 | This study | N/A |
Download links
A two-part list of links to download the article, or parts of the article, in various formats.
Downloads (link to download the article as PDF)
Open citations (links to open the citations from this article in various online reference manager services)
Cite this article (links to download the citations from this article in formats compatible with various reference manager tools)
Genetic defects in β-spectrin and tau sensitize C. elegans axons to movement-induced damage via torque-tension coupling
eLife 6:e20172.
https://doi.org/10.7554/eLife.20172


