Evidence for evolutionary divergence of activity-dependent gene expression in developing neurons
- University of Edinburgh, United Kingdom
- Institute for Stem Cell Biology and Regenerative Medicine, National Centre for Biological Sciences, India
- UCL Institute of Neurology, United Kingdom
- The Francis Crick Institute, United Kingdom
- Imperial College, United Kingdom
Figures
Figure 1 with 1 supplement
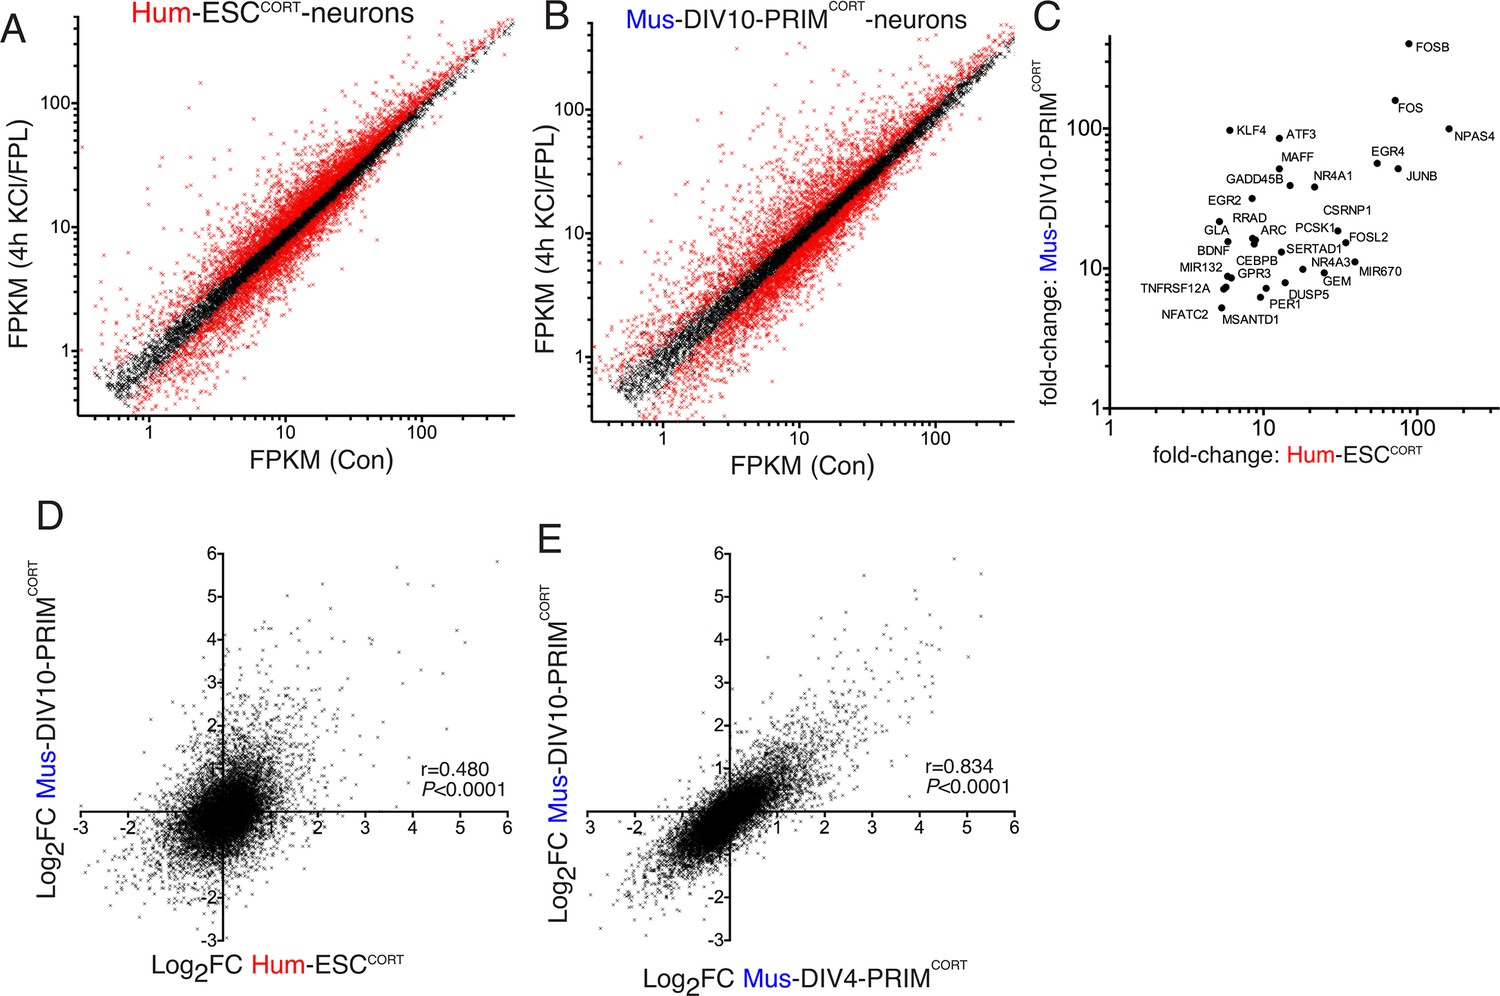
Conservation and divergence in gene regulation in neurons of human and mouse origin.
(A,B) Analysis of gene expression changes induced by KCl/FPL in Hum-ESCCORT-neurons (A) and DIV10 Mus-PRIMCORT-neurons (B). Normalised RNA-seq read density (FPKM) mapping to each gene in RNA extracted from control vs. KCl/FPL-treated neurons is shown (n = 3 independent biological replicates). Genes whose expression was significantly altered by KCl/FPL treatment (Benjamini-Hochberg-adjusted p-value<0.05, calculated within DESeq2) are highlighted in red. (C) Cohort of human:mouse orthologous pairs where both are strongly (>5 fold) and significantly (Benjamini-Hochberg-adjusted p-value<0.05) induced in Hum-ESCCORT-neurons and DIV10 Mus-PRIMCORT-neurons respectively. (D) Correlation of KCl/FPL-induced fold-change in 11,302 ortholog pairs in DIV10 Mus-PRIMCORT-neurons vs. DIV10-Hum-ESCCORT-neurons. (E) Correlation of KCl/FPL-induced fold-change in the same 11,302 genes as in (D) in DIV10 vs. DIV4 Mus-PRIMCORT-neurons.
-
Figure 1—source data 1
Data set relating to Figure 1a–e.
- https://doi.org/10.7554/eLife.20337.004
-
Figure 1—source data 2
Data set relating to Figure 1—figure supplement 1a.
- https://doi.org/10.7554/eLife.20337.005
-
Figure 1—source data 3
Data set relating to Figure 1—figure supplement 1b.
- https://doi.org/10.7554/eLife.20337.006
-
Figure 1—source data 4
Data set relating to Figure 1—figure supplement 1c–d.
- https://doi.org/10.7554/eLife.20337.007
-
Figure 1—source data 5
Data set relating to Figure 1—figure supplement 1e–f.
- https://doi.org/10.7554/eLife.20337.008
Figure 1—figure supplement 1
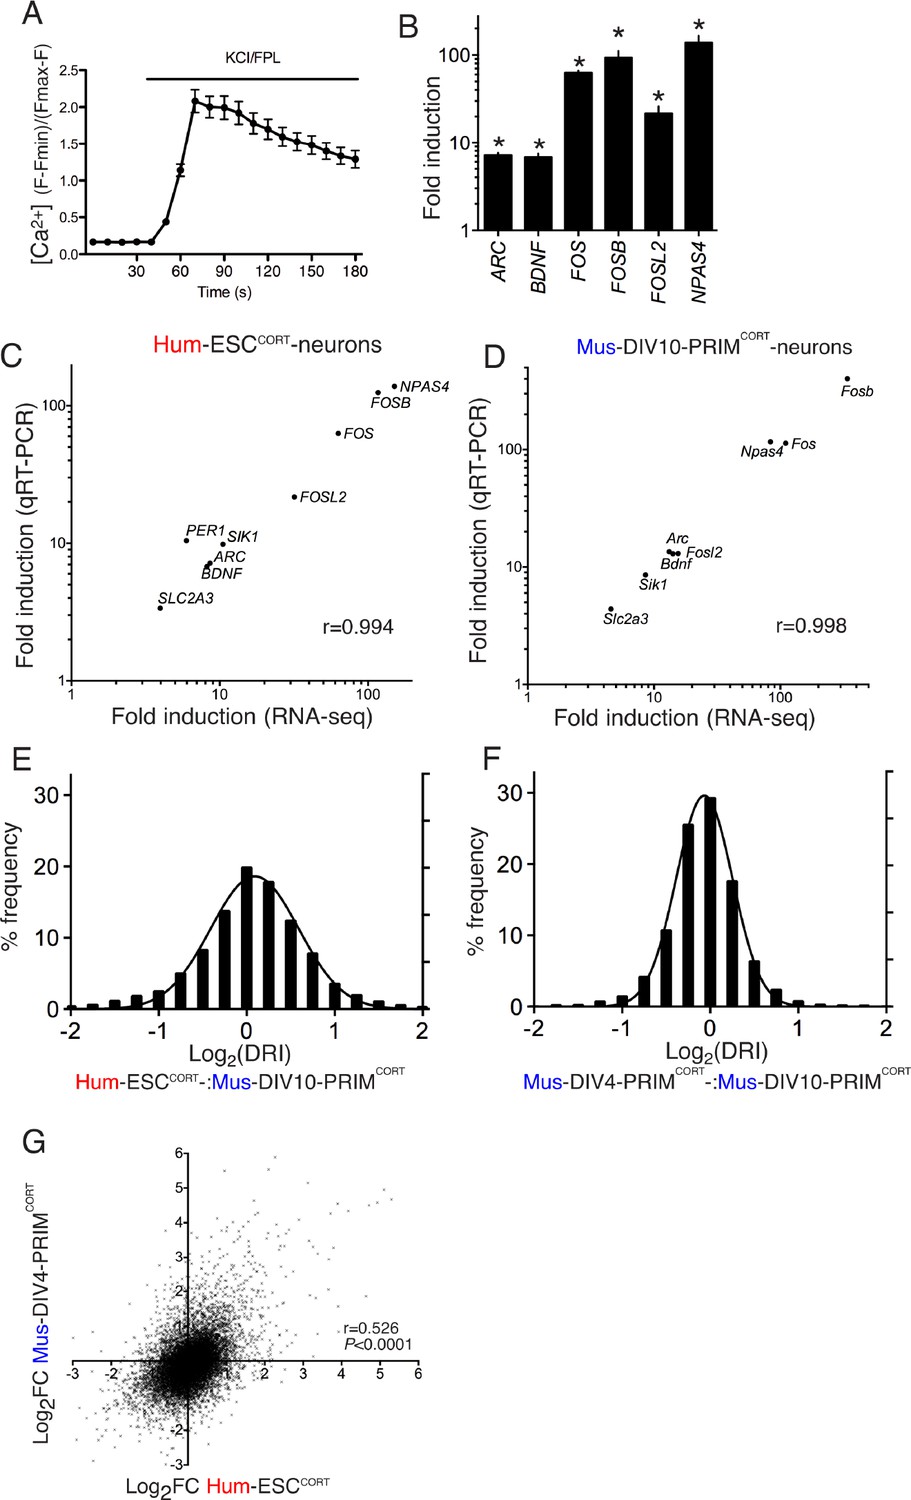
Conservation and divergence in gene regulation in neurons of human and mouse origin.
(A) Example fluo-3 Ca2+ imaging trace of KCL/FPL-treated Hum-ESCCORT-neurons. (B) qPCR analysis of the fold induction of the indicated genes in Hum-ESCCORT-neurons after 4h of KCl/FPL treatment. *p=0.0001, 0.0013, 6E-05, 0.0005, 0.0086, 0.0010, 2-tailed t-test (n = 3). (C,D) A comparison of the magnitude of gene induction of a selection of human (C) and mouse (D) genes, as assayed by RNA-seq and by qRT-PCR. In both cases identical sets of 3 independent replicates were assayed and the mean calculated. (E) For the 11,302 orthologous pairs, the 'differential regulation index' (DRI) was calculated, defined as the fold-change (Hum-ESCCORT-neurons) divided by the fold-change (DIV10 Mus-PRIMCORT-neurons). The distribution of the log2 of the DRIs is shown. (F) As for (E) except the DRI was calculated for DIV4 vs. DIV10 Mus-PRIMCORT-neurons. (G) Correlation of KCl/FPL-induced fold-change in 11,302 ortholog pairs in DIV4 Mus-PRIMCORT-neurons vs. Hum-ESCCORT-neurons.
Figure 2 with 1 supplement
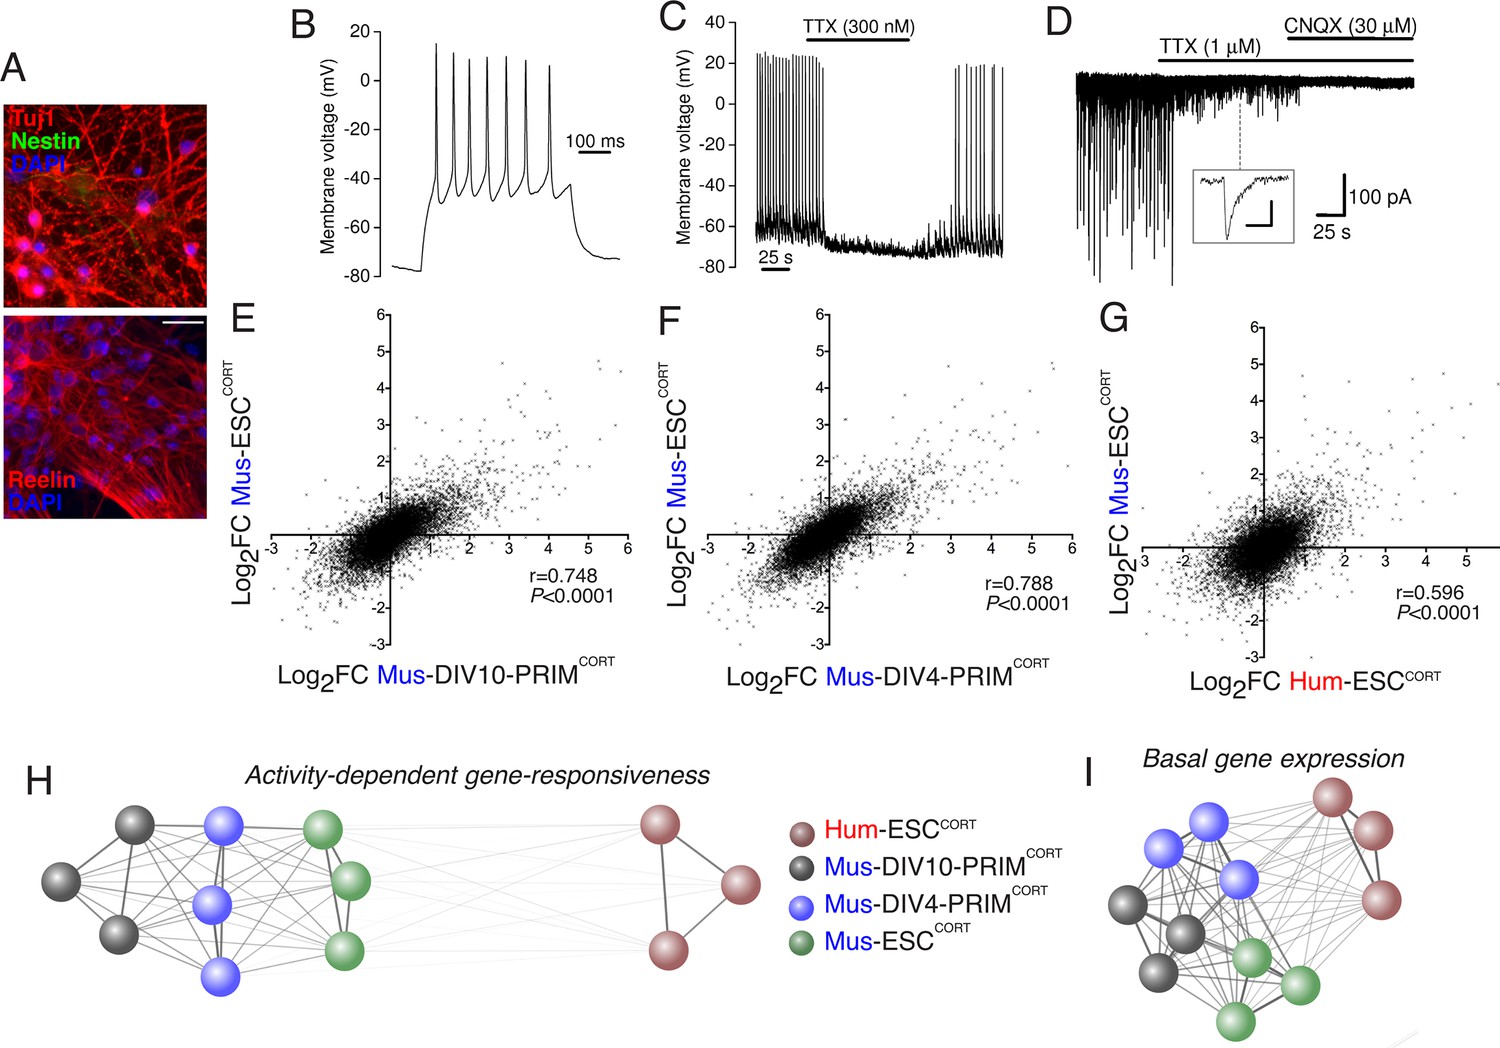
Stem cell origin does not substantially impact on activity-dependent gene responsiveness.
(A) Example immunofluorescence pictures of Mus-ESCCORT-neurons stained for neuronal markers Tuj1 (upper) and Reelin (lower). Note also absence of Nestin staining (upper), a marker of undifferentiated neural precursor cells. Scale = 20 µm. (B) Example trace of a burst of action potentials (APs) induced in Mus-ESCCORT-neurons by current injection (see Materials and methods). (C) Example trace illustrating spontaneous TTX-sensitive AP firing. (D) Example trace illustrating spontaneous TTX-sensitive EPSCs, as well as TTX-insensitive, CNQX-sensitive miniature EPSCs (also see inset; scale bar: 20 pA, 5 ms). Activity returned upon wash out of TTX and CNQX (not shown). (E,F) Correlation of KCl/FPL-induced fold-change in the same 11,302 genes as in Figure 1d,e in Mus-ESCCORT-neurons vs. DIV10 (E) or DIV4 (F) Mus-PRIMCORT-neurons. (G) Correlation of KCl/FPL-induced fold-change in 11,302 ortholog pairs in Mus-ESCCORT-neurons vs. Hum-ESCCORT-neurons. (H) A connection map generated in Cytoscape (Shannon et al., 2003) illustrating the relative determination coefficients (R2) between the fold-inductions of the 11,302 genes studied in each of the three biological replicates of the experiments performed in each of the four different neuronal preparations. The thickness of the connecting line and the attractive force of the connecting nodes are both directly proportional to R2, against a background of constant inter-node repulsion. Note that all mouse neurons of differing developmental stage and origin (primary vs. ES cell) cluster strongly together, with the Hum-ESCCORT-neuronal replicates clustering away from them. (I) A connection map generated as for (H) but illustrating the relative determination coefficients (R2) between the basal expression levels (FPKM) of the 11,302 genes studied in each of the three biological replicates of the experiments performed in each of the four different neuronal preparations.
-
Figure 2—source data 1
Data set relating to Figure 2e–g.
- https://doi.org/10.7554/eLife.20337.011
-
Figure 2—source data 2
Data set relating to Figure 2—figure supplement 1e.
- https://doi.org/10.7554/eLife.20337.012
-
Figure 2—source data 3
Data set relating to Figure 2—figure supplement 1b–d.
- https://doi.org/10.7554/eLife.20337.013
Figure 2—figure supplement 1
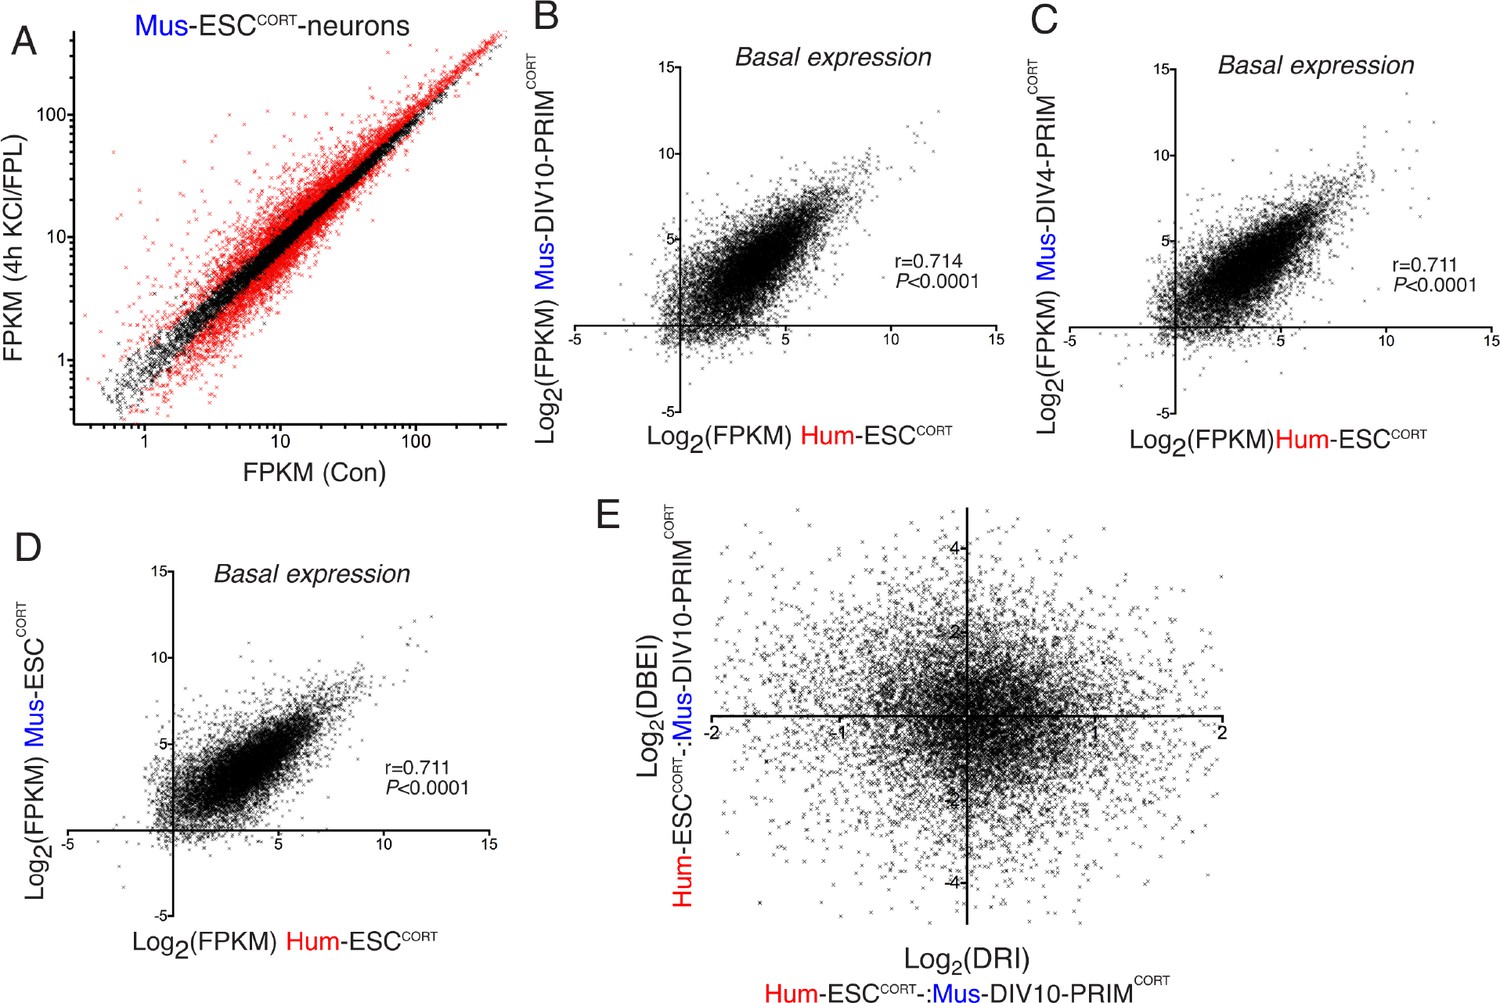
Differential gene inducibility is not linked to basal levels of gene expression.
(A) Normalised RNA-seq read density (FPKM) mapping to each gene in RNA extracted from control vs. KCl/FPL-treated Mus-ESCCORT-neurons is shown (n = 3 independent biological replicates). Genes whose expression was significantly altered by KCl/FPL treatment (Benjamini-Hochberg-adjusted p-value<0.05, calculated within DESeq2) are highlighted in red. B-D) Correlation of basal gene expression (Log2(FPKM)) across 11,302 ortholog pairs in Hum-ESCCORT-neurons vs. DIV4 Mus-PRIMCORT-neurons (B), DIV4 Mus-PRIMCORT-neurons (C) and Mus-ESCCORT-neurons (D). (E) For each of the 11,302 orthologous pairs, the Log2(DRI) Hum-ESCCORT-vs. DIV10 Mus-PRIMCORT-neurons (i.e. DRIs from Figure 1—figure supplement 1e) were plotted against the Log2(DBEI), where DBI (differential basal expression index) is the ratio of basal expression in Hum-ESCCORT-vs. DIV10 Mus-PRIMCORT-neurons.
Figure 3 with 1 supplement
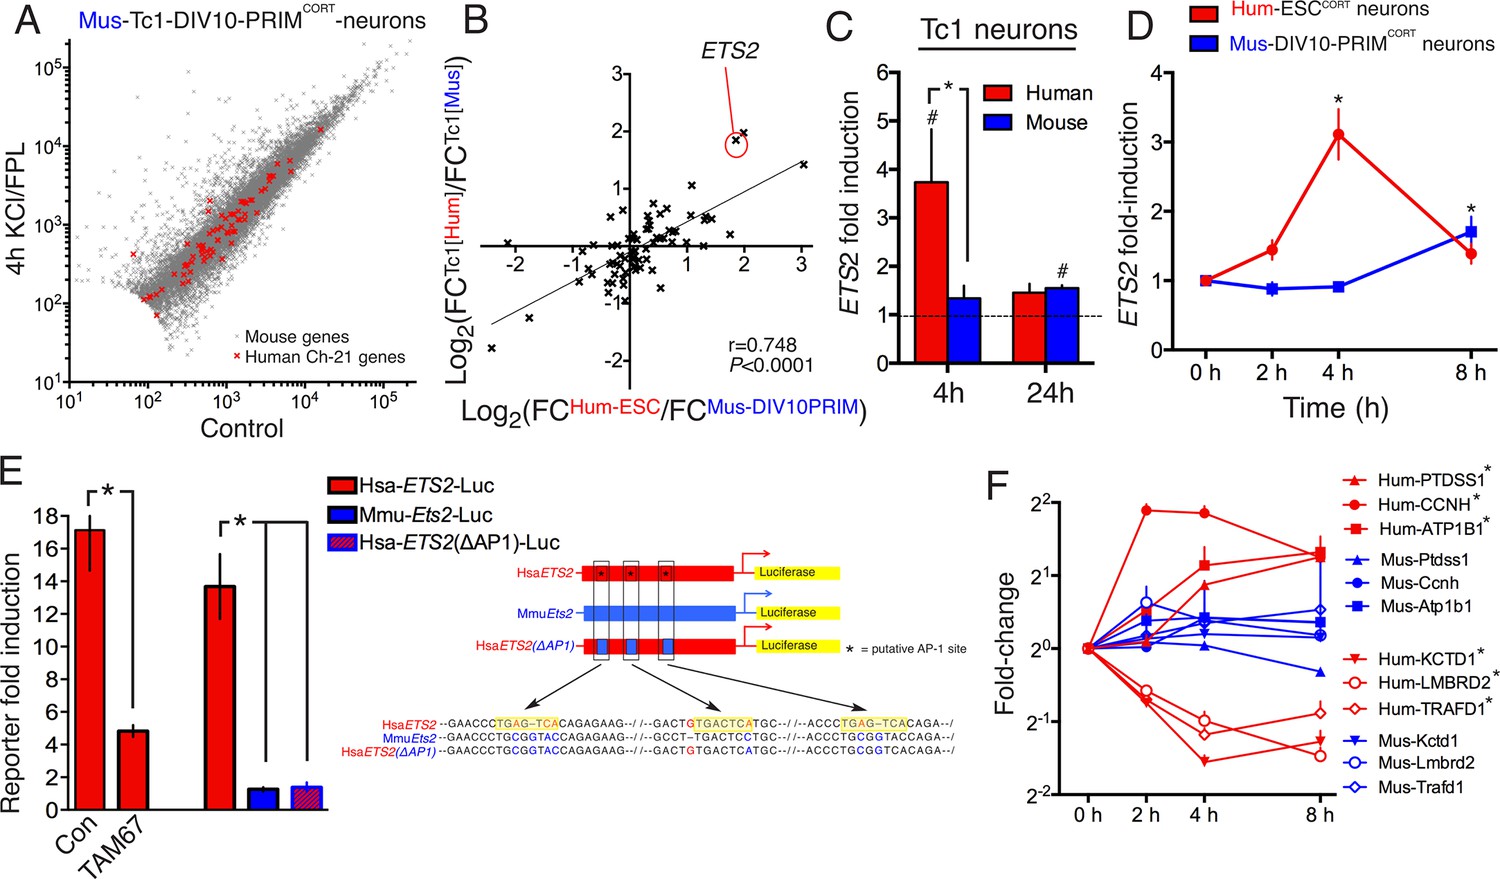
DNA sequence is a contributing factor to species-dependent gene responsiveness to neuronal activity.
(A) Analysis of gene expression changes induced by KCl/FPL in mouse Tc1 neurons. Mouse genes are shown in grey, human chromosome-21 (Hsa-21) genes in red. (B) The graph concerns 72 orthologous pairs whose human ortholog is on Hsa-21 and carried by the Tc1 mouse strain, and which meets expression cut-off (100 reads). For each pair, the differential responsiveness index (DRI) was calculated from the species-separated Tc1 neuron RNA-seq data (see text), and plotted against the DRI calculated from separate neuronal preparations (Hum-ESCCORT-neurons vs. DIV10 Mus-PRIMCORT-neurons, as was done in Figure 1—figure supplement 1e). (C) KCl/FPL-induced fold induction of the human (red) and mouse (blue) orthologs of Hsa-21 gene ETS2, analysed side-by-side in Tc1 neurons. *p=0.035. unpaired t-test; # indicates p=0.0464, 0.0026 (left to right) vs. unstimulated control (4 hr, n = 7; 24 hr, n = 3). (D) Kinetics of KCl/FPL-induced ETS2 induction in Hum-ESCCORT-neurons vs. DIV10 Mus-PRIMCORT-neurons. *p=0.0017, 0.004 (left to right), unpaired 1-way ANOVA vs. control (Hum-ESCCORT-neurons: n = 3 (2 hr, 8 hr), n = 6 (4h), p=; DIV10 Mus-PRIMCORT-neurons: n = 4, P. (E) The indicated firefly luciferase reportersbased on human (Hsa) or mouse (Mmu) ETS2 promoters (See (Right) for schematic) plus a pTK-renilla control were transfected into mouse cortical neurons, treated ± KCl/FPL after which firefly:renilla luciferase ratio was measured, and fold-induction calculated. For comparing the effect of TAM67, a control vector (encoding β-globin) was used. *p=0.0015, 0.0015, 0.0015, 2-tailed paired t-test (n = 3). (F) Kinetics of gene regulation of 6 human:mouse ortholog pairs that show quantitative differences in activity-dependent regulation in Hum-ESCCORT-neurons vs. all mouse neuronal preparations from prior RNA-seq analyses. Analysis was performed in Hum-ESCCORT-neurons vs. DIV10 Mus-PRIMCORT-neurons (n = 3,4 respectively). At the timepoints studied, three of these pairs exhibit quantitatively higher induction in human neurons, and three stronger repression in human neurons. *p=<0.0001, 0.0004, 0.0005, <0.0001, <0.0001, 0.0073 (top to bottom, 2-way ANOVA, p-value corresponds to the main species effect).
-
Figure 3—source data 1
Data set relating to Figure 3—figure supplement 1a.
- https://doi.org/10.7554/eLife.20337.016
-
Figure 3—source data 2
Data set relating to Figure 3b.
- https://doi.org/10.7554/eLife.20337.017
-
Figure 3—source data 3
Data set relating to Figure 3c–f.
- https://doi.org/10.7554/eLife.20337.018
Figure 3—figure supplement 1
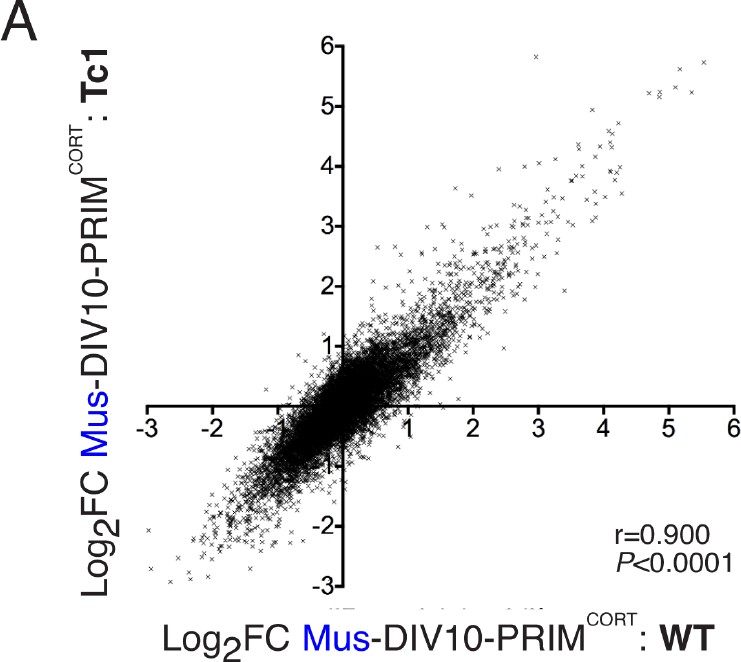
Inducibility of mouse genes in wild-type and Tc1 neurons strongly correlate.
(A) Correlation of KCl/FPL-induced fold-change in the same 11,302 mouse genes analysed in Figures 1 and 2,in DIV10 Mus-ESCCORT-neurons from wild-type vs. Tc1 primary cortical neurons, showing the expected high correlation.
Download links
A two-part list of links to download the article, or parts of the article, in various formats.
Downloads (link to download the article as PDF)
Open citations (links to open the citations from this article in various online reference manager services)
Cite this article (links to download the citations from this article in formats compatible with various reference manager tools)
Evidence for evolutionary divergence of activity-dependent gene expression in developing neurons
eLife 5:e20337.
https://doi.org/10.7554/eLife.20337


