Ankyrin-B is a PI3P effector that promotes polarized α5β1-integrin recycling via recruiting RabGAP1L to early endosomes
- Duke University Medical Center, United States
- Howard Hughes Medical Institute, Duke University Medical Center, United States
- The University of North Carolina at Chapel Hill, United States
Figures
Figure 1 with 1 supplement
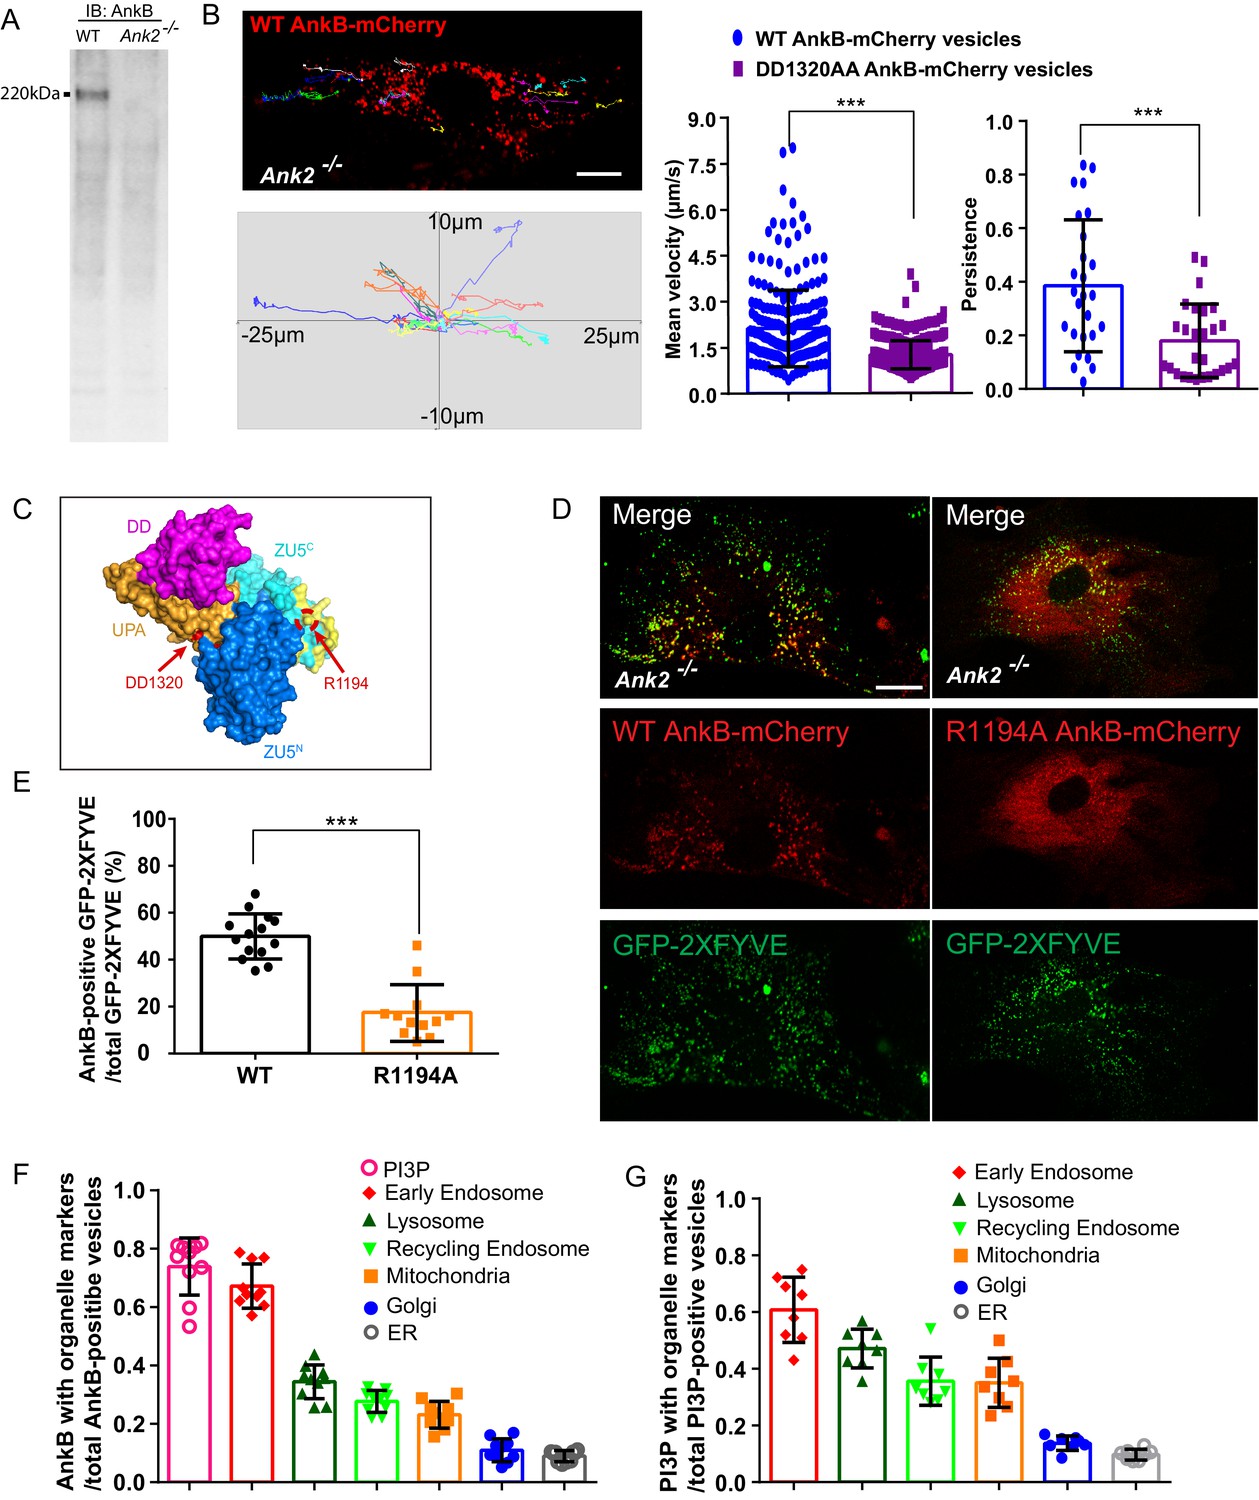
AnkB is a PI3P-lipid effector in MEFs.
(A) AnkB immunoblot (IB) of whole cell lysate from WT and Ank2-/- MEFs. (B) Representative tracks of WT AnkB-mCherry vesicles in Ank2-/- MEFs and mean velocity and persistence of WT AnkB-mCherry and DD1320AA AnkB-mCherry vesicles. Scale bar, 10 µm. Tracks were plotted in an XY coordinate system assuming (0,0) as initial position. (C) Molecular surface representation of the ZU5N-ZU5C-UPA-DD. The DD1320 site critical for binding to dynactin 4 is pointed by red arrow. Basic residues on the PI3P-binding surface are colored in yellow. The R1194 site critical for PI3P binding is circled and pointed in red. (D) Images show the localization of the PI3P biosensor GFP-2×FYVE to WT AnkB-mCherry vesicles in Ank2-/- MEFs. R1194A AnkB-mCherry was found diffusely distributed in the cytoplasm. Scale bar, 10 µm. (E) Percentage of double mCherry and GFP-positive vesicles. Data in (B) and (E) represent mean ± SD for three independent experiments. ***p<0.001, two-tailed t-test. N = 26 (B), 12 (E). (F–G) Quantitative analysis of localization of WT AnkB-mCherry (F) and GFP-2xFYVE (G) on different organelles. Results are expressed as the ratio of co-localized vesicles over either total AnkB-mCherry or GFP-2xFYVE vesicles. Data represent mean ± SD for three independent experiments. N = 10, 8.
Figure 1—figure supplement 1
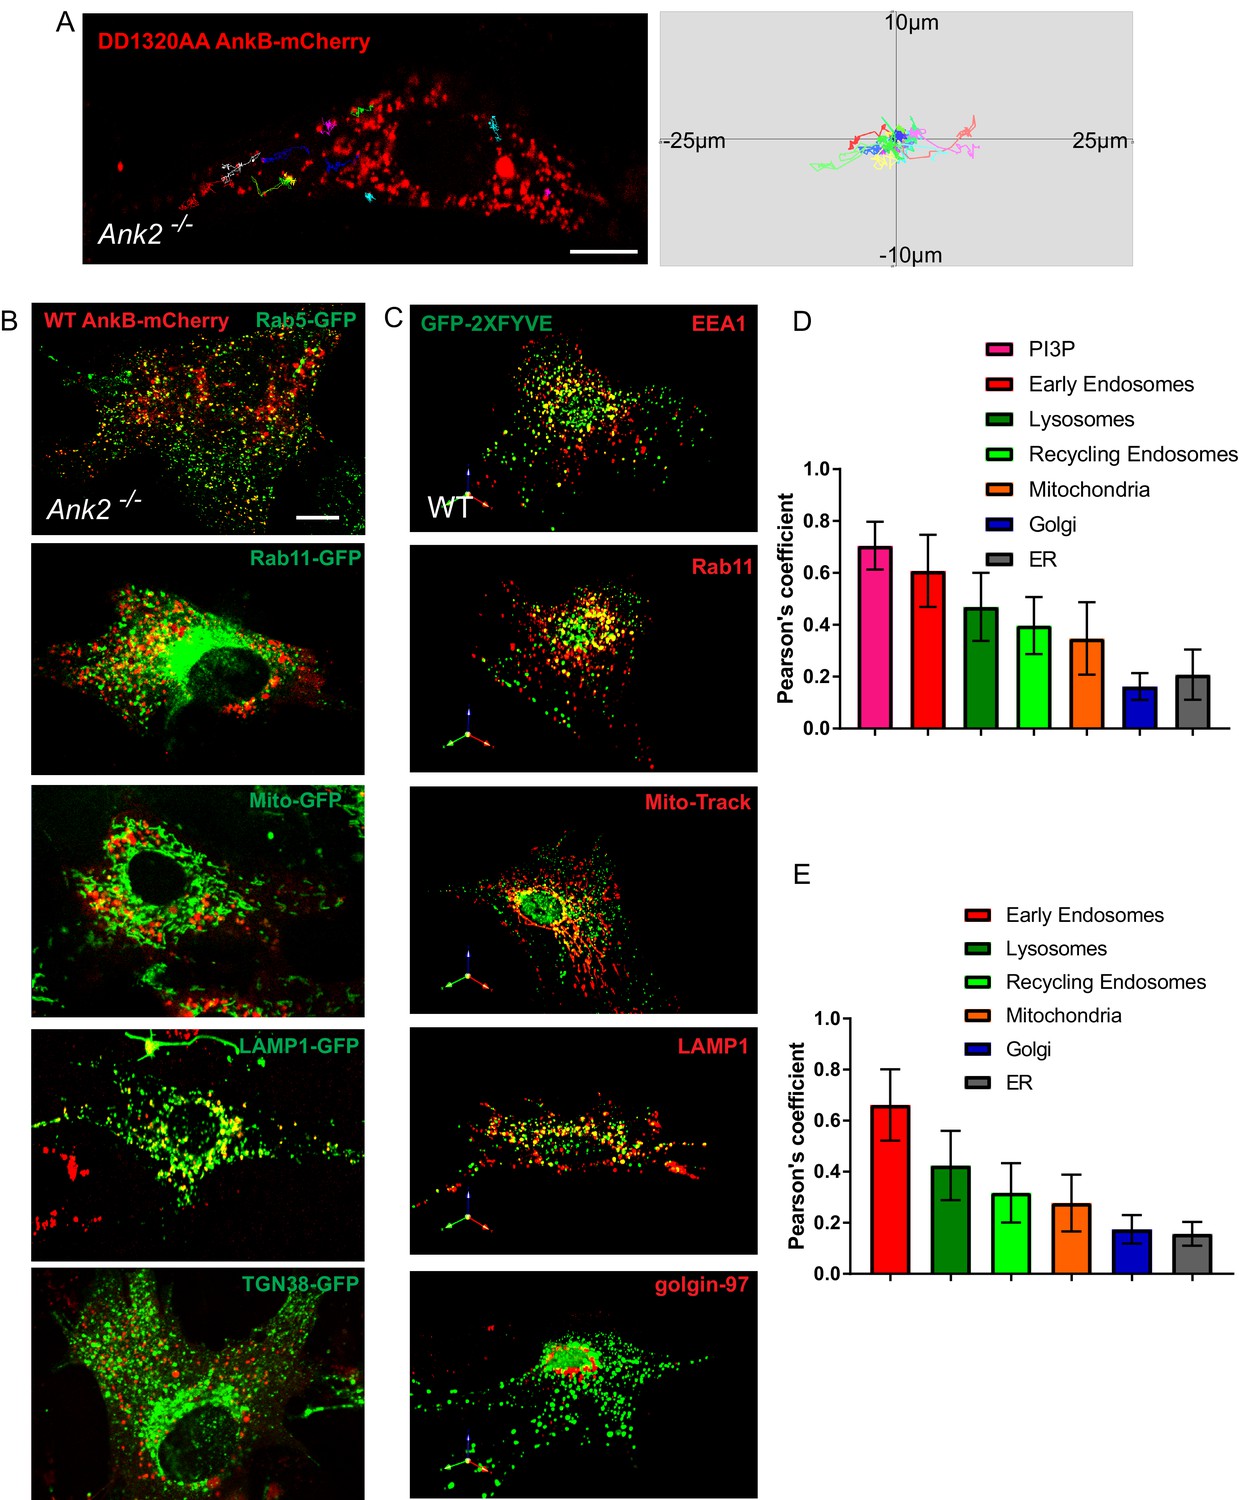
Distribution of AnkB and PI3P lipids on multiple organelles.
(A) Representative tracks of DD1320AA AnkB-mCherry vesicles in Ank2-/- MEFs (left). Scale bar, 10 µm. Tracks were plotted in an XY coordinate system assuming (0,0) as initial position (right). (B and D) Representative images of live Ank2-/- MEFs showing the localization of WT AnkB-mCherry to different organelles (B) and Pearson's co-localization coefficient (D). Organelle markers used include Rab5-GFP (early endosomes), LAMP1-GFP (lysosomes), Rab11-GFP (recycling endosomes), Mito-GFP (mitochondria), TGN38-GFP (Golgi). Scale bar, 10 µm. (C and E) Representative images of fixed WT MEFs showing the localization of the PI3P biosensor GFP-2×FYVE to different organelles (C) and Pearson's co-localization coefficient (E). Organelle markers detected using antibodies against endogenous proteins included EEA1(early endosomes), LAMP1 (lysosomes), Rab11 (recycling endosomes), Mito-Track (mitochondria), golgin-97 (Golgi). Data represent mean ± SD for three independent experiments. N = 16. Scale bar, 10 µm.
Figure 2 with 1 supplement
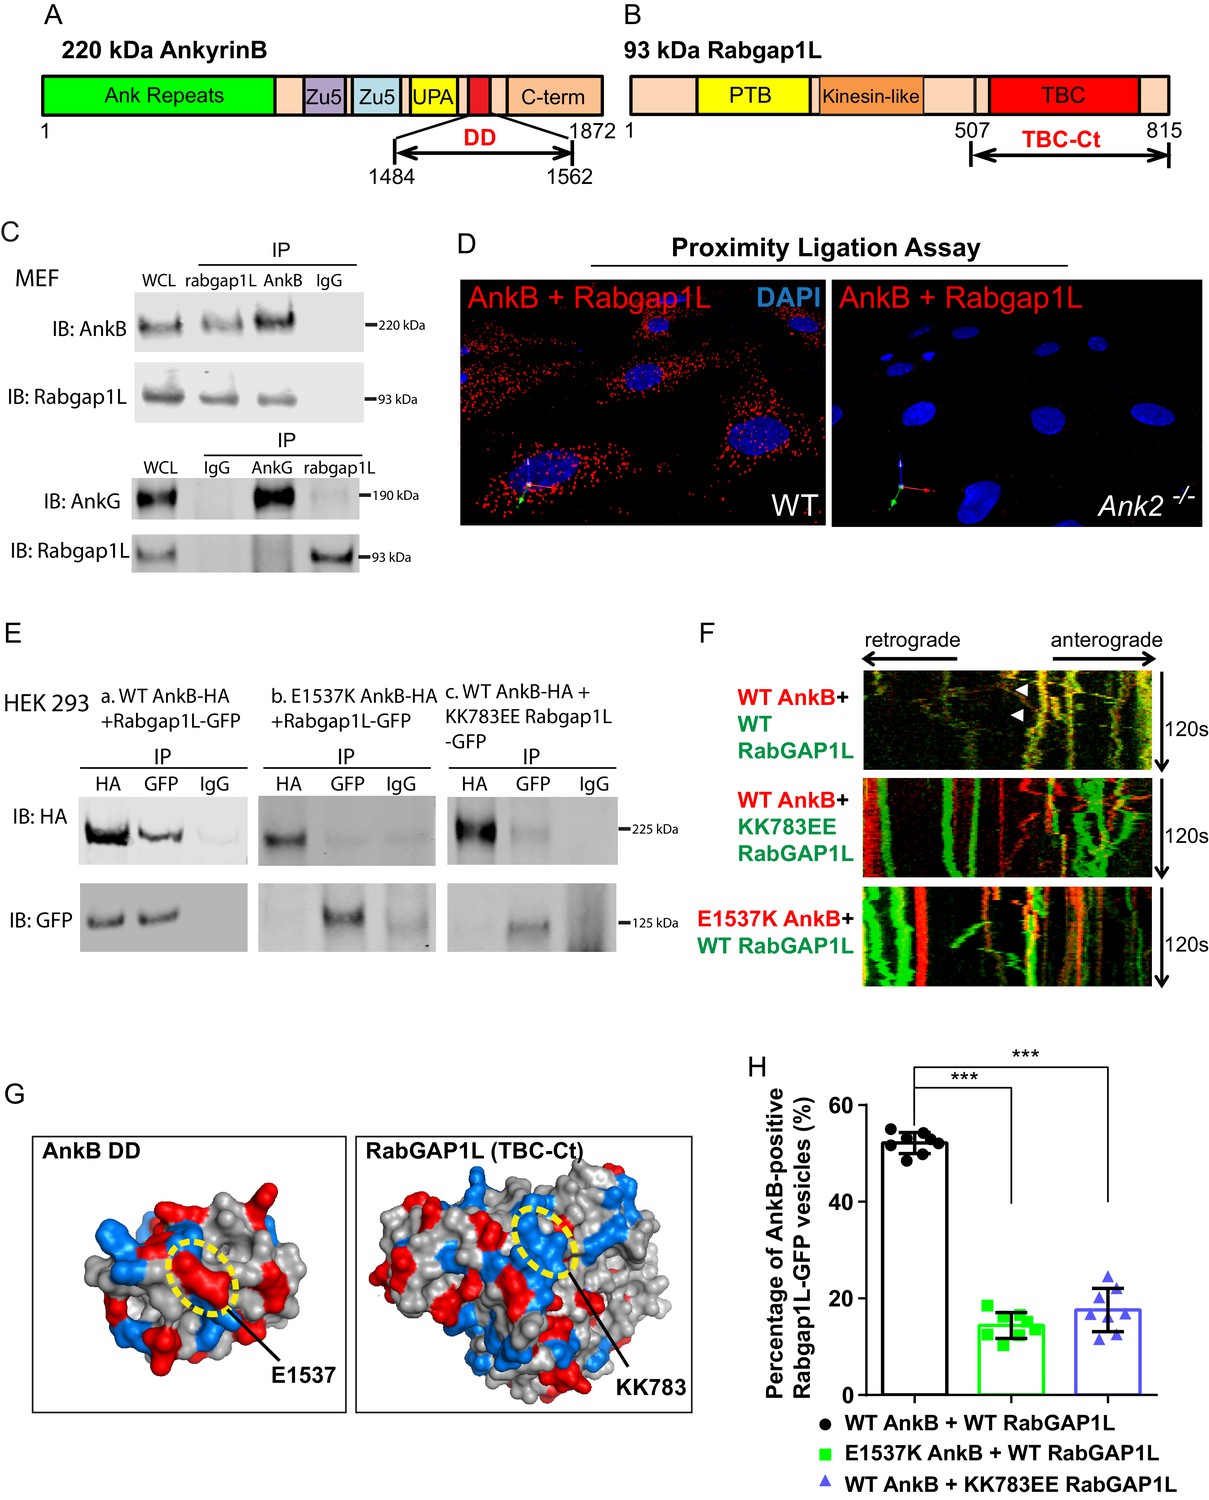
RabGAP1L binds to the death domain of AnkB.
(A, B) Schematic representation of the domain organization of 220 kDa AnkB (A) and 93 kDa RabGAP1L (B). (C) Co-immunoprecipitation (Co-IP) of endogenous AnkB and RabGAP1L (top), AnkG and RabGAP1L (bottom) from WT MEF lysates. (D) Proximity ligation assay. Red dots indicate cellular sites of interaction between AnkB and RabGAP1L, blue shows nuclear staining. (E) Co-IP of WT AnkB-HA and RabGAP1L-GFP (left), E1537K AnkB-HA and RabGAP1L-GFP (middle), and WT AnkB-HA and KK783EE RabGAP1L-GFP (right) from HEK293 cells expressing corresponding plasmids. (F) Kymographs of WT AnkB-mCherry and RabGAP1L-GFP (top), WT AnkB-mCherry and KK783EE RabGAP1L-GFP (middle), and E1537K AnkB-mCherry and WT RabGAP1L-GFP (bottom) motion in Ank2-/- MEFs. White arrowheads indicate vesicles showing AnkB-mCherry and RabGAP1L co-transport. (G) Molecular surface representation of AnkB death domain (AnkB DD) and RabGAP1L TBC-C-terminal domain (TBC-Ct). Residues critical for interaction are highlighted by yellow circles. (H) Co-localization of either WT AnkB-mCherry with WT RabGAP1L-GFP, E1537K AnkB-mCherry with WT RabGAP1L-GFP, or WT AnkB-mCherry with KK783EE RabGAP1L-GFP in Ank2-/- MEFs. Data represent mean ± SD from three independent experiments. ***p<0.001, one-way ANOVA with Tukey post-test. N = 8.
Figure 2—figure supplement 1
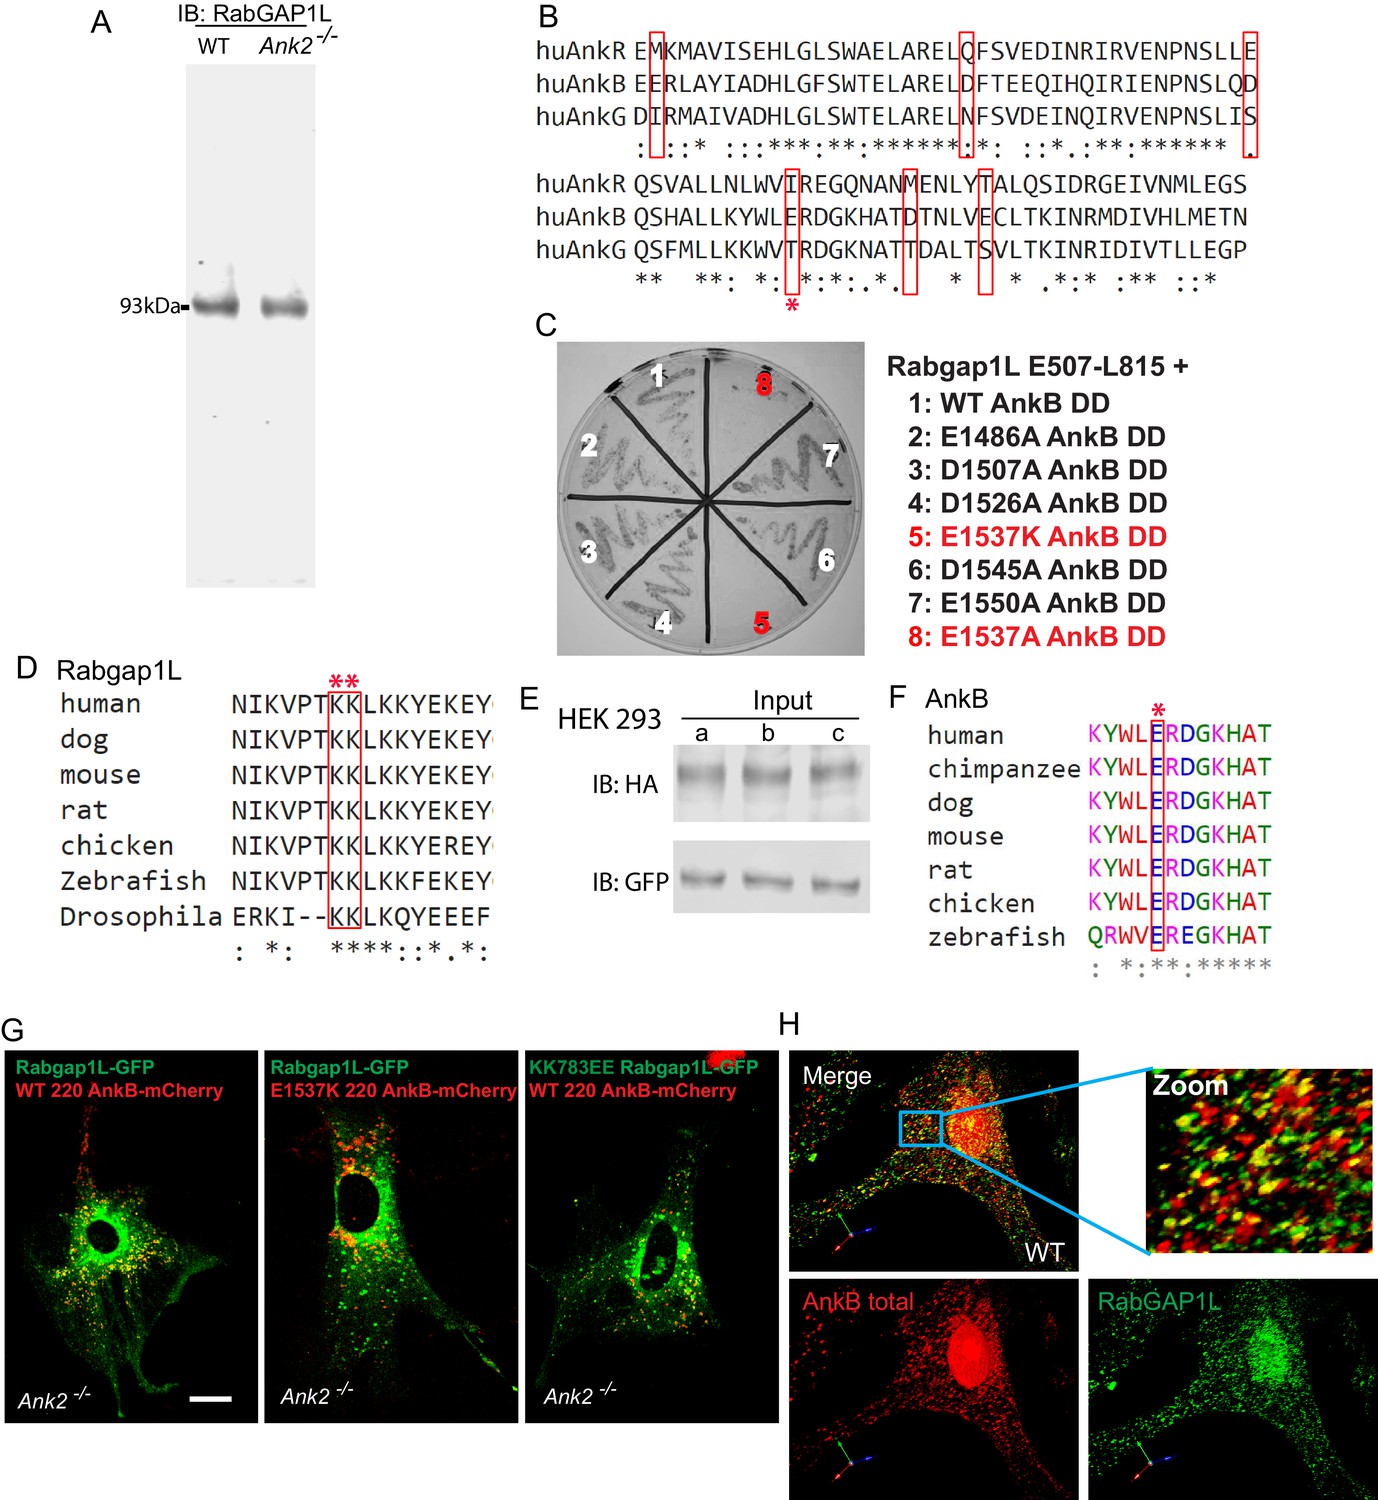
Validation of the RabGAP1L antibody and AnkB/RabGAP1L interaction.
(A) Immunoblot of whole cell lysates from WT and Ank2-/- MEFs using a house-made antibody against RabGAP1L polypeptides. (B) Sequence alignment of the death domains of human AnkR, AnkB, and AnkG. Red boxes indicate divergent charged residues between AnkB and AnkG death domains. Red asterisk denotes the E1537 AnkB residue required for binding to RabGAP1L. (C) Y2H analysis of interaction between mutant AnkB death domain and RabGAP1L TBC-C-terminal domain (residues E507-L815). Individual mutations within the AnkB DD tested are shown. (D and F) Sequence alignment shows the conservation of E1537 AnkB (D) and KK783 RabGAP1L (F) sites among multiple species. (E) Immunoblot of whole cell lysates from transfected HEK293 cells used in immunoprecipitation studies in Figure 2E. (G) Representative images of Ank2-/- MEFs expressing either WT AnkB-mCherry and WT RabGAP1L-GFP (left), E1537K AnkB-mCherry and WT RabGAP1L-GFP (center), or WT AnkB-mCherry and KK783EE RabGAP1L-GFP (right) used to generate kymographs shown in Figure 2F. Scale bar, 10 µm. (H) Immunofluorescence staining of AnkB (red) and RabGAP1L (green) in WT MEFs.
Figure 3 with 1 supplement
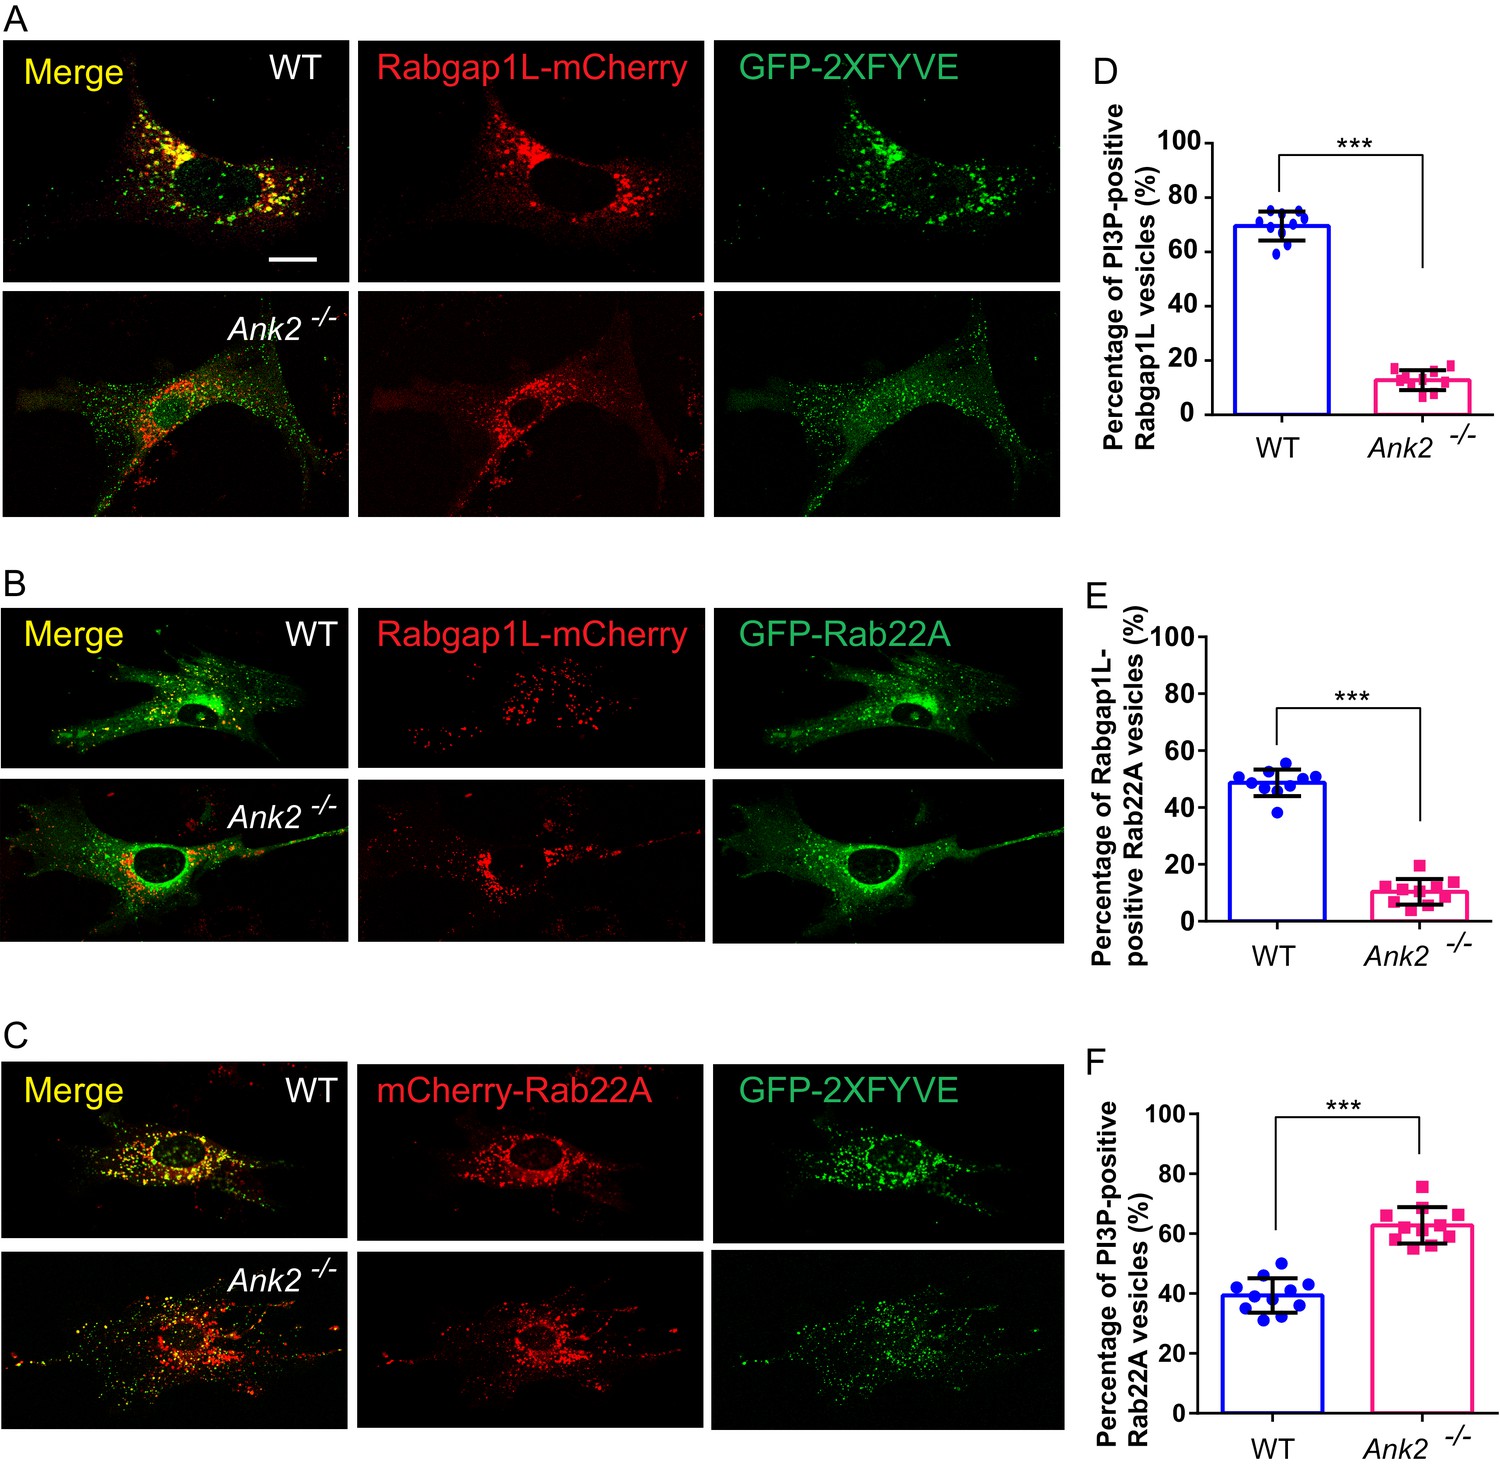
AnkB promotes RabGAP1L targeting to Rab22A/PI3P-positive compartments and Rab22A dissociation from PI3P-positive endosomes.
(A–C) Representative images of live WT and Ank2-/- MEFs expressing either RabGAP1L-mCherry and GFP-2xFYVE (A), RabGAP1L-mCherry and GFP-Rab22A (B), or mCherry-Rab22A and GFP-2xFYVE (C). Scale bar, 10 µm. (D) Quantitative data of the percentage of RabGAP1L that localize to GFP-2xFYVE labeled PI3P-positive vesicles in WT and Ank2-/- MEFs. (E) Quantitative data of the percentage of RabGAP1L that localize to GFP-Rab22A-positive compartments in WT and Ank2-/- MEFs. (F) Quantitative data of the percentage of Rab22A that localize to GFP-2xFYVE labeled PI3P-positive compartments in WT and Ank2-/- MEFs. Data represent mean ± SD for three independent experiments. ***p<0.001, two-tailed t-test. N = 10, 11.
Figure 3—figure supplement 1
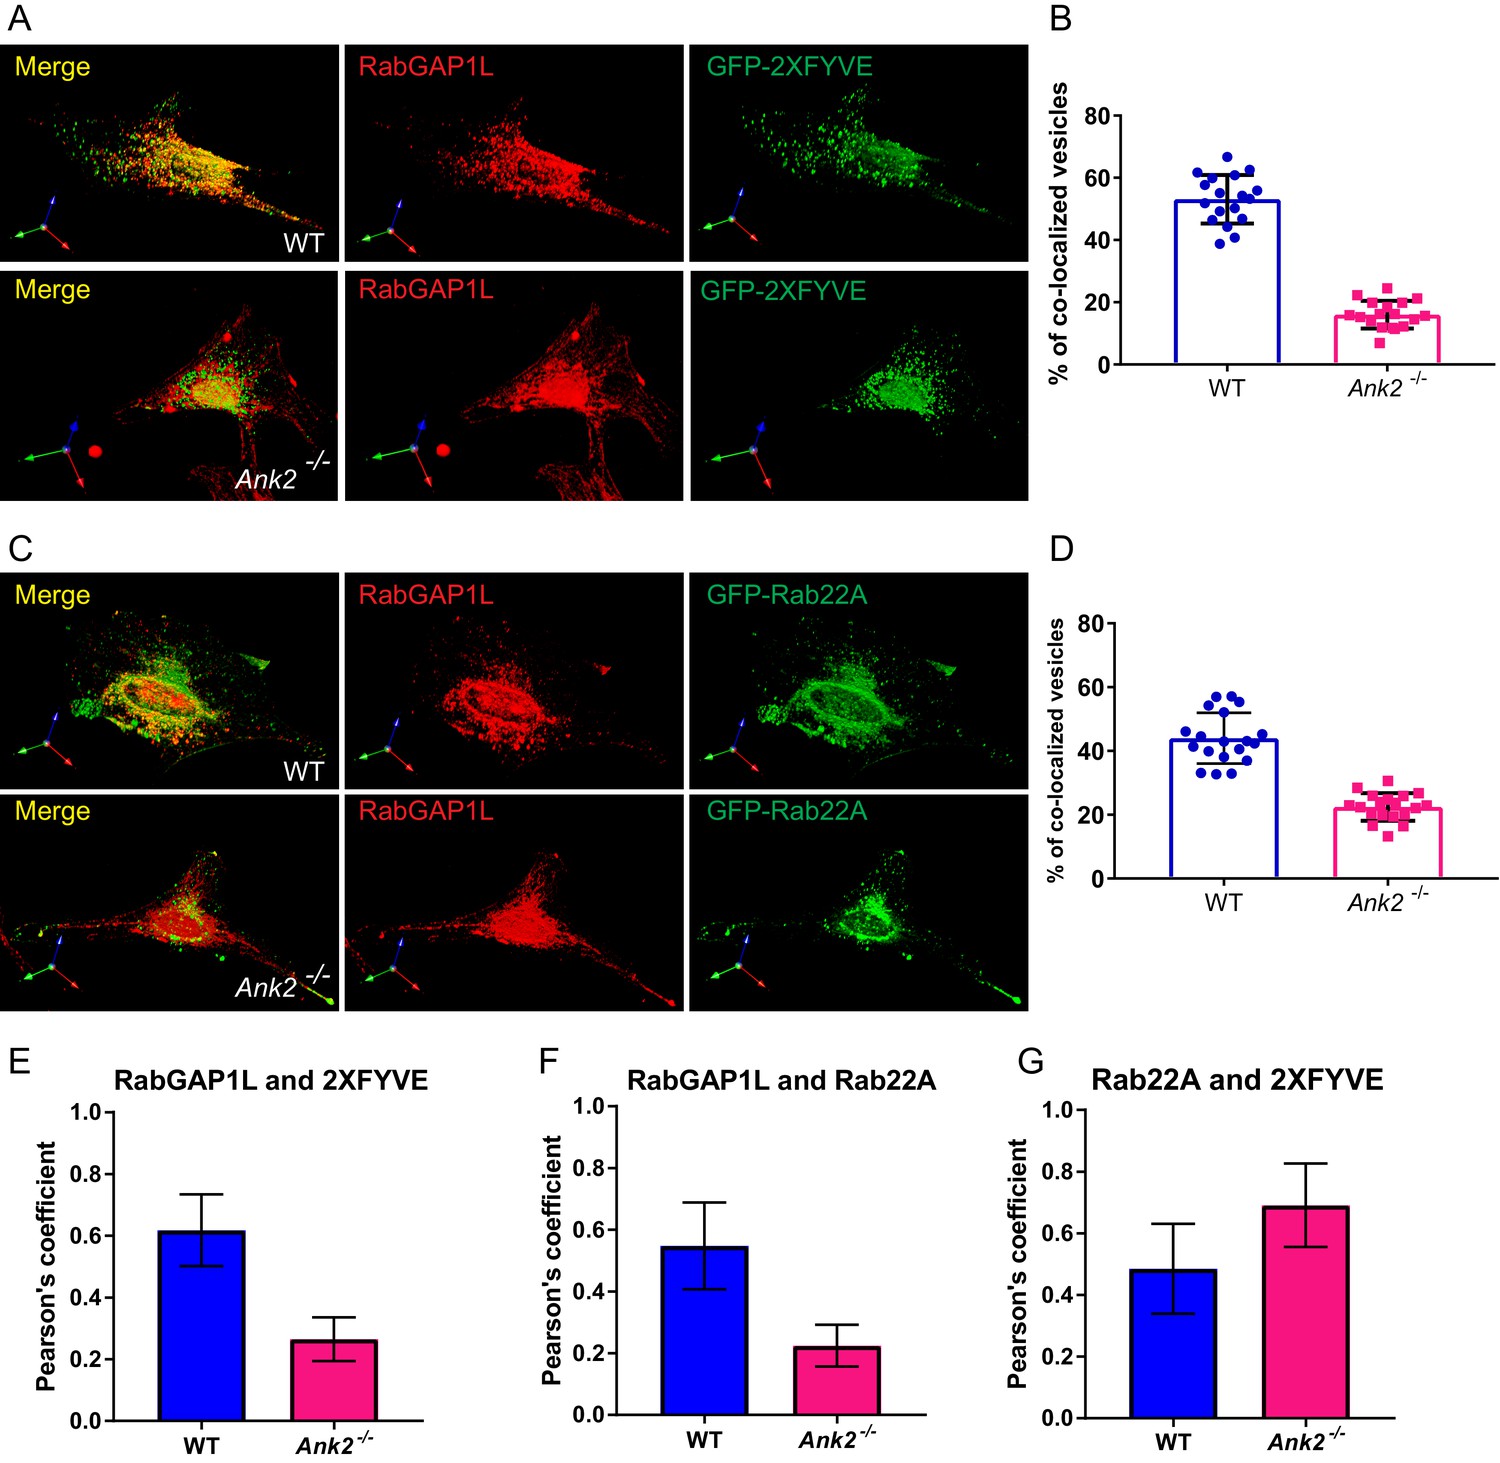
Distribution of endogenous RabGAP1L to PI3P-positive and Rab22A-positive compartment.
(A–B) Representative image of immunofluorescent staining of RabGAP1L in WT and Ank2-/- MEFs (A), and quantitative data showing the percentage of RabGAP1L vesicles localize to 2XFYVE labeled PI3P organelles. (C–D) Representative image of immunofluorescent staining of RabGAP1L in WT and Ank2-/- MEFs (C), and quantitative data showing the percentage of Rab22A vesicles positive for RabGAP1L (D). (E–F) Pearson's coefficient analysis of co-localization of RabGAP1L with PI3P (E) and Rab22A (F). (G) Pearson's coefficient analysis of co-localization of Rab22A with PI3P in live cells. Data represent mean ± SD for three independent experiments. N = 18 (B and D), 12 (E–G). Scale bar, 10 µm.
Figure 4 with 2 supplements
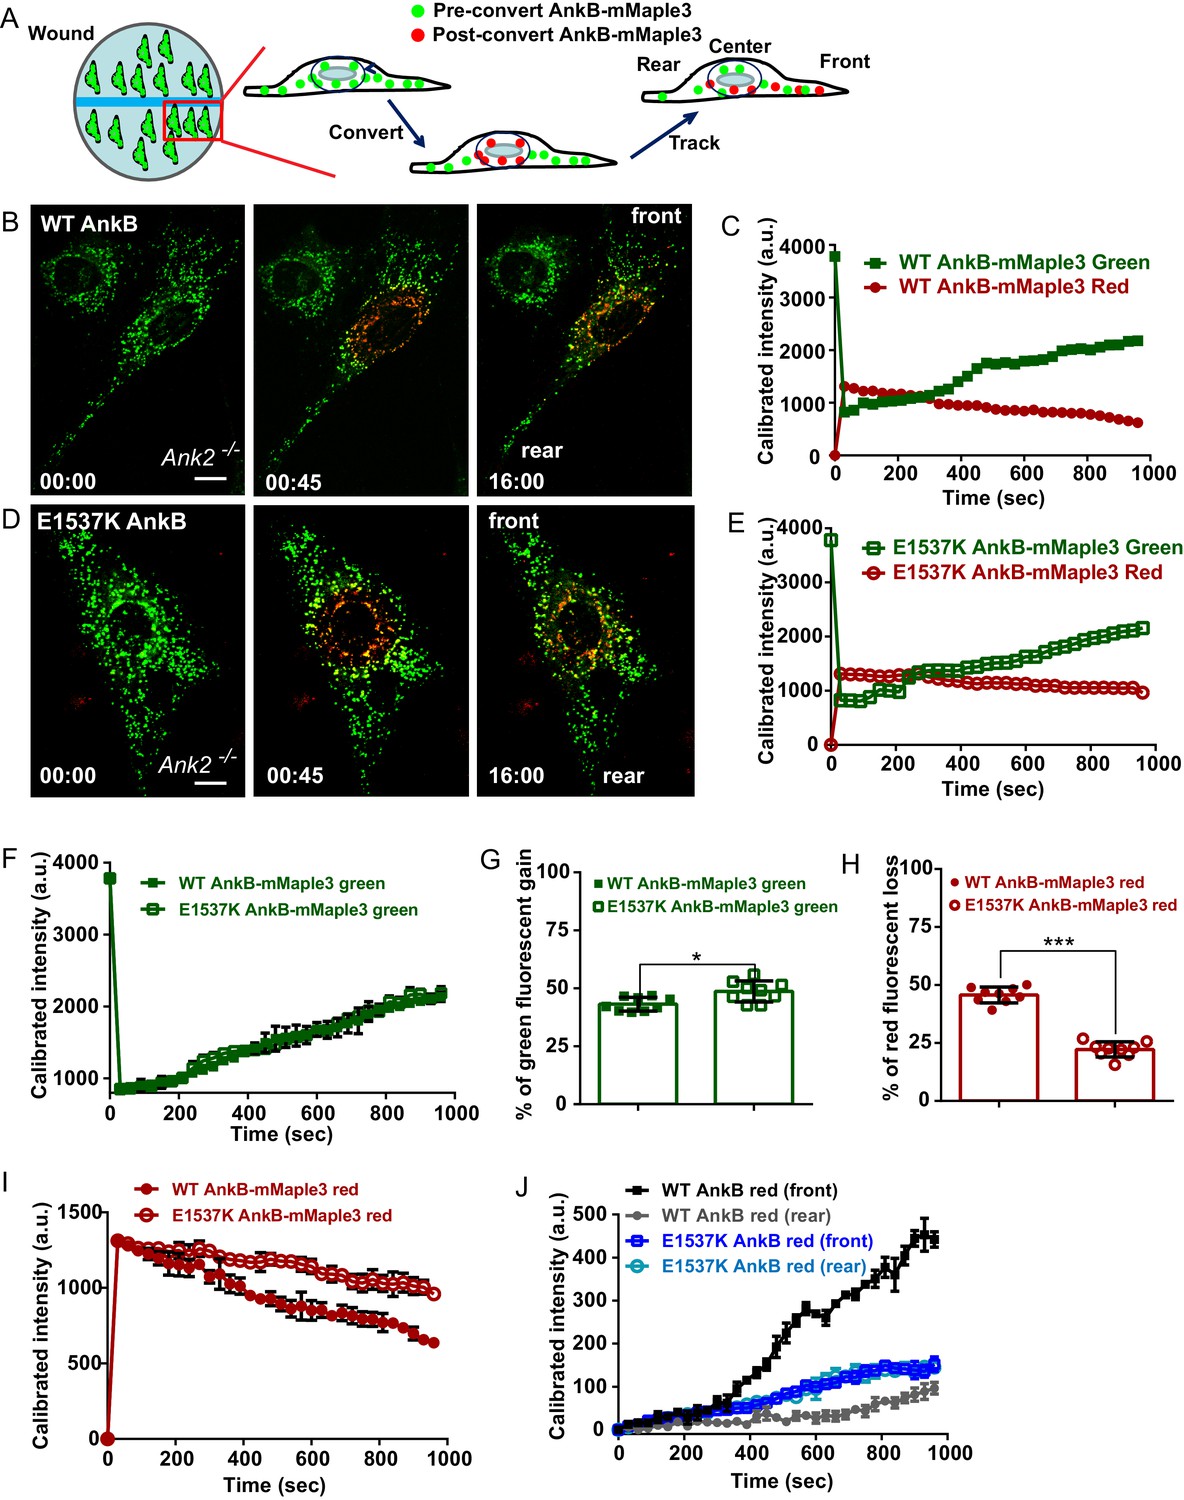
AnkB-associated perinuclear endosomal organelles exhibit polarized transport in migrating MEFs.
(A) Schematic of the experimental design used in the combined photoconversion- wound-induced migration assay. Perinuclear AnkB-mMaple3 signal in Ank2-/- MEF that is migrating at the edge of the wound was converted from green to red fluorescence by blue light exposure. Green or red fluorescent signal were tracked for 16 min following photoconversion. For image representation and analysis cells were divided in front and rear halves determined based on their migratory direction. (B and D) Representative image of Ank2-/- MEF expressing WT AnkB-mMaple3 (B) or E1537K AnkB-mMaple3(D) at t = 0 s (pre-converted), 45 s (perinuclear region converted), and 16 min (tracking end point). Scale bar, 10 µm. (C and E) Quantification of red fluorescent intensity (post-converted AnkB-mMaple3) and green fluorescent intensity (pre-converted AnkB-mMaple3) in the perinuclear region. (F, I) Comparative analysis of green fluorescent gain (F) and red fluorescent loss (I) in the perinuclear region. (G, H) Percentage of red fluorescent loss and green fluorescent gain in perinuclear region at 16 min. (J) Quantification of red fluorescent intensity gain at either the front or rear cell ends. Intensities at each time point are normalized to the background intensity at t = 0 s. Data represent mean ± SD for three independent experiments. *p=0.011, ***p<0.001, two-tailed t-test. N = 9.
Figure 4—figure supplement 1
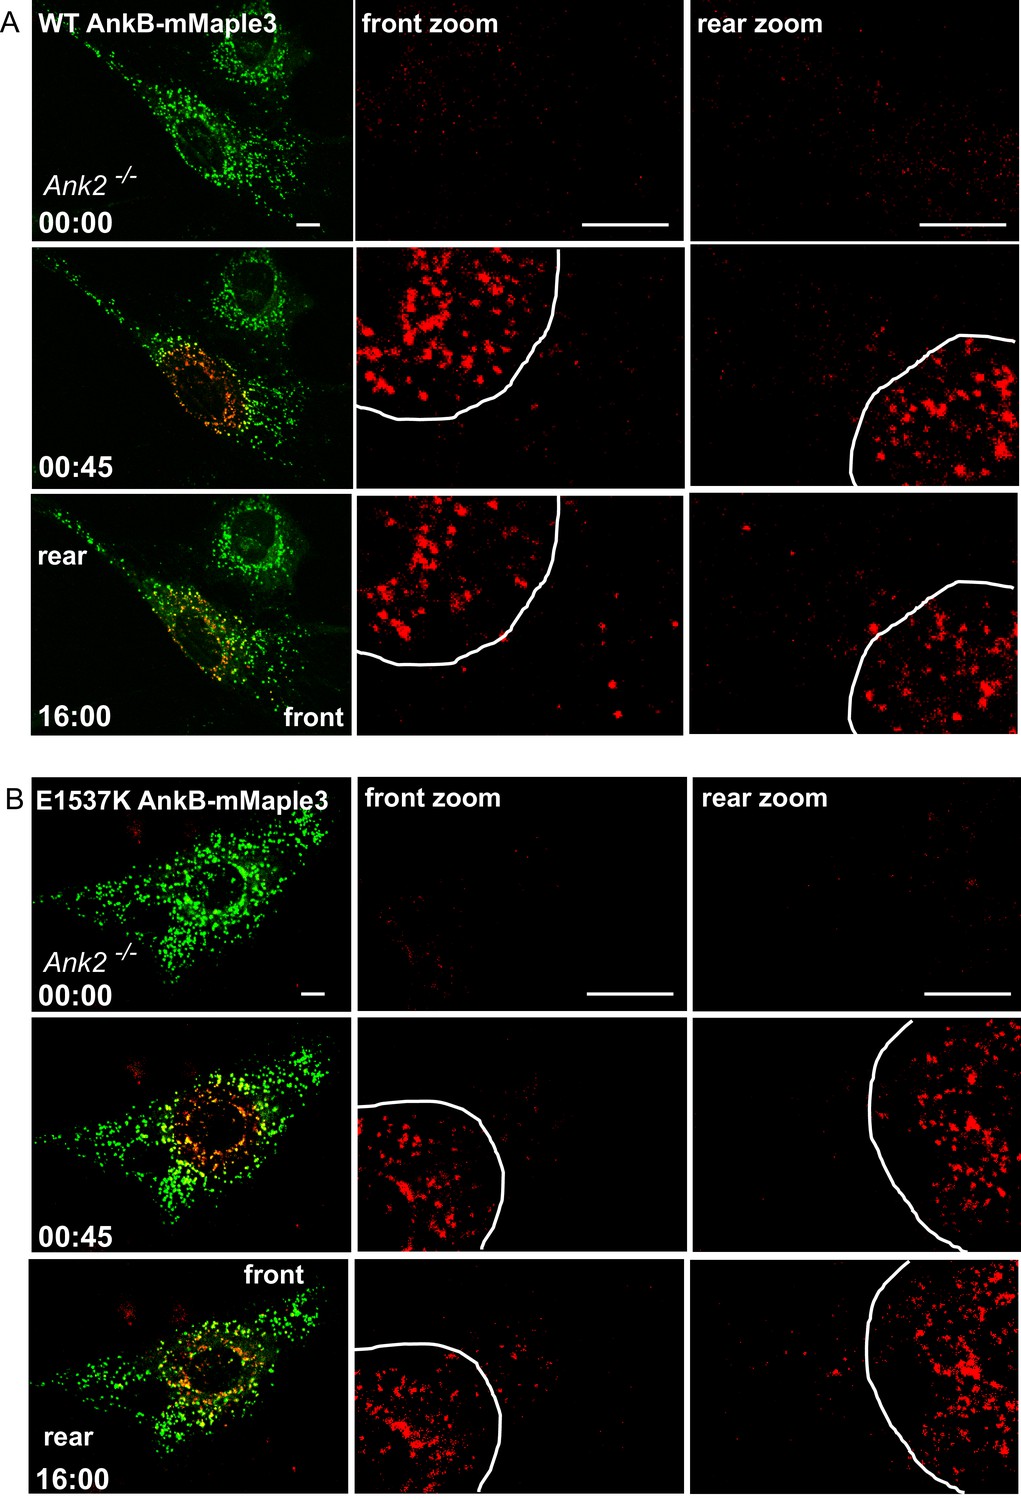
Distribution of WT AnkB-mMaple3 and E1537K AnkB-mMaple3 in MEFs during a photoconversion assay.
(A, B) Representative images of Ank2-/- MEFs expressing either WT AnkB-mMaple3 (A) or E1537K AnkB-mMaple3 (B). For each genotype: Top row left panel shows the distribution of green AnkB-mMaple3 vesicles before photoconversion (t = 0 s). Middle row left panel shows post-converted red perinuclear AnkB-mMaple3 vesicles (t = 45 s). Bottom row left panel shows the distribution of post-converted red AnkB-mMaple3 vesicles 16 min after photoconversion. Scale bar, 8 µm. For each row, center and right panels show the higher magnification images of the rear and front cell ends.
Figure 4—figure supplement 2
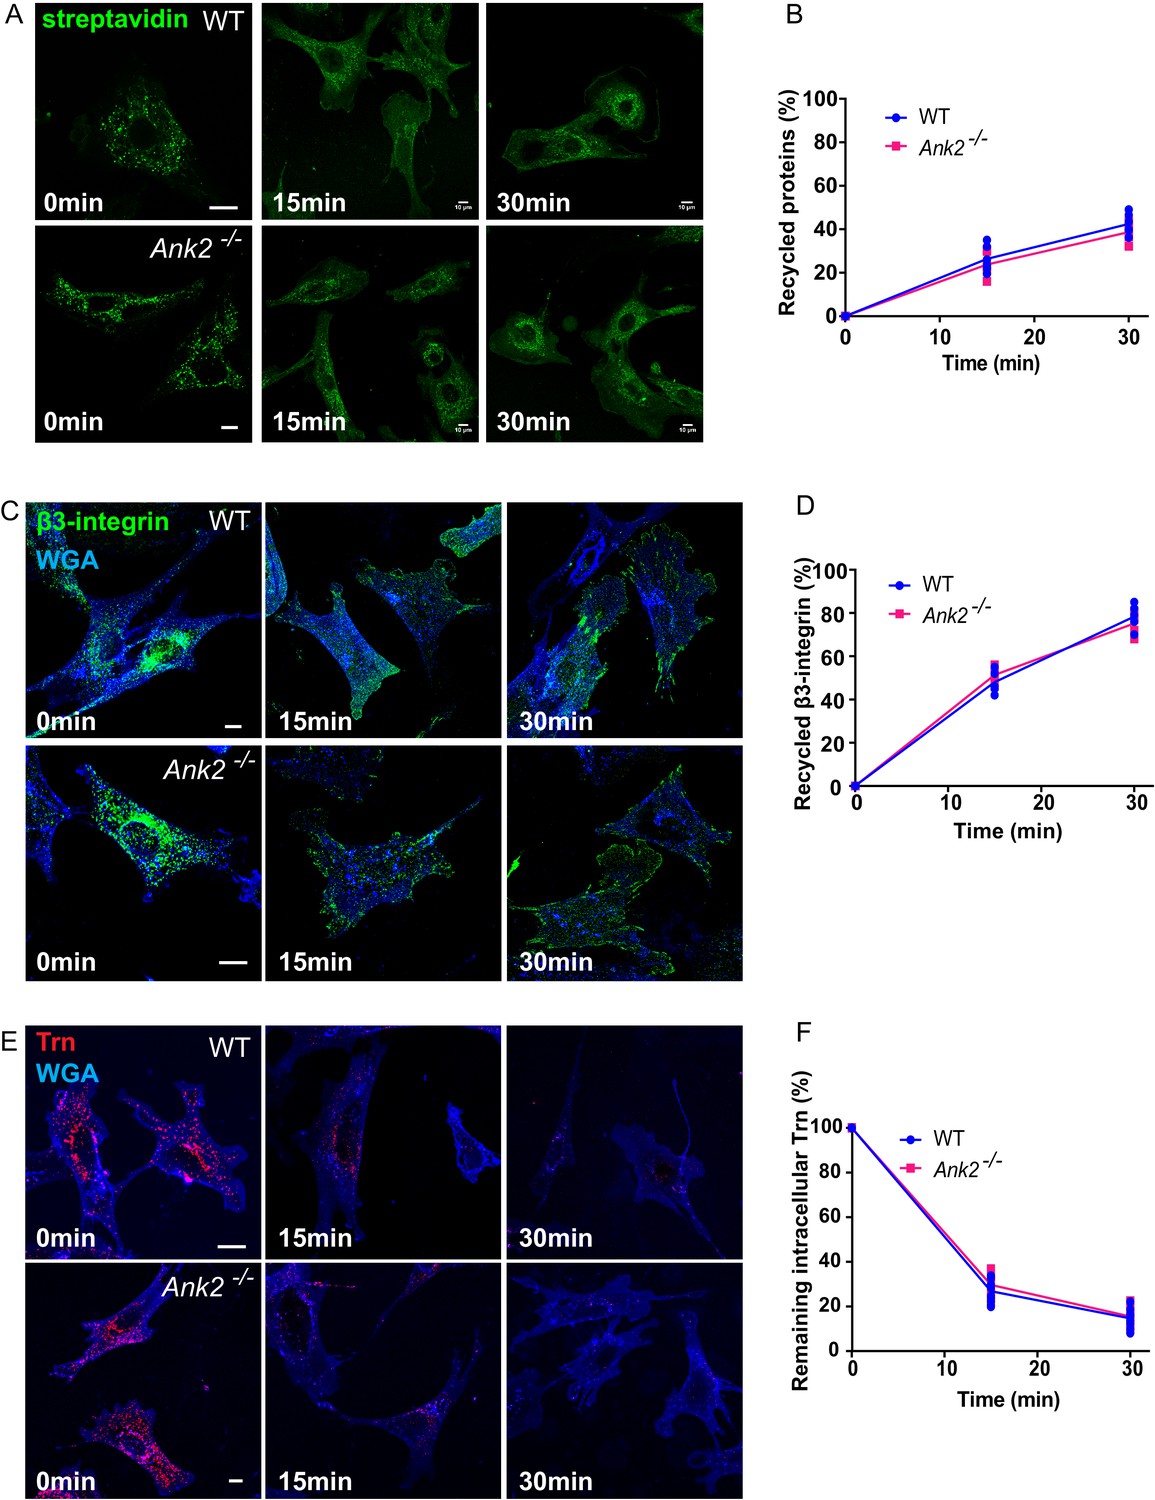
Global recycling of cell surface proteins, β3-integrin, and transferrin is not affected in Ank2-/- MEFs.
(A) Representative images show the internalization and recycling of biotin-labeled cell surface proteins in WT and Ank2-/- MEFs over a 30 min period. Biotin signal was detected with streptavidin-488. Scale bar, 10 µm. (B) Quantification of the percentage of recycled cell surface proteins in WT and Ank2-/- MEFs. Data represent mean ± SD for five independent experiments. Means from each experiment are shown. N = 15. (C) Representative images of β3-integrin recycling in WT and Ank2-/- MEFs. The plasma membrane is labeled by WGA (blue). Scale bar, 10 µm. (D) Quantification of the percentage of recycled β3-integrins in WT and Ank2-/- MEFs within 30 min after initiation of recycling. Data represent mean ± SD for five independent experiments. Means from each experiment are shown. N = 15. (E) Representative images of Trn recycling in WT and Ank2-/- MEFs. Scale bar, 10 µm. (F) Quantification of the percentage of remaining intracellular Trn signal in WT and Ank2-/- MEFs within 30 min after initiation of recycling. Data represent mean ± SD for seven independent experiments. Means from each experiment are shown. N = 32.
Figure 5 with 1 supplement
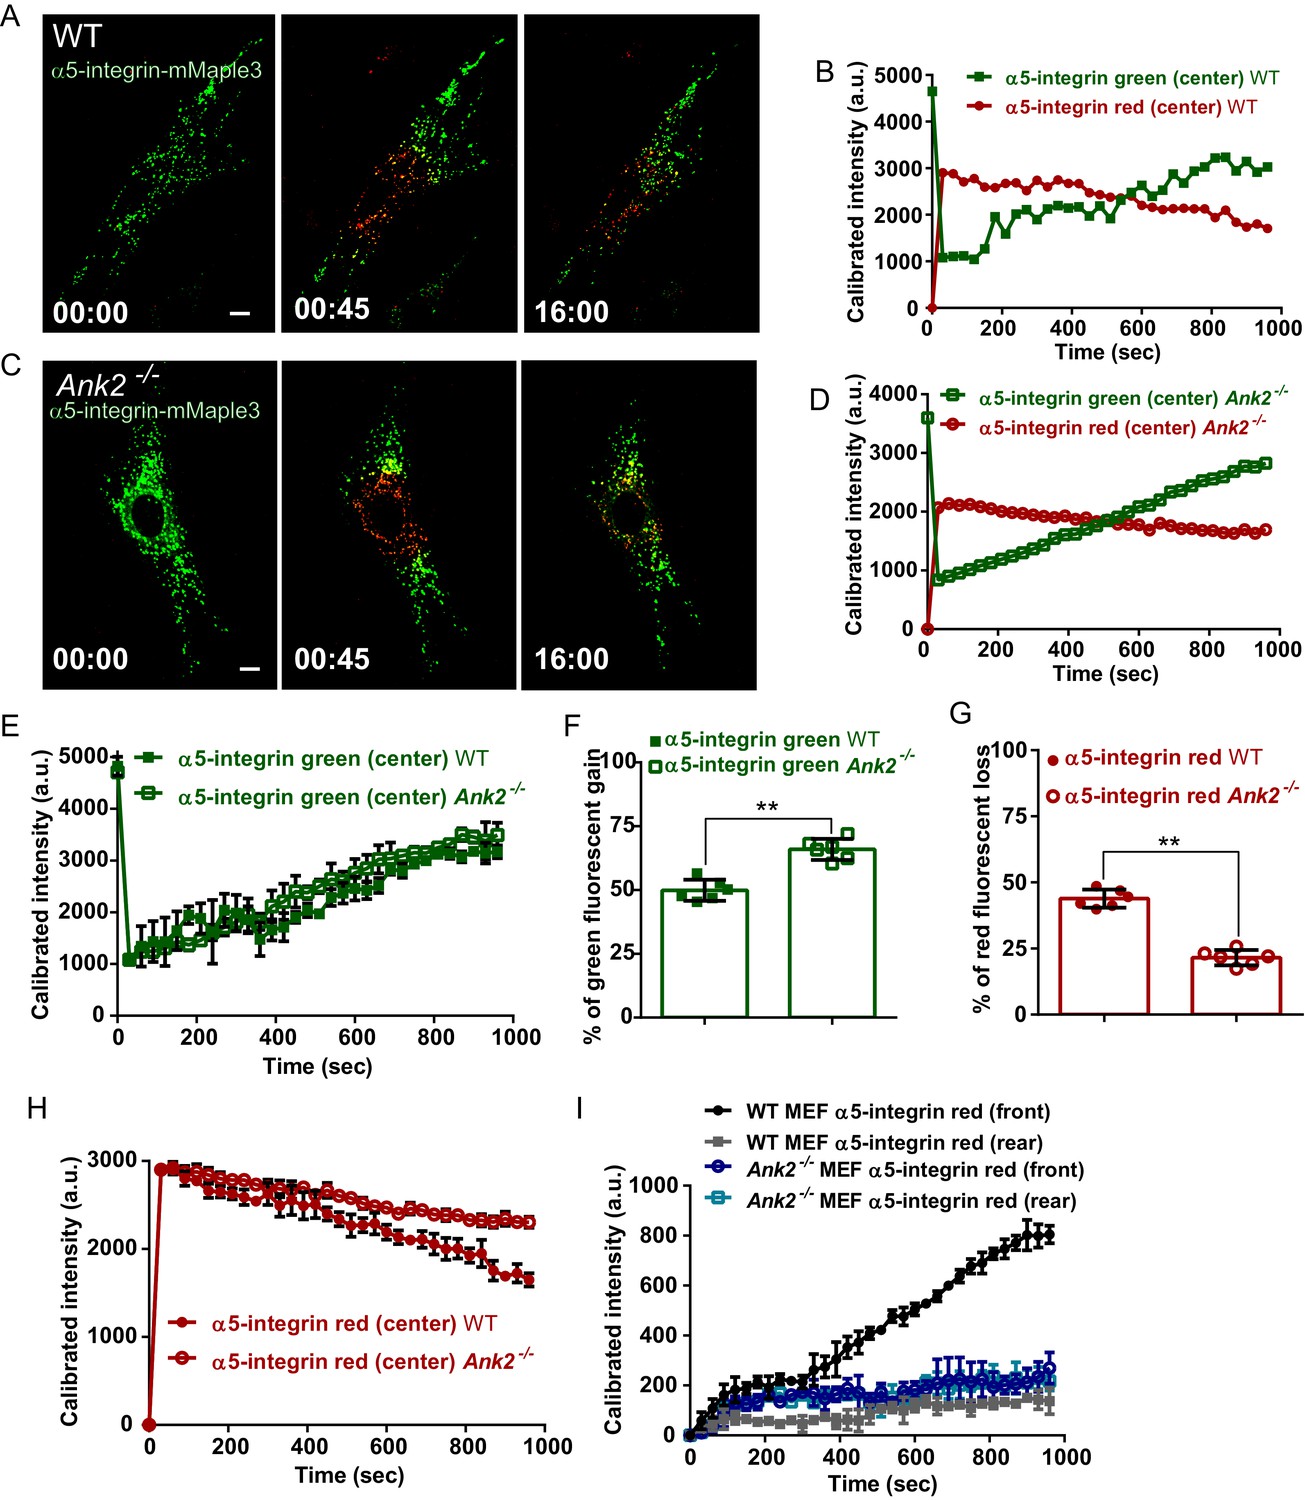
AnkB is required for polarized transport of α5-integrin towards the front end of migrating MEFs.
(A and C) Same photoconversion- wound-induced migration assay was performed in WT and Ank2-/- MEFs expressing α5-integrin-mMaple3. Representative images of WT MEFs (A) and Ank2-/- MEFs (C) expressing α5-integrin-mMaple3 at 0s (pre-converted), 45 s (perinuclear region converted) and16 mins (tracking end point). Scale bar, 10 µm. (B and D) Quantification of red fluorescent intensity (post-converted α5-integrin-mMaple3) and green fluorescent intensity (pre-converted AnkB-mMaple3) in the perinuclear region of WT (B) and an Ank2-/- (D) MEFs. (E, H) Comparative analysis of green fluorescent gain (E) and red fluorescent loss (H) in the perinuclear region. (F, G) Quantitative data of the percentage of red fluorescent loss and green fluorescent gain in the perinuclear region of WT and Ank2-/- MEFs at 16 min. (I) Quantification of red fluorescent intensity gain at either the front or rear cell ends. Intensities at each time point are normalized to the background intensity at t = 0 s. Data represent mean ± SD for six independent experiments. Mean from each of the six experiment is shown in E and H. **p=0.022, two-tailed t-test. N = 13.
Figure 5—figure supplement 1
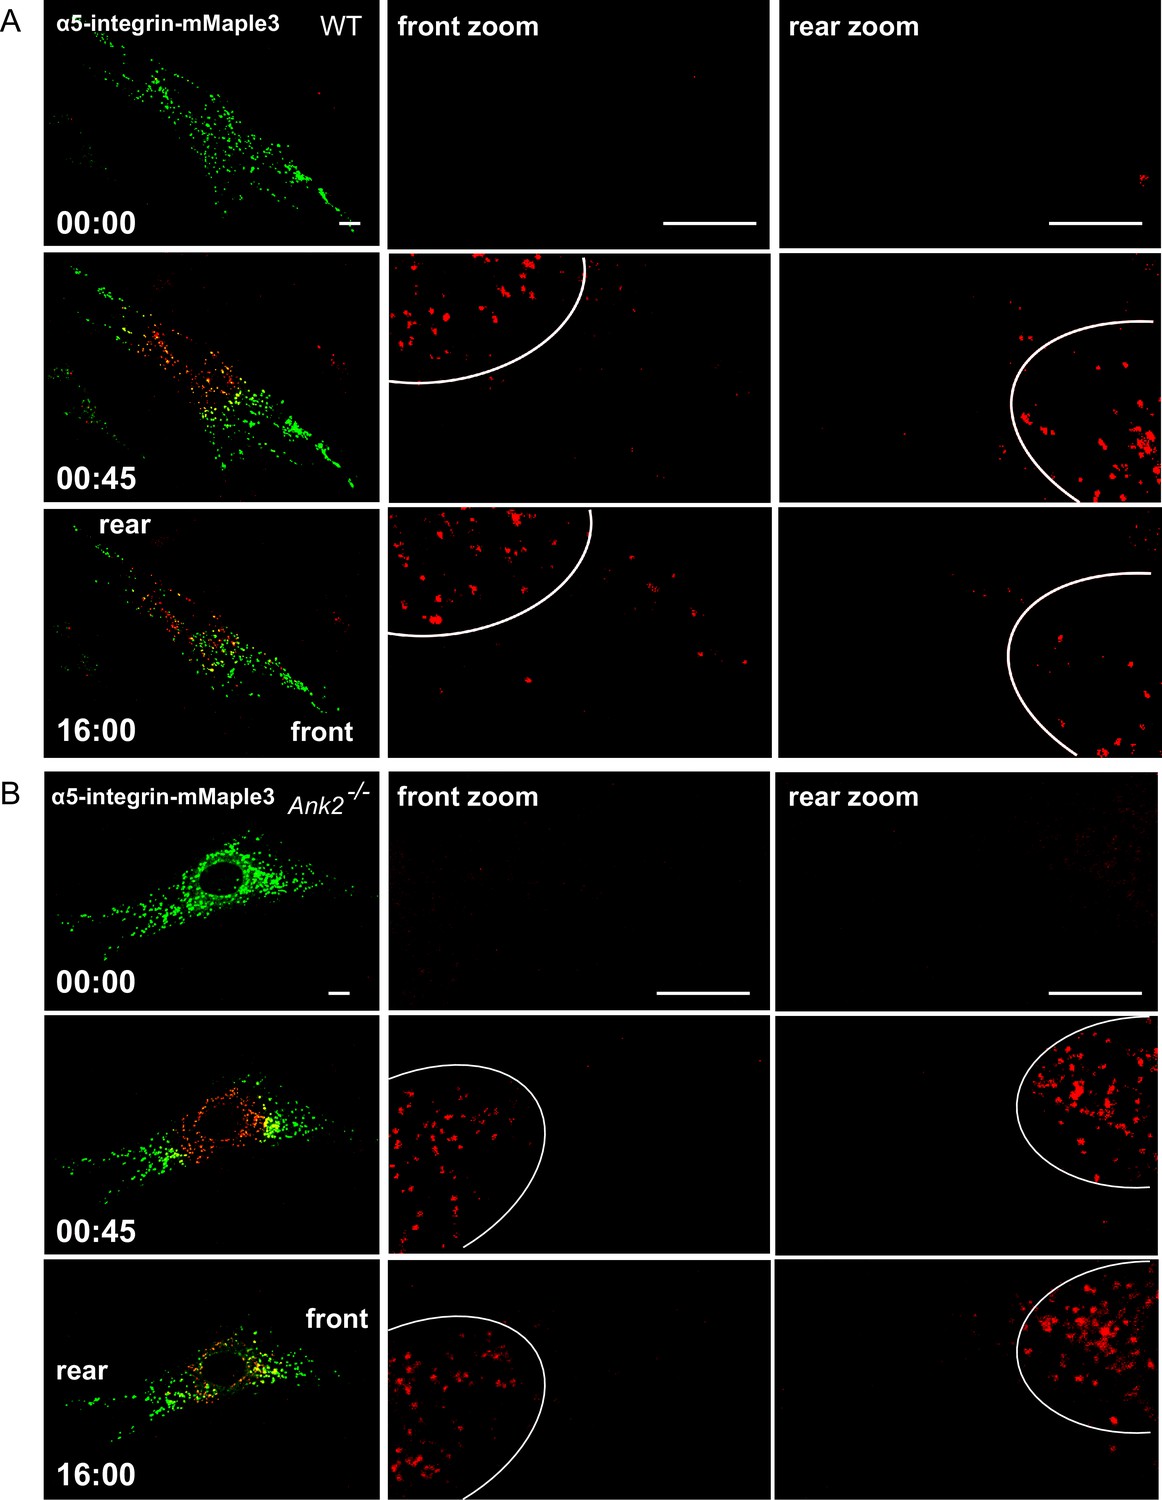
Distribution of α5-integrin-mMaple3 in WT and Ank2-/- MEFs during a photoconversion assay.
(A, B) Representative images of WT (A) and Ank2-/- (B) MEFs expressing mMaple3-tagged α5-integrin during a photoconversion assay. For each genotype: Top row left panel shows the distribution of green α5-integrin -mMaple3 vesicles before photoconversion (t = 0 s). Middle row left panel shows post-converted red perinuclear α5-integrin-mMaple3 vesicles (t = 45 s). Bottom row left panel shows distribution of post-converted red α5-integrin -mMaple3 vesicles 16 min after photoconversion. Scale bar, 8 µm. For each row, center and right panels show high magnification images of the rear and front cell ends.
Figure 6 with 3 supplements
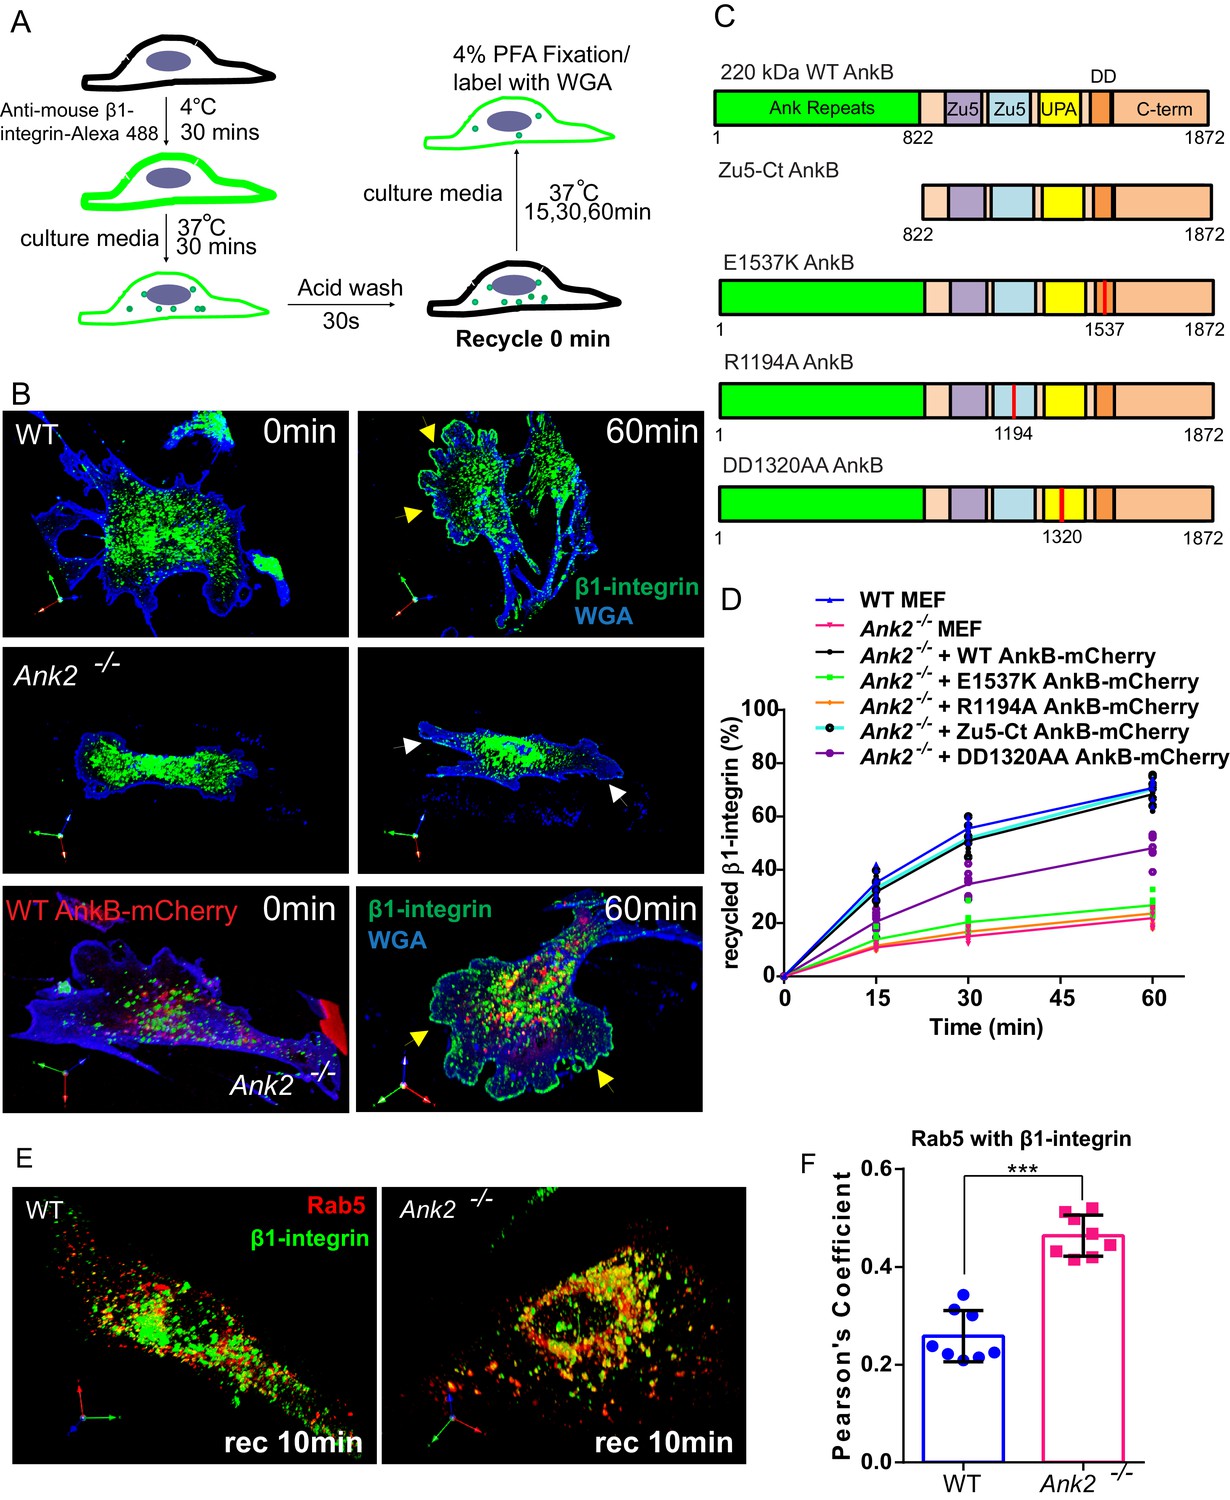
An AnkB-mediated mechanism promotes α5β1-integrin recycling to the plasma membrane of migrating MEFs.
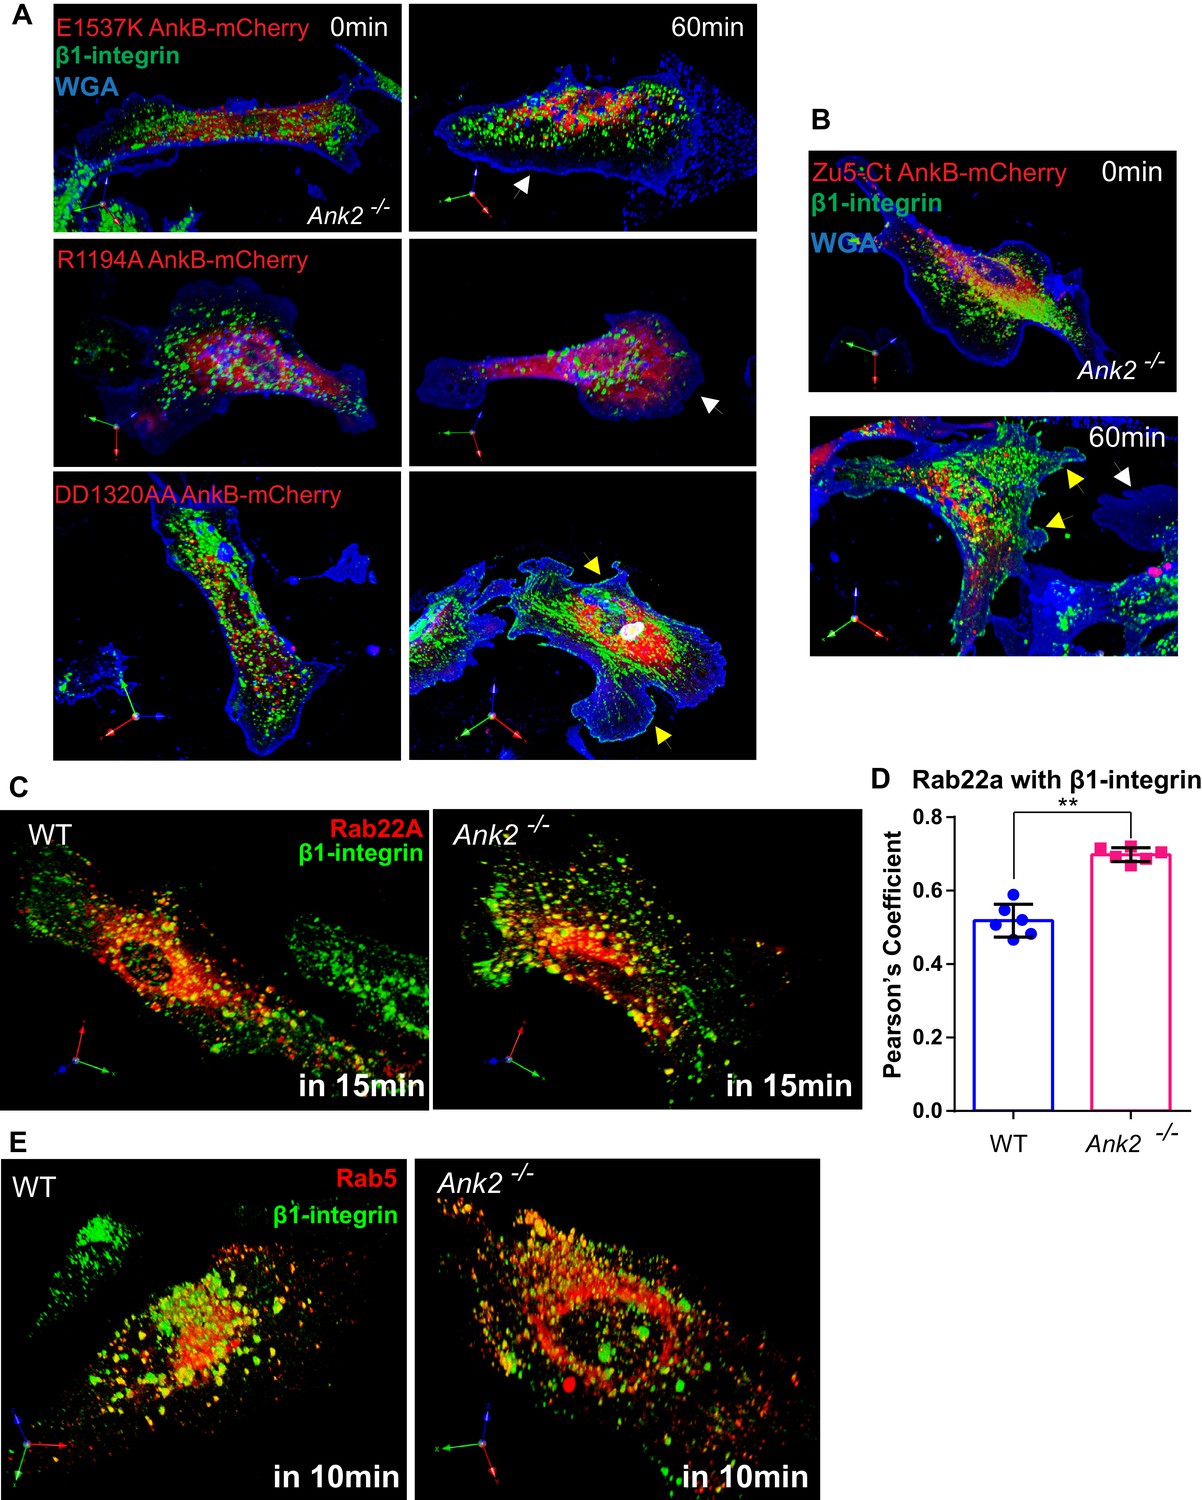
(A) Schematic representation of the β1-integrin recycling assay. Cell surface β1-integrins were labeled with anti-β1-integrin antibody conjugated with Alexa 488 at 4°C. Cells were incubated at 37°C for 30 min to allow internalization. Remaining cell surface labeling is reduced by acid wash and recorded as recycle time point 0 min. Cells were returned to 37°C incubation for indicated times following the wash with PBS and culture media. (B) Representative images of WT and Ank2-/- MEFs at recycling points t = 0 min and t = 60 min. β1-integrins are shown in green, plasma membranes labeled with WGA-Alexa 633 are shown in blue. Yellow arrows indicate plasma membrane areas at the migrating front containing recycled β1-integrin in WT and in Ank2-/-MEFs expressing WT AnkB-mCherry. White arrows indicate the absence of recycled β1-integrin signal at the plasma membrane of Ank2-/-MEFs (C) Schematic representation of the domain organization of AnkB-mCherry constructs used in structural function experiments. The various mutation sites are marked in red. (D) Quantitative data of β1-integrin recycling in WT, Ank2-/-, and Ank2-/- MEFs expressing WT or mutant AnkB-mCherry constructs. Data represents mean ± SD from five independent experiments. Individual data points indicate the mean from each experiment. N = 16. (E) Images show prolonged association of Rab5 with β1-integrin vesicles in Ank2-/- MEFs. (F) Pearson’s co-localization coefficient between Rab5 and internalized β1-integrin 10 min post recycling in WT and Ank2-/- MEFs. Data represents mean ± SD for three independent experiments. ***p<0.001, two-tailed t-test. N = 8.
Figure 6—figure supplement 1
Structural-functional study of AnkB-mCherry protein rescue of β1-integrin recycling deficits in Ank2-/- MEFs, β1-integrin localization to Rab22A- and Rab5-positive early endosomes.
(A) Representative images of Ank2-/- MEFs expressing E1537K AnkB-mCherry (top), R1194A AnkB-mCherry (middle), and DD1320AA AnkB-mCherry (bottom) proteins taken at different recycling times. Yellow arrows indicate plasma membrane areas containing recycled β1-integrin. White arrows indicate the absence of recycled β1-integrin signal at the plasma membrane of non-rescued cells. (B) Representative images of Ank2-/- MEFs expressing the ZU5-C-terminal portion (ZU5-Ct) of AnkB-mCherry at different recycling times. Yellow arrows indicate plasma membrane areas containing recycled β1-integrin molecules. (C) Representative images of WT (left) and Ank2-/- (right) MEFs expressing mCherry-Rab22A and Alexa 488-labeled β1-integrins fixed 15 min after initiation of internalization. (D) Quantification of mCherry-Rab22A and internalized β1-integrin co-localization 15 min after initiation of internalization in WT and Ank2-/- MEFs. Data represents mean ± SD from six independent experiments. Means from each experiment are shown. N = 18. **p=0.002, two-tailed t-test. (E) An association of Rab5-RFP with β1-integrin vesicles in WT and Ank2-/- MEFs 10 min after initiation of internalization.
Figure 6—figure supplement 2
Knock down of RabGAP1L or replacement with GAP-deficient RabGAP1L affects cell viability.
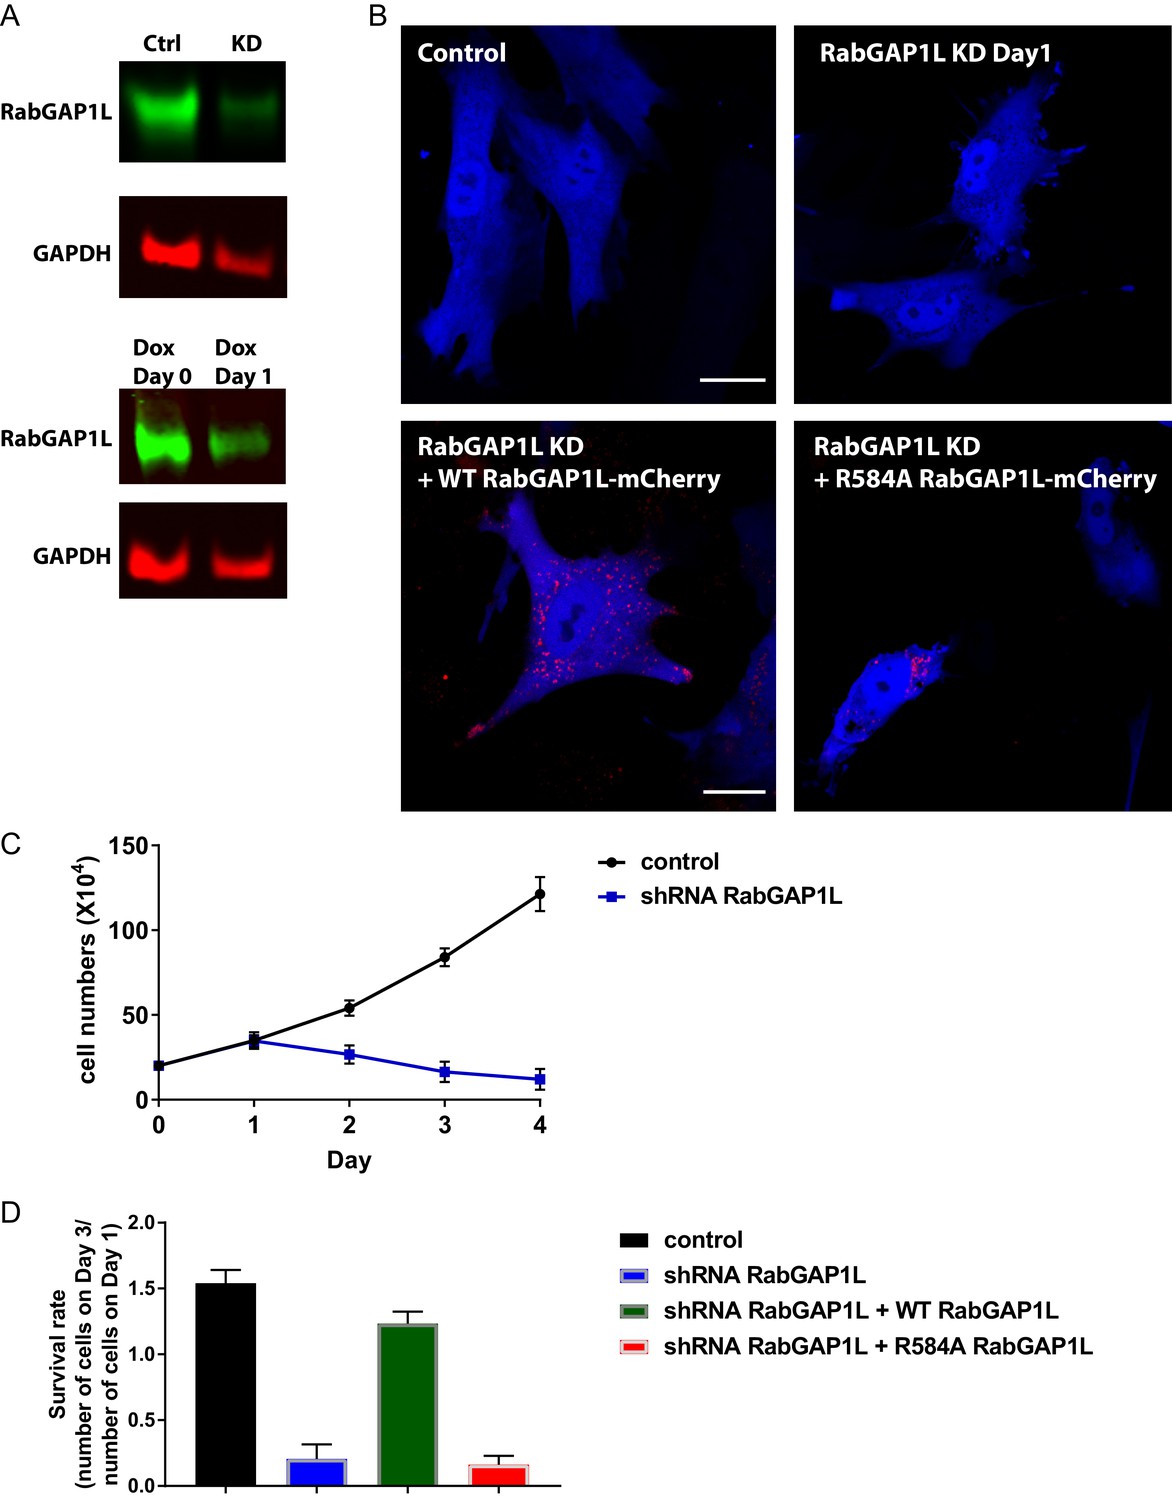
(A) RabGAP1L immunoblot of whole cell lysates from RabGAP1L shRNA knockdown or control cells at Day0 and Day1 post-treatment with Doxycycline. (B) Representative images of control MEFs, RabGAP1L knockdown MEFs, RabGAP1L knockdown MEFs rescued with WT or GAP-deficient R584A RabGAP1L. (C) Growth curve of control and RabGAP1L knockdown MEFs. (D) Survival rate of control MEFs, RabGAP1L knockdown MEFs, RabGAP1L knockdown MEFs rescued with WT or GAP-deficient R584A RabGAP1L. The survival is scored as indicated in the graph. Scale bar, 10 µm. Data represent mean ± SD for three independent experiments, N = 19.
Figure 6—figure supplement 3
Overexpression of WT or constitutively active Rab22A impairs receptor recycling.
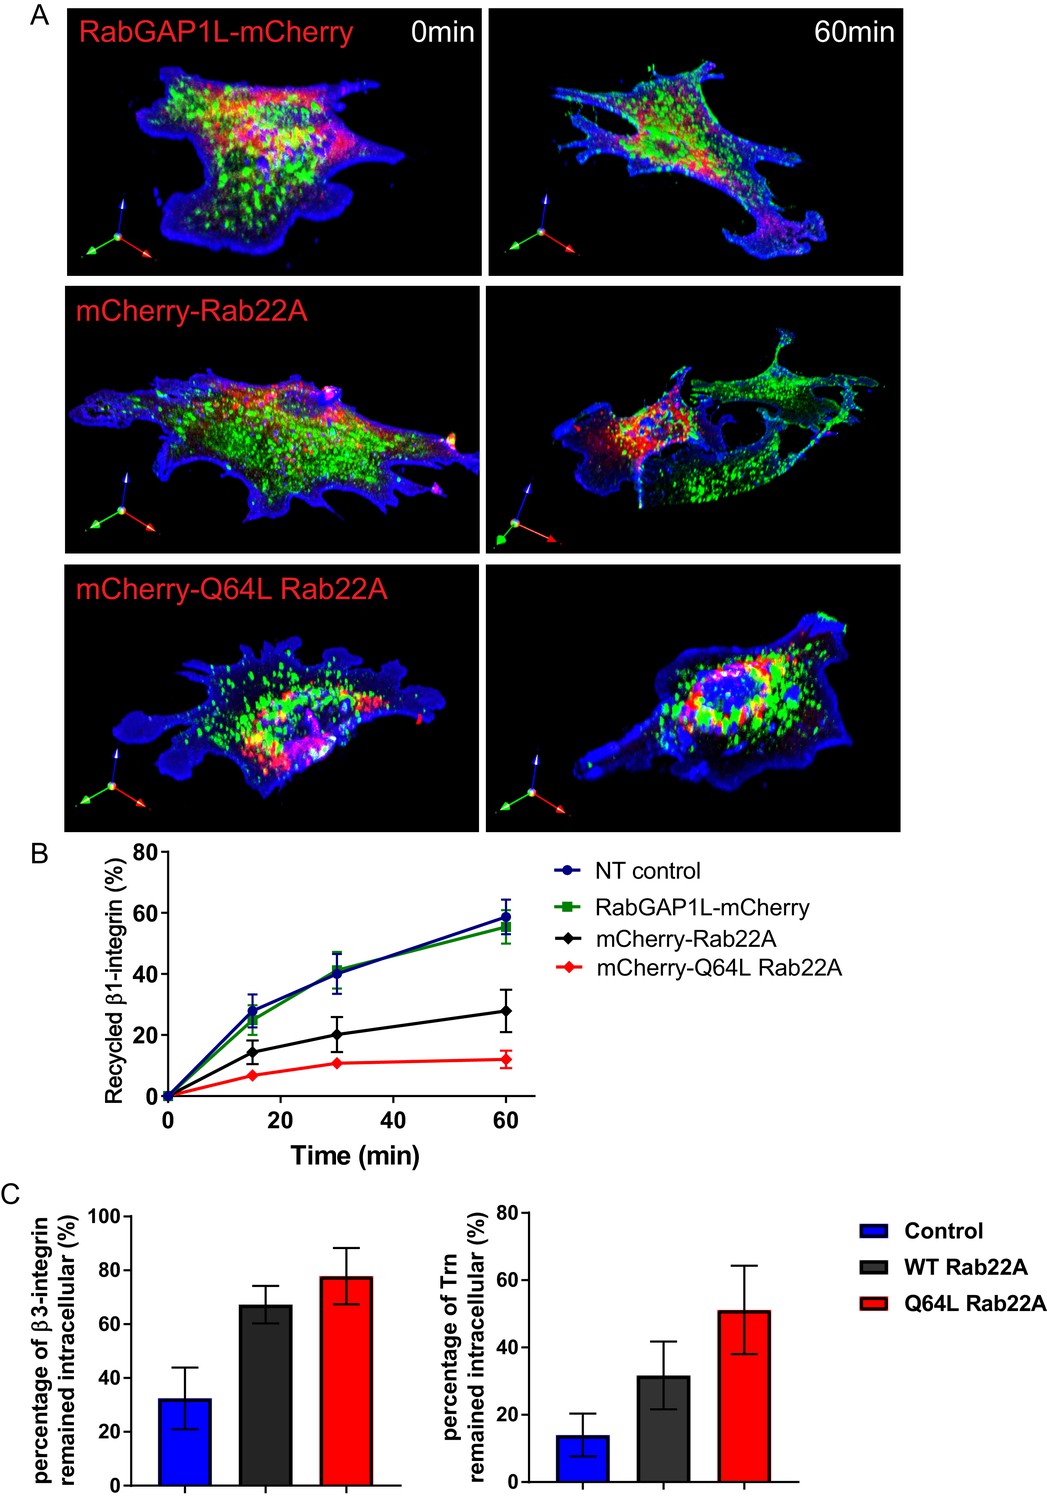
(A–B) Representative images (A) and quantitative data (B) of β1-integrin recycling within 60 min in control WT MEFs, WT MEFs expressing mCherry-WT Rab22A or constitutively active Q64L Rab22A. (C) Quantitative data showing the percentage of endocytosed β3-integrin and transferrin remained intracellular after 30 min of recycling. Data represent mean ± SD for three independent experiments. N = 15.
Figure 7
An AnkB-RabGAP1L complex is required for haptotaxis of MEFs on a fibronectin gradient.
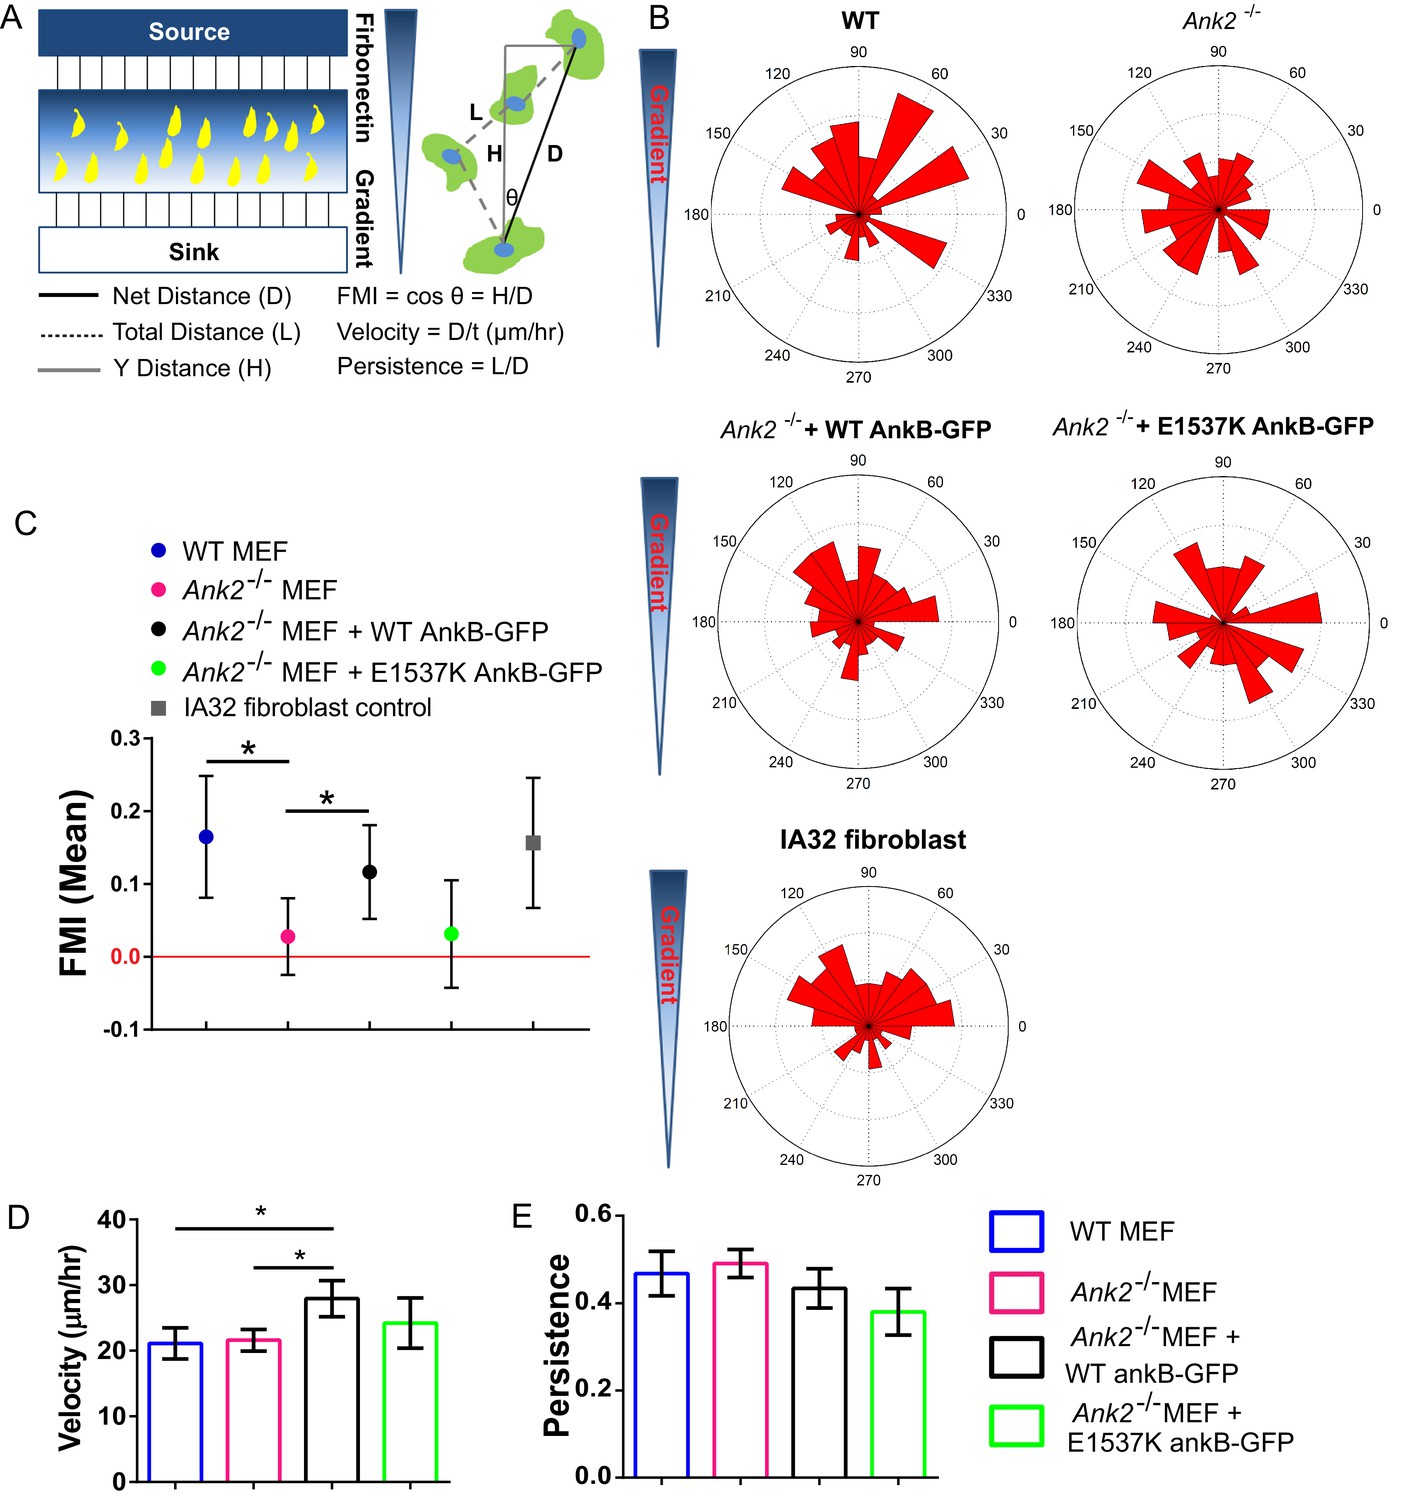
(A) Schematic of a microfluidic chamber system-based haptotaxis assay and analysis. (B) Rose plot showing the distribution of the tracking end point of cells migrate on a linear gradient of fibronectin. (C) Mean FMI of WT MEFs, control IA32 fibroblasts, Ank2-/- MEFs and Ank2-/- MEFs expressing WT AnkB-GFP or E1537K AnkB-GFP with 95% confidence interval (95% CI). Mean FMI with 95% CI crossing 0 is considered as not haptotaxing. (D, E) Mean velocity (D) and persistence (E) of the motility of WT, Ank2-/-, and Ank2-/- MEFs expressing WT AnkB-GFP or E1537K AnkB-GFP. Data represent mean ± SD from four independent experiments. *p=0.0238, 0.04. N = 98, 156, 116, 70, 78. one-way ANOVA with Tukey post-test.
Figure 8 with 1 supplement
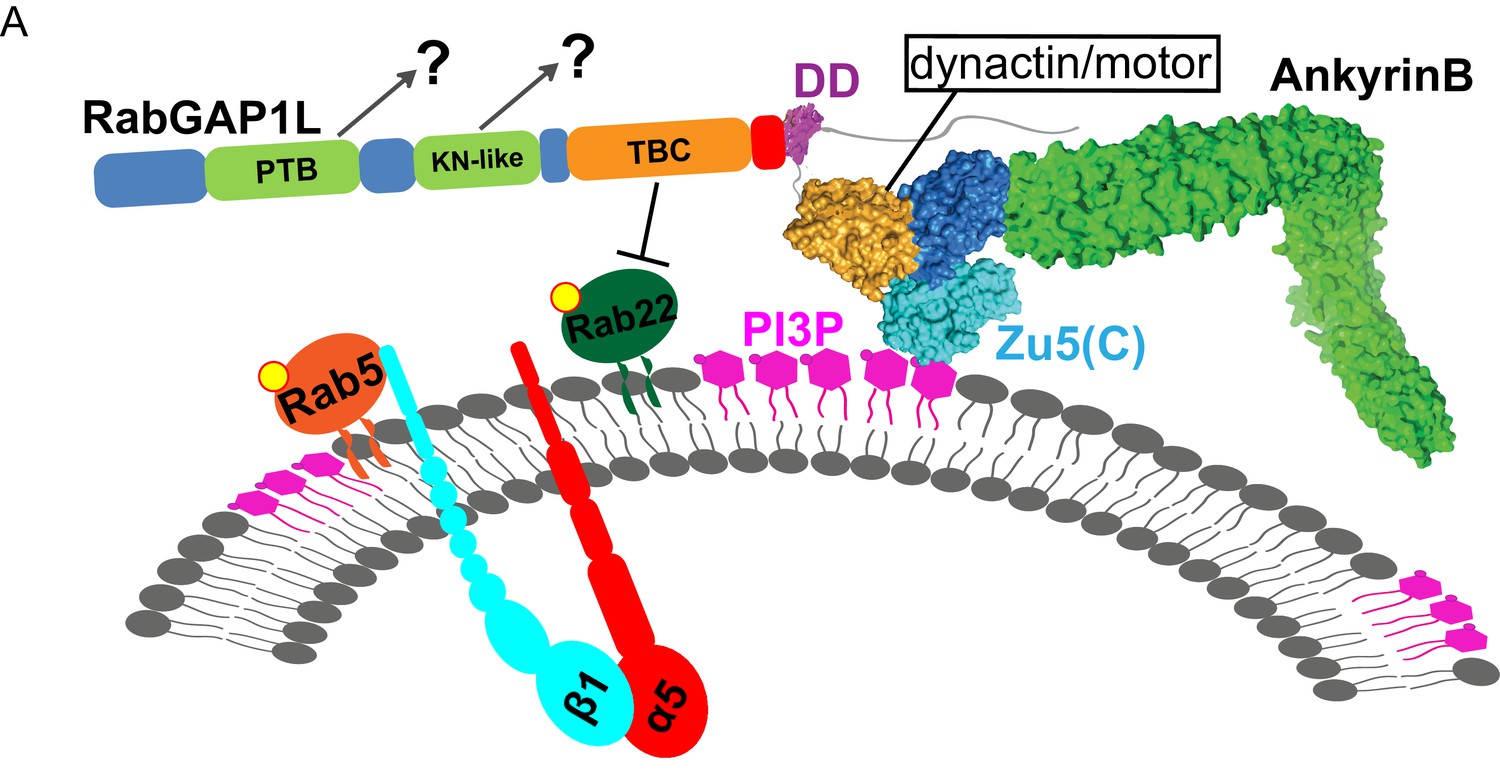
Model of AnkB-mediated mechanism for endosomal transport.
(A) Model of AnkB-mediated mechanism for the recruitment of RabGAP1L to PI3P/Rab22A-positive endosomal compartments, which is critical for the maturation and recycling of α5β1-integrin containing endosomes.
Figure 8—figure supplement 1
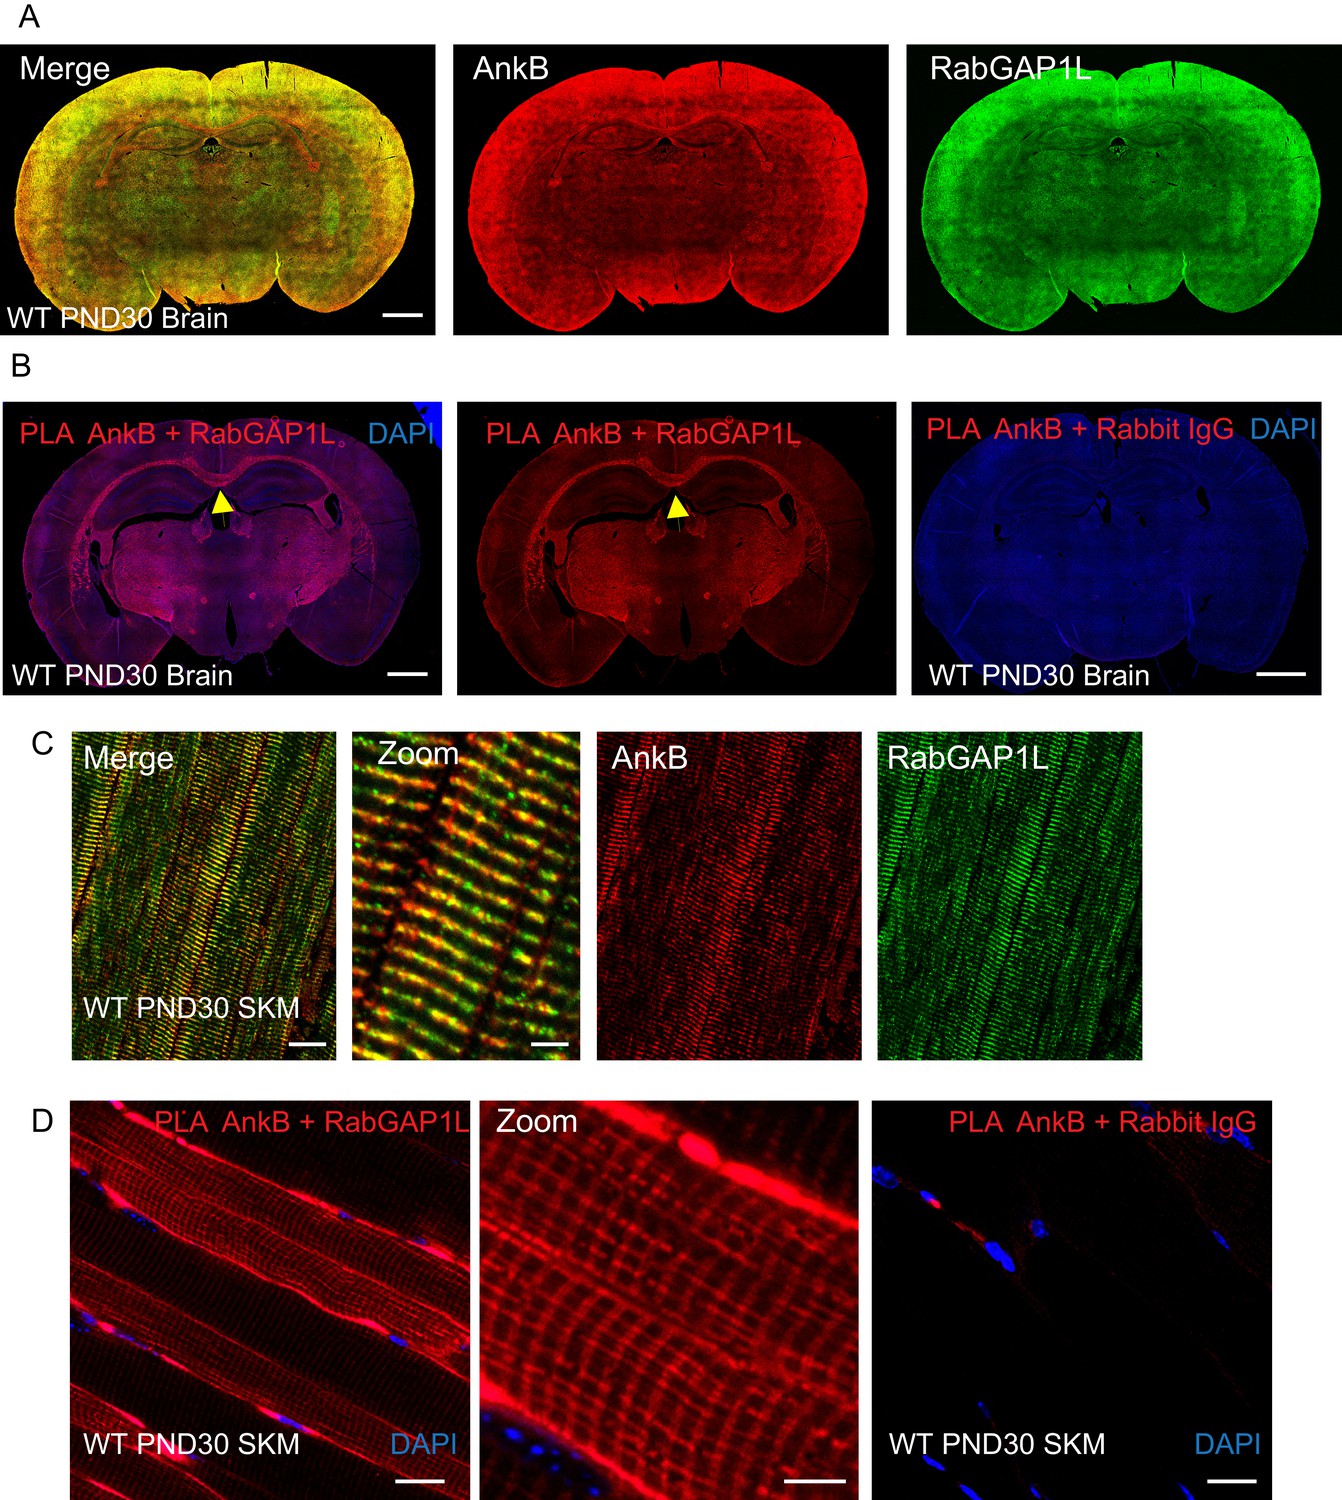
AnkB and RabGAP1L co-localize at the corpus callosum in the CNS and costameres in skeletal muscle.
(A) Immunofluorescent staining of endogenous AnkB (red) and RabGAP1L (green) in WT PND30 mice brain. Scale bar, 20 mm. (B) Proximity ligation of AnkB and RabGAP1L in WT PND30 mice brain. Red: positive ligation/interaction. Blue: DAPI. Yellow arrow points to corpus callosum. Scale bar, 20 mm. (C) Immunofluorescent staining of endogenous AnkB (red) and RabGAP1L (green) in WT PND30 mice skeletal muscle (SKM). (D) Proximity ligation of AnkB and RabGAP1L in WT PND30 mice skeletal muscle. Red: positive ligation/interaction. Blue: DAPI. Scale bar: 20 µm, zoom: 5 µm.
Download links
A two-part list of links to download the article, or parts of the article, in various formats.
Downloads (link to download the article as PDF)
Open citations (links to open the citations from this article in various online reference manager services)
Cite this article (links to download the citations from this article in formats compatible with various reference manager tools)
Ankyrin-B is a PI3P effector that promotes polarized α5β1-integrin recycling via recruiting RabGAP1L to early endosomes
eLife 5:e20417.
https://doi.org/10.7554/eLife.20417


