Membranes, energetics, and evolution across the prokaryote-eukaryote divide
- Indiana University, United States
Figures
Figure 1
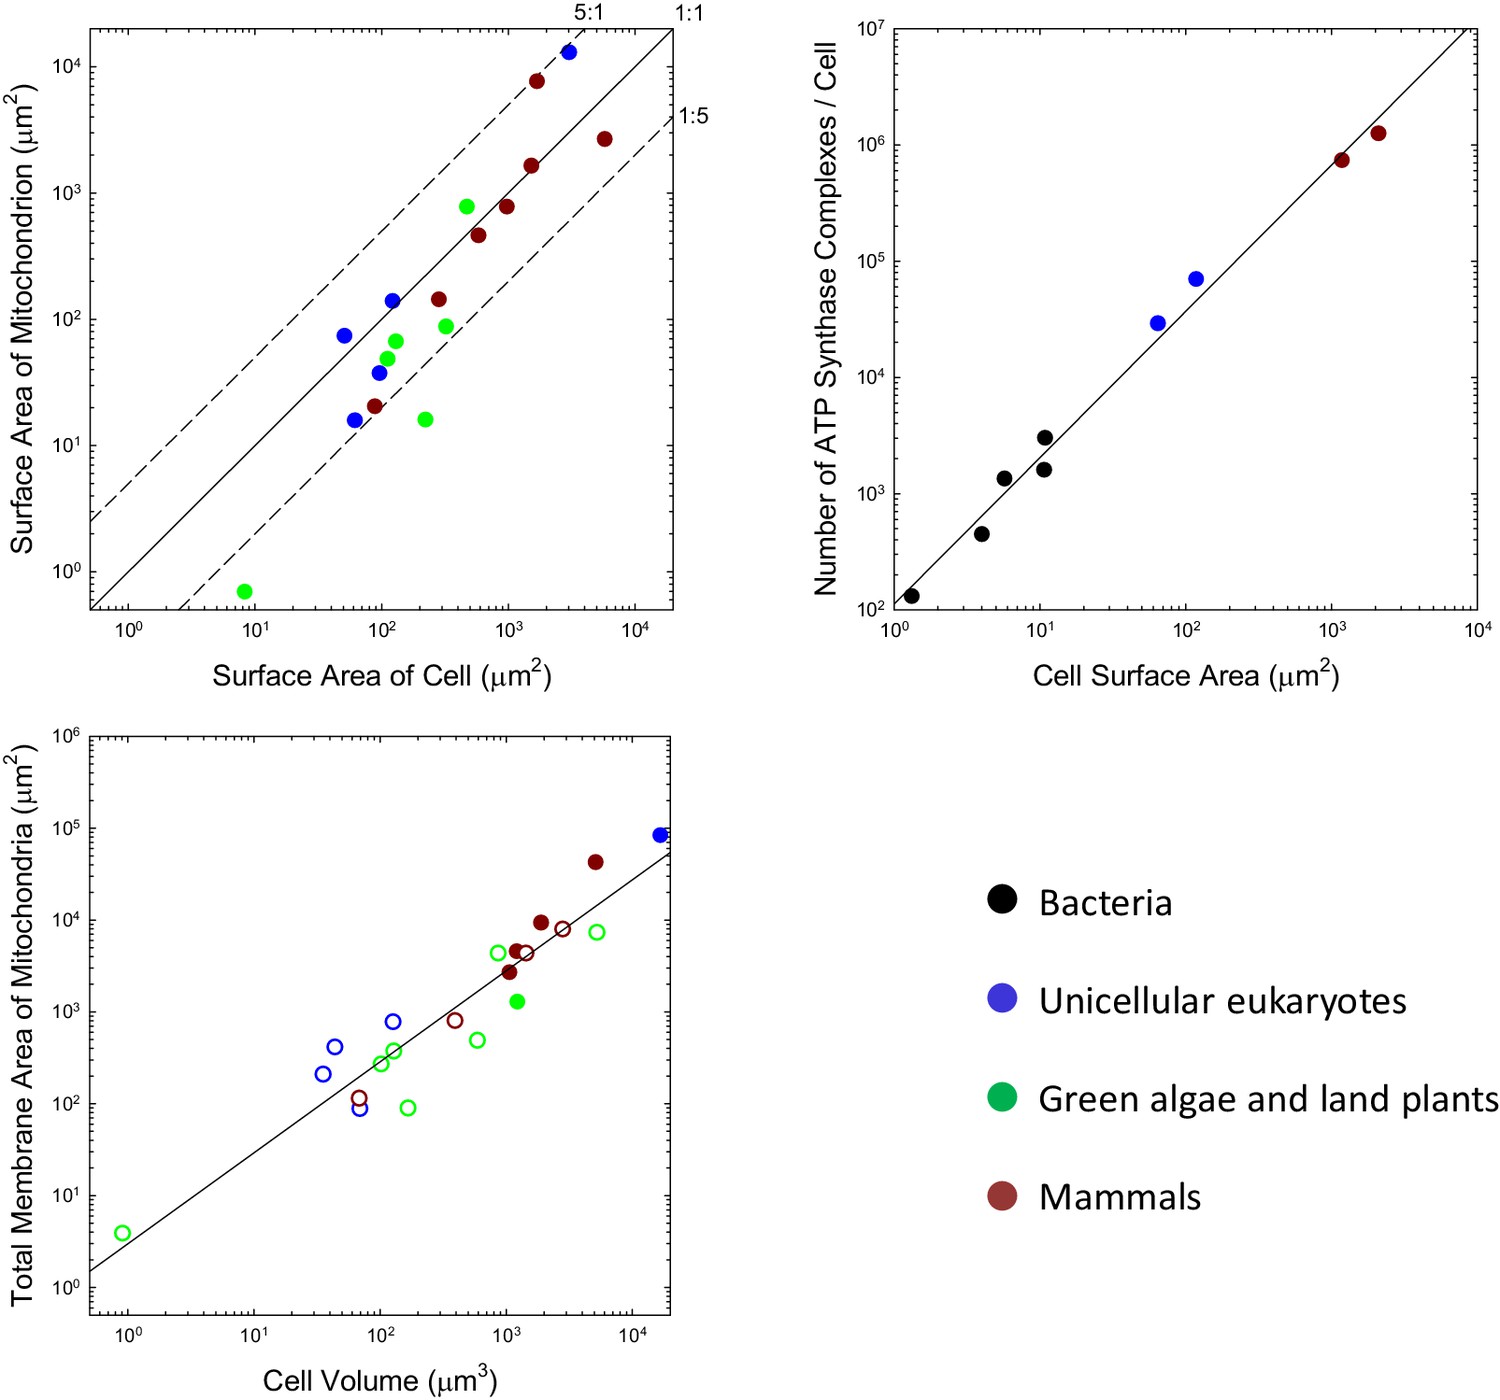
Scaling features of membrane properties with cell size.
(a) Relationship between the total outer surface area of mitochondria and that of the plasma membrane for all species with available data. Diagonal lines denote three idealized ratios of the two. (b) The number of ATP synthase complexes per cell scales with cell surface area (S, in μm2) as (). (c) Relationship between the total (inner + outer) surface area of mitochondria and cell volume for all species with available data. Open points are extrapolations for species with only outer membrane measures, derived by assuming an inner:outer ratio of 4.6, the average of observations in other species. References to individual data points are provided in Appendix 1–tables 1 and 2.
Figure 2
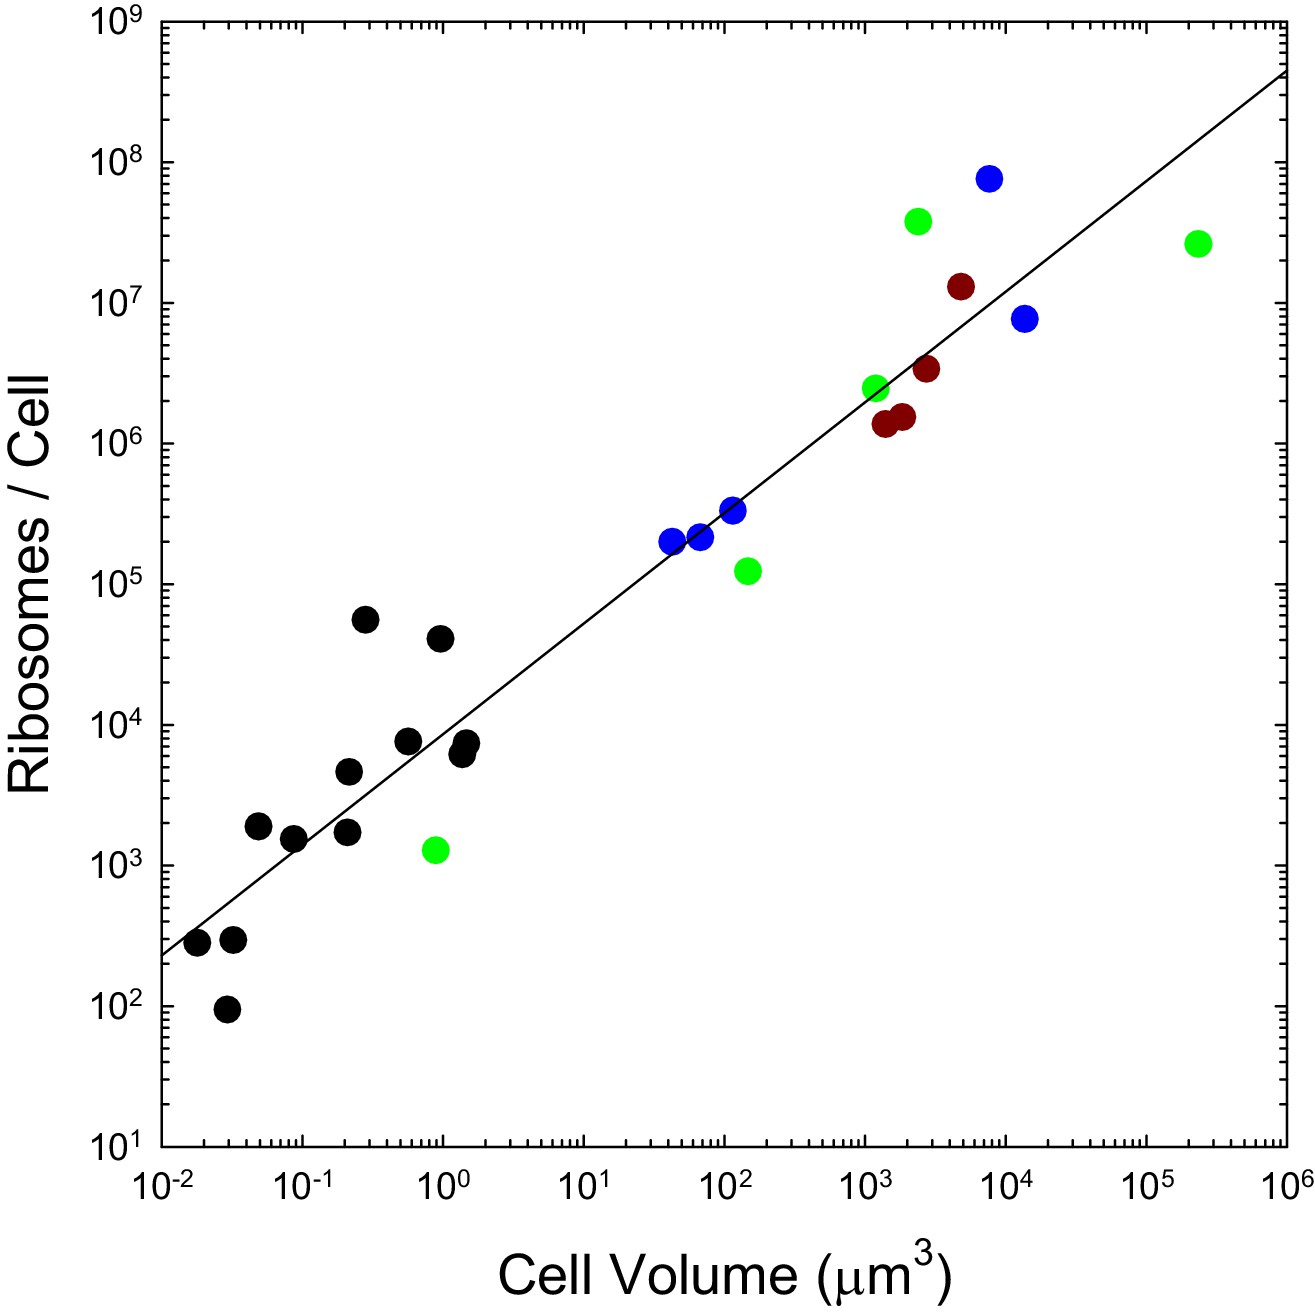
The number of ribosomes per cell scales with cell volume (, in μm3) as (; SEs of the intercept and slope on the log scale are 0.14 and 0.06, respectively).
Color coding as in previous figures. References to individual data points are provided in Appendix 1–table 3.
Appendix 1—figure 1
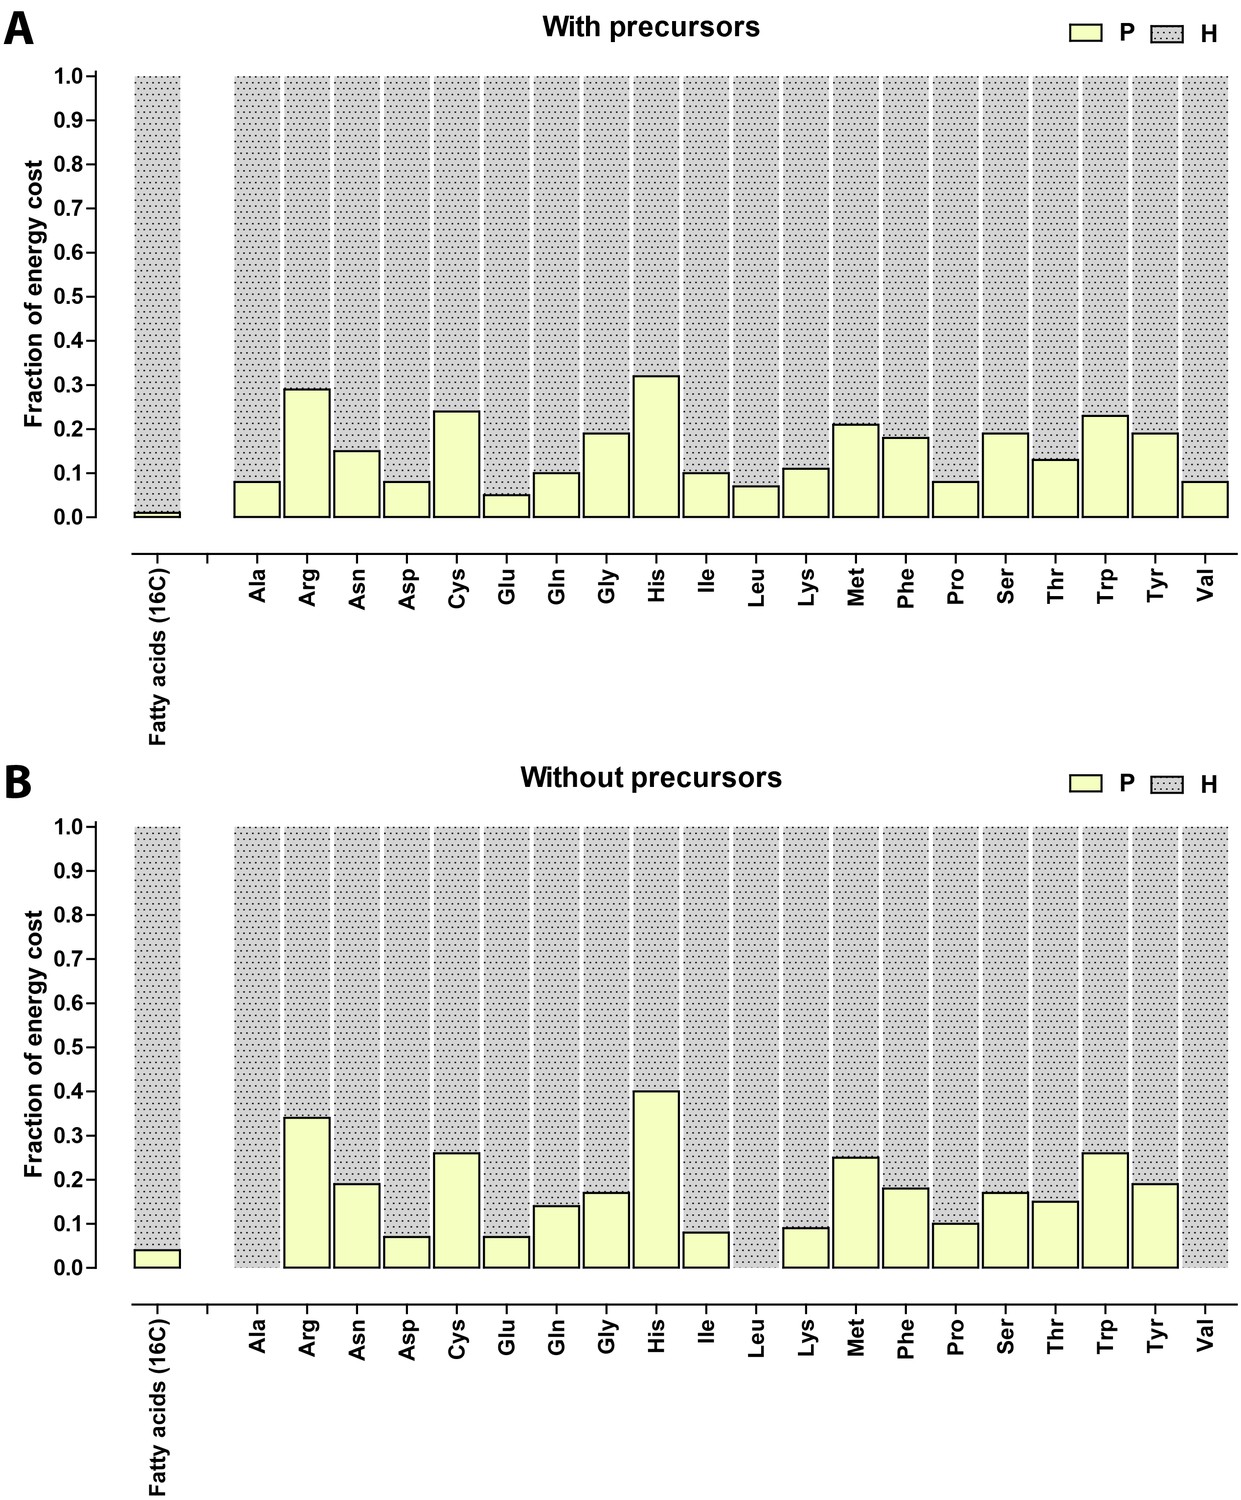
Relative contribution of ATP (P) and NADH/NADPH/FADH (H) to the biosynthetic costs of lipids and amino acids.
(A) Nonreduced costs including opportunity cost of precursors; (B) Reduced costs without precursors. Amino acid values are obtained from Akashi and Gojobori (2002), assuming growth on glucose.
Tables
Table 1
Contributions of membranes to total cellular growth costs. Ot denotes the green alga Ostreococcus tauri, Sc the yeast Saccharomyces cerevisiae, Ds the green alga Dunaliella salina, and Ss the pig (Sus scrofa) pancreas cell; references given in Supplementary material. Cell volumes and total membrane areas are in units of μm3 and μm2, respectively, with the latter excluding membranes associated with the plastids in the algal species. The fraction of the total cell growth budget allocated to membranes is obtained by the ratio of Equations (1b) and (4), using the species-specific reduced costs in Table 1 where available, and otherwise applying the averages for eukaryotic species; this total cost is then apportioned into five different fractional contributions in the following lines.
| Ot | Sc | Ds | Ss | |
|---|---|---|---|---|
| Cell volume | 1 | 44 | 591 | 1060 |
| Total membranes | 15 | 204 | 2299 | 12952 |
| Fraction of absolute cell growth budget | 0.324 | 0.096 | 0.094 | 0.302 |
| Plasma membrane | 0.556 | 0.328 | 0.134 | 0.044 |
| Mitochondria | 0.243 | 0.359 | 0.197 | 0.223 |
| Nucleus | 0.113 | 0.085 | 0.034 | 0.008 |
| Endoplasmic reticulum + Golgi | 0.034 | 0.111 | 0.318 | 0.706 |
| Vesicles/vacuoles | 0.055 | 0.114 | 0.316 | 0.019 |
Appendix 1—table 1
Features of mitochondrial membranes. Cell volumes are from Lynch and Marinov (2015), in some cases supplemented with additional references from the literature. : cell volume (in μm3); : cellular surface area (in μm2); : inner mitochondrial membrane surface area (in μm2); : inner+outer mitochondrial membrane surface area (in μm2); ratio between inner and outer mitochondrial membrane surface area
| Species | References | |||||
|---|---|---|---|---|---|---|
| Unicellular eukaryotes | ||||||
| Exophiala dermatitidis | 43.80 | 50.95 | 73.98 | Biswas et al. (2003) | ||
| Candida albicans | 35.36 | 96.10 | 37.37 | Tanaka et al. (1985); Klis et al. (2014) | ||
| Saccharomyces cerevisiae | 69.07 | 61.42 | 15.83 | Uchida et al. (2011) | ||
| Tetrahymena pyriformis | 16666.00 | 3014.05 | 12987.60 | 83968.50 | 5.200 | Gleason et al. (1975); Poole (1983) |
| Trichoderma viride | 126.70 | 122.01 | 139.40 | Rosen et al. (1974) | ||
| Mammals | ||||||
| Cat, gracilis muscle | 2.323 | Schwerzmann et al. (1989) | ||||
| Hamster, intestinal enterocyte | 1890.00 | 5772.00 | 2668.00 | 9351.00 | 3.256 | Buschmann and Manke (1981a, 1981b) |
| Human HeLa cells | 2798.67 | 1178.00 | 1424.74 | |||
| Mouse heart | 7.020 | Kistler and Weber (1975) | ||||
| Mouse liver | 3.540 | Kistler and Weber (1975) | ||||
| Mouse lymphocyte | 50.69 | 88.27 | 20.43 | Al-Hamdani et al. (1979); Mayhew et al. (1979) | ||
| Mouse immunoblast | 392.98 | 282.94 | 143.52 | Al-Hamdani et al. (1979) | ||
| Mouse pancreas | 1434.00 | 973.00 | 779.00 | Dean (1973) | ||
| Pig pancreas cell | 1060.00 | 581.90 | 460.50 | 2698.50 | 4.860 | Bolender (1974) |
| Rat Leydig cell, testes | 1210.00 | 1517.00 | 1641.00 | 4561.00 | 1.779 | Mori and Christensen (1980) |
| Rat liver cell | 5100.00 | 1680.00 | 7651.65 | 42615.56 | 4.718 | Weibel et al. (1969); Jakovcic et al. (1978) |
| Rat heart | 12.760 | Reith et al. (1973) | ||||
| Rat L-8 skeletal muscle cell | 4.670 | Reith et al. (1973) | ||||
| Land plants and algae | ||||||
| Arabidopsis thaliana, cotyledon | 5237.75 | 1307.00 | ||||
| Chlamydomonas reinhardtii | 128.38 | 129.60 | 66.82 | Calvayrac et al. (1974); Hayashi and Ueda (1989) | ||
| Chlorella fusca | 102.00 | 111.40 | 48.40 | Atkinson et al. (1974); Forde et al. (1976) | ||
| Dunaliella salina | 590.80 | 322.50 | 87.40 | Maeda and Thompson (1986) | ||
| Medicago sativa, meristem | 166.90 | 221.50 | 16.00 | Zhu et al. (1991) | ||
| Ochromonas danica | 2.450 | Smith-Johannsen and Gibbs, 1972 | ||||
| Ostreococcus tauri | 0.91 | 8.30 | 0.70 | Henderson et al. (2007) | ||
| Polytoma papillatum | 862.54 | 471.43 | 778.64 | Gaffal et al. (1982) | ||
| Rhus toxicodendron | 1222.00 | 1288.50 | 2.545 | Vassilyev (2000) | ||
Appendix 1—table 2
Estimated abundance of ATP synthase complexes in species with quantitative proteomics data. ATP synthase surface area assumed to be maximum associated with the inner ring, 6.4 × 10⁻⁵ m2 for bacteria, 1.1 × 10⁻⁴ for eukaryotes. : cell volume (in μm3); : cellular surface area (in μm2); : raw protein complex copy number estimates; : corrected protein complex copy number estimates; : correction factor; : packing density (copies/μm2); : fraction of : cell division time (hours); , , : costs of building a cell per in 109 ATP equivalents; : growth; : maintenance (per hours); : total; and : maximum (all ATP equivalents) and reduced (without ATP equivalents expended in the form of NADH/NADPH/FADH2) required rate of ATP synthesis (per complex per second) to satisfy lifetime energy requirements.
| F0F 1 copies per cell | ||||||||||||||
|---|---|---|---|---|---|---|---|---|---|---|---|---|---|---|
| Species | References | |||||||||||||
| Prokaryotes | ||||||||||||||
| Bacillus subtilis | 1.407 | 10.69 | 2435 | 1602 | 0.66 | 150 | 0.010 | 1.16 | 92.51 | 1.16 | 93.85 | 14062 | 2109 | Jeong et al. (1990); Weart et al. (2007); Sharpe et al. (1998) |
| Escherichia coli | 0.983 | 10.85 | 1056 | 3018 | 2.86 | 278 | 0.018 | 0.99 | 15.65 | 0.21 | 15.86 | 1475 | 221 | Young (2006); Milo and Phillips, 2016 |
| Leptospira interrogans | 0.220 | 5.72 | 1187 | 1344 | NA | 235 | 0.015 | Beck et al. (2009) | ||||||
| Mycoplasma pneumoniae | 0.033 | 1.32 | 117 | 131 | 1.12 | 99 | 0.006 | 63.74 | 0.92 | 0.05 | 3.87 | 129 | 19 | Zucker-Franklin et al. (1996a), 1996b |
| Staphylococcus aureus | 0.288 | 4.00 | 447 | NA | NA | 112 | 0.007 | Kehle and Herzog (1989) | ||||||
| Fungi | ||||||||||||||
| Saccharomyces cerevisiae (hap) | 37.940 | 64.42 | 15659 | 29126 | 1.86 | 452 | 0.050 | 2.50 | 2468.20 | 18.79 | 2515.15 | 9598 | 1440 | |
| Schizosaccharomyces pombe | 118.000 | 116.38 | 65363 | 70129 | 1.07 | 603 | 0.066 | 4.31 | 2347.80 | 8.70 | 2385.29 | 2193 | 329 | |
| Mammals | ||||||||||||||
| Homo sapiens , HeLa cell | 2798.668 | 1178.00 | 1284376 | 737270 | 0.57 | 626 | 0.068 | Borle (1969a, 1969b) | ||||||
| Mus musculus , fibroblast NIH3T3 | 1765.000 | 2100.00 | 1255254 | NA | NA | 598 | 0.066 | Schwanhäusser et al. (2011) | ||||||
Appendix 1—table 3
Estimated numbers of ribosomes per cell. Direct estimates taken from microscopic examinations; proteomic estimates are from averaging of cell-specific estimates for each ribosomal protein subunit. : cell volume (in μm3); : directly estimated copies per cell; : estimated copies per cell based on proteomics studies
| Species | References | ||||
|---|---|---|---|---|---|
| Bacteria | |||||
| Bacillus subtilis | 1.407 | 6000 | Barrera and Pan (2004) | ||
| 9124 | Maass et al. (2011) | ||||
| Escherichia coli | 0.983 | 72,000 | Bremer and Dennis (1996) | ||
| 45,100 | Fegatella et al. (1998) | ||||
| 26,300 | Fegatella et al. (1998) | ||||
| 13,500 | Fegatella et al. (1998) | ||||
| 6800 | Fegatella et al. (1998) | ||||
| 55,000 | Bakshi et al. (2012) | ||||
| 20,100 | |||||
| 12,000 | Arfvidsson and Wahlund (2003) | ||||
| 6514 | Wiśniewski et al. (2014) | ||||
| 17,979 | Lu et al. (2007) | ||||
| Legionella pneumophila | 0.580 | 7400 | Leskelä et al. (2005) | ||
| Leptospira interrogans | 0.220 | 4500 | Beck et al. (2009) | ||
| 1039 | Schmidt et al. (2011) | ||||
| Mycoplasma pneumonii | 0.050 | 140 | Yus et al. (2009) | ||
| 300 | Seybert et al. (2006) | ||||
| 422 | Kühner et al. (2009) | ||||
| 255 | Maier et al. (2011) | ||||
| Mycobacterium tuberculosis | 0.215 | 1672 | Yamada et al. (2015) | ||
| Rickettsia prowazekii | 0.089 | 1500 | Pang and Winkler (1994) | ||
| Sphingopyxis alaskensis | 0.050 | 1850 | Fegatella et al. (1998) | ||
| 200 | Fegatella et al. (1998) | ||||
| Spiroplasma melliferum | 0.018 | 275 | Ortiz et al. (2006) | ||
| Staphylococcus aureus | 0.288 | 54,400 | Martin and Iandolo (1975) | ||
| Vibrio angustum | 27,500 | Flärdh et al. (1992) | |||
| 8000 | Flärdh et al. (1992) | ||||
| Archaea | |||||
| ARMAN | undescribed | 0.030 | 92 | Comolli et al. (2009) | |
| Eukaryotes | |||||
| Exophiala dermatitidis | 43.800 | 195,000 | Biswas et al. (2003) | ||
| Saccharomyces cerevisiae | haploid | 69.071 | 200,000 | Warner (1999) | |
| 220,000 | Yamaguchi et al. (2011) | ||||
| 153,456 | Kulak et al. (2014) | ||||
| 72,284 | Ghaemmaghami et al. (2003) | ||||
| Schizosaccharomyces pombe | 118.000 | 150,000 | Marguerat et al. (2012) | ||
| 500,000 | Maclean (1965) | ||||
| 505,260 | Kulak et al. (2014) | ||||
| 100,568 | Marguerat et al. (2012) | ||||
| Tetrahymena pyriformis | 14002.067 | 7,490,000 | Hallberg and Bruns (1976) | ||
| Tetrahymena thermophila | 7856.00 | 74,000,000 | Calzone et al. (1983) | ||
| Chlamydomonas reinhardtii | cytoplasm | 151.000 | 120,500 | Bourque et al. (1971) | |
| chloroplast | 55,000 | ||||
| Ostreococcus tauri | 0.910 | 1250 | Henderson et al. (2007) | ||
| Adonis aestivalis | vegetative | 2380.300 | 47,700,000 | Lin and Gifford (1976) | |
| transitional | 2287.000 | 39,066,666 | |||
| floral | 2690.000 | 23,666,666 | |||
| Glycine max SB-1 cell | 9,373,333 | Jackson and Lark (1982) | |||
| Rhus toxicodendron | 1222 | 2,400,000 | Vassilyev (2000) | ||
| Zea mays root cell | 240,000 | 25,500,000 | Hsiao and (1970) | ||
| Hamster, intestinal enterocyte | 1890 | 1,500,000 | Buschmann and Manke (1981a, 1981b) | ||
| HeLa cell | 2798.668 | 3,300,000 | Duncan and Hershey (1983) | ||
| Zhao et al. (2008) | |||||
| 5,748,830 | Kulak et al. (2014) | ||||
| Mouse pancreas | 1434.000 | 1,340,000 | Dean (1973) | ||
| Rat liver cell | 4940.000 | 12,700,000 | Weibel et al. (1969) | ||
Appendix 1—table 4
Costs of lipids. The average cost per molecule is calculated for a variety of species using estimates of lipid compositions from the literature and the formulas described in the text. The fraction of fatty acids of given length and saturation level is not shown. Cardiolipin costs are assumed to be 637 (evolutionary) and 236 (reduced) ATP. The cost for molecules in the ‘other’ category is assumed to be the average of glycerophospholipids (GPL) in the species and cardiolipin.
| GPL cost | Composition | Mean cost | ||||||||
|---|---|---|---|---|---|---|---|---|---|---|
| Species | Membrane | Tot. | Red. | GPL | Cardiolipin | Other | Tot. | Red. | References | |
| Escherichia coli | Whole cell | 367 | 115 | 0.926 | 0.060 | 0.015 | 385 | 124 | Haest et al. (1969); Rietveld et al. (1993); Raetz et al. (1979) | |
| Bacillus subtilis | Whole cell | 308 | 102 | 0.818 | 0.183 | 0.000 | 368 | 127 | Bishop et al. (1967); López et al. (1998) | |
| Caulobacter crescentus | Whole cell | 340 | 111 | 0.776 | 0.105 | 0.119 | 389 | 132 | Contreras et al. (1978); Chow and Schmidt (1974) | |
| Staphylococcus aureus | Whole cell | 323 | 105 | 0.931 | 0.070 | 0.000 | 345 | 114 | Haest et al. (1972); Mishra and Bayer (2013) | |
| Zymomonas mobilis | Whole cell | 370 | 118 | 0.990 | 0.010 | 0.000 | 373 | 119 | Carey and Ingram (1983) | |
| 372 | 123 | mean | ||||||||
| 8 | 3 | SE | ||||||||
| Candida albicans | Whole cell | 338 | 123 | 0.934 | 0.066 | 0.000 | 358 | 131 | Goyal and Khuller (1992); Singh et al. (2010) | |
| Chlamydomonas reinhardtii | Whole cell | 390 | 140 | 0.935 | 0.065 | 0.000 | 406 | 146 | Janero and Barrnett (1981); Giroud et al. (1988); Tatsuzawa et al. (1996) | |
| Debaryomyces hansenii | Whole cell | 408 | 141 | 0.913 | 0.087 | 0.000 | 428 | 150 | Kaneko et al. (1976) | |
| Dictyostelium discoideum | Whole cell | 400 | 141 | 0.965 | 0.014 | 0.000 | 395 | 139 | Davidoff and Korn (1963); Ellingson (1974); Weeks and Herring (1980); Paquet et al. (2013) | |
| Paramecium tetraurelia | Whole cell | 415 | 146 | 0.996 | 0.004 | 0.000 | 415 | 146 | ||
| Pichia pastoris | Whole cell | 412 | 144 | 0.975 | 0.025 | 0.000 | 418 | 147 | Klug et al. (2014) | |
| Saccharomyces cerevisiae | Whole cell | 372 | 133 | 0.953 | 0.047 | 0.000 | 385 | 138 | Longley et al. (1968); Kaneko et al. (1976); Sharma (2006); Klis et al. (2014) | |
| Schizosaccharomyces pombe | Whole cell | 411 | 142 | 0.945 | 0.055 | 0.000 | 424 | 147 | Koukou et al. (1990) | |
| 403 | 143 | mean | ||||||||
| 8 | 2 | SE | ||||||||
| Debaryomyces hansenii | Plasma membrane | 398 | 137 | 0.913 | 0.087 | 0.000 | 418 | 146 | Kaneko et al. (1976); Turk et al. (2007) | |
| Dictyostelium discoideum | Plasma membrane | 414 | 145 | 0.980 | 0.020 | 0.000 | 418 | 147 | Weeks and Herring (1980) | |
| Dunaliella salina | Plasma membrane | 378 | 137 | 1.000 | 0.000 | 0.000 | 378 | 137 | Peeler et al. (1989); Azachi et al. (2002) | |
| Mus musculus , thymocytes | Plasma membrane | 409 | 142 | 0.921 | 0.000 | 0.079 | 418 | 145 | Van Blitterswijk et al. (1982) | |
| Saccharomyces cerevisiae | Plasma membrane | 358 | 129 | 0.949 | 0.035 | 0.026 | 375 | 135 | Longley et al. (1968); Zinser et al. (1991); Swan and Watson (1997); Tuller et al. (1999); Blagović et al. (2005) | |
| Schizosaccharomyces pombe | Plasma membrane | 411 | 142 | 0.856 | 0.052 | 0.092 | 433 | 151 | Koukou et al. (1990) | |
| Vigna radiata , seedling | Plasma membrane | 402 | 141 | 1.000 | 0.000 | 0.000 | 402 | 141 | Yoshida and Uemura (1986) | |
| 406 | 143 | mean | ||||||||
| 8 | 2 | SE | ||||||||
| Candida albicans | Mitochondrion | 344 | 125 | 0.710 | 0.164 | 0.126 | 411 | 150 | Goyal and Khuller (1992) | |
| Danio rerio , whole fish | Mitochondrion | 472 | 162 | 0.854 | 0.104 | 0.042 | 492 | 172 | Almaida-Pagán et al. (2014) | |
| Pichia pastoris | Mitochondrion | 421 | 145 | 0.944 | 0.054 | 0.002 | 433 | 150 | Wriessnegger et al. (2009); Klug et al. (2014) | |
| Rattus norwegicus , liver | Mitochondrion | 445 | 154 | 0.838 | 0.148 | 0.024 | 480 | 169 | Tahin et al. (1981); Colbeau et al. (1971) | |
| Saccharomyces cerevisiae | Mitochondrion | 312 | 116 | 0.897 | 0.097 | 0.006 | 345 | 128 | Tuller et al. (1999); Zinser et al. (1991); Blagović et al. (2005) | |
| Serripes groenlandicus , gill | Mitochondrion | 428 | 147 | 0.972 | 0.028 | 0.000 | 434 | 150 | Gillis and Ballantyne (1999) | |
| Sus scrofa , heart | Mitochondrion | 409 | 143 | 0.797 | 0.186 | 0.017 | 453 | 161 | Comte et al. (1976) | |
| Tetrahymena pyriformis | Mitochondrion | 402 | 144 | 0.812 | 0.131 | 0.057 | 439 | 159 | Gleason (1976); Nozawa (2011) | |
| 436 | 155 | mean | ||||||||
| 16 | 5 | SE | ||||||||
Download links
A two-part list of links to download the article, or parts of the article, in various formats.
Downloads (link to download the article as PDF)
Open citations (links to open the citations from this article in various online reference manager services)
Cite this article (links to download the citations from this article in formats compatible with various reference manager tools)
Membranes, energetics, and evolution across the prokaryote-eukaryote divide
eLife 6:e20437.
https://doi.org/10.7554/eLife.20437


