A complete toolset for the study of Ustilago bromivora and Brachypodium sp. as a fungal-temperate grass pathosystem
- Austrian Academy of Sciences, Vienna Biocenter, Austria
- Max Planck Institute for Terrestrial Microbiology, Germany
- Max Planck Institute for Plant Breeding Research, Germany
- Vienna Biocenter Core Facilities GmbH, Austria
- Leibniz-Institut für Pflanzengenetik und Kulturpflanzenforschung, Germany
- DOE Joint Genome Institute, United States
- INRA UMR BIOGER, AgroParisTech, Université Paris-Saclay, France
- Helmholtz Zentrum München, German Research Center for Environmental Health, Germany
- Technische Universität München, Germany
Figures
Figure 1 with 1 supplement

The life cycle of Ustilago bromivora.
U. bromivora spores germinate (A) and form a promycelium (B). Under high nutrient conditions, haploid yeast-like progeny (sporidia) are released and proliferate via budding (C). Under low nutrient conditions intratetrad mating occurs between two adjacent cells of a promycelium by formation of a loop-like mating structure that connects both cells (D). After plant penetration, fungal filaments grow mainly along the stem without triggering macroscopic symptoms (E) until flower development occurs. Upon flowering, macroscopic symptoms are detectable as black, smutted spikelets filled with fungal spores (F). Fungal cell walls and nuclei were stained with WGA-Alexa Fluor 488 and DAPI, respectively (A–D). Plant membranes were stained with FM4-64, fungal hyphae with WGA-Alexa Fluor 488 (E). Scale bars: 5 µm (A–D), 10 µm (E, right panel), or 1 cm (E, left panel) and (F).
Figure 1—figure supplement 1
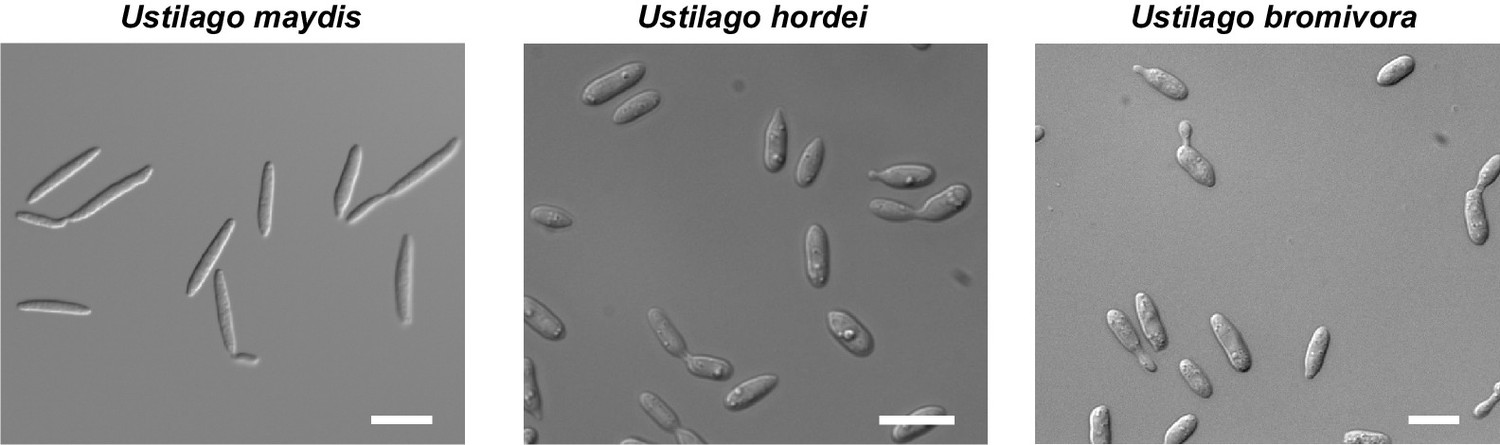
The morphology of U. bromivora sporidia is similar to U. hordei, but not to U. maydis.
U. bromivora UB1, U. hordei Uh4875-4, and U. maydis FB1 were grown in axenic culture to an exponential phase and pictures were acquired by widefield microscopy. Scale bars: 10 µm.
Figure 2
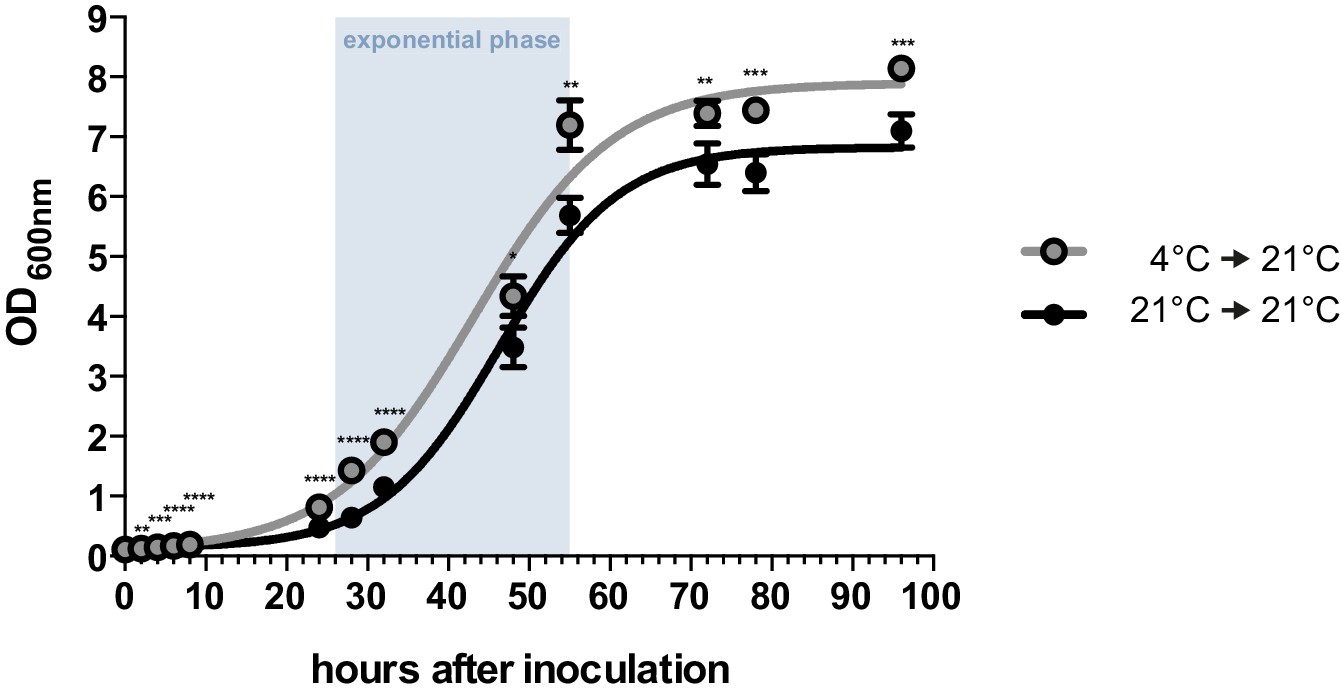
Axenic growth of U. bromivora.
Growth of U. bromivora UB1 was assessed by monitoring cell density spectrophotometrically at λ = 600 nm in liquid PD medium at 21°C in a time course of 96 hr. Growth was compared between axenic cultures inoculated from plate with cold-treated fungal cell material (24 hr at 4°C) or cell material that was kept at 21°C. Experiments were performed in 3 biological replicates. Significance between cell densities of cold-treated and non-treated cells at each time point was calculated by unpaired t test. **p<0.01, ***p<0.001, ****p<0.0001. The doubling time was calculated by taking the slope of a linear regression during exponential phase.
Figure 3
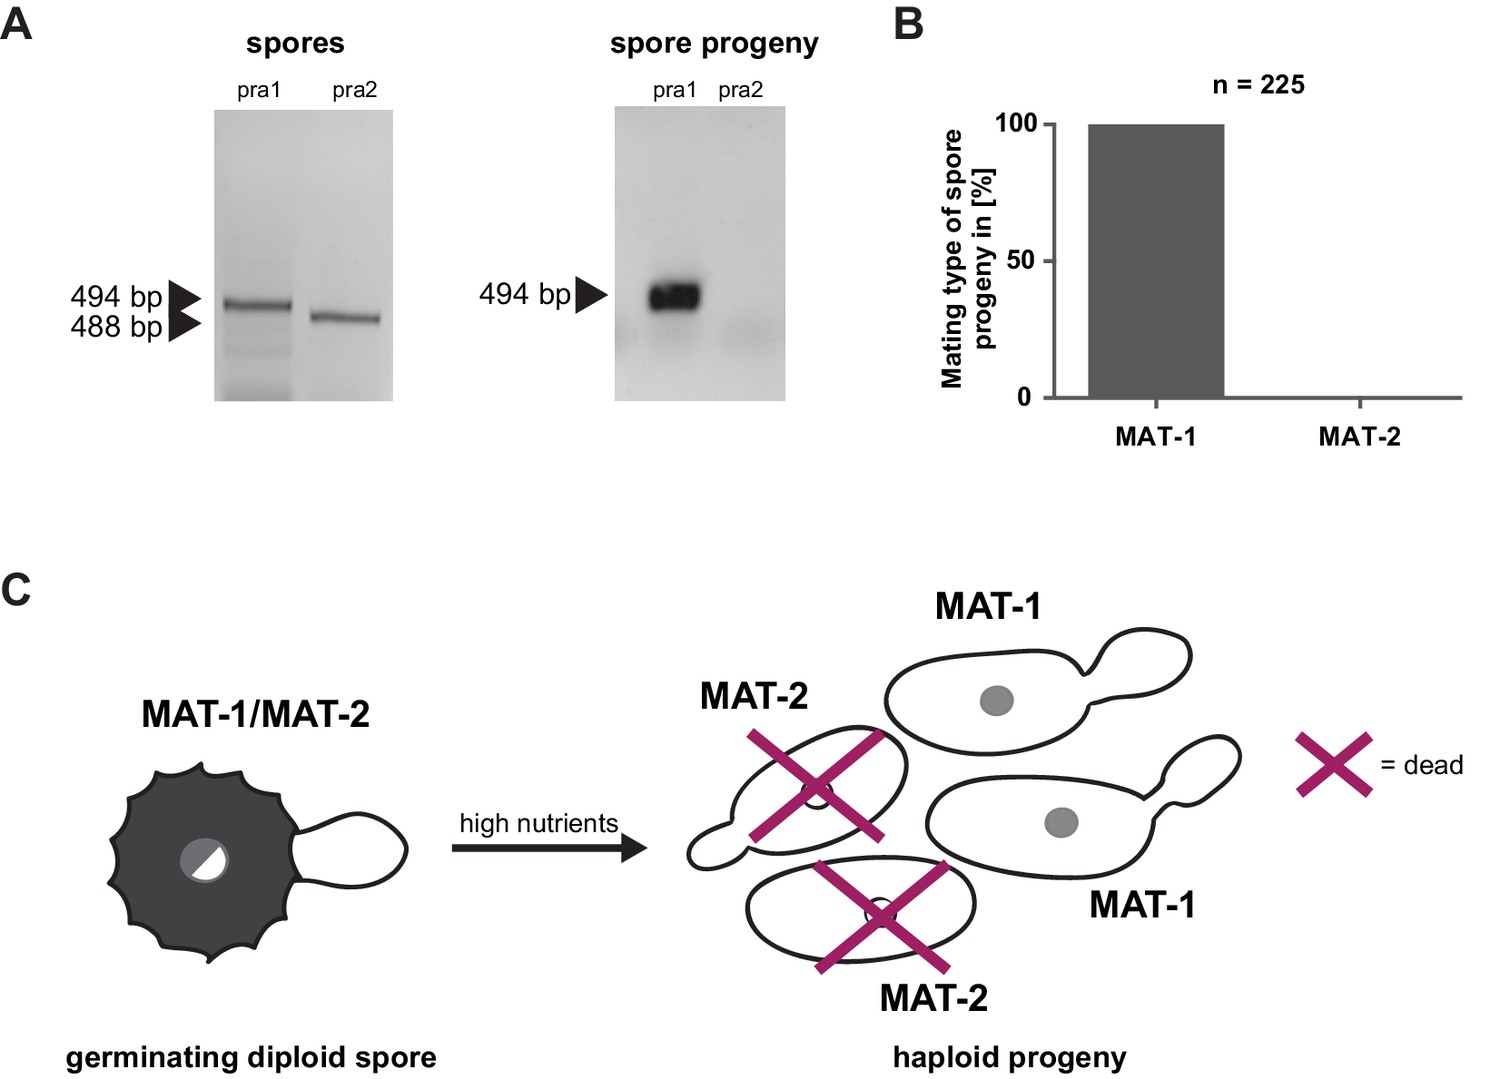
Mating type bias of U. bromivora.
(A) Diagnostic PCR on genomic DNA derived from spores and spore progeny to test for mating type 1 (MAT-1) or mating type 2 (MAT-2). To this end, primers targeting a conserved region of pheromone receptor alleles 1 (pra1) and 2 (pra2), adapted from Kellner et al. (2011), were used. Sizes of PCR products are indicated with arrow heads. Representative PCR results are shown. (B) Quantification of mating type alleles of 225 progeny derived from 21 spores by PCR as described in (A). (C) Schematic model illustrating the observed mating type bias phenomenon.
Figure 4
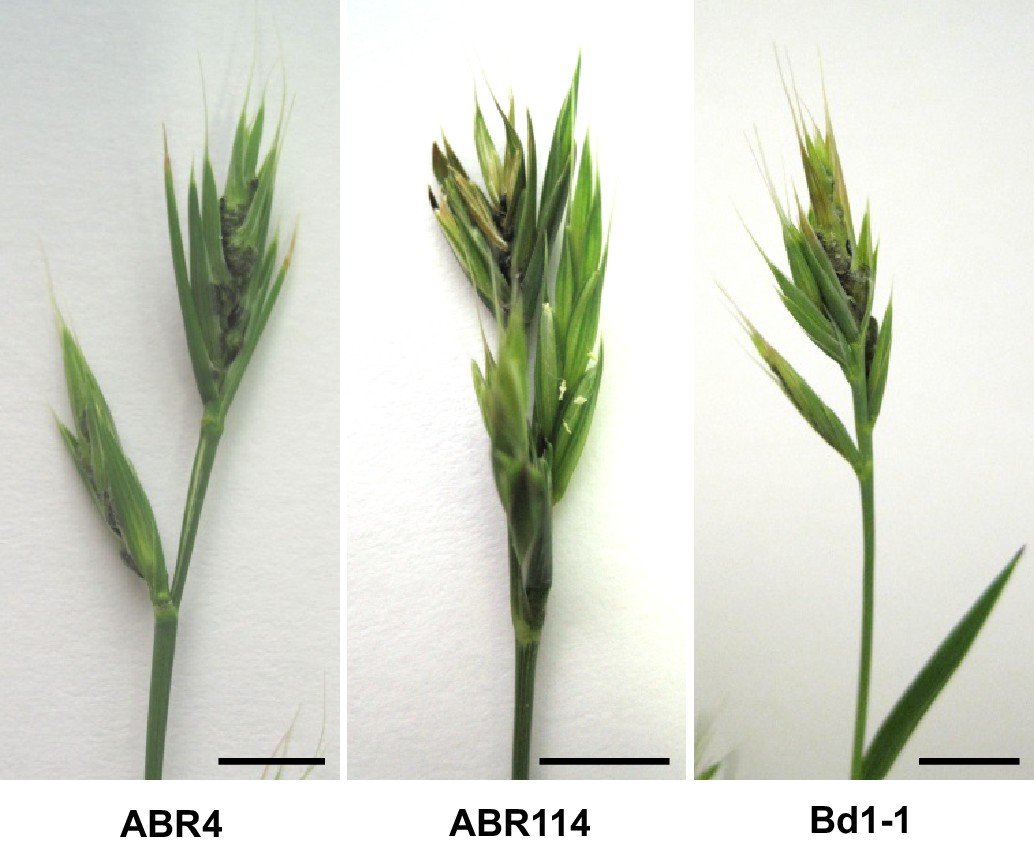
ABR4, ABR114, and Bd1-1 are susceptible to U. bromivora.
Representative pictures of infected ABR4, ABR114, and Bd1–1 spikelets. Sequenced B. distachyon accessions ABR4 and Bd1-1 as well as the sequenced B. stacei accession ABR114 were inoculated with U. bromivora spore material and screened for infection symptoms. Upon flowering macroscopic infection symptoms could be observed as spore-filled spikelets. This figure relates to Table 1. Scale bars: 1 cm.
Figure 5 with 3 supplements
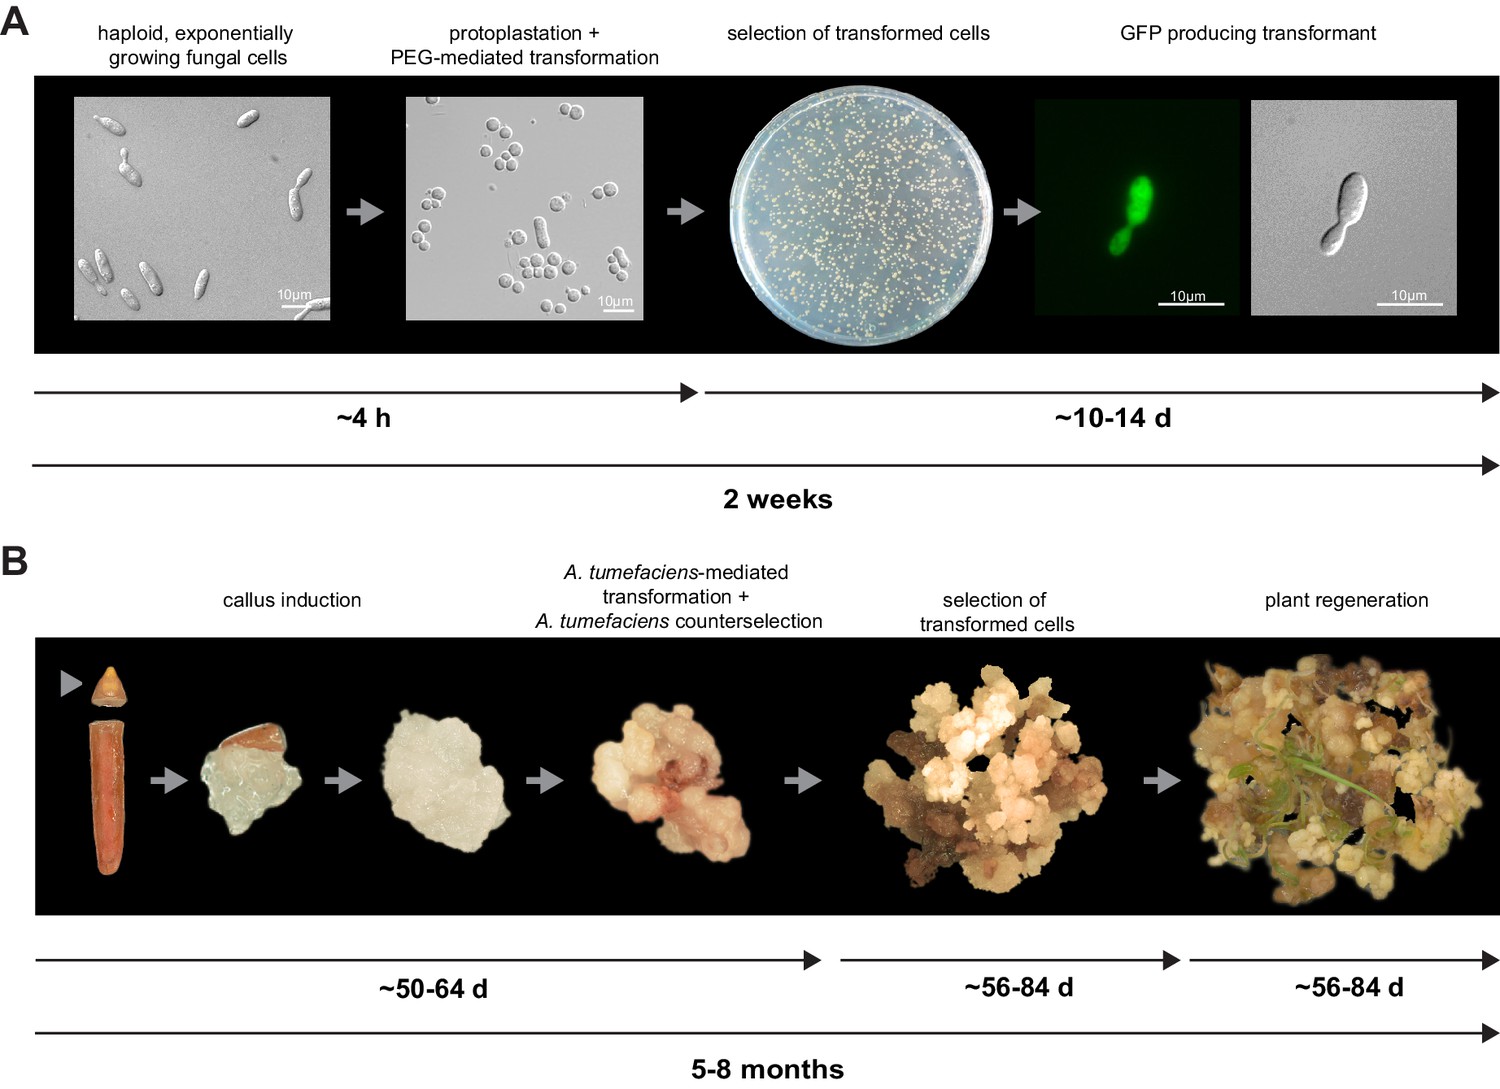
Establishment of transformation for the fungal pathogen U. bromivora and its host plant B. hybridum Bd28.
(A) Schematic representation and timeline of protoplastation and transformation of U. bromivora UB1 with the autonomously replicating pNEBuC-GFP plasmid conferring Carboxin resistance and encoding GFP. (B) Schematic representation and timeline of A. tumefaciens-mediated transformation of B. hybridum Bd28. Illustrations are not to scale.
Figure 5—figure supplement 1
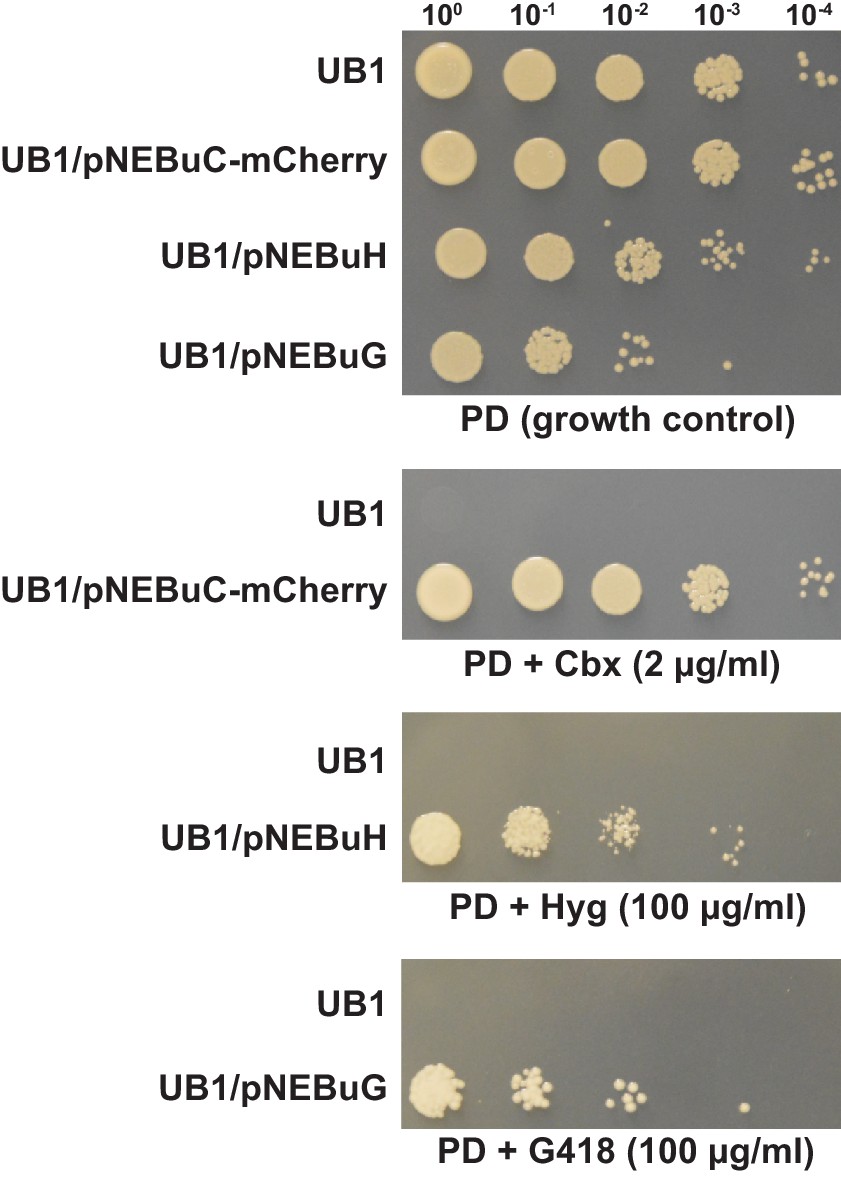
Several resistance markers can be employed for selection of U. bromivora transformants.
UB1 and transformants derived from this strain harboring autonomously replicating plasmids with genes known to confer resistance to Carboxin (Cbx), Hygromycin B (Hyg) or Geneticin G418 (G418) were spotted in serial dilutions on PD without and with the respective antibiotic. Antibiotic concentrations are indicated.
Figure 5—figure supplement 2
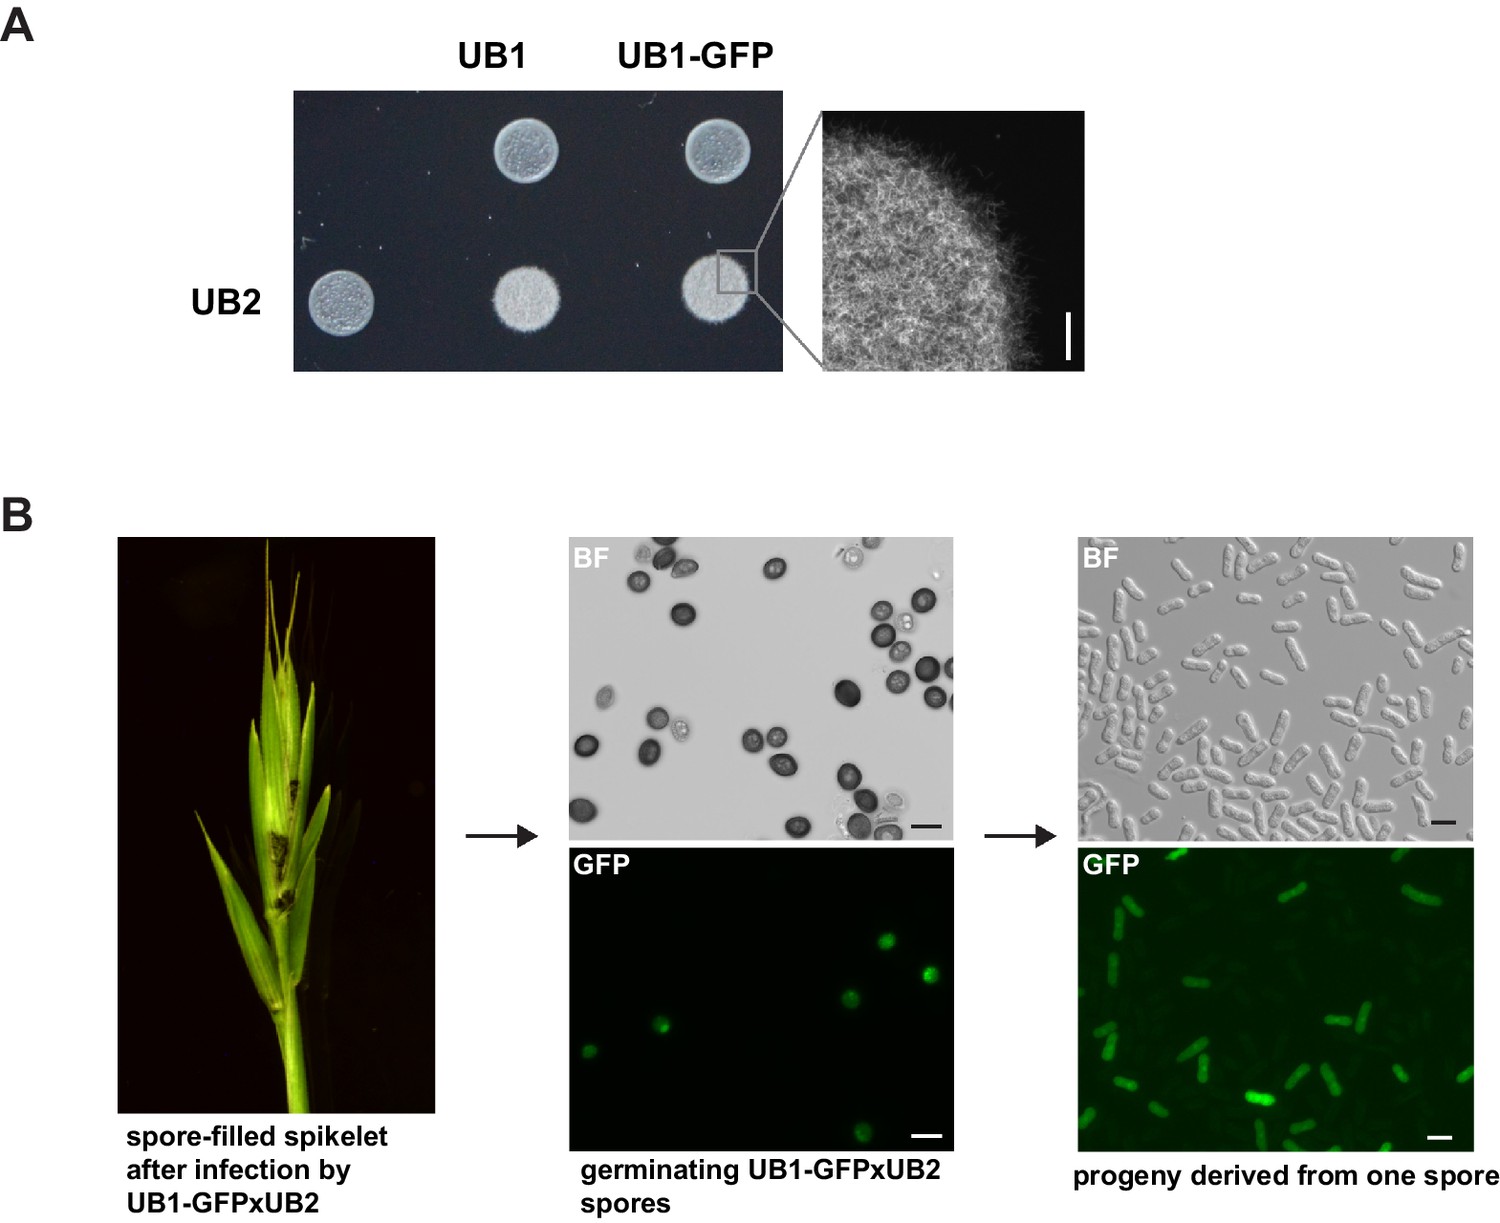
UB2 can mate with UB1-GFP, form filaments, and produce viable spores.
(A) UB2, UB1, and UB1-GFP were grown in PD to an exponential phase (OD600 nm = 0.8) and resuspended in H2Odd to an OD600 nm = 2. Strains were spotted individually and as mixture on charcoal-containing PD medium. White, fuzzy colonies on charcoal-containing medium indicate mating and the formation of filaments. Scale bar: 0.5 mm. (B) Viable spores are produced by UB1-GFP and UB2. Germinating Bd28 caryopses were inoculated with an 1:1 mixture of UB1-GFP and UB2. Upon flower development, plants showed macroscopic symptoms typical for U. bromivora infections. Retrieved spores germinated and produced viable GFP-fluorescent and non-fluorescent progeny.
Figure 5—figure supplement 3
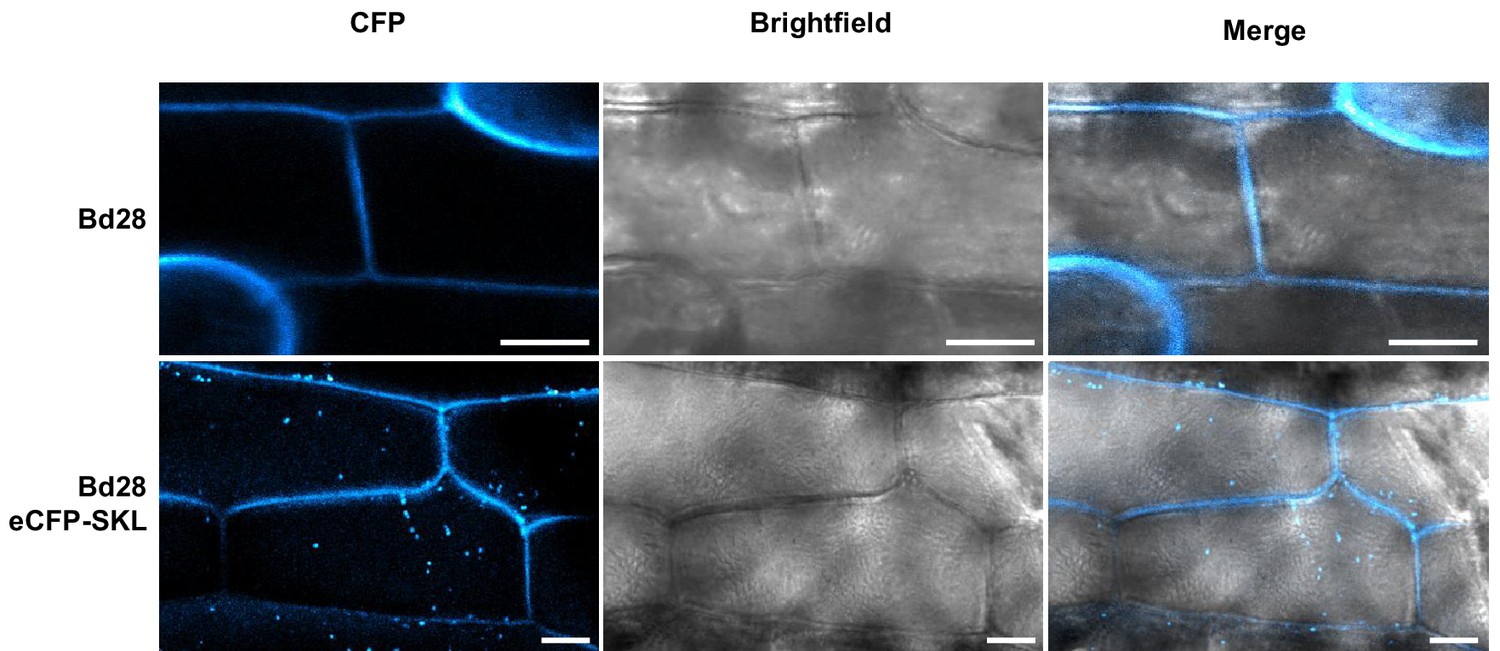
Microscopy of transgenic Bd28 eCFP-SKL marker line.
Confocal laser scanning microscopy of leaf epidermis from a transgenic Bd28 line that stably produces eCFP-SKL as peroxisome marker protein. Upper panel shows wild type Bd28 displaying cell wall autofluorescence at 405 nm excitation and 455 nm emission. Lower panel shows transgenic Bd28-eCFP-SKL line. By employing identical settings, specific eCFP marked peroxisomes could be detected in the cytoplasm of epidermal cells in addition to cell wall autofluorescence. Scale bars: 10 µm.
Figure 6
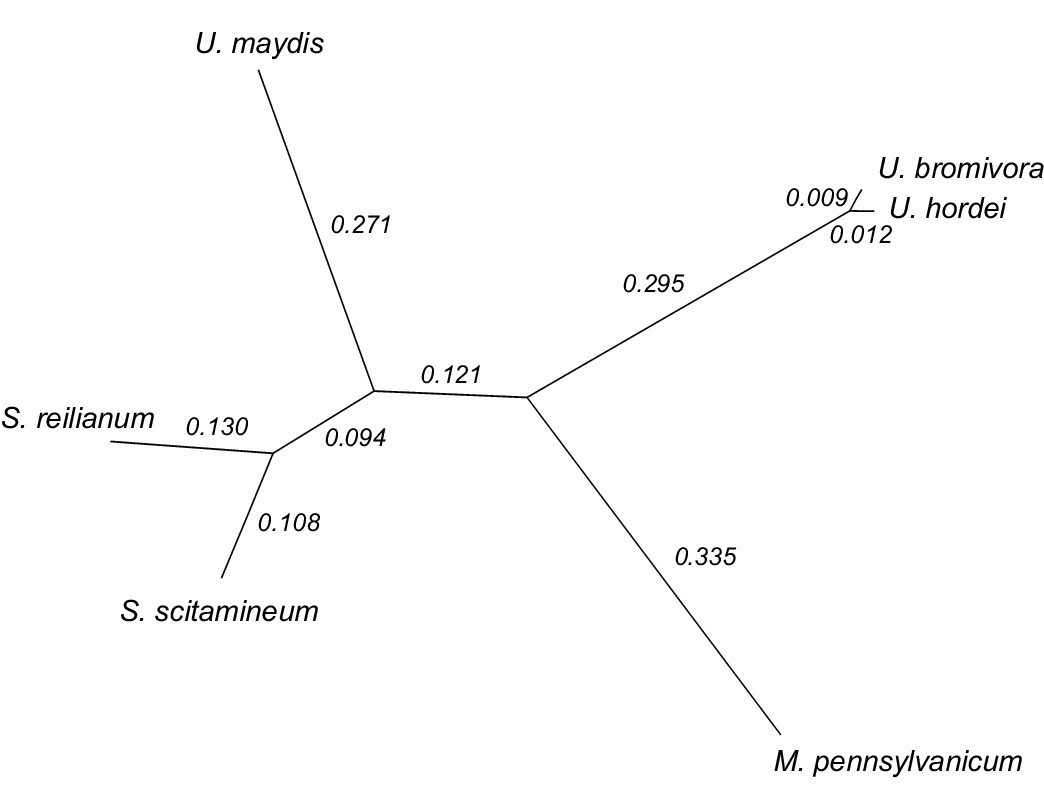
Phylogeny of U. bromivora and related smuts.
Unrooted phylogeny created from 4,947 one-to-one orthologs. Branch lengths represent the mean number of substitutions per DNA site. Terminal branch lengths for U. bromivora and U. hordei are not to scale.
Figure 7 with 2 supplements
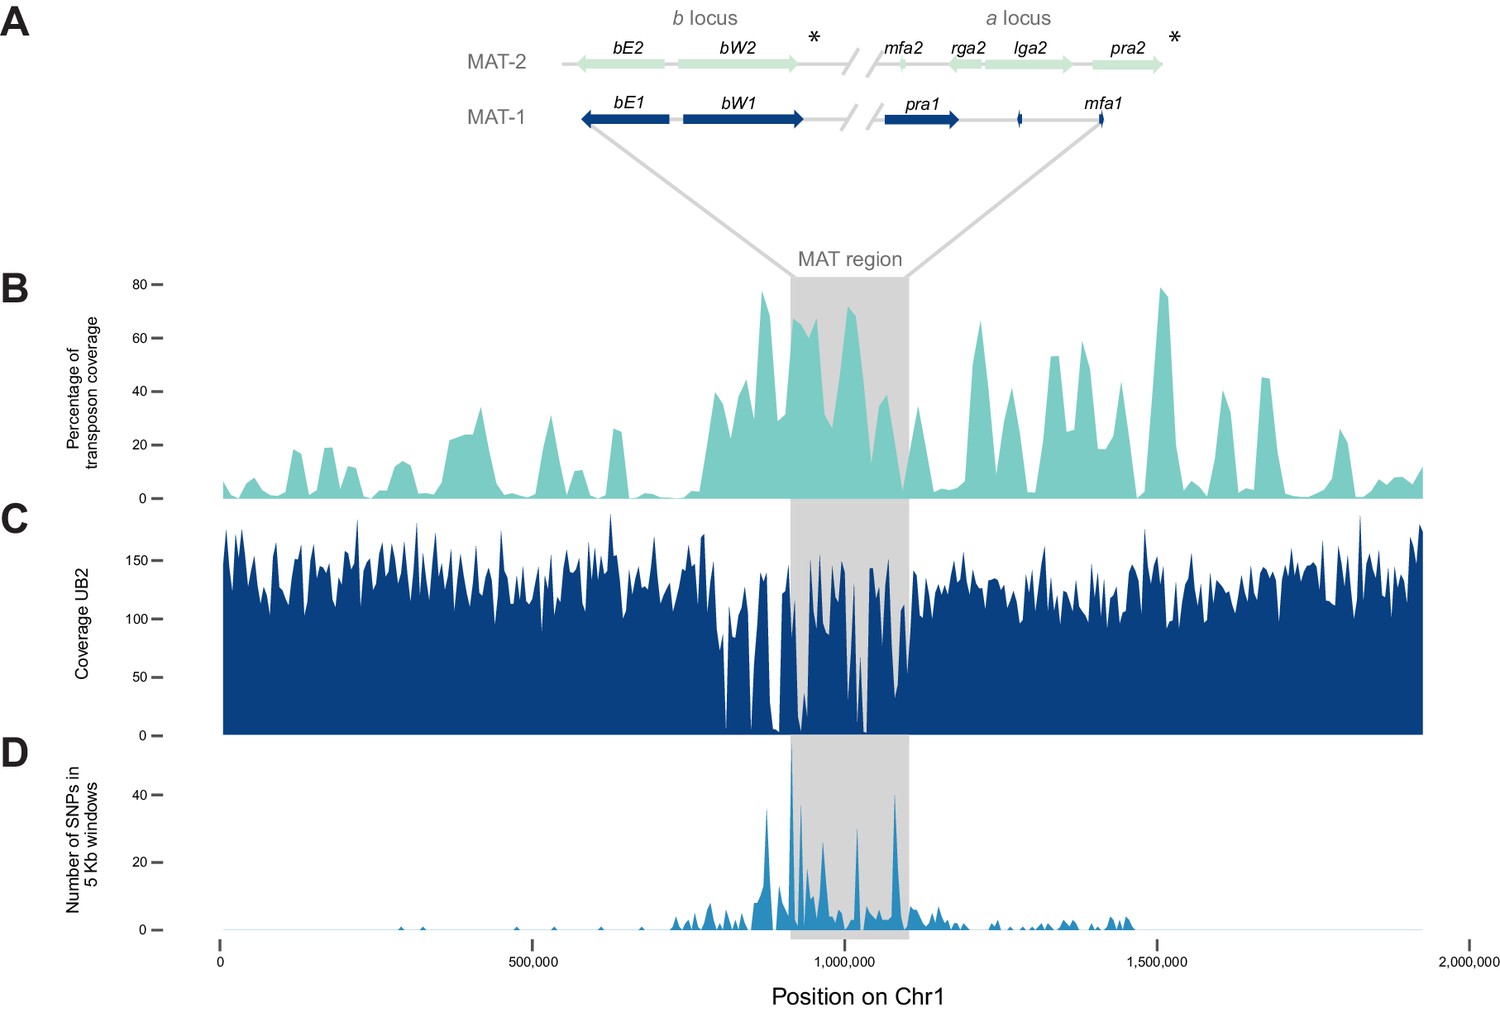
The mating type chromosome (chromosome 1) of U. bromivora UB1 (MAT-1) and UB2 (MAT-2).
(A) Schematic representation of the a locus (encoding the predicted pheromone receptor system) and the b locus (encoding the putative heterodimeric transcription factor for pathogenic development) of UB1 (MAT-1 strain) and UB2 (MAT-2 strain) according to de novo assembly of both strains. Potential rga2 and lga2 orthologs, encoding proteins for uniparental mitochondrial inheritance (Fedler et al., 2009), are located in the a2 region between mfa2 and pra2. *Due to rearrangements in the mating type region of UB2, the orientation of a2 and b2 locus could not be exactly determined. However, data suggest an inversion of the a2 locus. (B) The mating type region of UB1 is enriched for transposable elements. Graph depicts percentage of transposon coverage in 25 kb windows occurring every 12.5 kb along the chromosome. (C) Mapping of UB2 to the UB1 reference genome shows large non-mapped stretches in the MAT-1 locus indicating sequence differences in this region between MAT-1 and MAT-2. (D) Enrichment of single nucleotide polymorphisms (SNPs) in and around the mating type region between the genomes of UB1 and UB2. Number of SNPs is shown in 5 kb windows.
-
Figure 7—source data 1
List of Single Nucleotide Polymorphisms (SNPs) identified in UB2.
- https://doi.org/10.7554/eLife.20522.018
Figure 7—figure supplement 1
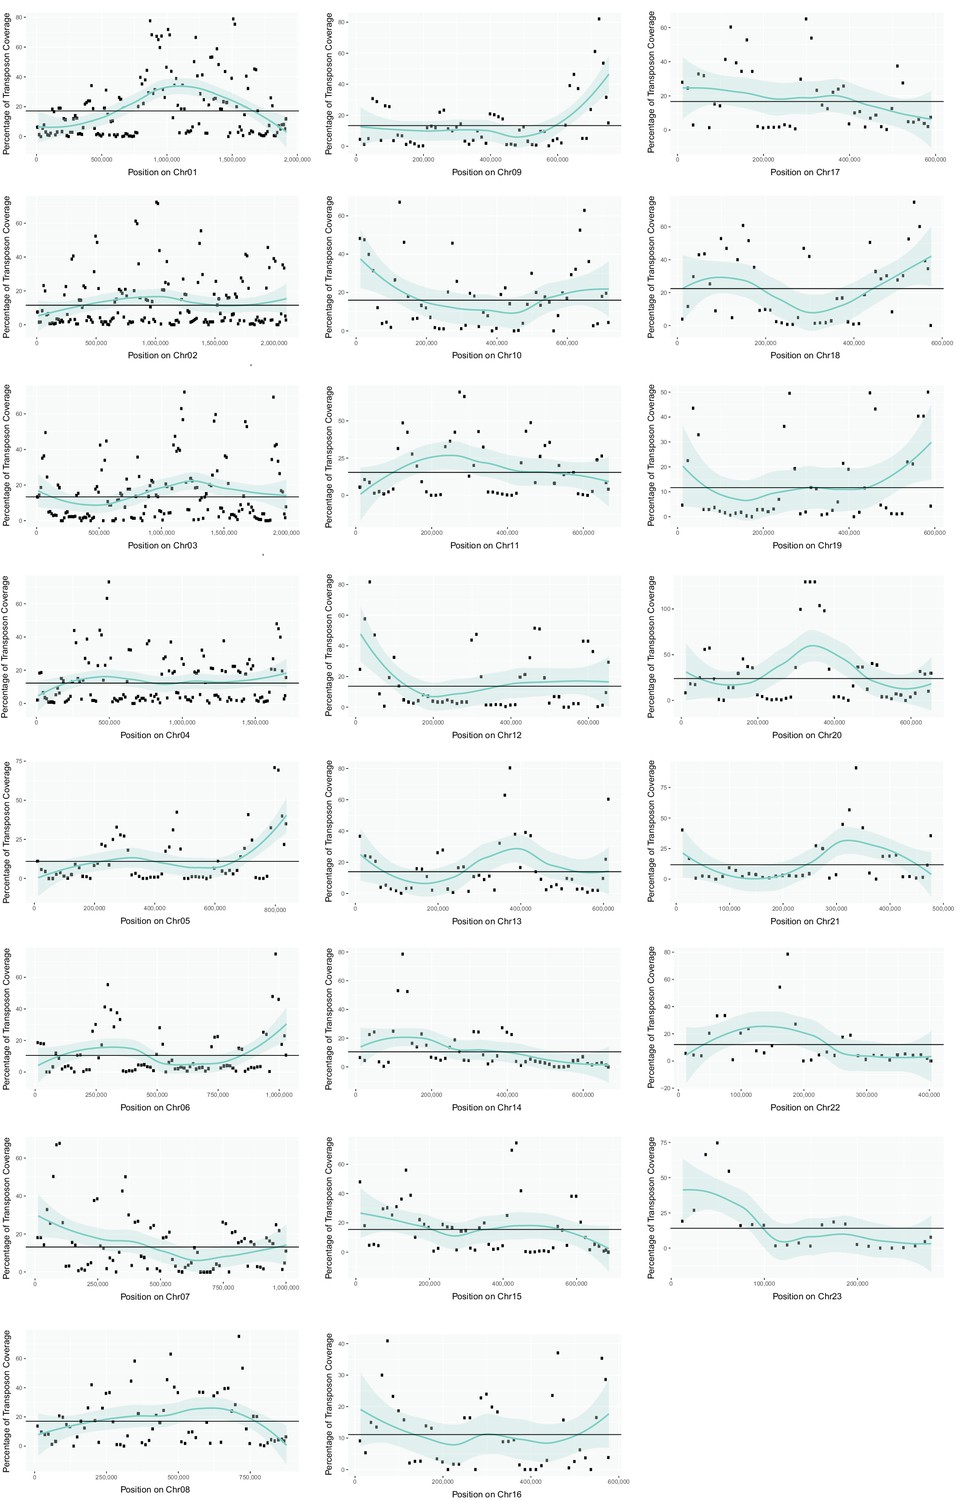
Transposon content along U. bromivora chromosomes.
The percentage length of transposons in 25 kb windows occurring every 12.5 kb along the chromosome is shown. The horizontal line shows the mean percentage of the length made up by transposons across the entire chromosome. The green line shows a loess regression with the shaded area representing the confidence interval at the 0.95 level.
Figure 7—figure supplement 2
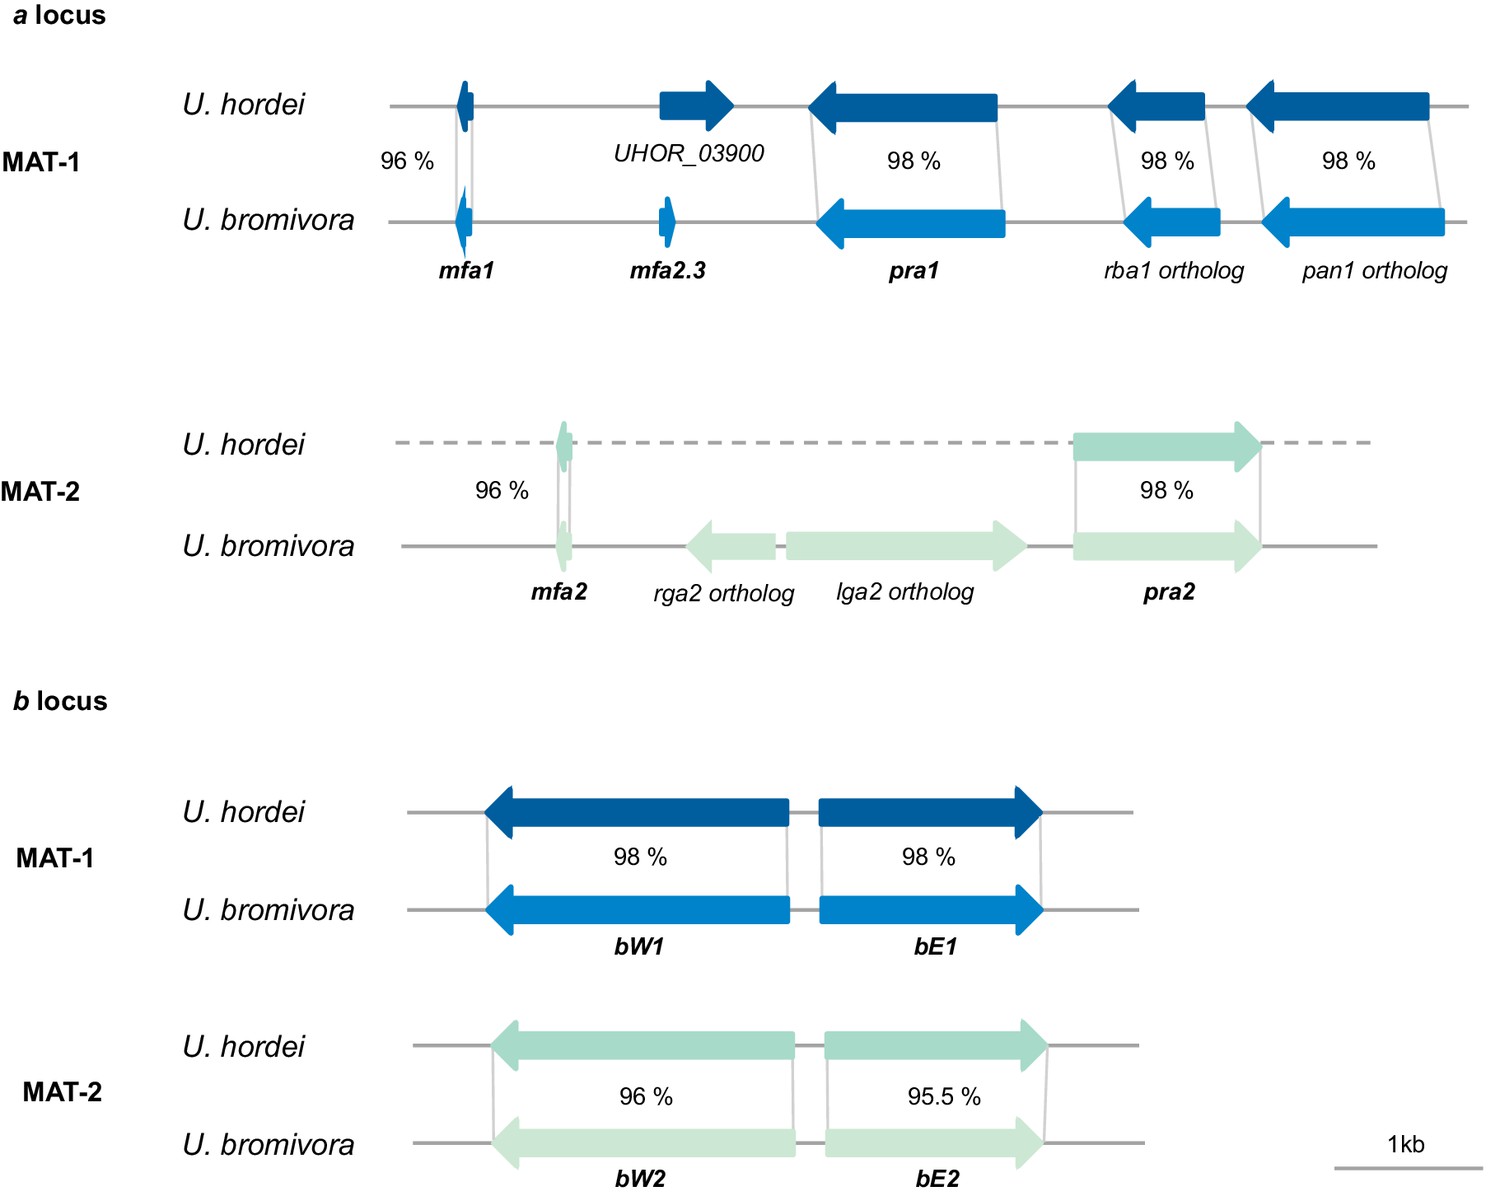
Genes of the mating type regions are up to 98% identical between U. bromivora and U. hordei.
Genes of the a (pheromone/receptor) locus and the b (heterodimeric transcription factor) locus were bioinformatically identified in U. bromivora UB1 (MAT-1) and UB2 (MAT-2) and compared to respective orthologs of U. hordei. DNA-Sequence identity of two orthologs is shown between each orthologous pair in percent.
Figure 8 with 1 supplement
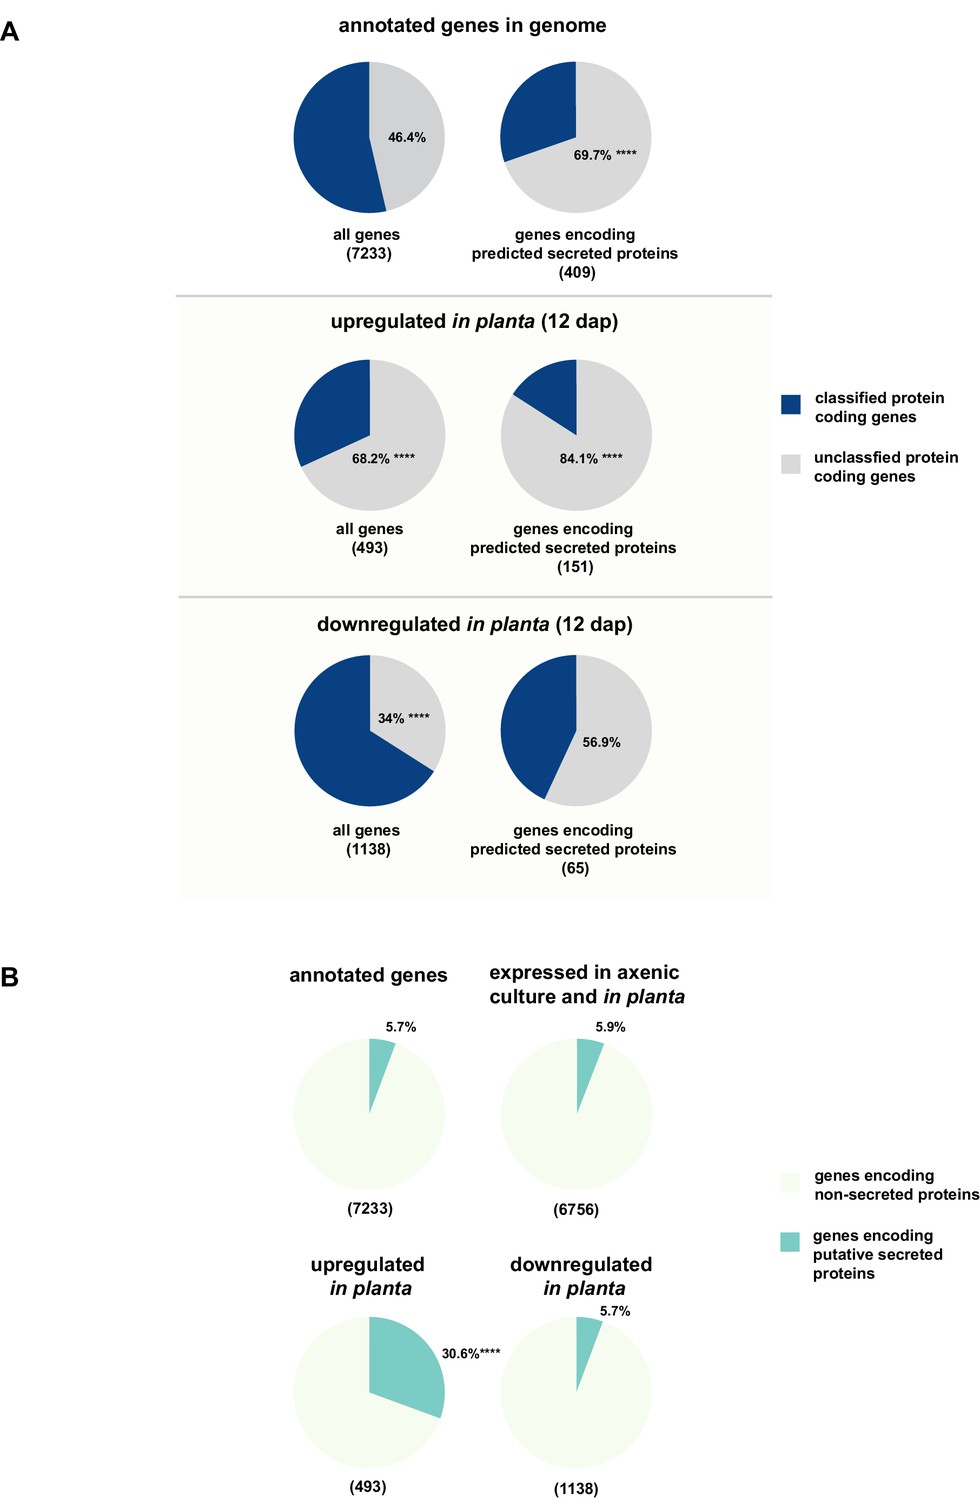
Enrichment of classes of interest among predicted secreted proteins and in planta differentially expressed transcripts.
(A) Proportions of genes encoding unclassified proteins based on FunCat classification within all annotated U. bromivora genes, within genes encoding secreted proteins, within all genes up- and downregulated in planta twelve days after planting (dap) as well as within the genes that are differentially regulated and encode secreted proteins. (B) Proportions of genes encoding predicted secreted proteins within all annotated U. bromivora genes, within all genes found to be expressed in axenic culture and in planta, and within genes significantly up- or downregulated in planta. Fisher exact test was used to test whether the proportion of selected genes within a given class differs significantly from the proportion within all annotated genes; ****p-value < 0.0001, ***p-value < 0.001. The total number of genes is shown in brackets below each chart.
Figure 8—figure supplement 1
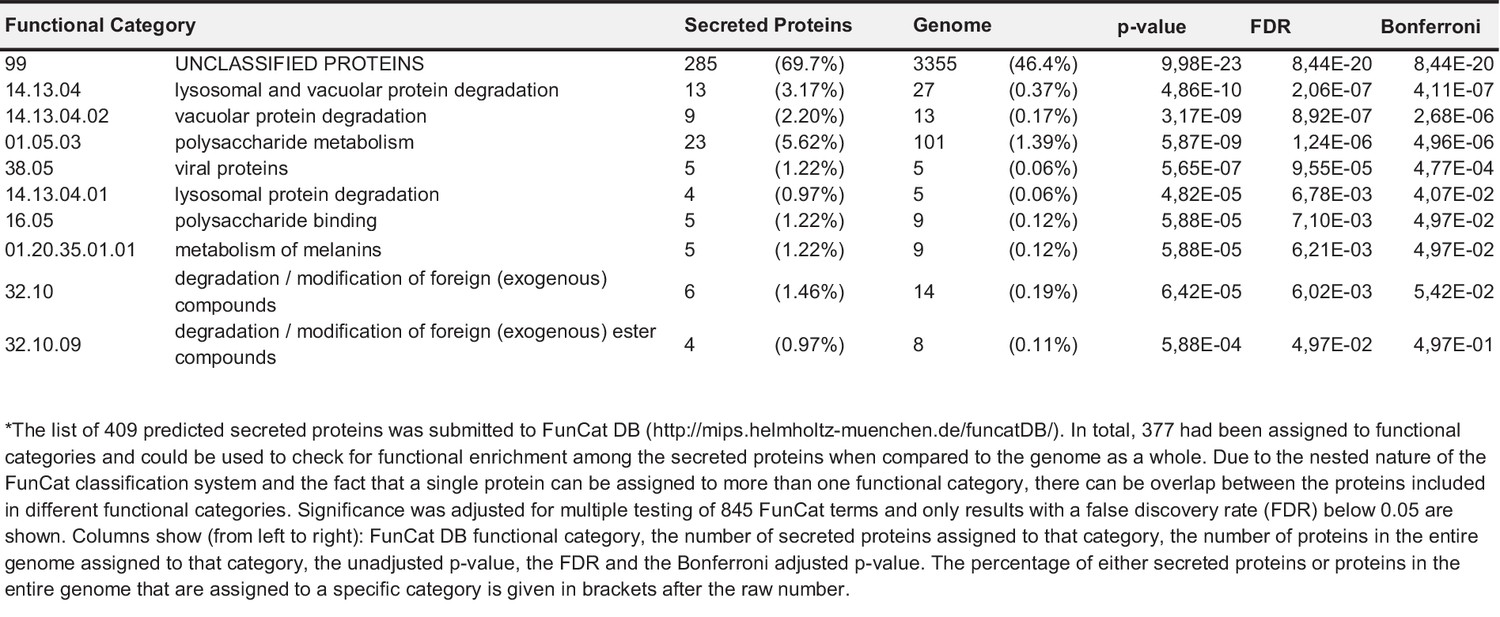
Functional categorization of putatively secreted proteins and all proteins encoded in the genome.
https://doi.org/10.7554/eLife.20522.022
Figure 9
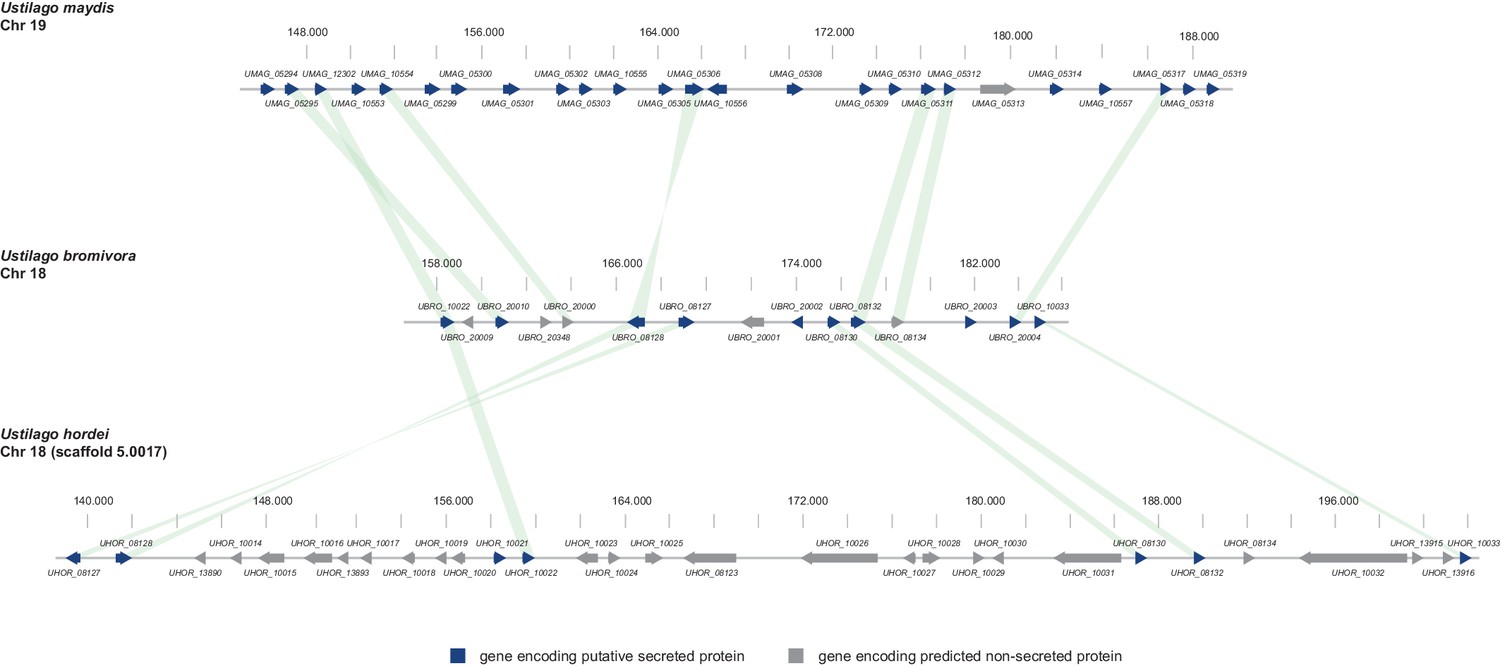
Gene by gene comparison between the largest secreted virulence cluster of U. maydis (cluster 19) with the corresponding region in the U. bromivora and U. hordei genome on chromosome 18.
The scheme depicts U. maydis cluster 19 on chromosome 19, the predicted U. bromivora cluster 18 on chromosome 18 and the corresponding region on chromosome 18 (scaffold 5.0017) of U. hordei. Syntenic orthologs between U. maydis and U. bromivora as well as between U. bromivora and U. hordei are connected with a green bar. Genes encoding predicted non-secreted proteins are displayed in grey, genes encoding putative secreted proteins in blue.
Figure 10
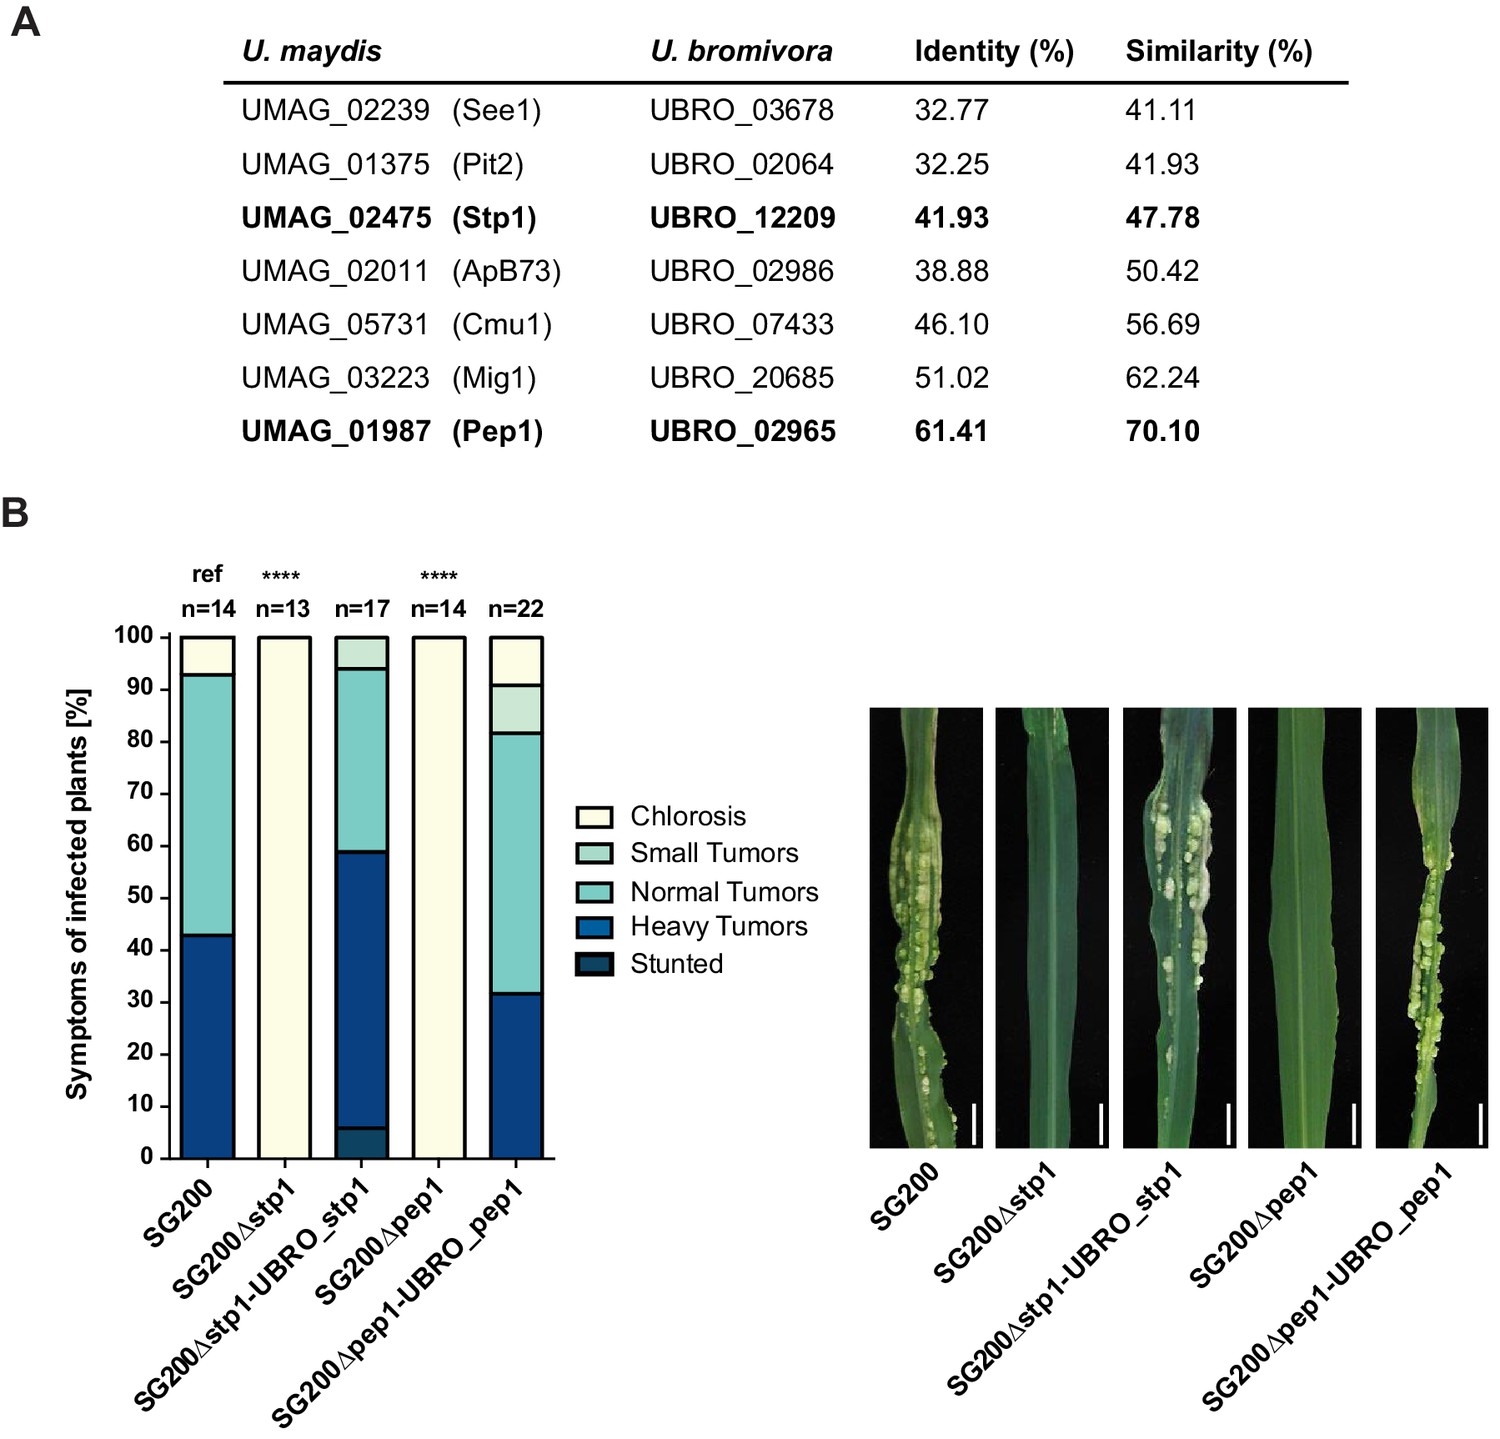
Testing orthologs of core effectors for functional interchangeability between U. bromivora and U. maydis.
(A) List of known effector orthologs in U. bromivora and U. maydis and their amino acid identity and similarity. Identity shows the percentage of identical positions in the alignment, taking gaps into account. Percentage identity = 100 (identical positions / length of alignment). Similarity gives a measure of how similar two protein sequences are to one another based on the physical and chemical properties of their amino acids. Sequences were aligned using T-Coffee and identity and similarity scores were given by SIAS (Sequence Identity and Similarity; http://imed.med.ucm.es/Tools/sias.html). (B) Core-effector mutants of U. maydis (SG200∆stp1 and SG200∆pep1) can be complemented with the respective U. bromivora ortholog. Disease symptoms of infected plants were scored at twelve days post inoculation (dpi) according to Kämper et al., 2006. The darker the color, the more severe the symptoms. Numbers of infected plants are indicated above each column. p-values are calculated by Fisher exact test, MTC by Benjamini-Hochberg algorithm, ****p<0.0001. Leaves of representative plants twelve days after inoculation with indicated strains are shown next to the stacked bar plot. Scale bars: 1 cm.
Figure 11
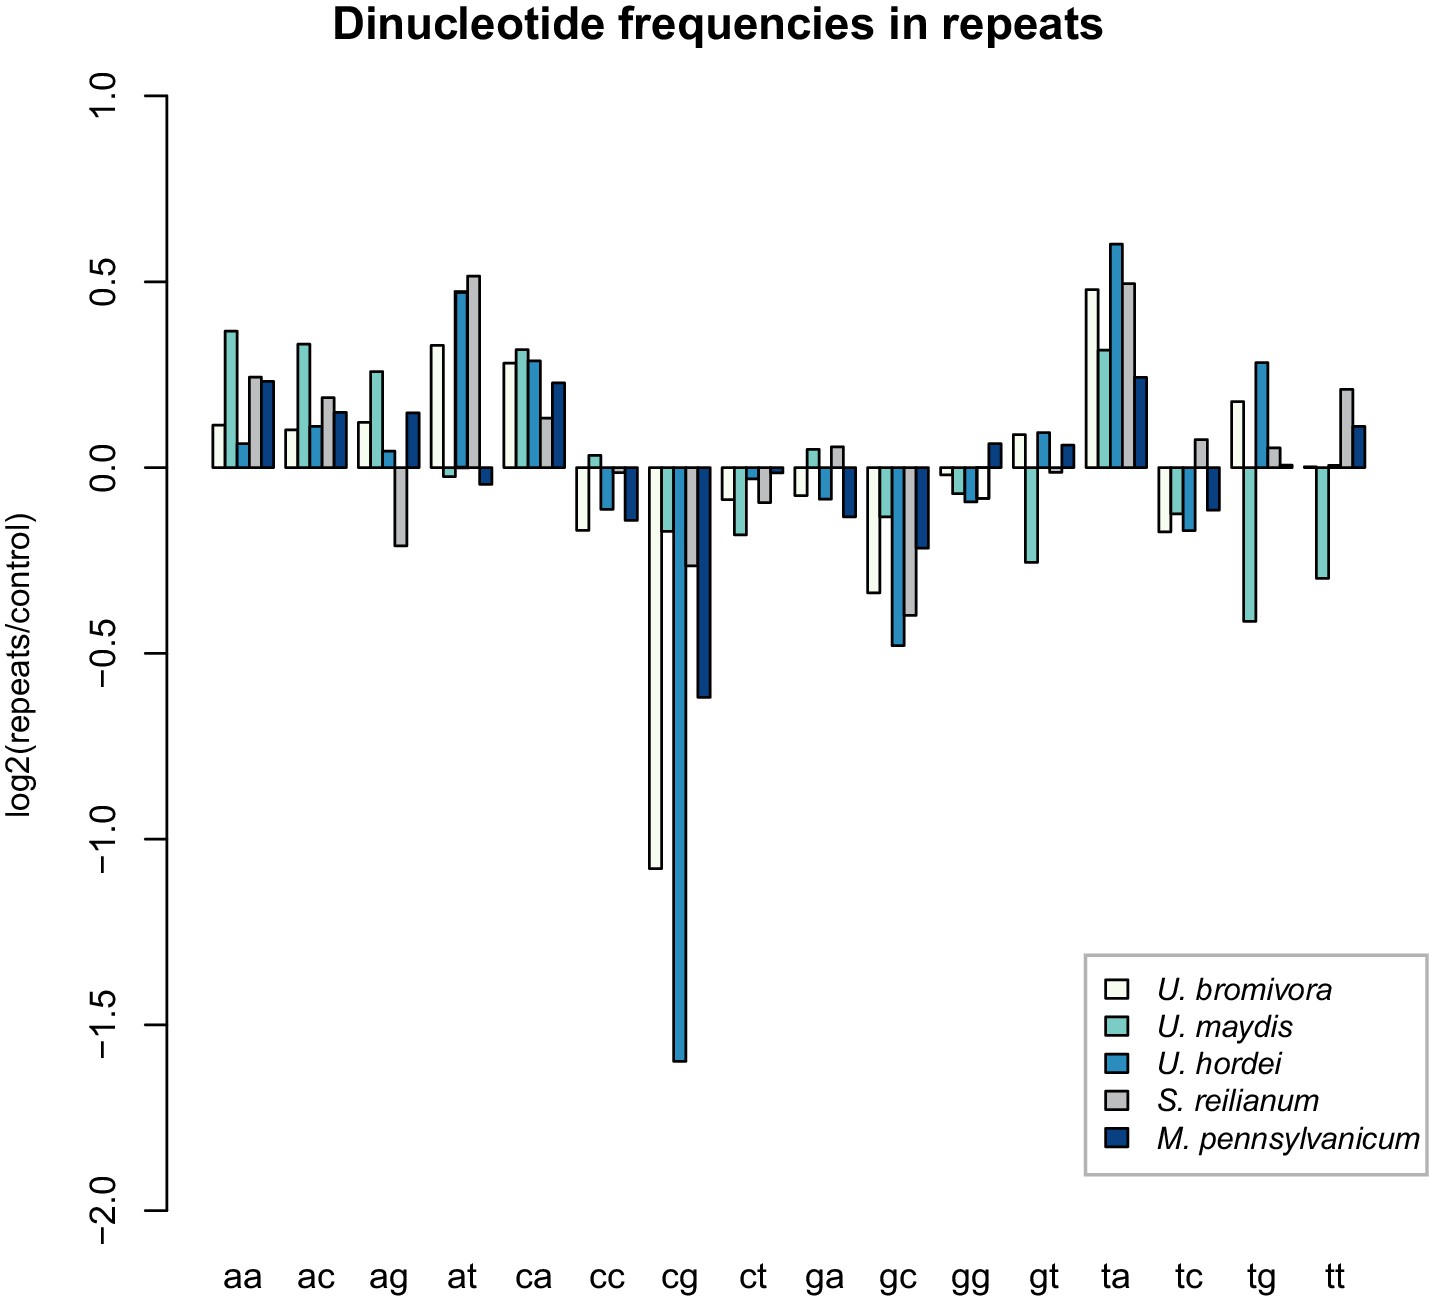
U. bromivora shows a decrease in the occurrence of CpG dinucleotides.
Dinucleotide frequencies in repeat regions were determined using RIPCAL and were compared to those of control regions. A noticeable decrease in the occurrence of CpG dinucleotides was detectable for both U. hordei and U. bromivora as well as, to a lesser extent, M. pennsylvanicum.
Videos
Video 1
Spore germination under high nutrient conditions (PD agar).
https://doi.org/10.7554/eLife.20522.005
Video 2
Spore germination under low nutrient conditions (water agar).
https://doi.org/10.7554/eLife.20522.008Tables
Table 1
Tested Brachypodium accessions for U. bromivora susceptibility/resistance.
Name | Species | Sequenced | Susceptible to U. bromivora | Accession number | Source | Country of origin | |
|---|---|---|---|---|---|---|---|
ABR3 | B. distachyon | Y | N (2x)* | ABY-Bs 5088 | Brachyomics collections (C. Stace and P. Catalán), Aberystwyth, UK | Spain | |
ABR4 | B. distachyon | Y | Y (many) | ABY-Bs 5089 | Brachyomics collections (C. Stace and P. Catalán), Aberystwyth, UK | Spain | |
ABR6 | B. distachyon | Y | N (2x)* | ABY-Bs 5091 | Brachyomics collections (C. Stace and P. Catalán), Aberystwyth, UK | Spain | |
ABR7 | B. distachyon | Y | N (2x)* | ABY-Bs 5092 | Brachyomics collections (C. Stace and P. Catalán), Aberystwyth, UK | Spain | |
ABR9 | B. distachyon | Y | N | - | unknown | Croatia | |
Adi-10 | B. distachyon | Y | N | W6 39243 | USDA-ARS-WRPIS; Vogel et al. (2009) | Turkey | |
Adi-12 | B. distachyon | Y | N | W6 39245 | USDA-ARS-WRPIS; Vogel et al. (2009) | Turkey | |
Adi-2 | B. distachyon | Y | N | W6 39235 | USDA-ARS-WRPIS; Vogel et al. (2009) | Turkey | |
Bd1-1 | B. distachyon | Y | Y | PI 170218 / W6 46201 | GRIN Germplasm; Vogel et al. (2006) | Turkey | |
Bd18-1 | B. distachyon | Y | N | PI 245730 / W6 46204 | USDA-ARS-WRPIS; Vogel et al. (2006) | Turkey | |
Bd21 | B. distachyon | Y | N | PI 254867 / W6 36678 | GRIN Germplasm; Vogel et al. (2006) | Iraq | |
Bd21-3 | B. distachyon | Y | N | W6 39233 | GRIN Germplasm; Vogel and Hill (2008) | Iraq | |
Bd2-3 | B. distachyon | Y | N | PI 185133 / W6 46202 | Iraq | ||
Bd3-1 | B. distachyon | Y | N (2x)* | PI 185134 / W6 46203 | USDA-ARS-WRPIS; Vogel et al. (2006) | Iraq | |
BdTR10C | B. distachyon | Y | N | W6 39406 | USDA-ARS-WRPIS | Turkey | |
BdTR11I | B. distachyon | Y | N | W6 39426 | USDA-ARS-WRPIS; Filiz et al. (2009) | Turkey | |
BdTR13a | B. distachyon | Y | N | W6 39430 | USDA-ARS-WRPIS; Filiz et al. (2009) | Turkey | |
BdTR13C | B. distachyon | Y | N | W6 39432 | USDA-ARS-WRPIS; Filiz et al. (2009) | Turkey | |
BdTR1I | B. distachyon | Y | N | W6 39308 | USDA-ARS-WRPIS; Filiz et al. (2009) | Turkey | |
BdTR2B | B. distachyon | Y | N | W6 39314 | USDA-ARS-WRPIS; Filiz et al. (2009) | Turkey | |
BdTR2G | B. distachyon | Y | N | W6 39319 | USDA-ARS-WRPIS; Filiz et al. (2009) | Turkey | |
BdTR3C | B. distachyon | Y | N | W6 39332 | USDA-ARS-WRPIS; Filiz et al. (2009) | Turkey | |
BdTR5I | B. distachyon | Y | N | W6 39366 | USDA-ARS-WRPIS; Filiz et al. (2009) | Turkey | |
Foz1 | B. distachyon | Y | N | - | Spain | ||
Gaz8 | B. distachyon | Y | N | W6 39269 | USDA-ARS-WRPIS; Vogel et al. (2009) | Turkey | |
Kah1 | B. distachyon | Y | N | W6 39278 | USDA-ARS-WRPIS; Vogel et al. (2009) | Turkey | |
Koz1 | B. distachyon | Y | N | W6 39284 | USDA-ARS-WRPIS; Vogel et al. (2009) | Turkey | |
Mur1 | B. distachyon | Y | N | - | Spain | ||
S8iiC | B. distachyon | Y | N | - | Ana Caicedo Lab, University of Massachusetts | Spain | |
ABR114 | B. stacei | Y | Y (2x)* | - | unknown | Spain | |
ABR113 | B. hybridum | Y | N | - | unknown | Portugal | |
ABR117, Bd117, Bd6 | B. hybridum | N | Y (2x)* | PI - 219965 | GRIN Germplasm | Afghanistan | |
Bal-P7 | B. hybridum | N | Y (2x)* | W6 - 39259 | GRIN Germplasm | Turkey | |
Bd23 | B. hybridum | N | Y (2x)* | PI - 287783 | GRIN Germplasm | Spain | |
Bd26 | B. hybridum | N | Y (2x)* | PI - 372187 | GRIN Germplasm | Uruguay | |
Bd28 | B. hybridum | N | Y (many)* | PI - 533015 | GRIN Germplasm | Australia | |
Bd4 | B. hybridum | N | Y (2x)* | PI - 208216 | GRIN Germplasm | South Africa | |
Bd8 | B. hybridum | N | Y (2x)* | PI - 219971 | GRIN Germplasm | Afghanistan | |
Isk-P4 | B. hybridum | N | Y (2x)* | W6 - 39273 | GRIN Germplasm | Turkey |
-
Y = yes, N = no; * = times tested
Table 2
Genome comparison of sequenced smut fungi.
U. bromivora | U. maydis1 | S. reilianum2 | S. scitamineum3 | U. hordei4 | M. pennsylvanicum5 | |
|---|---|---|---|---|---|---|
Assembly statistics | ||||||
Total contig length (Mb) | 19.7 | 18.2 | 19.5 | 20.6 | 19.2 | |
Total scaffold length (Mb) | 20.5 | 19.8 | 18.4 | 19.6 | 21.15 | 19.2 |
Average base coverage | 154x | 10x | 20x | 30x | 25x | 339x |
N50 contig (kb) | 127.4 | 50.3 | 37.6 | 48.7 | 43.4 | |
N50 scaffold (kb) | 877 | 817.8 | 738.5 | 759.2 | 307.7 | 121.7 |
Chromosomes | 23 | 23 | 23 | 23 | ||
GC-content (%) | 52.4 | 54 | 59.7 | 54.4 | 52 | 50.9 |
coding (%) | 54.4 | 56.3 | 62.6 | 57.8 | 54.3 | 54 |
non-coding (%) | 49.4 | 50.5 | 54.3 | 51.1 | 43.4 | 46.9 |
Coding sequence | ||||||
Percent coding (%) | 59.8 | 61.1 | 65.9 | 62 | 57.5 | 56.6 |
Average gene size (bp) | 1699 | 1836 | 1858 | 1819 | 1705 | 1734 |
Average gene density (gene/kb) | 0.35 | 0.34 | 0.36 | 0.34 | 0.33 | 0.33 |
Protein-coding genes | 7233 | 6786 | 6648 | 6693 | 7113 | 6279 |
Exons | 11154 | 9783 | 9776 | 10214 | 10907 | 9278 |
Average exon size | 1101 | 1230 | 1221 | 1191 | 1107 | |
Exons/gene | 1.5 | 1.44 | 1.47 | 1.5 | 1.53 | 1.48 |
tRNA genes | 133 | 111 | 96 | 116 | 110 | 126 |
Secretome | ||||||
Predicted secreted proteins | 409 | 485 | 461 | 466 | 405 | 300 |
Non-coding sequence | ||||||
Introns | 3921 | 2997 | 3103 | 3521 | 3161 | 2999 |
Introns/gene | 0.54 | 0.44 | 0.46 | 0.53 | 0.44 | 0.48 |
Average intron length (base) | 163 | 142 | 144 | 130.1 | 141 | 191.4 |
Average intergenic distance (bp) | 1054 | 1127 | 929 | 1114 | 1186 | 1328 |
Repeat sequences | ||||||
DNA Transposon | 1.89% | 0.29% | 0.13% | 0.25% | 0.89% | 0.29% |
LINE | 4.38% | 0.35% | 0.04% | 0.27% | 4.62% | 0.40% |
SINE | 0.18% | 0.05% | 0.03% | 0.05% | 0.27% | 0.10% |
LTR Retrotransposon | 5.83% | 1.15% | 0.13% | 0.69% | 4.82% | 1.17% |
Unclassified non LTR-Retrotransposon | 0.06% | 0.02% | 0.01% | 0.01% | 0.10% | 0.032 |
Unclassified Retrotransposon | 2.03% | 0.21% | 0.12% | 0.29% | 1.47% | 0.39% |
Unclassfied | 0.06% | 0.08% | 0.02% | 0.08% | 0.38% | 0.04% |
Total TE class | 14.33% | 2.11% | 0.45% | 1.60% | 11.84% | 2.32% |
Simple sequence repeats | 1.31% | 1.75% | 2.00% | 1.59% | 1.59% | 1.54% |
Total excl. Tandem repeats | 15.72% | 3.90% | 2.49% | 3.23% | 13.56% | 3.95% |
Tandem repeats | 5.14% | 4.22% | 6.97% | 4.54% | 5.20% | 5.16% |
Total repeat coverage | 18.51% | 6.70% | 8.26% | 6.68% | 16.45% | 6.72% |
Table 3
Positive selection among sequenced smut fungi
U. bromivora | U. maydis | U. hordei | S. scitamineum | S. reilianum | M. pennsylvanicum | |
|---|---|---|---|---|---|---|
Genes analysed | ||||||
Total | 4947 | 4947 | 4947 | 4947 | 4947 | 4947 |
Under selection (q = 0.05) | 140 | 345 | 188 | 170 | 256 | 2390 |
Under selection (q = 0.01) | 96 | 116 | 135 | 90 | 91 | 1434 |
Non-PSEPs | ||||||
Total | 4738 | 4735 | 4733 | 4748 | 4743 | 4753 |
Under selection (q = 0.05) | 128 | 318 | 168 | 153 | 240 | 2287 |
Under selection (q = 0.01) | 86 | 105 | 122 | 81 | 84 | 1377 |
PSEPs | ||||||
Total | 209 | 212 | 214 | 199 | 204 | 194 |
Under selection (q = 0.05) | 12 | 27 | 20 | 17 | 16 | 103 |
Under selection (q = 0.01) | 10 | 11 | 13 | 9 | 7 | 57 |
-
*Number of genes under positive selection in each of the six fungi used in this study. The number of genes predicted to be under positive selection is given for both a FDR of 0.05 and 0.01 and are grouped in three categories: total genes analyzed, the subset of genes that are not predicted to be secreted and the subset of genes that are predicted to be secreted. This analysis is limited to the 4,947 one-to-one orthologs that were used for the construction of the phylogeny.
Additional files
-
Supplementary file 1
Primers, plasmids and strains used in this study.
- https://doi.org/10.7554/eLife.20522.027
-
Supplementary file 2
Maps of plasmids used in this study.
Plasmid maps are provided as gb/gbk files.
- https://doi.org/10.7554/eLife.20522.028
Download links
A two-part list of links to download the article, or parts of the article, in various formats.
Downloads (link to download the article as PDF)
Open citations (links to open the citations from this article in various online reference manager services)
Cite this article (links to download the citations from this article in formats compatible with various reference manager tools)
A complete toolset for the study of Ustilago bromivora and Brachypodium sp. as a fungal-temperate grass pathosystem
eLife 5:e20522.
https://doi.org/10.7554/eLife.20522


