Profound alteration in cutaneous primary afferent activity produced by inflammatory mediators
- University of Wyoming, United States
- University of Wyoming Graduate Program in Neuroscience, United States
- University of Pittsburgh, United States
- Center for Neuroscience at the University of Pittsburgh, United States
- Pittsburgh Center for Pain Research, United States
Figures
Figure 1
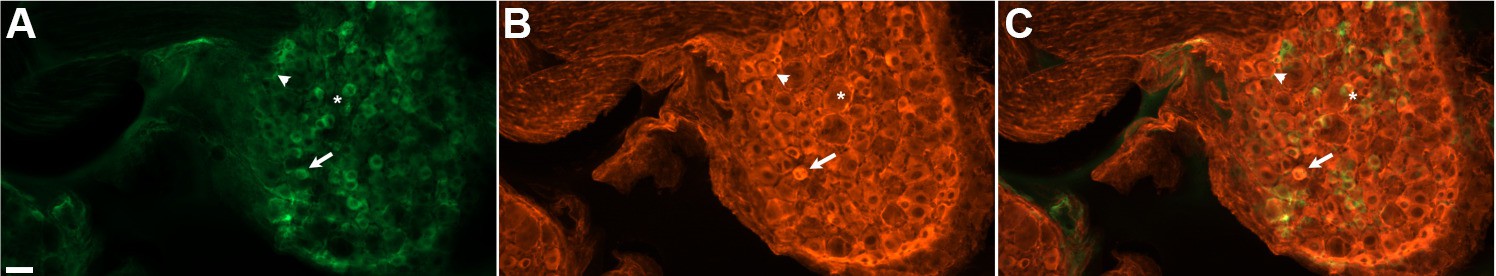
DRG neurons exhibit variable levels of native GCaMP3 fluorescence.
Paraformaldehyde-fixed sections of GCaMP3-expressing DRG. (A) Endogenous GCaMP3 signal demonstrated a wide range of resting GCaMP3 fluorescence. Arrow indicates cell with a small somata and high resting GCaMP3 signal. Arrowhead indicates somata with low GCaMP3 signal. Asterisk indicates cell with large somata and no GCaMP3 signal. (B) The same section as in (A) but stained with anti-GFP antibody to boost GCaMP3 signal. Now, somata with low or no endogenous GCaMP3 signal can be seen to express the transgenic GCaMP3 protein. (C) Merged images. Scale bar, 50 µm.
Figure 2
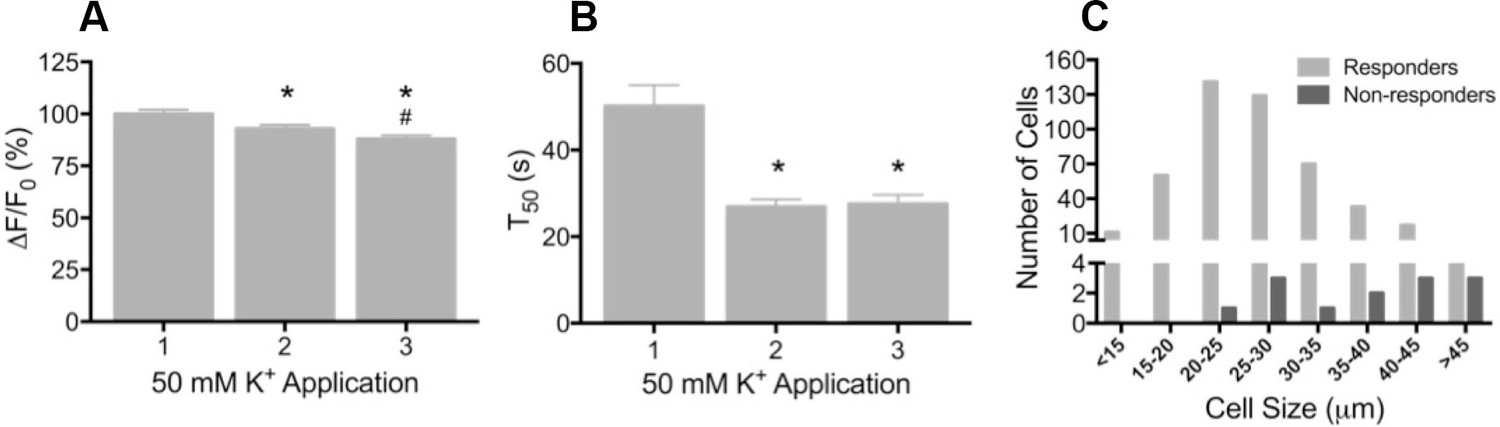
Depolarization evokes reproducible GCaMP3 signals in vitro
(A) Application of 50 mM K+ produced a robust fluorescent signal in the vast majority of dissociated DRG neurons, and peak evoked fluorescence (F–F0) expressed as a% of the initial K+ application significantly decreased with subsequent applications. Data are presented as mean ± SEM. *p<0.001 versus K+ #1; #p<0.0001 versus K+ #2. (B) The time to decay to 50% of peak signal (T50) following K+-evoked depolarization also significantly decreased with repeated application of K+. Data are presented as mean ± SEM. *p<0.0001. (C) Distribution of somata diameter of cultured DRG neurons that did (light gray bars) and did not (dark gray bars) exhibit an increase in GCaMP3 signal in response to application of 50 mM K+. Responders were small-to-medium in size (median 25–29 μm), and cells that did not exhibit a K+-evoked GCaMP3 signal (non-responders) were ≥30 μm in size (median 45–49 μm). Data are presented in 5 μm bins. N=5.
Figure 3
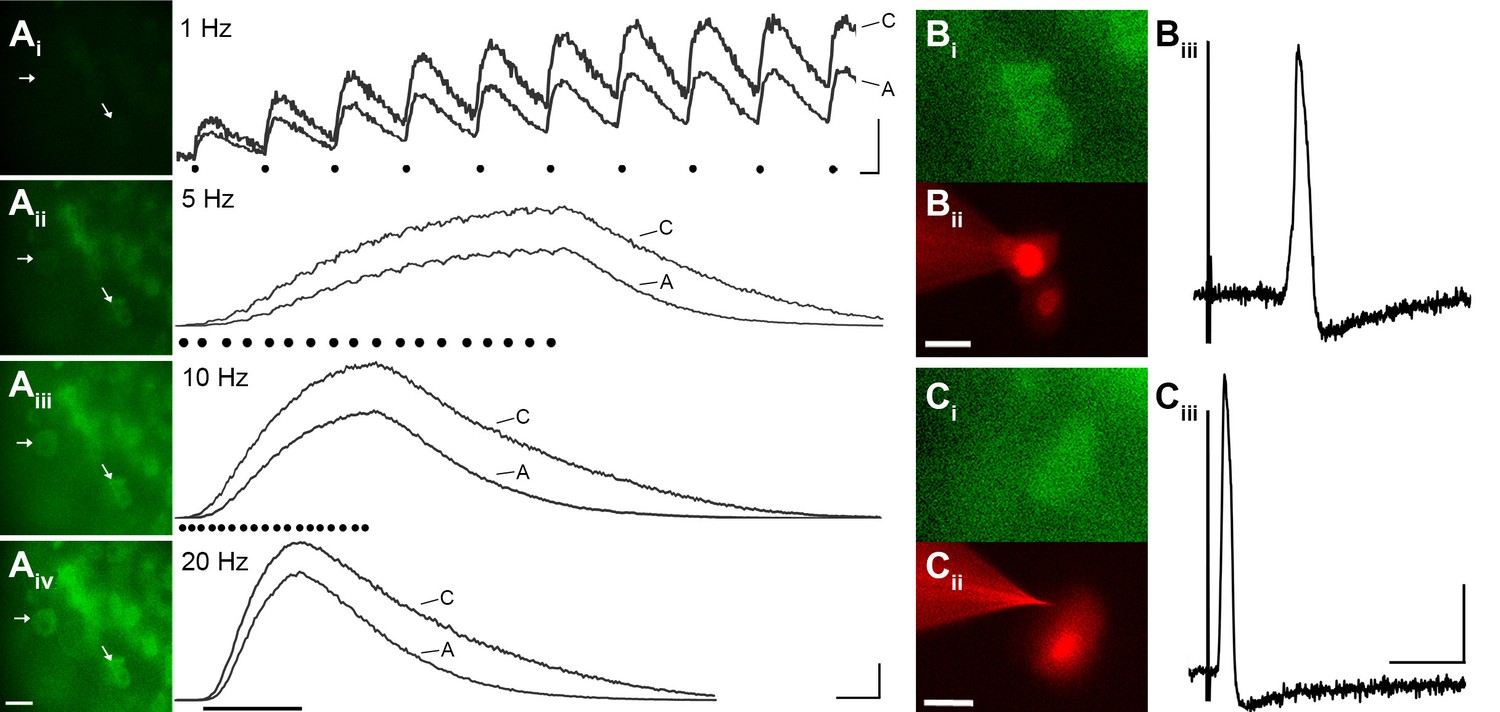
GCaMP3 reports electrically evoked spike activity from Aδ- and C-fiber afferents in the ex vivo skin-nerve preparation.
(A) Continuous calcium transients imaged during application of electrical stimulation to spinal nerve. As electrical stimulation frequency increased (1, 5, 10, and 20 Hz; Ai–Aiv), the GCaMP3 signal from DRG somata increased in fluorescence intensity (images on left; scale bar, 40 μm). Right side of panel A shows GCaMP3 traces from physiologically identified cells (white arrows). The GCaMP3 signal from both the C fiber (top trace) and Aδ fiber (bottom trace) resolved single spike activity up to 10 Hz. Electrical stimuli are represented as black dots beneath traces (they fuse at 20 Hz). Scale bar, 250 ms; 5 ΔF/F0 for 1 Hz; 20 ΔF/F0 for 5, 10 and 20 Hz. (B–C) To verify that the GCaMP3 signal was reporting spike activity, intracellular recordings were also made from GCaMP3-responding afferents. GCaMP3-responding cells were located (Bi and Ci) and impaled with electrodes containing AlexaFluor-555 (red) to confirm the identity of cells (Bii and Cii; scale bar, 20 μm). Representative action potentials from a C fiber (Biii; conduction velocity, CV = 0.51 m/s2) and Aδ fiber (Ciii; CV = 2.2 m/s2) are shown on the right. Scale bar, 10 ms; 20 mV.
Figure 4
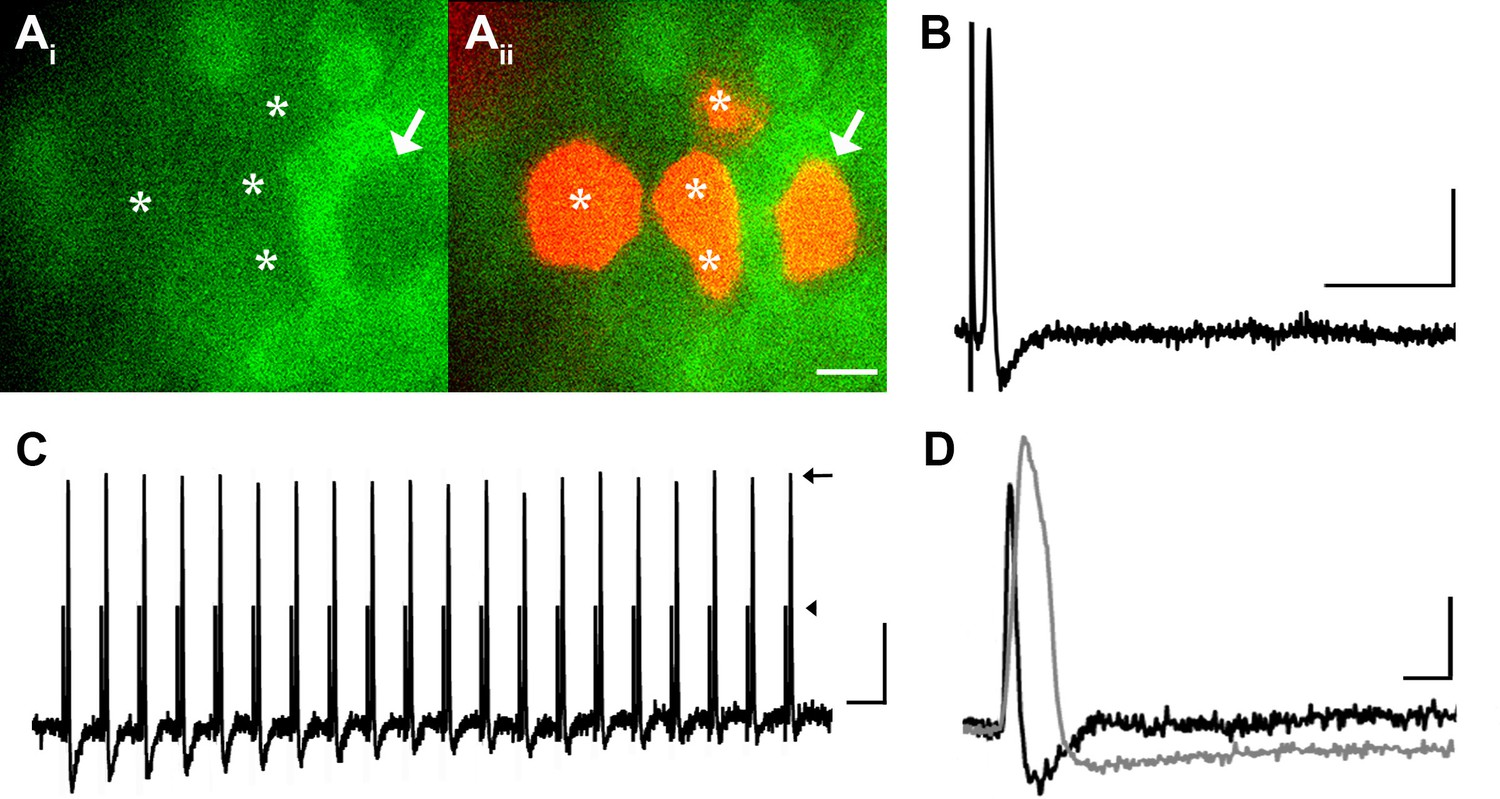
DRG neurons with narrow spikes and fast conduction velocities do not exhibit GCaMP3 signals, despite being electrically driven in the ex vivo preparation.
(A) Spinal nerve branches (dorsal cutaneous and intercostal nerves) were electrically stimulated concurrently at 20 Hz (found to maximally elicit a GCaMP3 response) with suction electrodes. Not all DRG somata exhibited a GCaMP3 signal (Ai; GCaMP3-non-responders indicated by white asterisks and white arrow). These afferents were impaled for intracellular recording and their identity was verified with AlexaFluor-555 (Aii). Scale bar, 20 μm. (B) Intracellular recording confirmed that GCaMP3-non-responding afferents were firing action potentials with CVs in Aβ- and Aδ-fiber ranges (example action potential from neuron indicated by arrow in A; CV = 8.2 m/s2). Scale bar, 10 ms; 20 mV. (C) GCaMP3-non-responding afferents followed stimulation at 100 Hz, but still did not exhibit a GCaMP3 signal. The stimulus artifacts have been cropped (at arrowhead) to better visualize action potentials (arrow). Scale bar, 1 ms; 20 mV. (D) Superimposed action potentials from a GCaMP3-non-responding (black) and a GCaMP3-responding (gray) myelinated afferent reveal that GCaMP3 responders have broad spikes, whereas GCaMP3 non-responders have narrow, uninflected spikes. Scale bar, 2 ms; 20 mV.
Figure 5
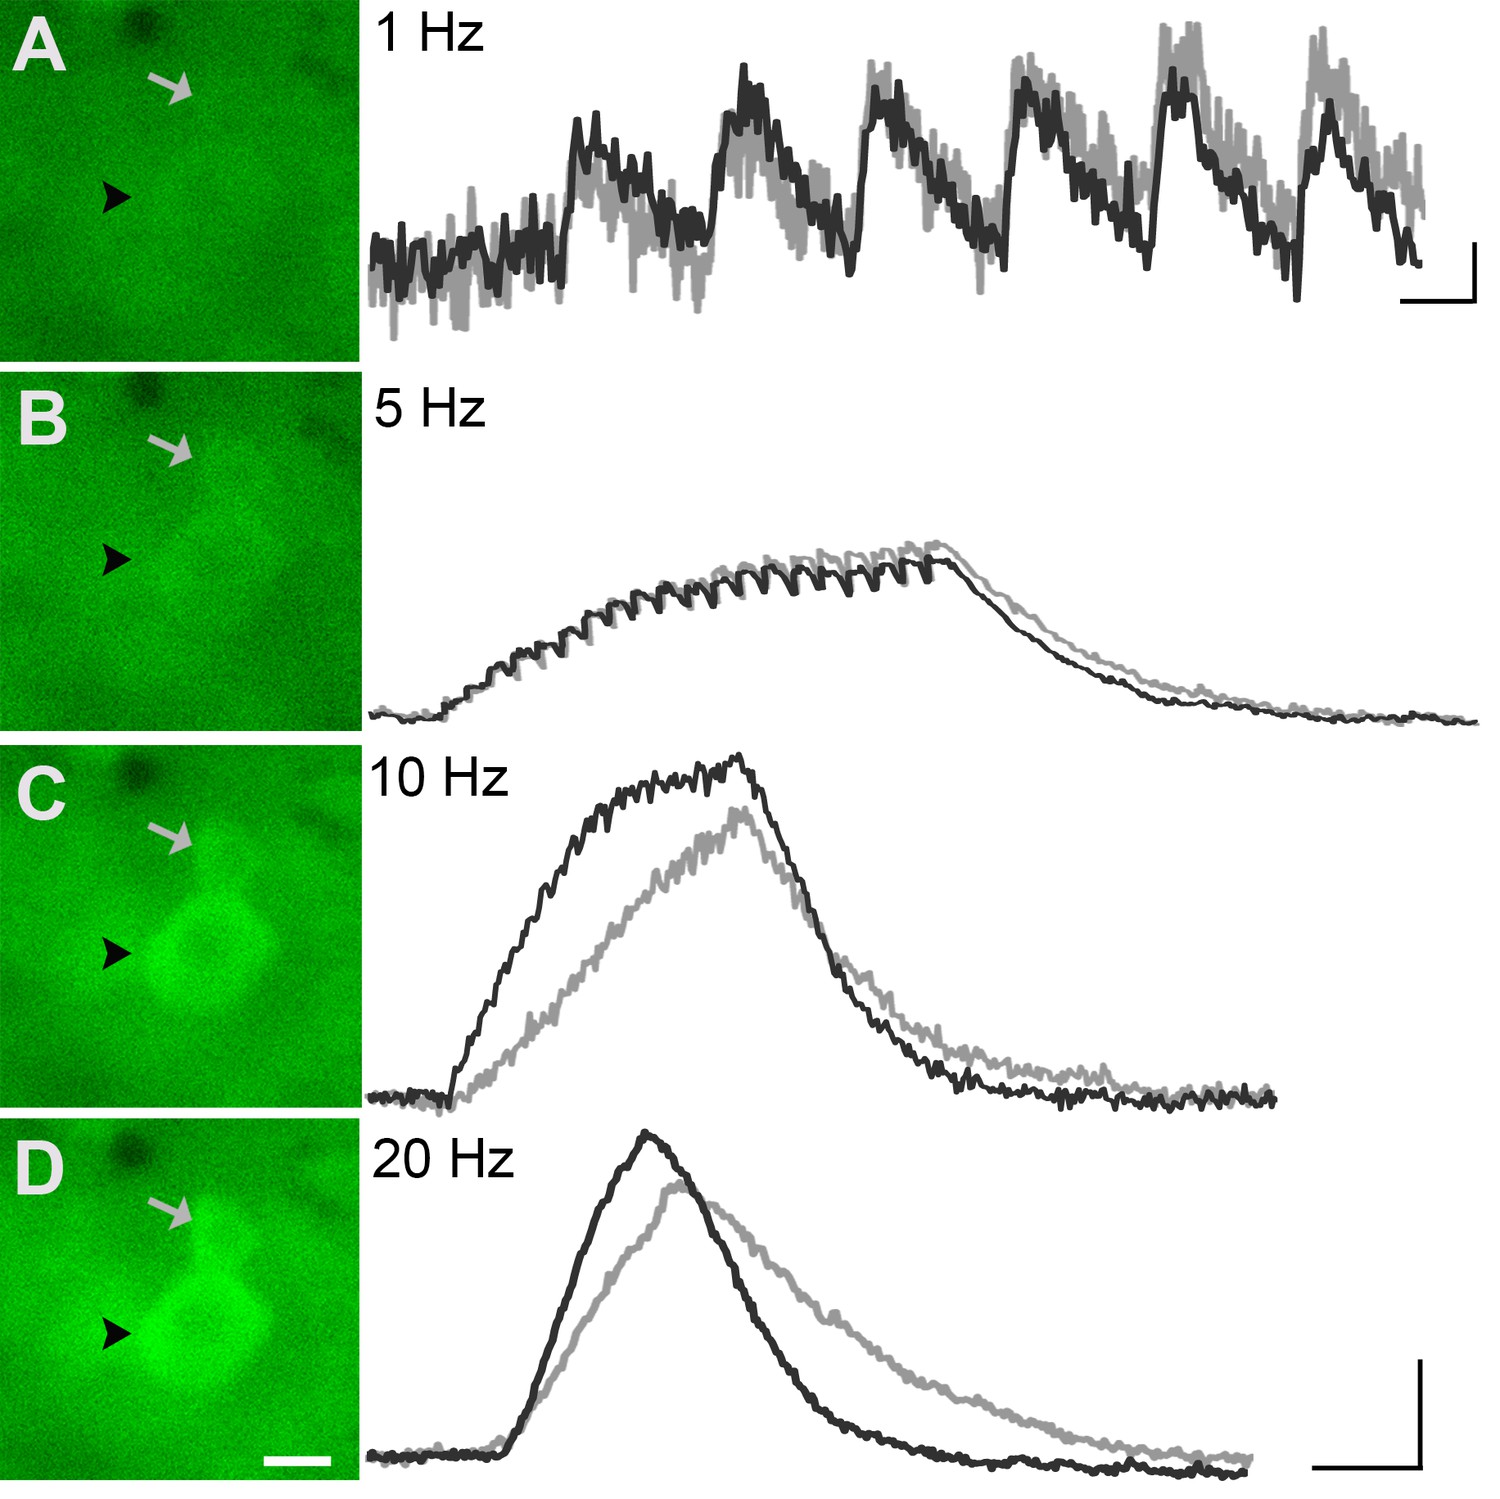
GCaMP3 fluorescence reports electrically evoked activity from DRG afferents in vivo.
(A–D) The GCaMP3 signal from two DRG somata (black arrowhead and gray arrow) in response to 1, 5, 10, and 20 Hz electrical stimulation of receptive field (from top to bottom) was imaged (shown on left; scale bar, 20 μm). GCaMP3 traces (shown on right) from the identified cells reveal that single spikes can be resolved up to 10 Hz, similar to findings from the ex vivo preparation. Scale bars, 500 ms; 5 ΔF/F0 for 1 Hz, and 10 ΔF/F0 for 5, 10 and 20 Hz.
Figure 6 with 1 supplement
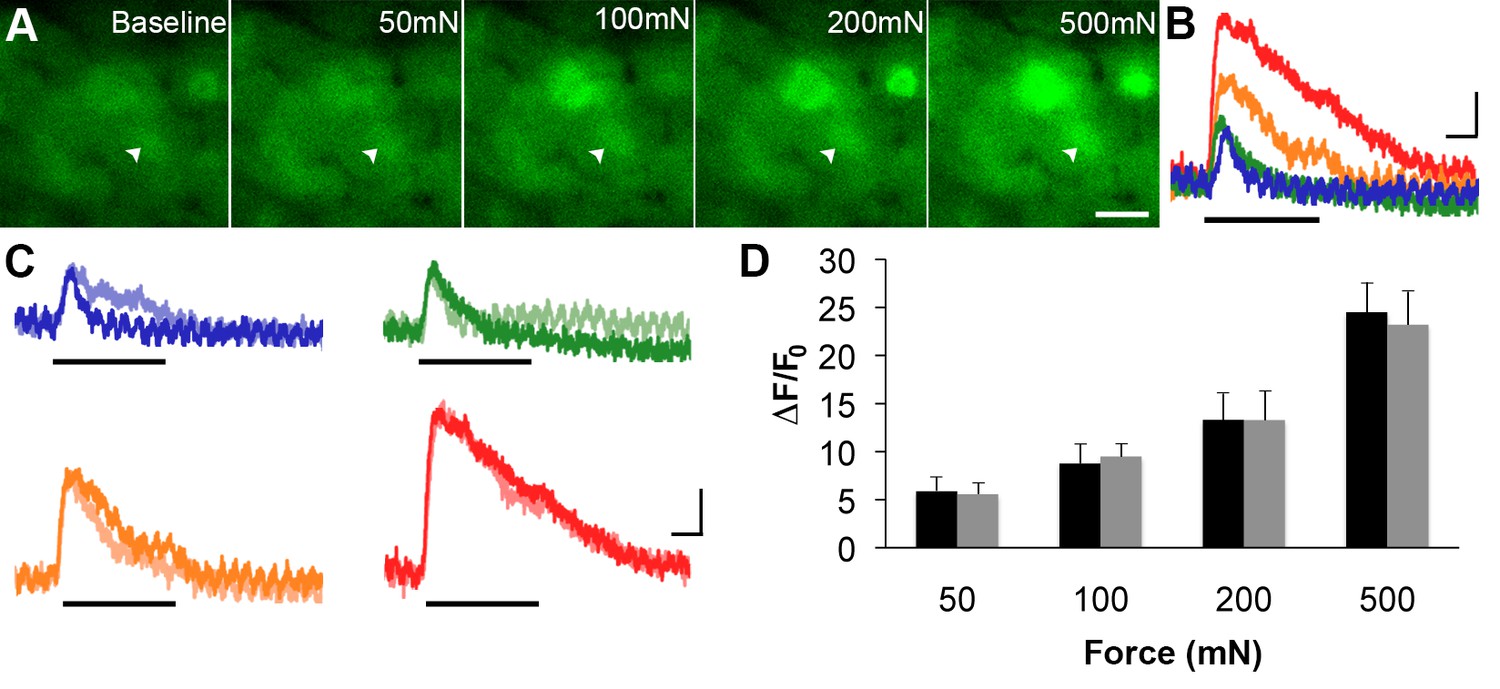
GCaMP3 responses to controlled mechanical stimulation encode force intensity and are stable over timein vivo.
(A) Images of GCaMP3 signal in a mechanically sensitive cell (white arrowheads) at baseline and in response to an ascending series of mechanical forces (left to right). Scale bar, 20 μm. (B) Superimposed GCaMP3 traces from the DRG neuron identified in A in response to 50 (blue), 100 (green), 200 (orange), and 500 (red) mN mechanical stimulation (indicated by black bar). Peak GCaMP3 signal increases as the force increases. Scale bar, 1 s; 10 ΔF/F0. (C) Baseline responses to each force of mechanical stimulation (designated color) are superimposed with responses to the same set of mechanical stimuli 30 min later (lighter shade of designated color). Scale bar, 1 s; 10 ΔF/F0. (D) Average GCaMP3 responses to mechanical stimulation at 50, 100, 200 and 500 mN (n=3 mice; n=32 cells). Baseline responses (black) are not significantly different from responses 30 min later (gray) across all forces. Data are represented as mean ± SEM. See Figure 6—figure supplement 1 for image of mechanical stimulation set-up.
Figure 6—figure supplement 1
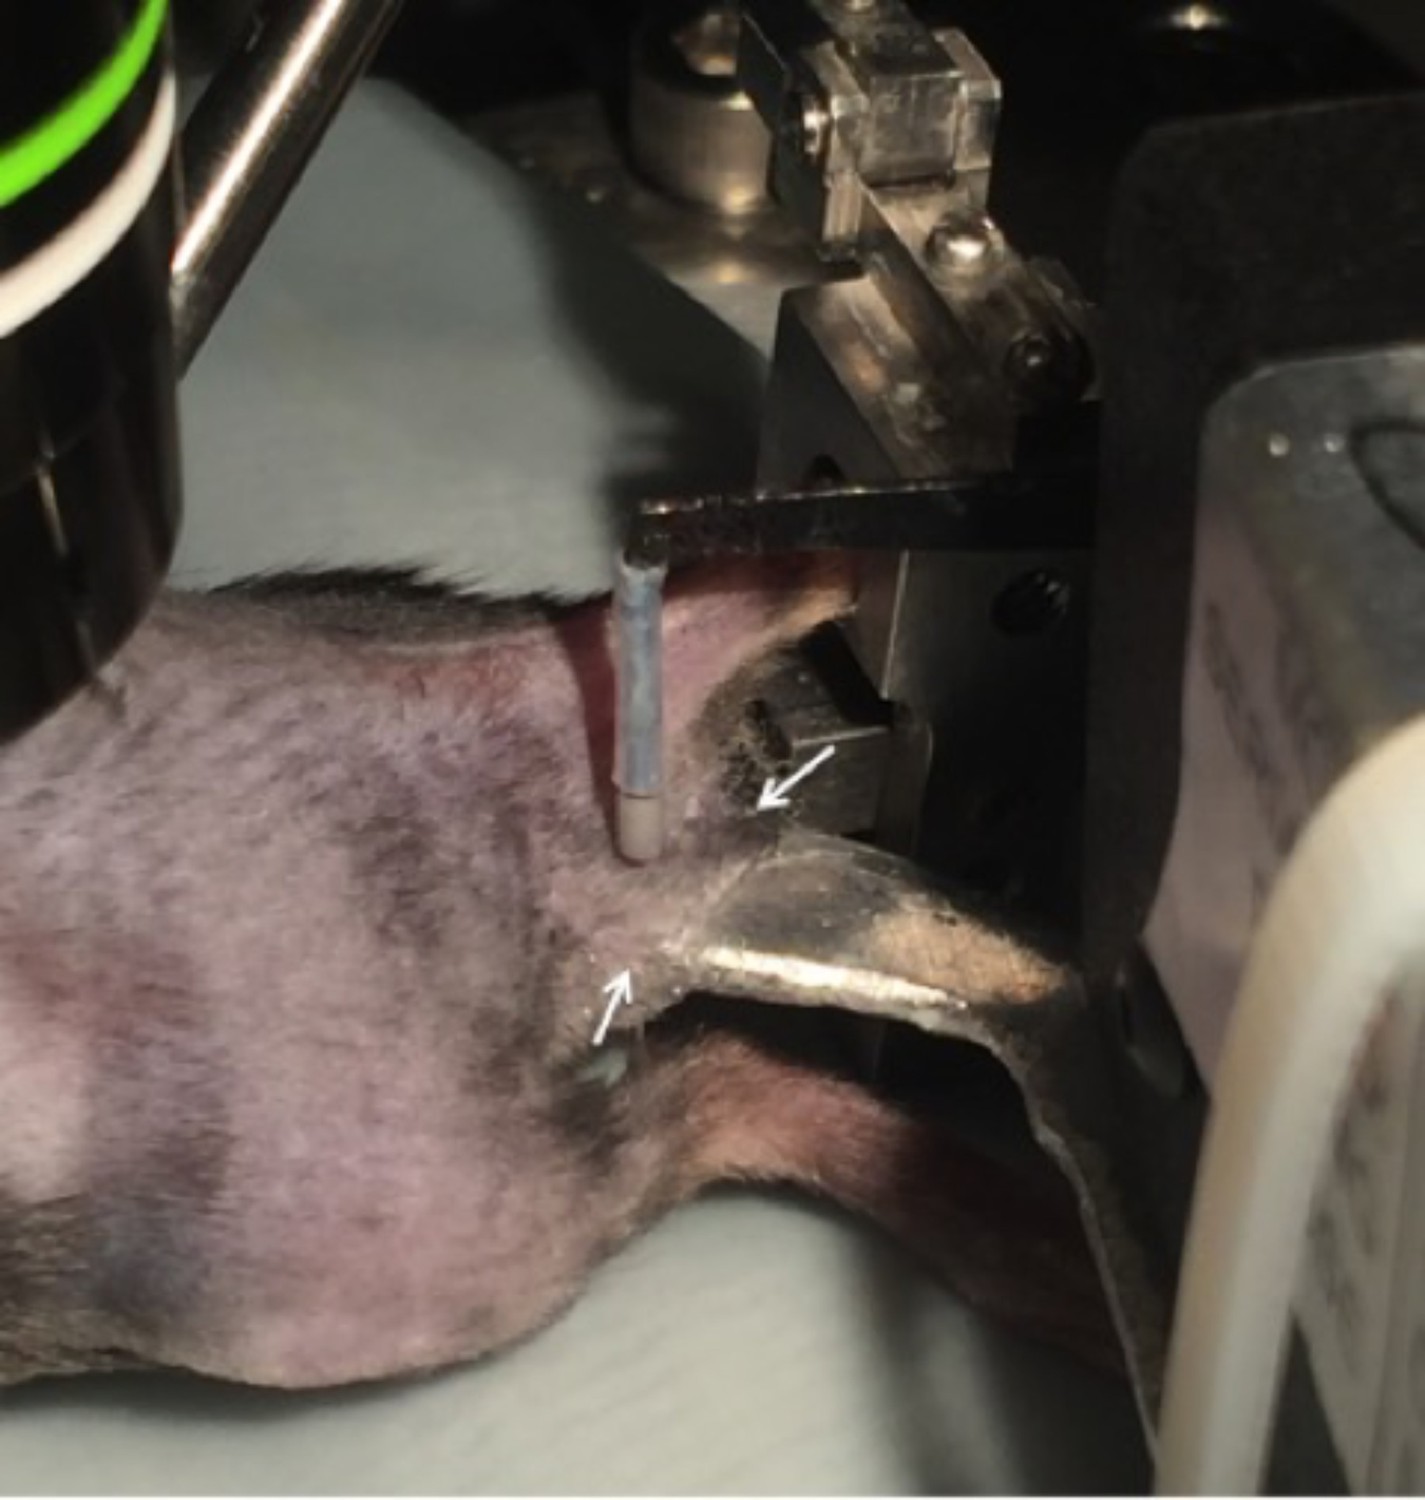
Setup for the application of mechanical stimuli to the skin.
After an innervation area of the skin was identified by electrical stimulation, the skin was gently folded over onto a platform attached to a feedback-controlled mechanical stimulator. The lateral edges of the underside of the skin flap were glued to the platform (indicated by arrows) to ensure that the same region of skin was stimulated during each mechanical force application.
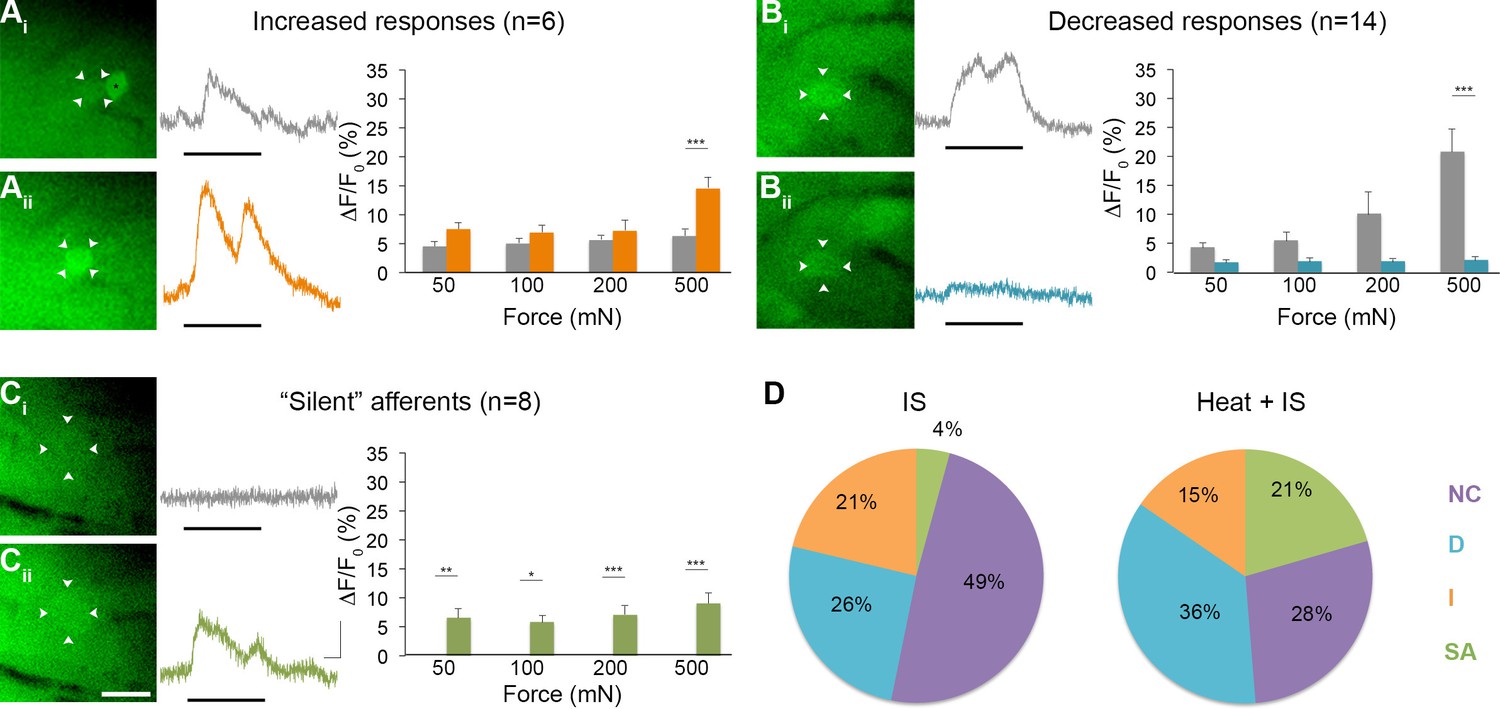
Figure 7
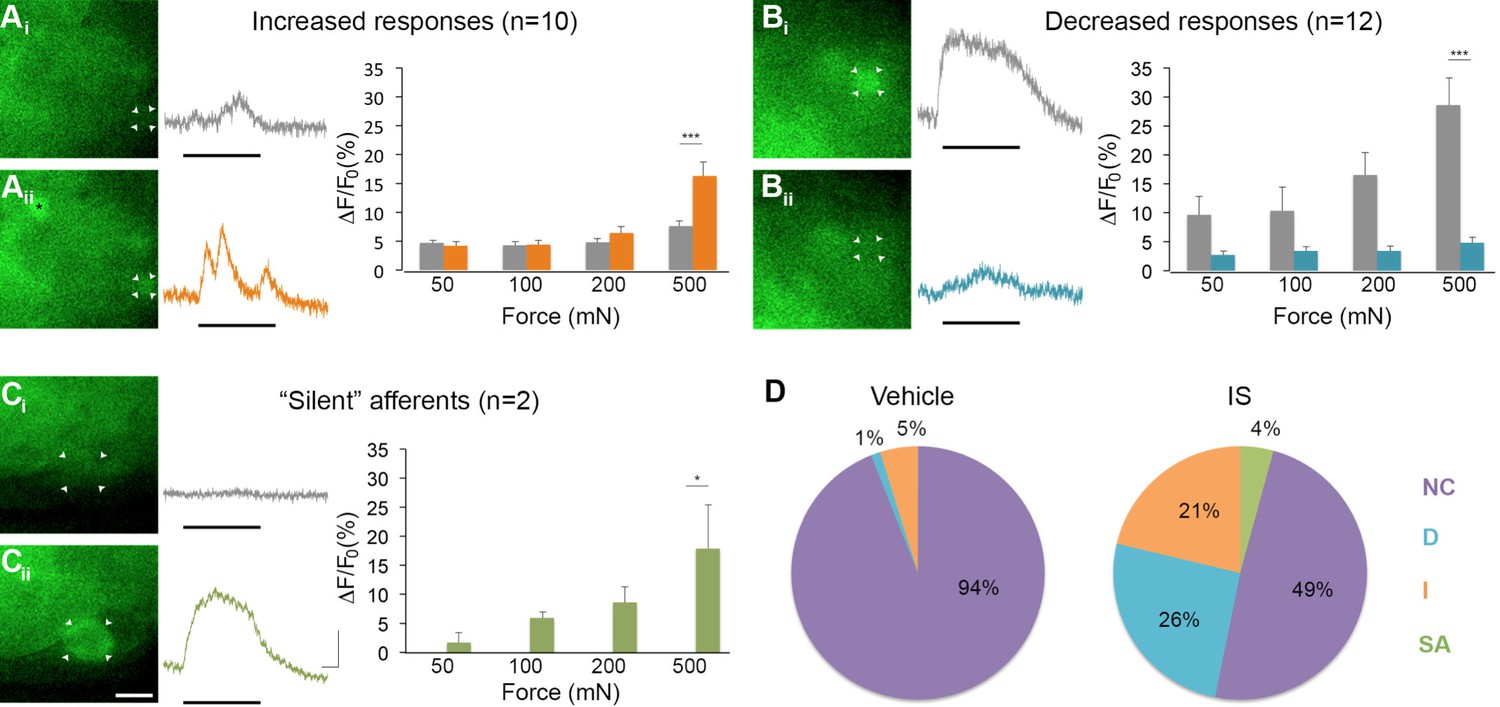
Inflammation-induced plasticity in mechanical sensitivity revealed by GCaMP3 in vivo.
(A–C) Diverse changes in sensitivity to mechanical stimuli (indicated by black bar under GCaMP3 trace) were revealed when comparing GCaMP3 responses before (Ai–Ci, gray trace in each panel) and 30 min after (Aii–Cii, colored trace in each panel) 'inflammatory soup' (IS). These changes are summarized for increased and decreased responses and silent afferents in the graph on the right of each panel. Scale bar, 20 μm; 1 s, 10 ΔF/F0. Data are represented as mean ± SEM. *p<0.05, **p<0.01, ***p<0.001. (A) Example of an afferent with increased sensitivity to mechanical stimuli after IS (Ai–Aii; white arrowheads). Black asterisk indicates afferent with increased mechanical sensitivity post-IS within the same visual field. Average post-IS responses were significantly increased only at 500 mN (highest force tested). (B) Example of an afferent with decreased sensitivity to mechanical stimuli after IS (Bi–Bii; white arrowheads). Average post-IS responses were significantly decreased at 500 mN. (C) Cells that exhibited GCaMP3 signal in response to mechanical stimuli after IS were categorized as 'silent' afferents (Ci–Cii; example cell indicated by white arrowheads). (D) Summarized results of the proportions of each type of IS-induced change in sensitivity due to vehicle (left; n=6 mice; n=83 cells) and IS (right; n=5 mice; n=47 cells). Compared to changes seen after vehicle, there were significantly more cells that displayed increased and decreased sensitivity to mechanical stimuli. Further, IS caused entirely new sensitivity in a subset of afferents ('silent' afferents), which was never observed in vehicle-injected controls. NC, no change; D, decreased; I, increased; SA, silent afferent.
Figure 8
Effects of heat exposure to inflammation-induced plasticity in mechanical sensitivity.
(A–C) Changes in sensitivity to mechanical stimuli (indicated by black bar) were revealed when comparing GCaMP3 responses before (Ai–Ci, gray trace in each panel) and 30 min after (Aii–Cii, colored trace in each panel) heat exposure prior to IS. These changes are summarized for increased and decreased responses and 'silent' afferents in the graph on the right of each panel. Scale bar, 20 μm; 1 s, 10 ΔF/F0. Data are represented as mean ± SEM. *p<0.05, **p<0.01, ***p<0.001. (A) Example of an afferent with increased sensitivity to mechanical stimuli after IS (Ai–Aii; white arrowheads). Average post-IS responses were significantly increased only at 500 mN (highest force tested). Black asterisk indicates afferent with decreased mechanical sensitivity post-IS within the same visual field. (B) Example of an afferent with decreased sensitivity to mechanical stimuli after IS (Bi–Bii; white arrowheads). Average post-IS responses were significantly decreased at 500 mN. (C) Significantly more 'silent' afferents developed mechanical sensitivity after IS when brief noxious heat was applied prior to IS infusion (Ci–Cii; example cell indicated by white arrowheads). Post-IS responses were significantly increased across all forces. (D) Summarized results of the proportions of each type of IS-induced change in sensitivity due to IS alone (left; n=5 mice; n=47 cells) and heat in addition to IS (right; n=5 mice; n=39 cells). Compared to changes seen after IS alone, there were significantly more 'silent' afferents with de novo mechanical sensitivity when heat was applied prior to IS infusion. NC, no change; D, decreased; I, increased; SA, 'silent' afferent.
Download links
A two-part list of links to download the article, or parts of the article, in various formats.
Downloads (link to download the article as PDF)
Open citations (links to open the citations from this article in various online reference manager services)
Cite this article (links to download the citations from this article in formats compatible with various reference manager tools)
Profound alteration in cutaneous primary afferent activity produced by inflammatory mediators
eLife 5:e20527.
https://doi.org/10.7554/eLife.20527


