Auxin production in the endosperm drives seed coat development in Arabidopsis
- Swedish University of Agricultural Sciences and Linnean Center for Plant Biology, Sweden
Figures
Figure 1 with 2 supplements
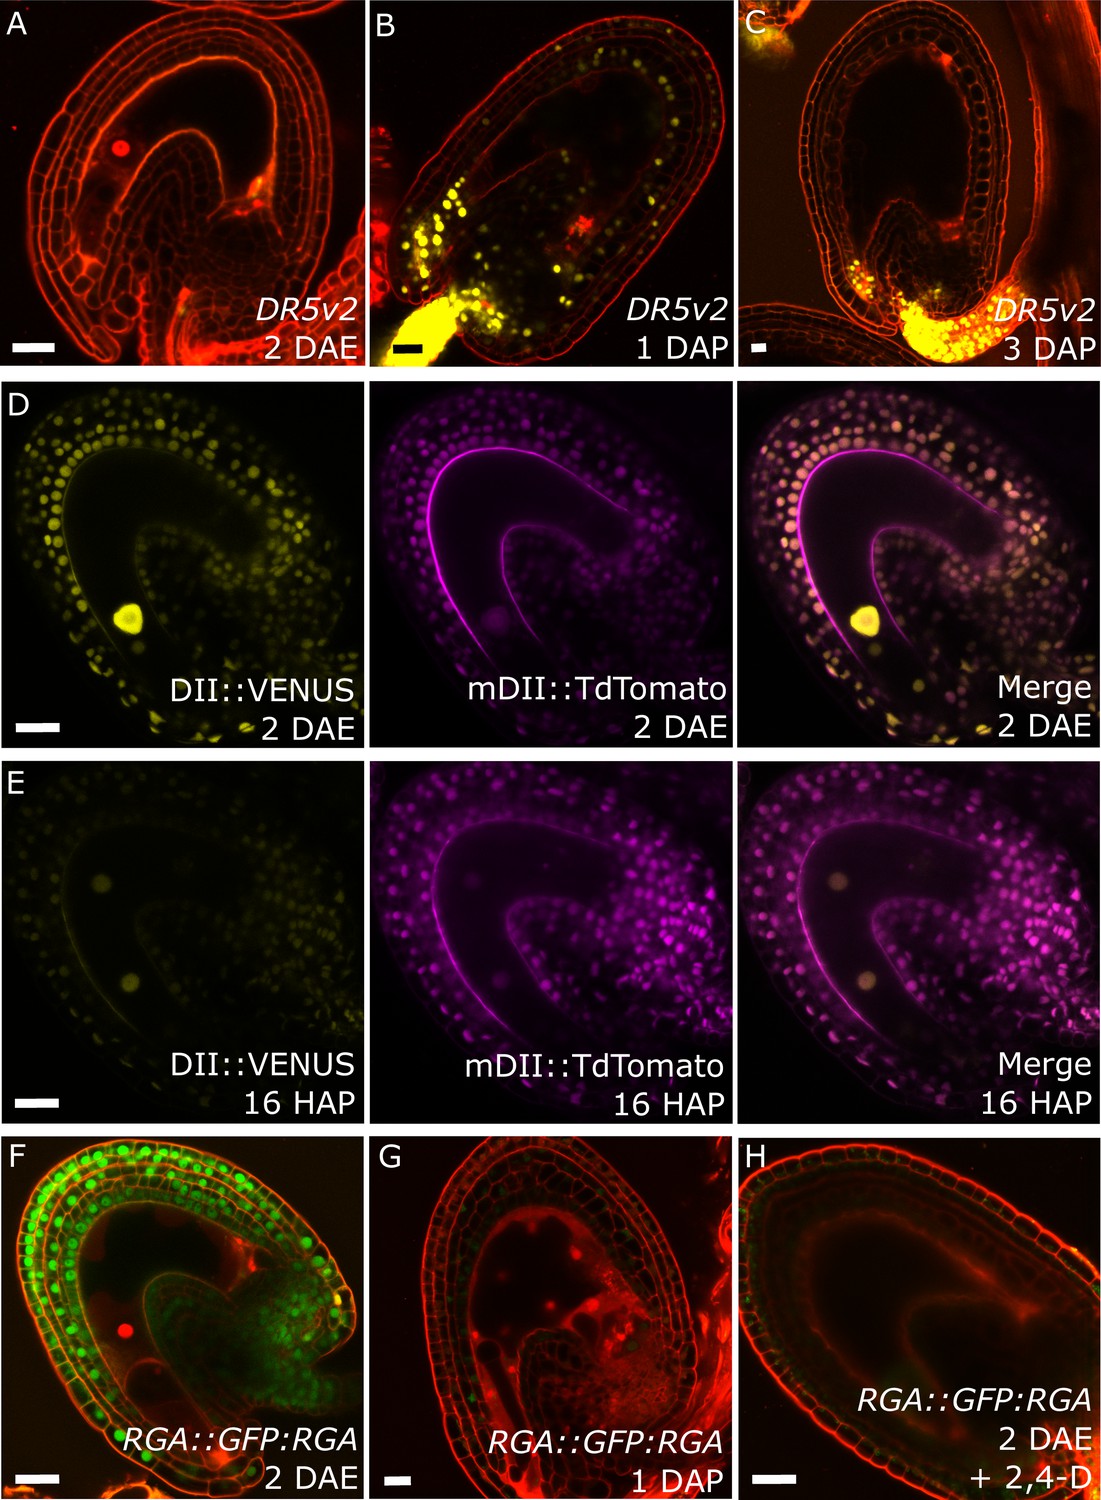
Fertilization activates auxin and GA signaling in the seed coat.
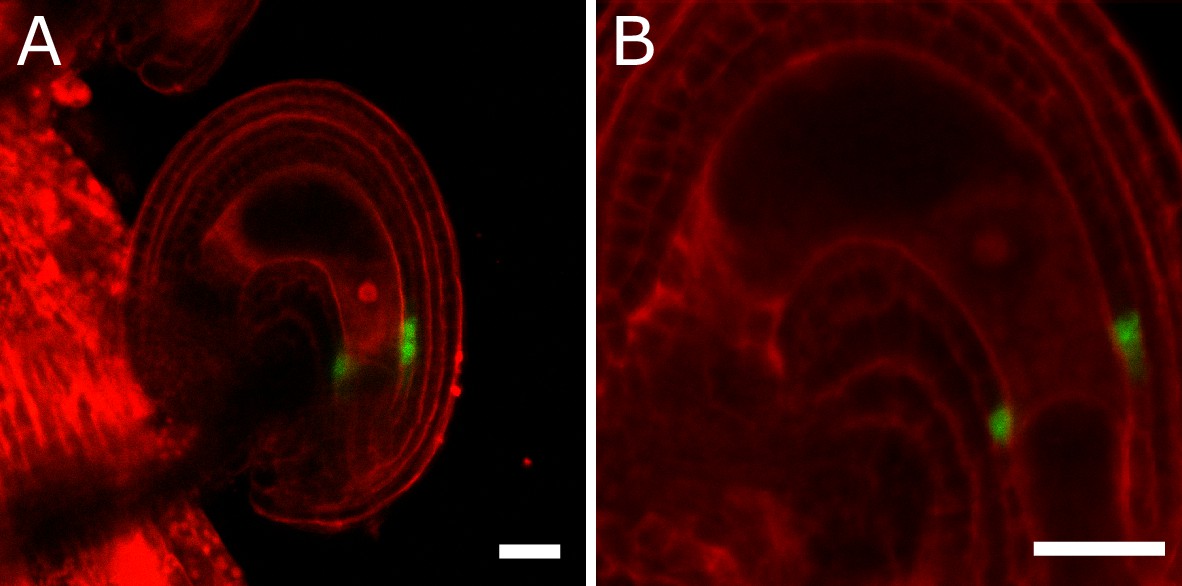
(A–C) DR5v2::VENUS expression before (A) and one and three days after pollination (B–C). (D–E) R2D2 auxin sensor before (D) and 16 hr after pollination (HAP) (E). (F–H) RGA::GFP:RGA reporter before (F), one day after pollination (G) and after 2,4-D treatment without pollination (H). Bars indicate 20 µm. Red staining is propidium iodide (PI).
Figure 1—figure supplement 1
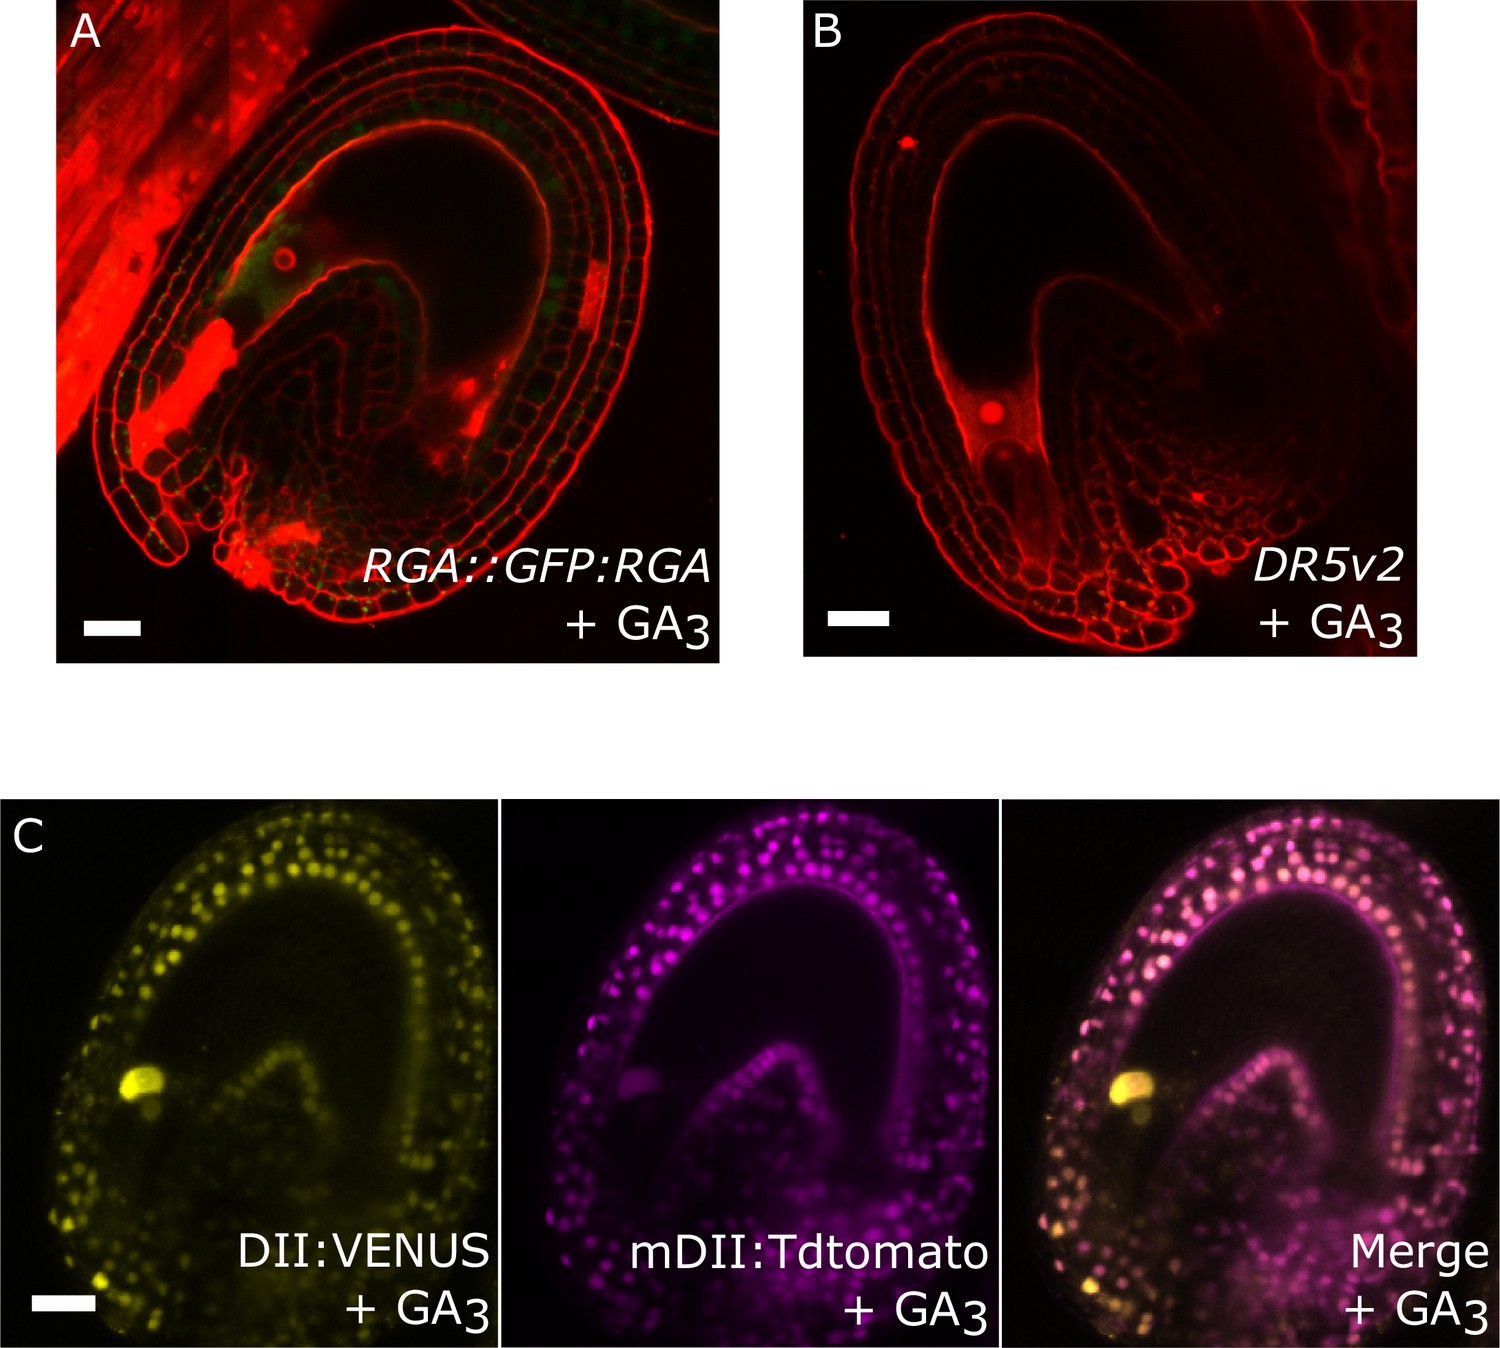
Effect of GA treatments on GA and auxin reporter lines.
(A) The GFP signal derived from RGA::GFP:RGA is depleted following application of GA3. (B–C) Activity of the auxin reporters DR5v2 (B) and R2D2 (C) remains unchanged after GA3 treatment. See also Figure 1. All samples were taken at 5 DAE (three days following GA3 treatments). Bars indicate 20 µm. Red staining is PI.
Figure 1—figure supplement 2
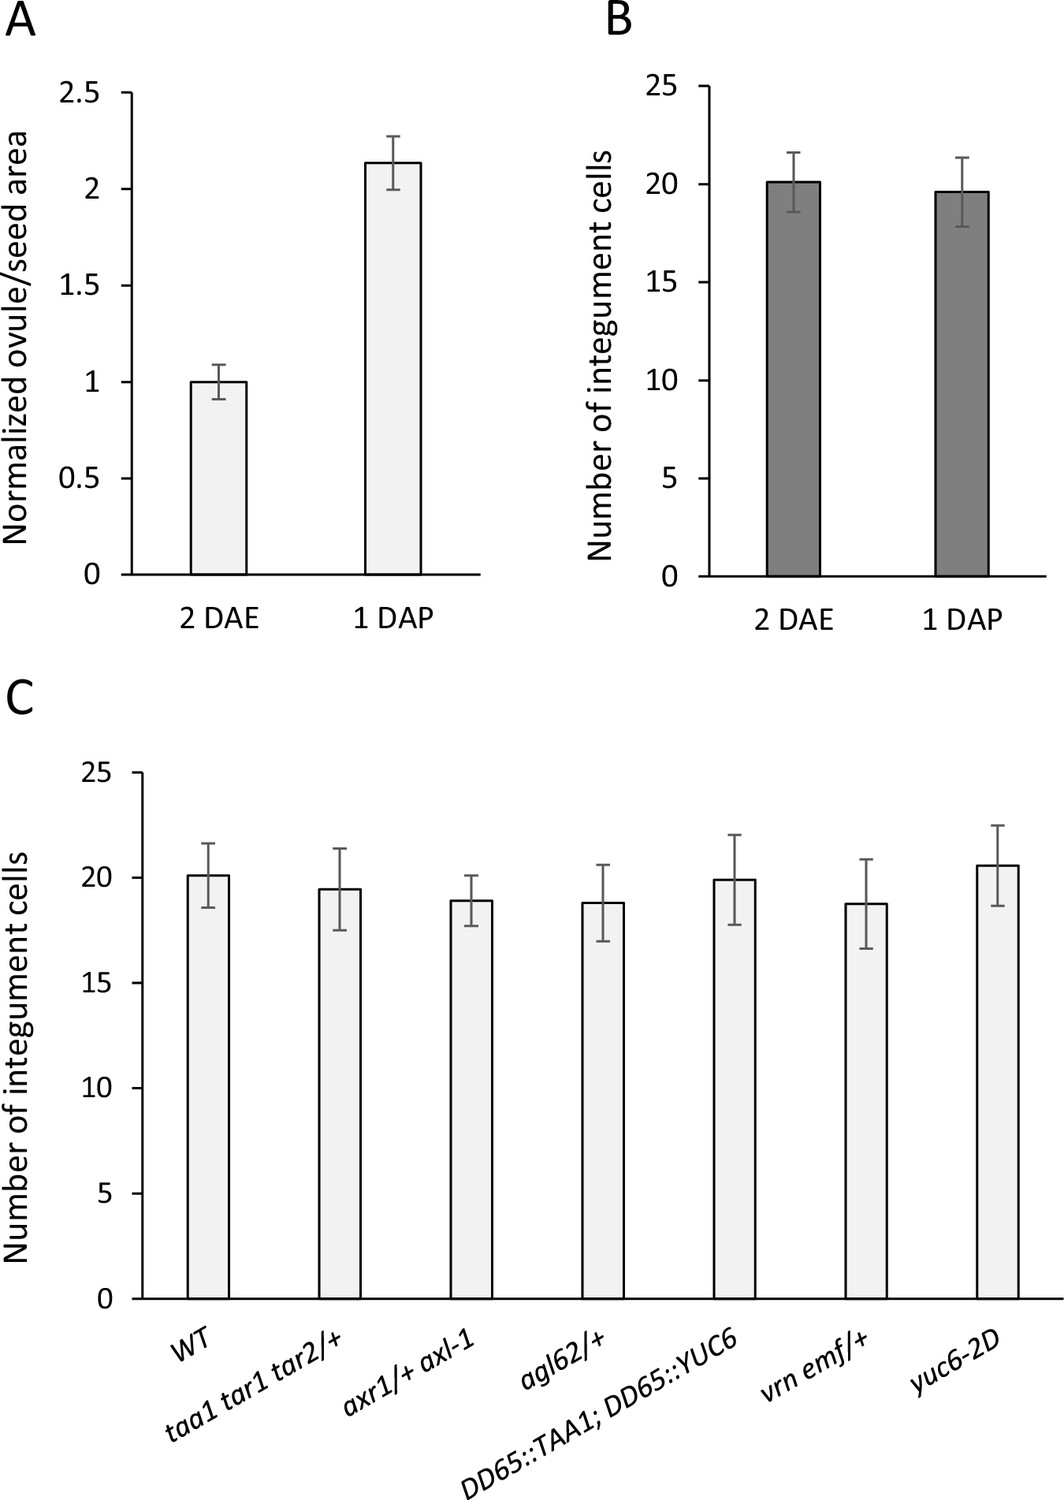
Ovule size and cell measurements.
(A) Relative area of 1 DAP WT seeds compared to 2 DAE ovules. (B) Integument cell number did not change following fertilization, indicating that seed coat growth is driven by cell expansion rather than cell division. (C) Integument cell numbers in mutant and transgenic lines at 2 DAE. No differences were observed between the lines. Error bars indicate standard deviation.
Figure 2 with 1 supplement
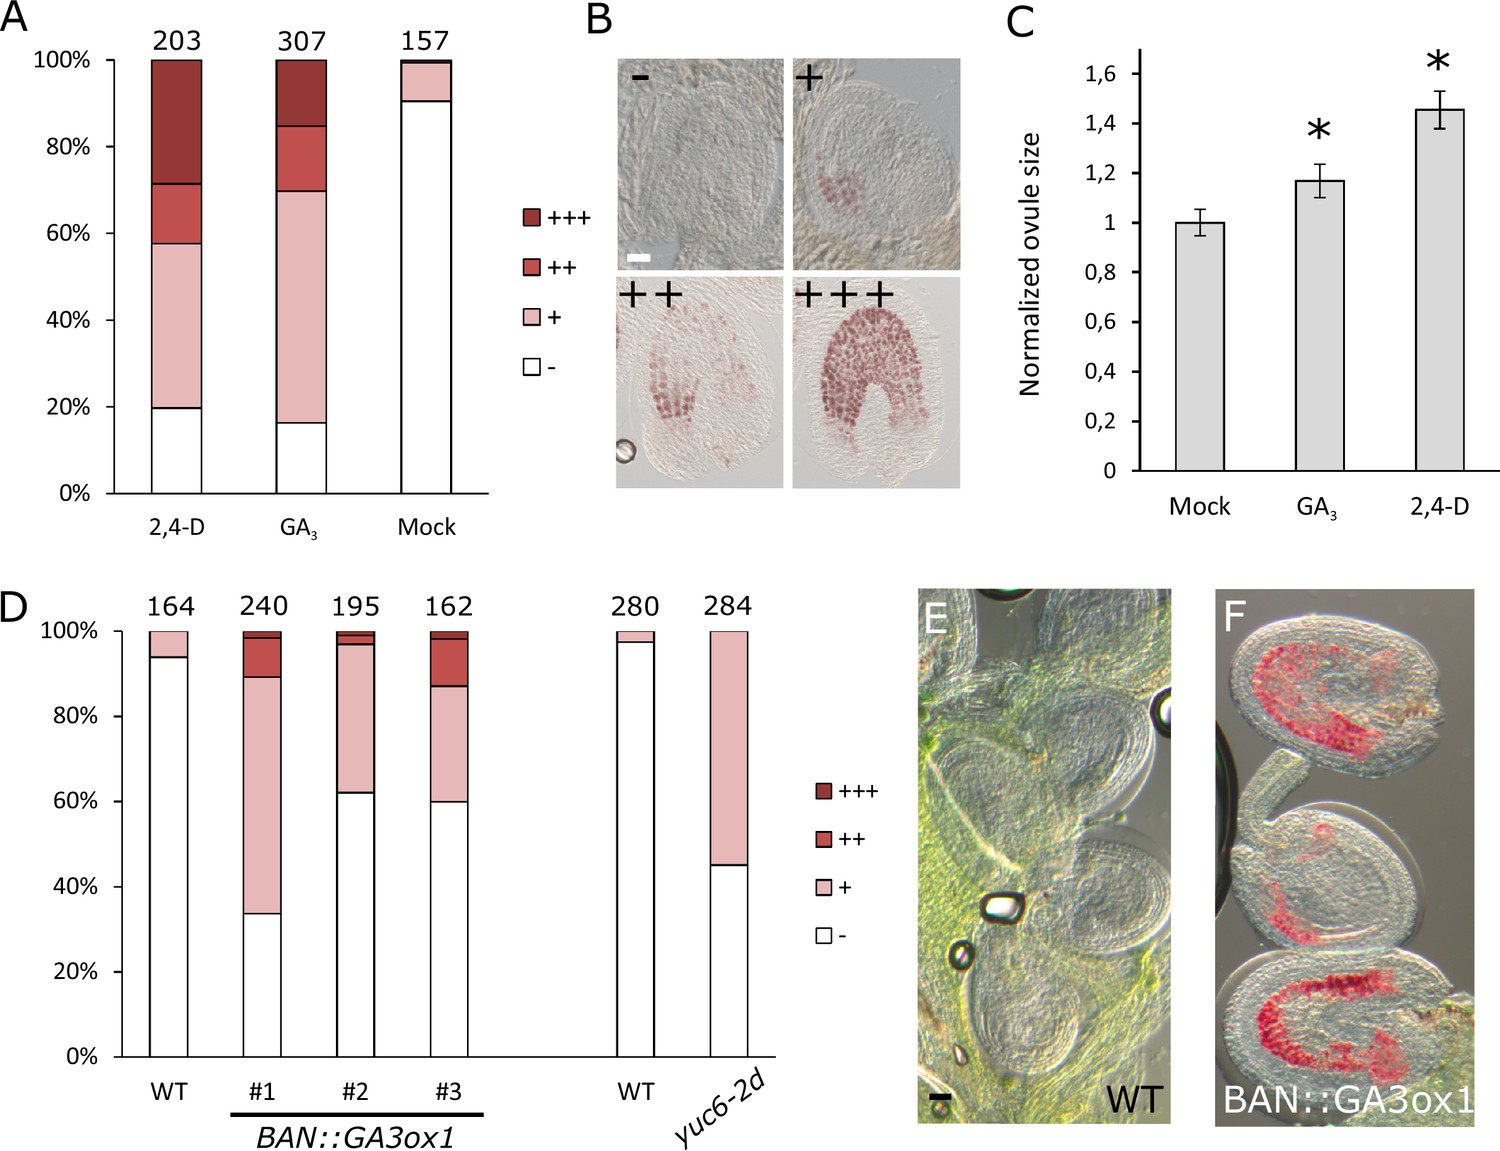
GA and auxin are sufficient to drive seed coat development.
(A–B) Scoring of vanillin staining of ovules after 2,4-D, GA3 and mock treatments, as categorized in (B). Numbers on top indicate total ovules counted. Bar indicates 20 µm. (C) Ovule area three days after 2,4-D, GA3 and mock treatments. Ten ovules were measured per treatment. The size is normalized to the mock-treated ovules. Error bars indicate standard deviation. * Differences are significant for p<0.00001(T-Test). (D) Scoring of vanillin staining in ovules of WT, auxin and GA-overexpressing lines, as categorized in (B). Numbers on top indicate total ovules counted. (E–F) Vanillin-stained WT (E) and BAN::GA3ox1 (F) ovules at 5 DAE. Bar indicates 50 µm.
Figure 2—figure supplement 1
Activity of the BAN promoter in unfertilized ovules.
(A–B) BAN::GFP reporter is expressed in the inner integument cells of unfertilized ovules. No expression is observed in cells of the female gametophyte. Bars indicate 20 µm.
Figure 3 with 1 supplement
Auxin is necessary for seed coat development.
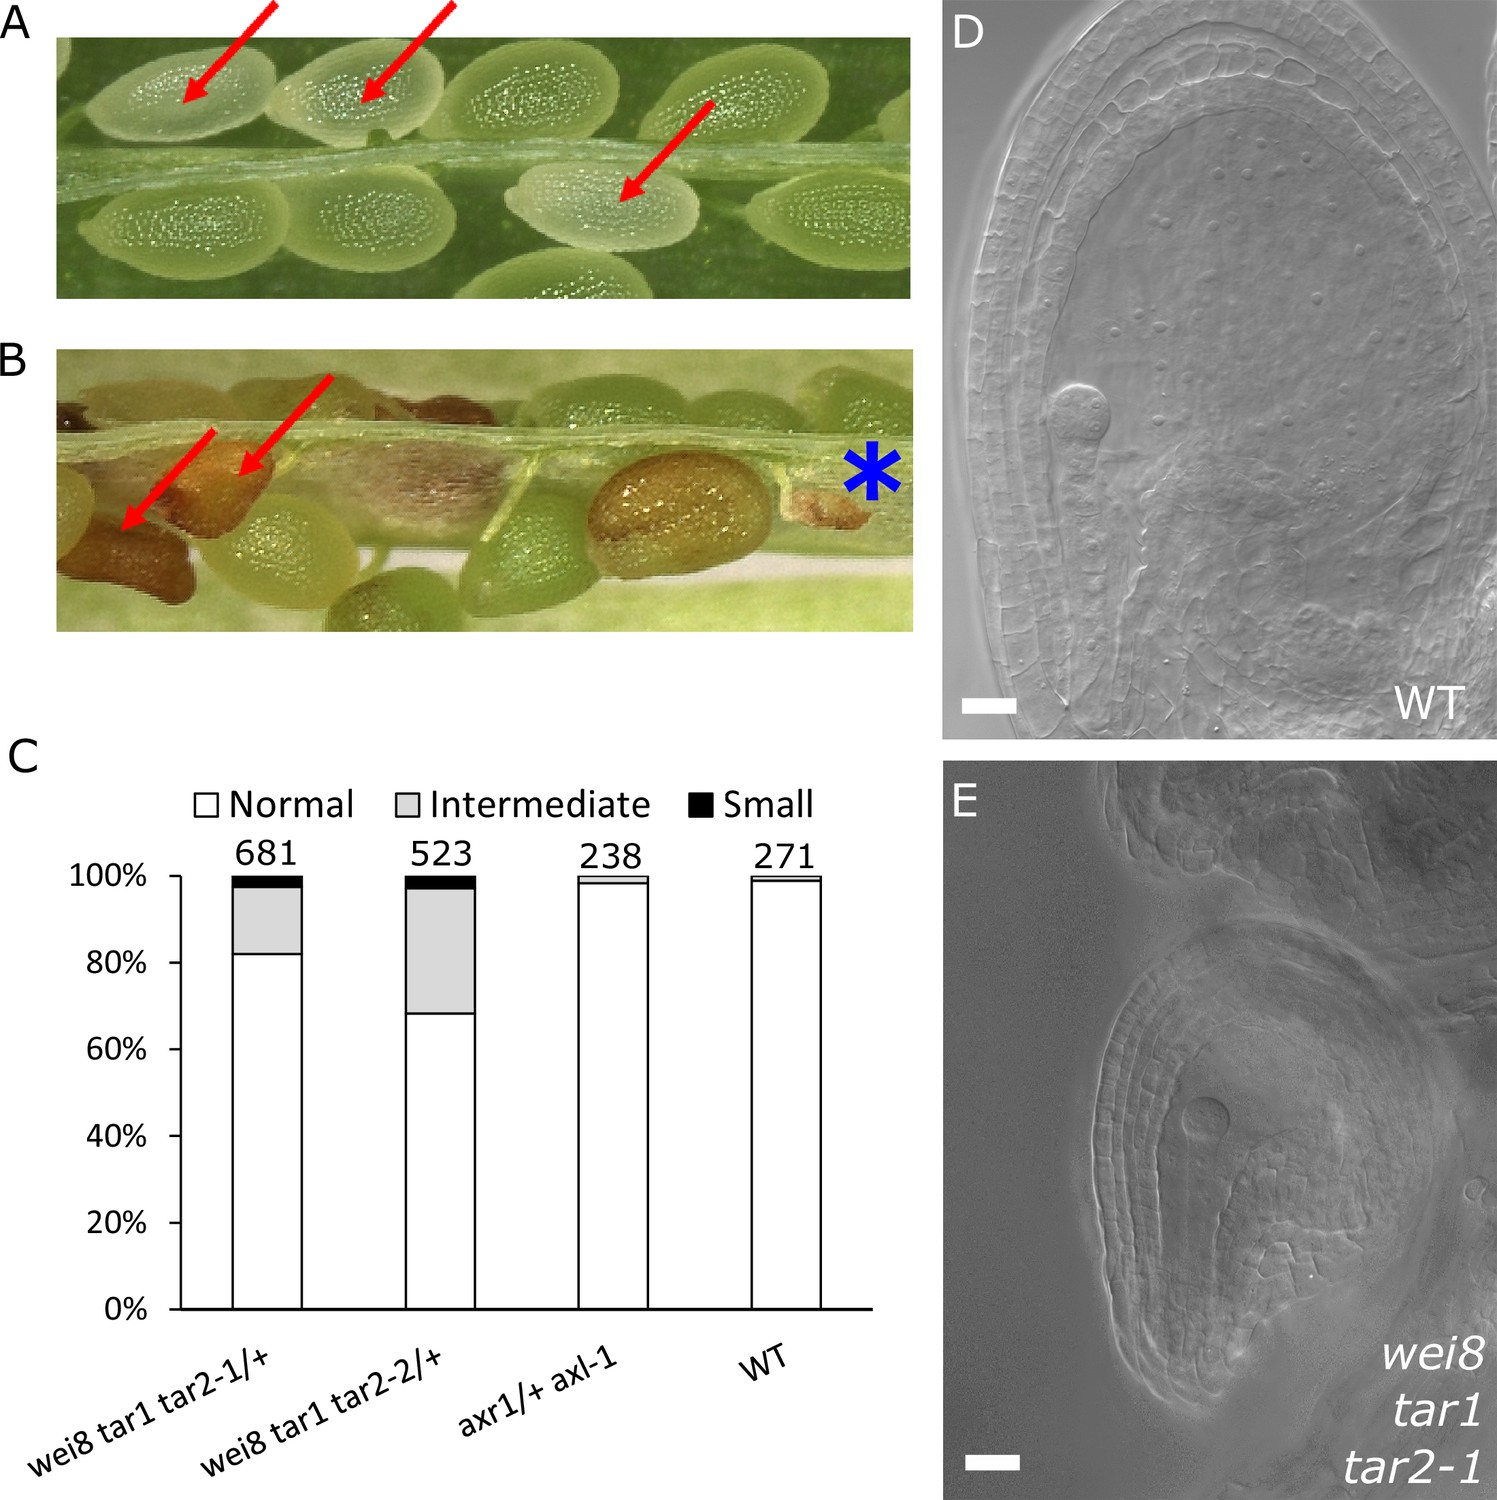
(A) Opened silique of an axr1 axl-1/+ mutant showing aborting white seeds (red arrows) that undergo full seed coat development. (B) Opened silique of a wei8 tar1 tar2-1/+ mutant showing seeds that do not develop a seed coat (asterisk) and seeds aborting at an intermediate stage compared to WT (red arrows). (C) Determination of final seed size in auxin biosynthesis and signaling mutants and WT. Numbers on top indicate total seeds counted. (D) WT seed at 2 DAP, showing a developed seed coat. (E) wei8 tar1 tar2-1 seed at 2 DAP that failed to develop seed coat. Bars indicate 20 µm.
Figure 3—figure supplement 1
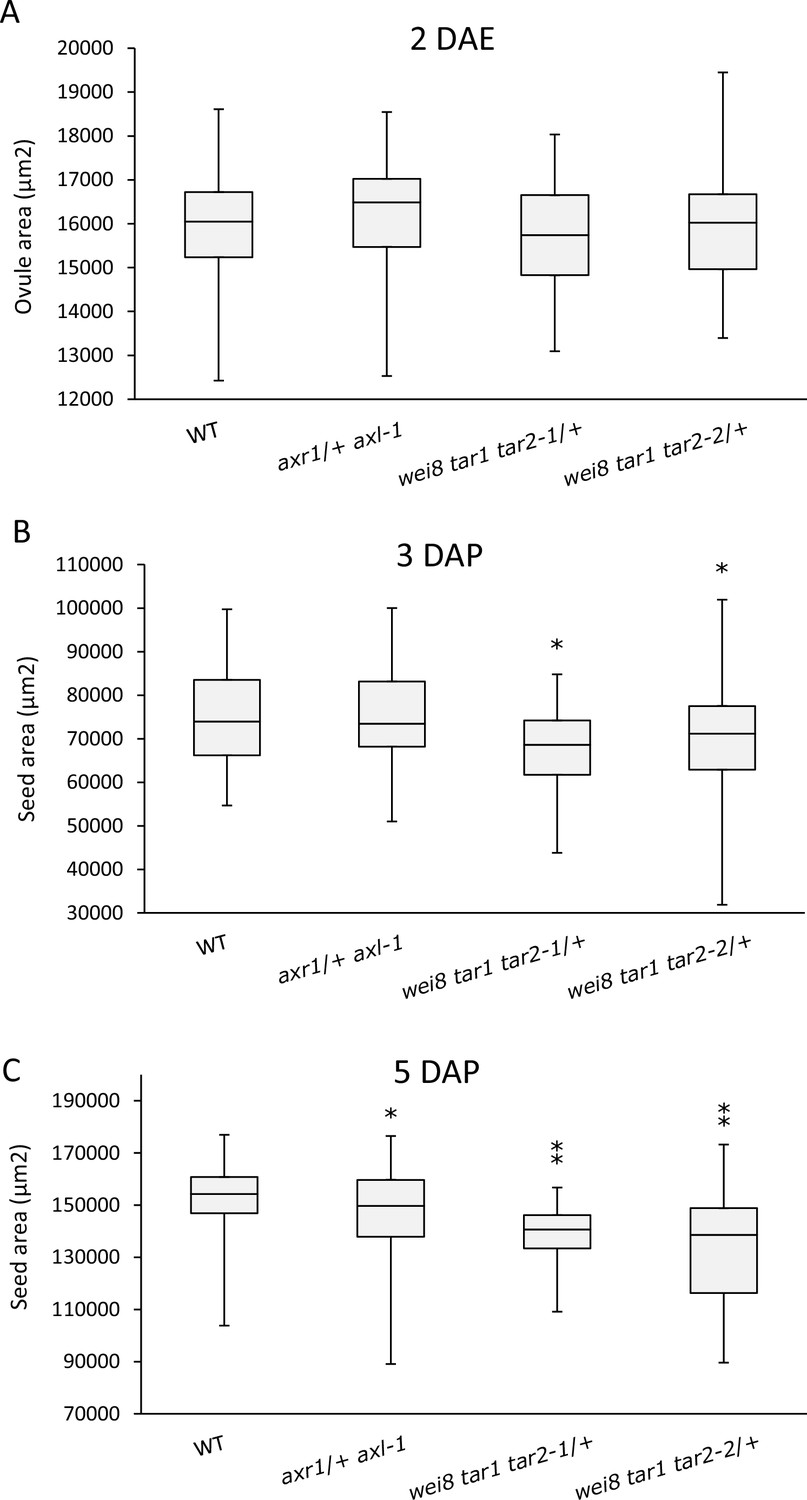
Seed size is affected in auxin mutants.
Area of 2 DAE ovules (A), 3 DAP (B) and 5 DAP (C) seeds was determined for WT, axr1/+ axl-1 auxin signalling mutant and wei8 tar1 tar2-1/+ and wei8 tar1 tar2-2/+ auxin biosynthesis mutants. Sample size n = 50 for each box. Asterisks indicate significant differences when compared to WT, for t-test p<0.05(*) or p<0.0001(**).
Figure 4 with 1 supplement
Auxin production in the central cell triggers seed coat development.
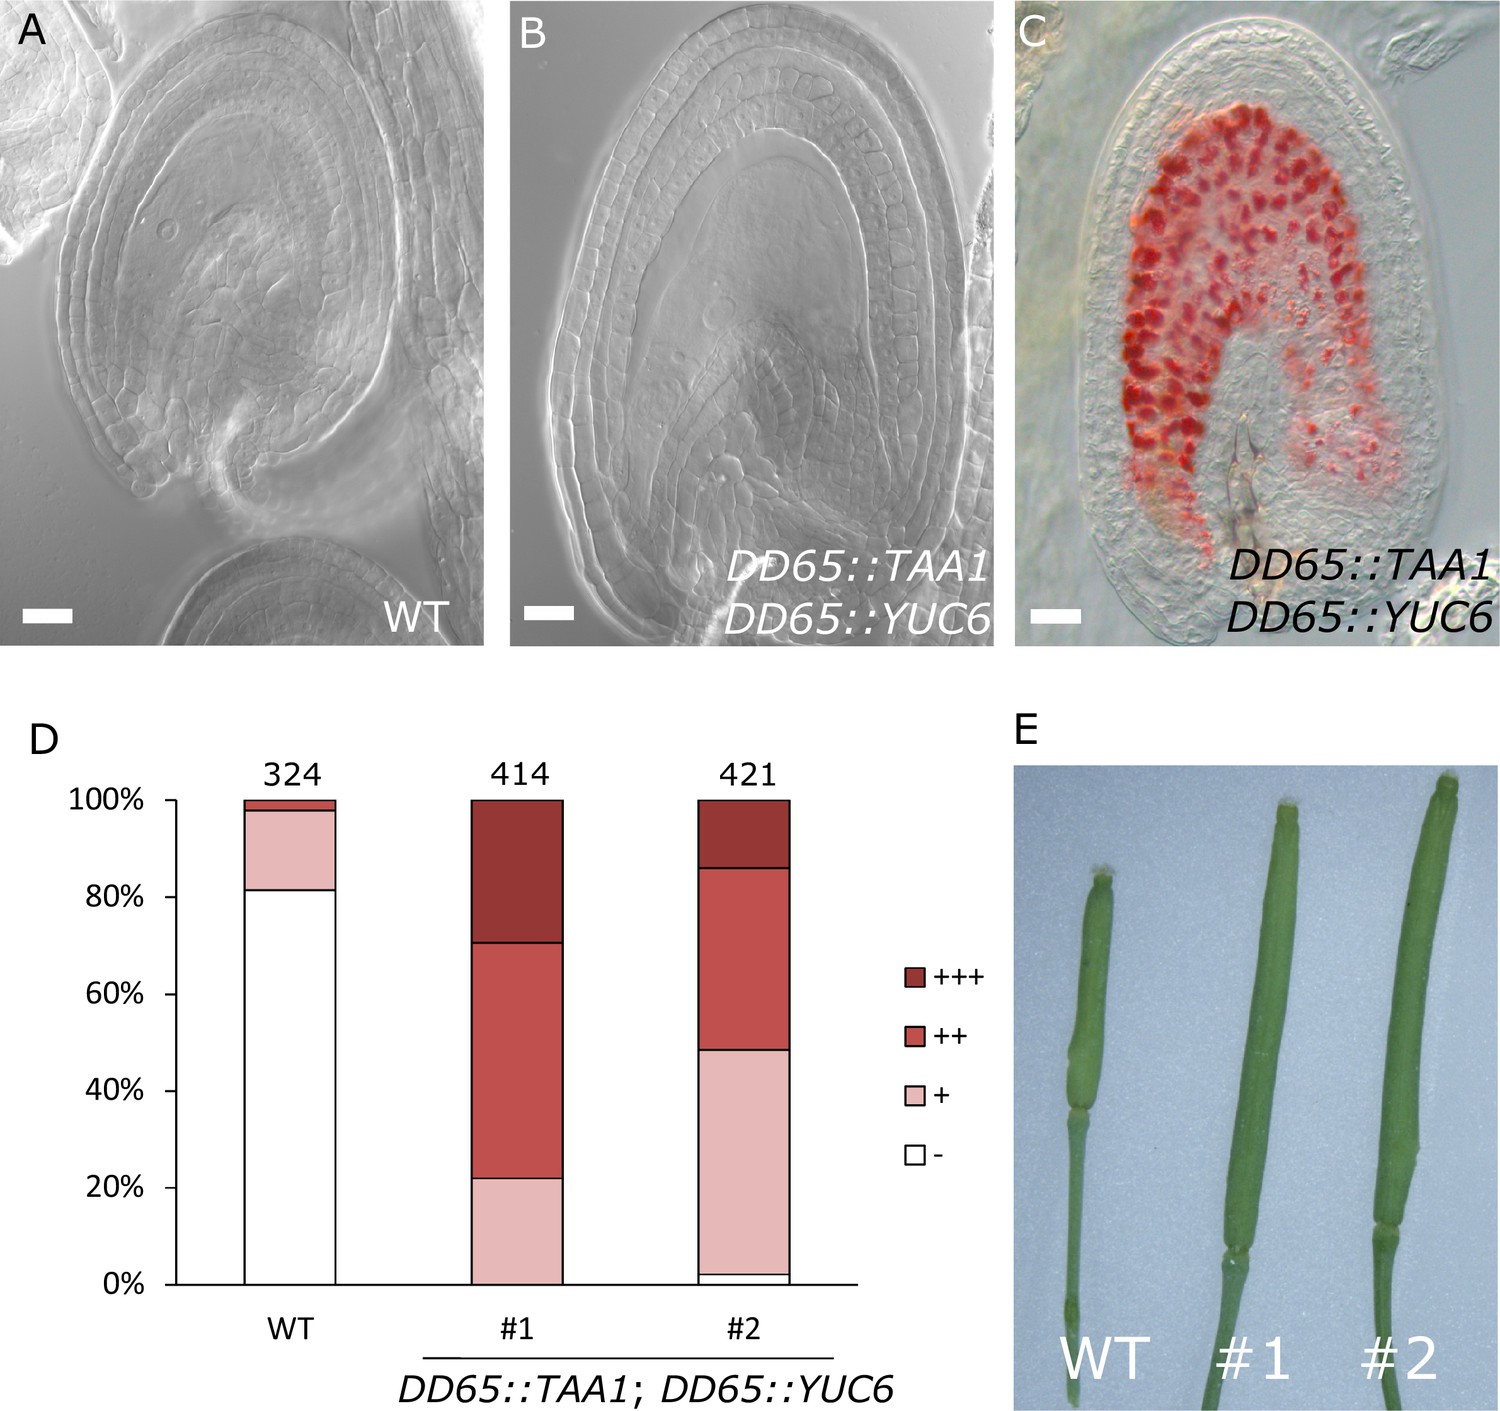
(A–B) Ovule development at 5 DAE: (A) WT and (B) DD65::TAA1; DD65::YUC6. (C) Vanillin-stained ovules of DD65::TAA1; DD65::YUC6 at 5 DAE. Bars indicate 20 µm. (D) Scoring of vanillin staining in WT and two independent transgenic lines expressing DD65::TAA1; DD65::YUC6. The scoring was done as indicated in Figure 2B. Numbers on top indicate total ovules counted. (E) Pistil size in WT and the two transgenic lines expressing DD65::TAA1; DD65::YUC6 at 5 DAE.
Figure 4—figure supplement 1
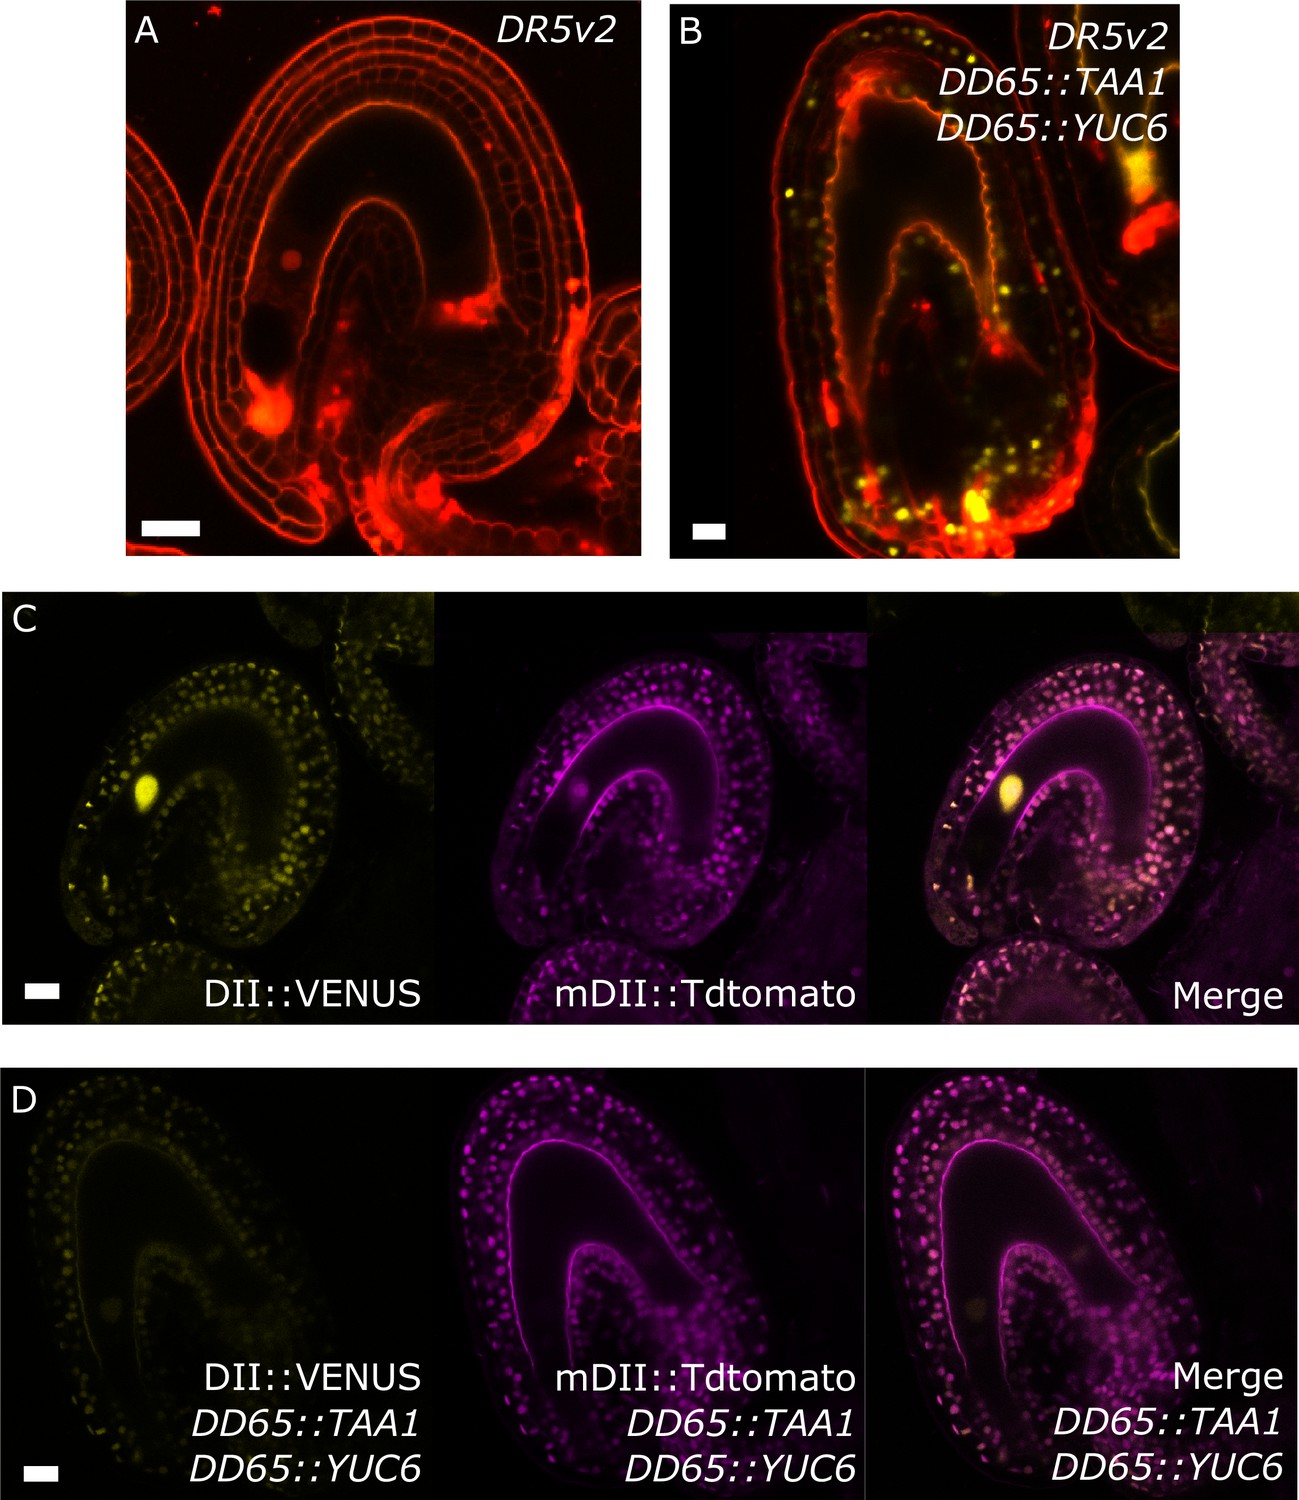
Auxin reporters in the DD65::TAA1 DD65::YUC6 transgenic lines.
(A–D) DR5v2 (A–B) and R2D2 (C–D) activity in WT (A,C) and auxin over-producing line (B,D). All samples taken at 5 DAE. Bars indicate 20 µm.
Figure 5 with 1 supplement
agl62 seeds fail to develop a seed coat.
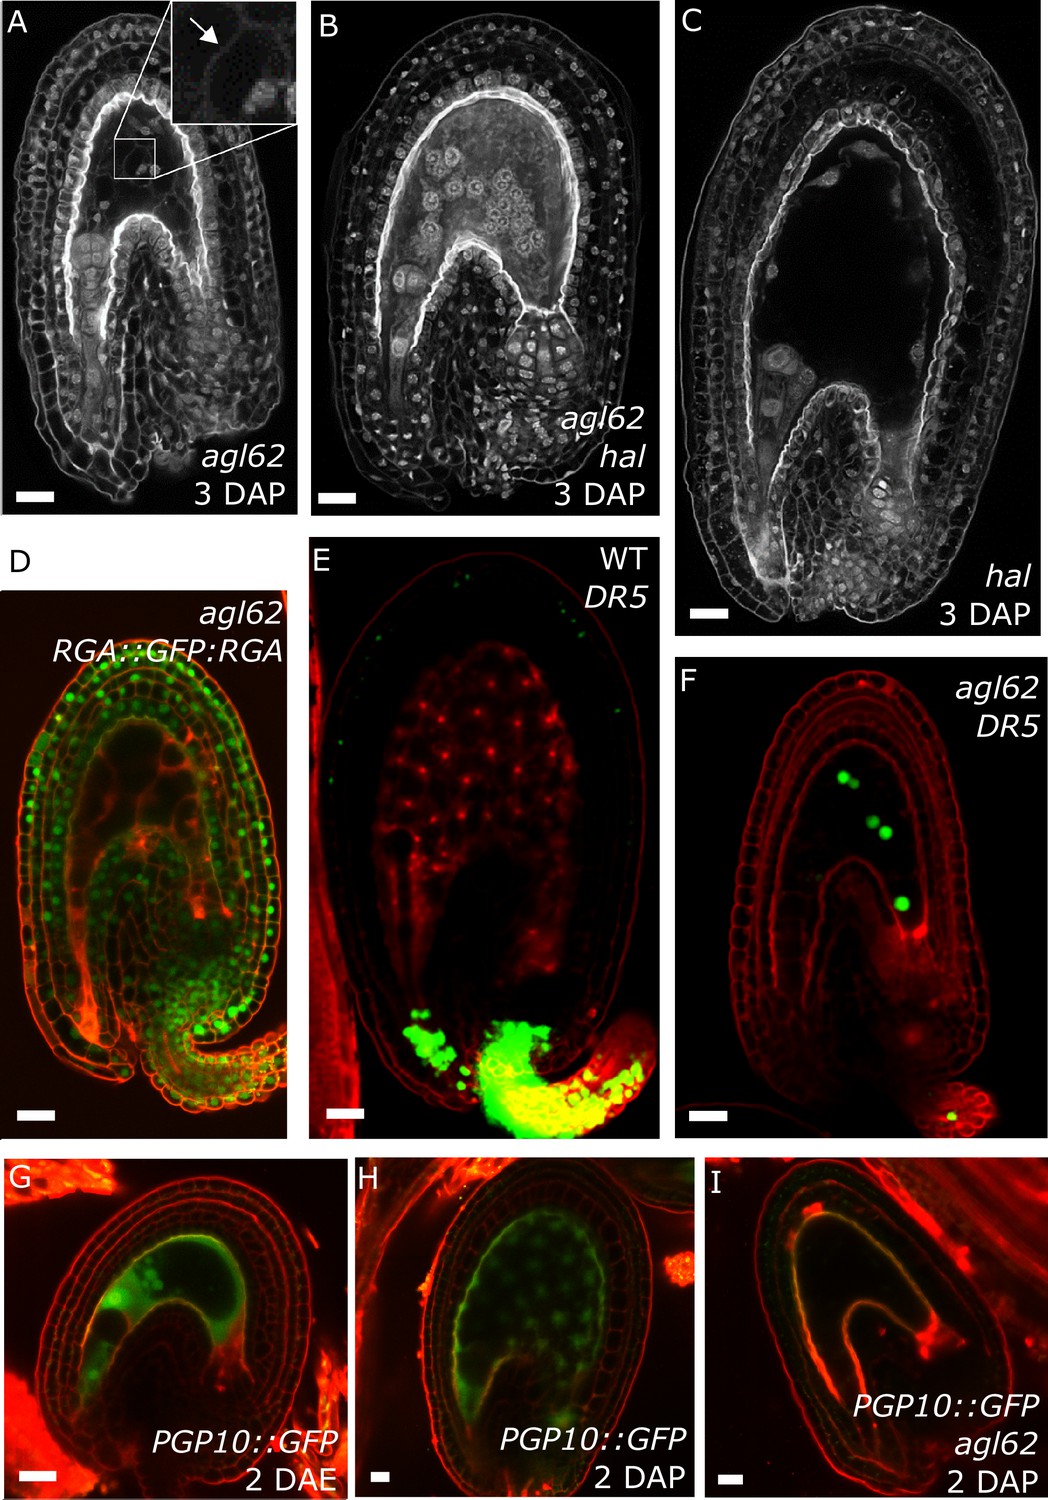
(A–C) Endosperm cellularization as determined by Feulgen staining in agl62 (A), agl62 hal (B) and hal (C) seeds at 3 DAP. Inlay in (A) shows cellularized endosperm (arrow indicates cell wall). (D) Expression of RGA::GFP:RGA in agl62 mutant seeds at 1 DAP. See Figure 1 for expression of the same reporter in WT seeds. (E–F) DR5::VENUS expression in WT (E) and agl62 (F) seeds at 3 DAP. (G–I) PGP10::GFP expression in ovules (G) and in WT (H) and agl62 (I) seeds at 2 DAP. Bars indicate 20 µm. Red staining is PI.
Figure 5—figure supplement 1
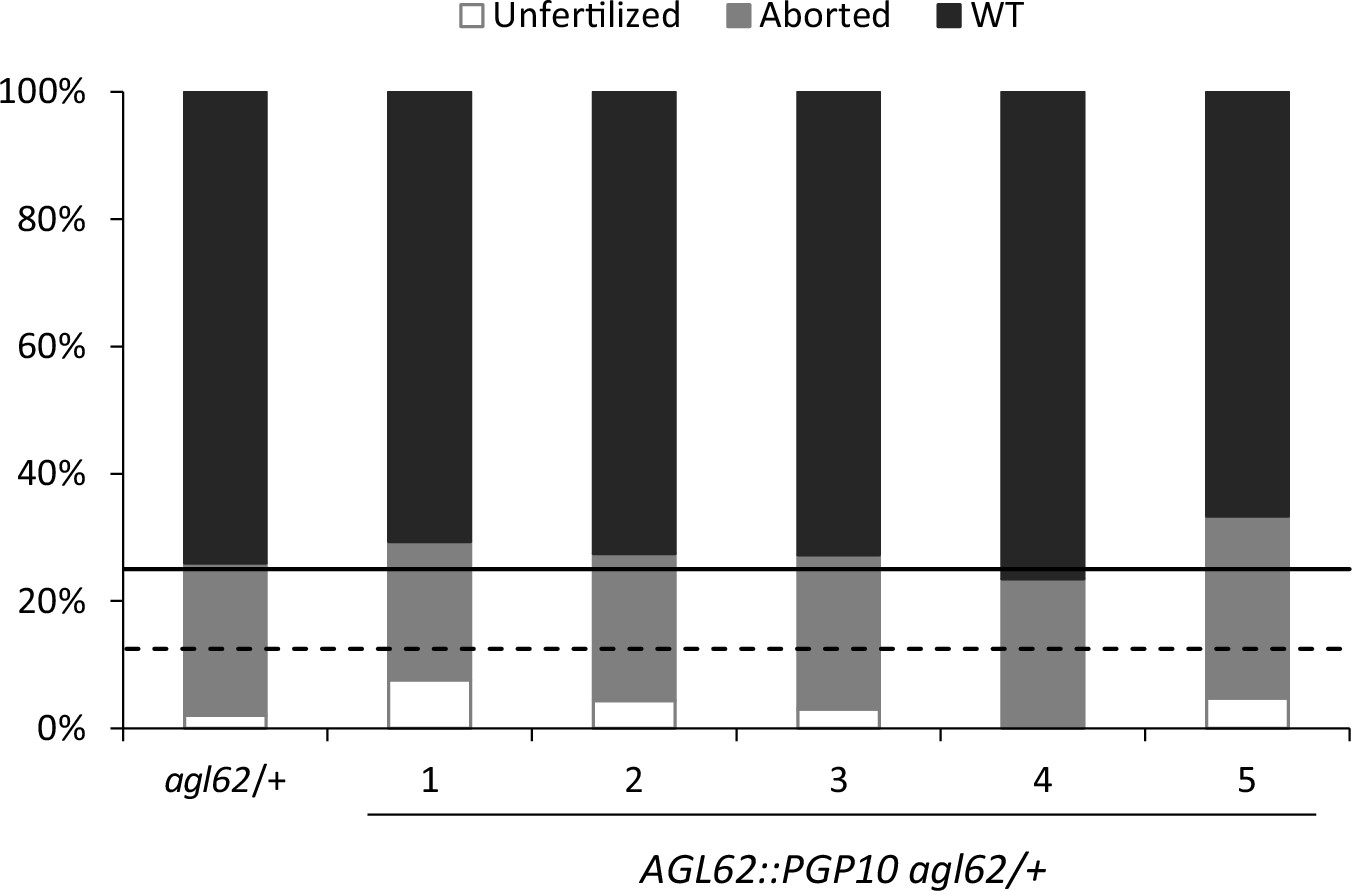
Seed abortion in agl62 expressing AGL62::PGP10.
Seed abortion rate of five independent T1 transgenic lines expressing AGL62::PGP10 in the agl62/+ mutant background. The full horizontal line indicates the expected seed abortion level in agl62/+ (25% of total seeds) and the dashed line represents expected seed abortion in T1 individuals where the AGL62::PGP10 construct is heterozygous (12.5% of total seeds). Seed abortion was scored at 3 DAP, in three manually dissected siliques per line. The five lines shown here are representative of 25 total analyzed lines.
Figure 6 with 2 supplements
PRC2 and auxin work in the same pathway during seed coat development.
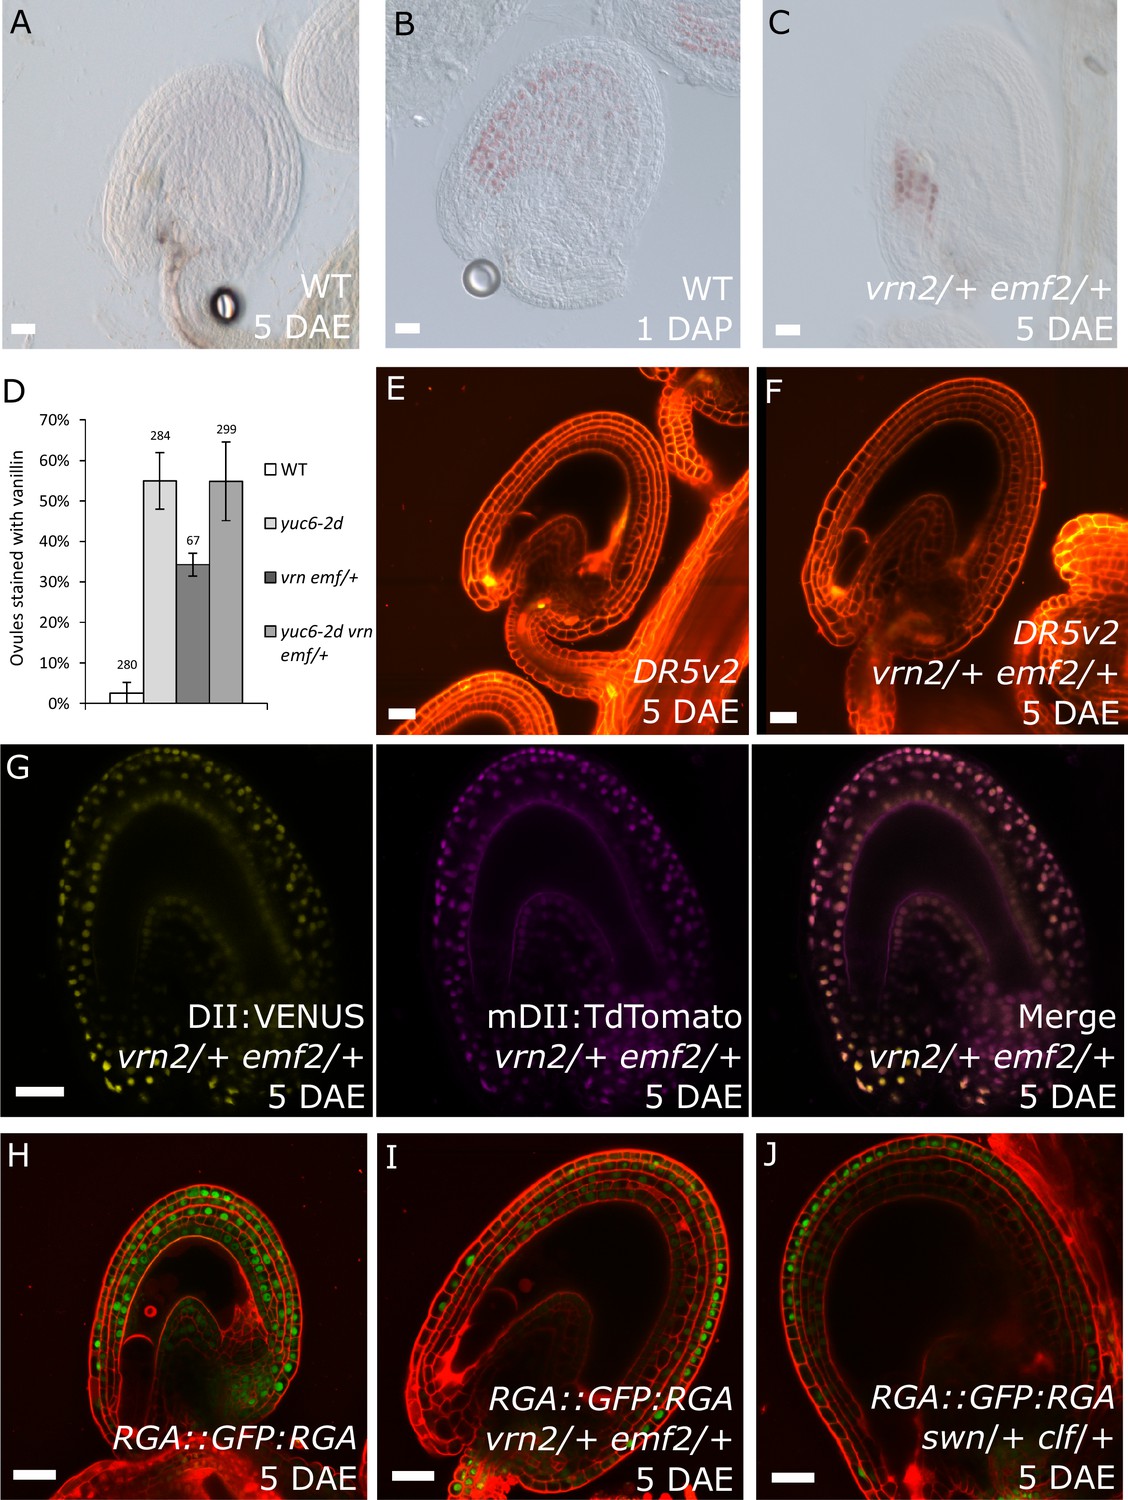
(A–C) Vanillin-stained WT ovule at 5 DAE (A), WT seed at 1 DAP (B) and vrn2/+ emf2/+ autonomous seed at 5 DAE (C). (D) Percentage of vanillin-stained ovules per silique at 6 DAE in WT and mutant lines. Bars indicate standard deviation. (E–F) DR5v2::VENUS activity in WT (E) and vrn2/+ emf2/+ (F) unfertilized ovules at 5 DAE. Red is PI. See also Figure 1 for DR5v2::VENUS activity in fertilized seeds. (G) R2D2 reporter activity in autonomous seeds of PRC2 mutant vrn2/+ emf2/+ at 5 DAE. See also Figure 1. (H–J) RGA::GFP:RGA activity at 5 DAE in WT ovules (H) or autonomous seeds of mutants for sporophytic PRC2 components: vrn2/+ emf2/+ (I) and swn/+ clf/+ (J). Red staining is PI. Bars indicate 20 µm.
Figure 6—figure supplement 1
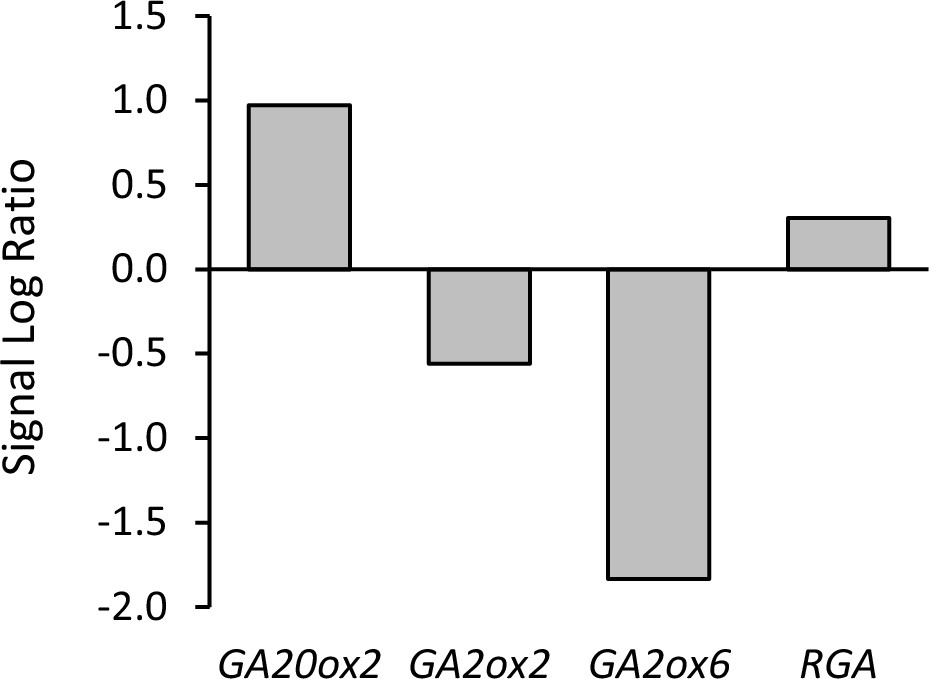
Relative expression of genes involved in GA biosynthesis (GA20ox2), GA catabolism (GA2ox2 and GA2ox6) and GA signaling (RGA) between vrn2 emf2/+ and WT ovules.
Data show signal log ratios between vrn2 emf2/+ and WT ovules at 4 DAE, as indicated in Table 1—source data 1. Expression differences are statistically significant (q < 0.01).
Figure 6—figure supplement 2
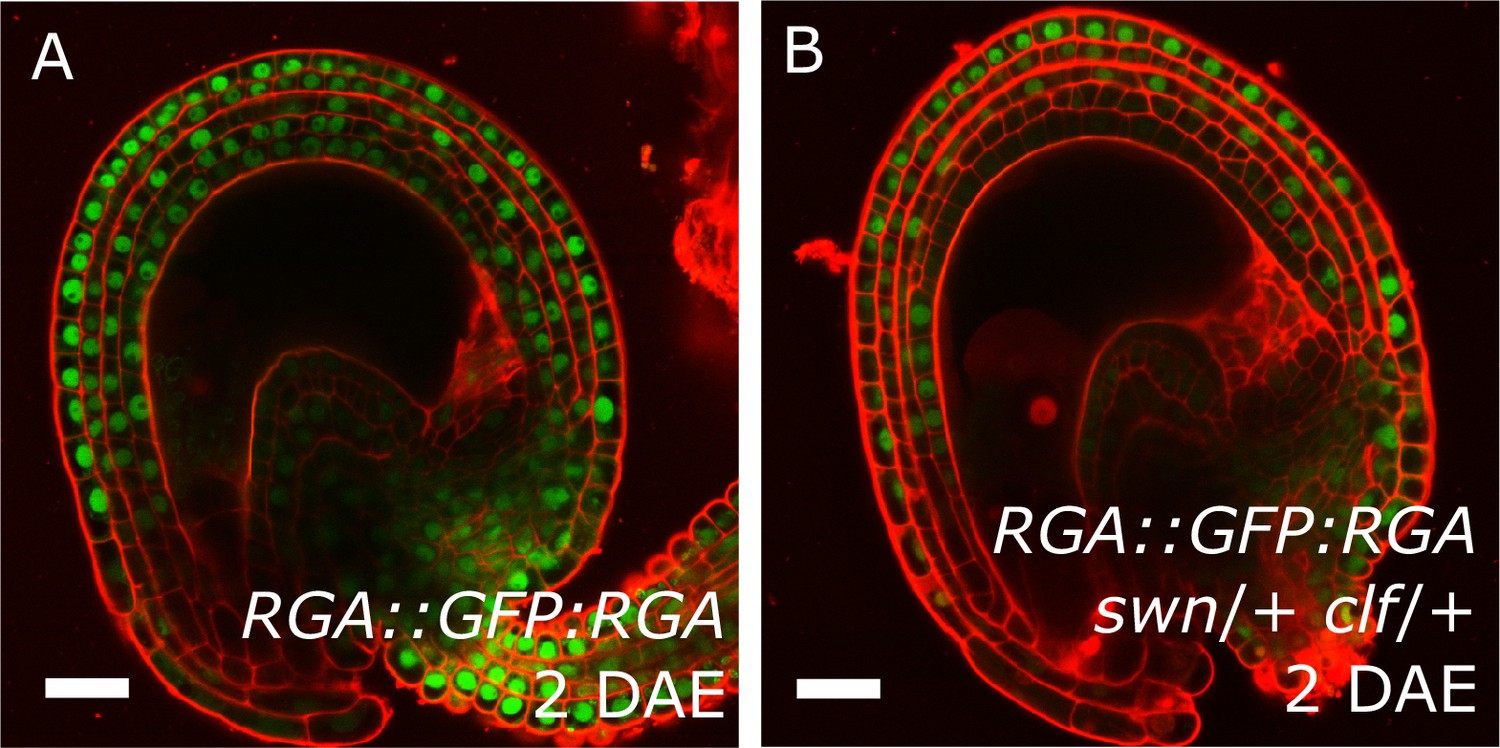
Expression of the RGA reporter in unfertilized ovules.
RGA::GFP:RGA activity at 2 DAE in WT (A) and swn/+ clf/+ ovules (B). Red staining is PI. Bars indicate 20 µm.
Figure 7 with 1 supplement
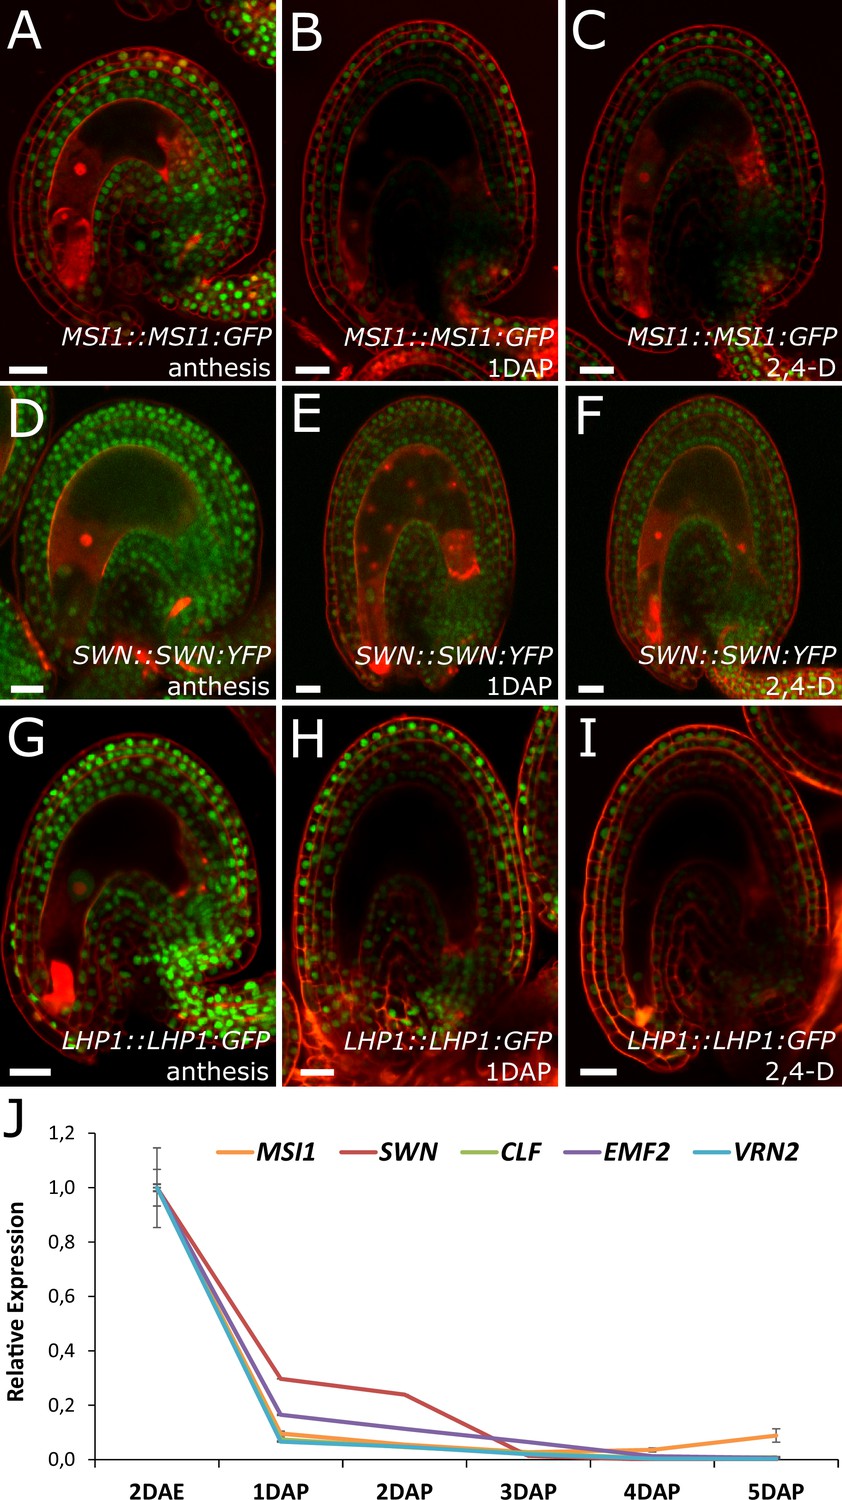
PcG activity is reduced in the developing seed coat.
(A–I) Expression of MSI1:MSI1::GFP (A–C), SWN:SWN::GFP (D–F) and LHP1:LHP1::GFP (G–I) reporters in 2 DAE ovules (A,D and G), 1 DAP seeds (B,E and G) and 2,4-D treated ovules at 3 DAE (C, F and I). For mock controls see figure supplement 1. Red staining is PI. Bars indicate 20 µm. (J) Relative expression of sporophytic PRC2 genes during seed development, as determined by RT-qPCR. Gene expression was measured at 2DAE and from 1 to 5 DAP and was normalized to the 2 DAE time-point. Error bars indicate standard deviation.
Figure 7—figure supplement 1
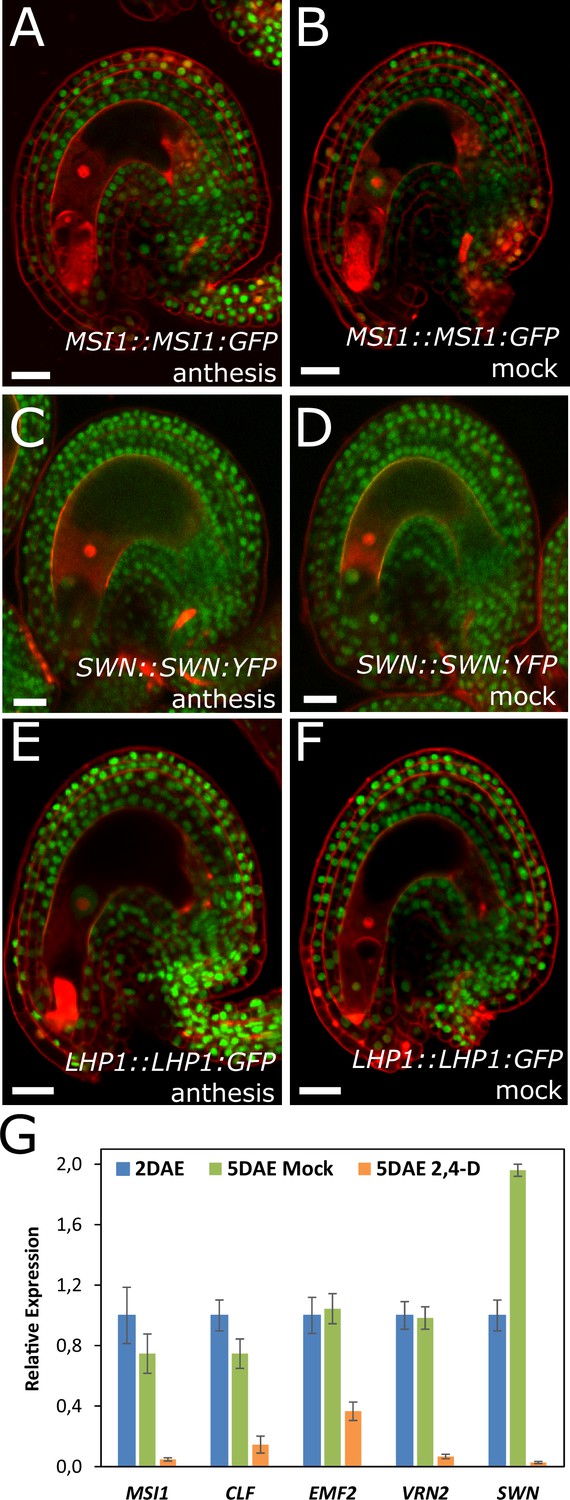
Expression of PcG reporters in unfertilized ovules.
(A–F) Expression of MSI1:MSI1::GFP (A–B), SWN:SWN::GFP (C–D) and LHP1:LHP1::GFP (E–F) reporters at anthesis (A,C and E) and mock-treated ovules at 3 DAE (B, D and F). Red staining is PI. Bars indicate 20 µm. (G) Relative expression of sporophytic PRC2 genes in unfertilized ovules following auxin treatments, as determined by RT-qPCR. Gene expression was measured at 2 DAE and three days following either 2,4-D or mock treatments (5 DAE) and was normalized to the 2 DAE time-point. Error bars indicate standard deviation.
Figure 8

Model for the post-fertilization mechanism driving seed coat development.
Before fertilization (left panel) sporophytic PRC2 represses seed coat developmental pathways. The fertilization of the central cell (middle panel) results in the production of auxin that is exported to the integuments, lifting the PRC2 block on seed coat development and allowing for cell elongation and differentiation. However, this process is highly dependent on the activity of the transcription factor AGL62, since agl62 seeds fail to export auxin from the endosperm. This leads to auxin accumulation and consequently, failure to develop a seed coat (right panel). We propose that AGL62 activity is important for the expression, and eventually for the activity, of endosperm-specific auxin-exporters.
Tables
Table 1
Significantly enriched biological processes for genes commonly upregulated in fertilized WT and autonomous vrn2 emf2/+ seeds, compared to unfertilized WT ovules (p-value<0.05).
GO-term | p-value | Number of genes | Description |
|---|---|---|---|
GO:0016043 | 2,12E-10 | 63 | cell organization and biogenesis |
GO:0006412 | 2,17E-09 | 66 | translation |
GO:0009058 | 1,46E-07 | 96 | biosynthetic process |
GO:0042545 | 1,04E-04 | 10 | cell wall modification |
GO:0009753 | 6,58E-04 | 10 | response to jasmonic acid |
GO:0009739 | 1,80E-03 | 8 | response to gibberellin |
GO:0009605 | 1,94E-03 | 16 | response to external stimulus |
GO:0008361 | 1,98E-03 | 10 | regulation of cell size |
GO:0009861 | 2,09E-03 | 10 | jasmonic acid and ethylene-dependent systemic resistance |
GO:0009611 | 2,60E-03 | 12 | response to wounding |
GO:0016049 | 5,22E-03 | 9 | cell growth |
GO:0006694 | 7,68E-03 | 4 | steroid biosynthetic process |
GO:0007155 | 8,49E-03 | 4 | cell adhesion |
GO:0009723 | 1,02E-02 | 8 | response to ethylene |
GO:0009733 | 1,46E-02 | 12 | response to auxin |
GO:0007267 | 1,81E-02 | 3 | cell-cell signaling |
GO:0007276 | 1,96E-02 | 6 | gamete generation |
GO:0009698 | 2,51E-02 | 7 | phenylpropanoid metabolic process |
GO:0009813 | 2,60E-02 | 4 | flavonoid biosynthetic process |
GO:0009812 | 3,53E-02 | 4 | flavonoid metabolic process |
-
Table 1—source data 1
Seed and ovule transcriptome data.
This table includes absolute and relative gene expression values for the microarray data of WT vs. vrn2/- emf2/+ ovules and seeds, and for the mRNAseq data of WT vs. agl62/+ seeds.
- https://doi.org/10.7554/eLife.20542.004
Table 2
Primer sequences.
Used for | Gene | Sequence 5’ - > 3’ * | |
|---|---|---|---|
RT-qPCR | AT5G58230 (MSI1) | fw | GCCCAAGTTCAGCTTCCTCT |
rv | TTTGTACCTTTCCAGTTGCACA | ||
AT4G02020 (SWN) | fw | CAACTCCTCTGGACGAATCAAG | |
rv | TCTGTTTTCCAAACCCTCGAGTC | ||
AT4G16845 (VRN2) | fw | TCATTCTCACAGAGTCCAGCC | |
rv | AGTCATCAAGCATCTGGCGAT | ||
AT5G51230 (EMF2) | fw | CGCACTTGATTTGGTGCTGG | |
rv | TGTTCATGGTTCGGGCATCA | ||
AT2G23380 (CLF) | fw | AAGTACTGCGGTTGCCCAAA | |
rv | ACATTCCCGATCTGCAGCAA | ||
Cloning | AT1G15550 (GA3ox1) | fw | GGGGACAAGTTTGTACAAAAAAGCAGGCTGCAAGATGCCTGCTATGTTA |
rv | GGGGACCACTTTGTACAAGAAAGCTGGGTATCTAATCATTCTTCTCTGTGATTTCT | ||
AT1G61720 (promBAN) Gateway | fw | GGGGACAAGTTTGTACAAAAAAGCAGGCTGAGCTCTAACAGAACCTTACTGTAACACT | |
rv | GGGGACCACTTTGTACAAGAAAGCTGGGTACTAGTGAGTCTGGTCCATGGTTGTA | ||
AT1G61720 (promBAN) In-Fusion | fw | CCATGGCCGCGGGATATCAGATTCTTAGGTGAAGACAAG | |
rv | CGCTGAATGATTCATGATTGTACTTTTGAAATTACAG | ||
GFP | fw | ATGAATCATTCAGCGAAAACC | |
rv | CTTCACCTAAGAATCCATCTAGTAACATAGATGACA | ||
AT1G10680 (promPGP10) | fw | GGGGACAAGTTTGTACAAAAAAGCAGGCTGGCGTTGCGTATAATCCGTT | |
rv | GGGGACCACTTTGTACAAGAAAGCTGGGTTTTCACTTTTGGATATGGAGAGA | ||
At5G60440 (promAGL26) | fw | TAAGCAGAGCTCGAATTGCATCTCGGCAATGAC | |
rv | TGCTTAACTAGTTTTTAGTGATATTTGAGAAGCT | ||
AT1G10680 (PGP10) | fw | GGGGACAAGTTTGTACAAAAAAGCAGGCTATGCAACCGTCAAATGATCCAG | |
rv | GGGGACCACTTTGTACAAGAAAGCTGGGTTTAAGGATGATGGCGCTGC | ||
-
*Primer adapters are underlined
Download links
A two-part list of links to download the article, or parts of the article, in various formats.
Downloads (link to download the article as PDF)
Open citations (links to open the citations from this article in various online reference manager services)
Cite this article (links to download the citations from this article in formats compatible with various reference manager tools)
Auxin production in the endosperm drives seed coat development in Arabidopsis
eLife 5:e20542.
https://doi.org/10.7554/eLife.20542


