The packing density of a supramolecular membrane protein cluster is controlled by cytoplasmic interactions
- Life and Medical Sciences (LIMES) Institute, University of Bonn, Germany
Figures
Figure 1
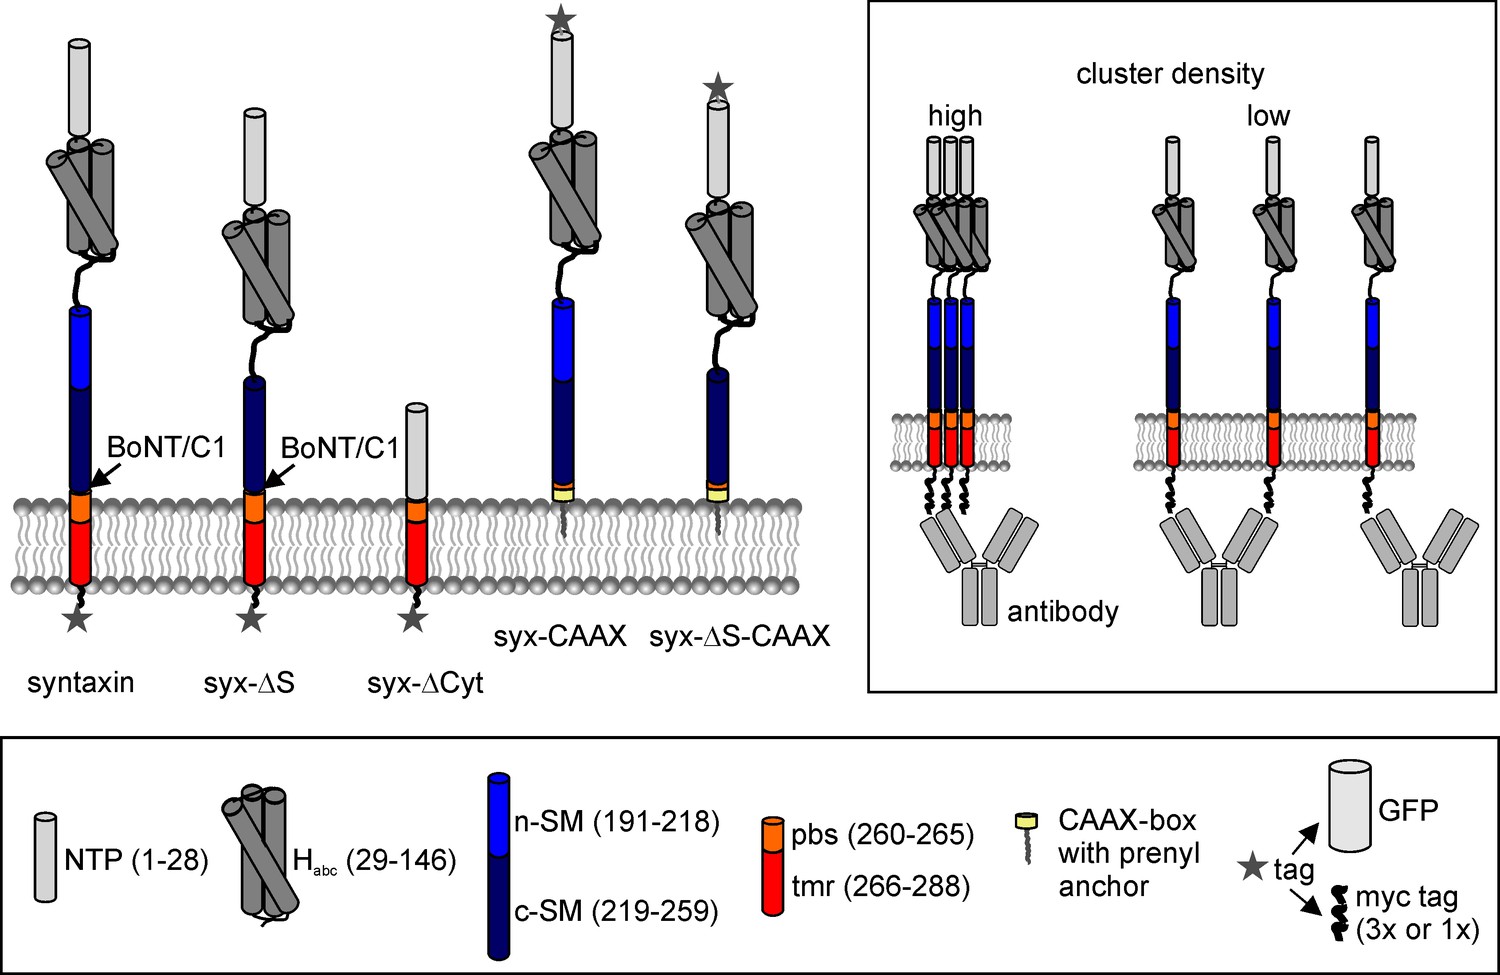
Domain structure of syntaxin 1A and deletion constructs.
Pictogram illustrating the constructs’ domain structure, the botulinum neurotoxin C1 (BoNT/C1) cleavage site and the tag positions. In case of the CAAX constructs, the TM domain and parts of the pbs were exchanged for a CAAX box from K-Ras that after prenylation anchors the construct to the plasma membrane. Lower legend; N-terminal short peptide (NTP, grey), globular N-terminal domain (Habc; dark grey), SNARE motif section divided into an N- and a C-terminal part (n-SM and c-SM in blue and dark blue, respectively), polybasic stretch (pbs; orange) and the remaining transmembrane region (tmr; red), and the prenylated CAAX-box (yellow). Two types of tags were used, a monomeric variant of GFP or a triple myc-tag, both fused via a 12 amino acid linker to the extracellular site. The myc-tags were attached to the extracellular site to minimise the possibility of intracellular conformational changes masking the epitope of the myc-tag. The CAAX constructs carry the myc-tag at the N-terminus and were comparatively studied with N-terminally myc-tagged syntaxin (not shown). Upper right box, accessibility of the antibody to the myc-tag depends on the molecule packing density.
Figure 2 with 1 supplement

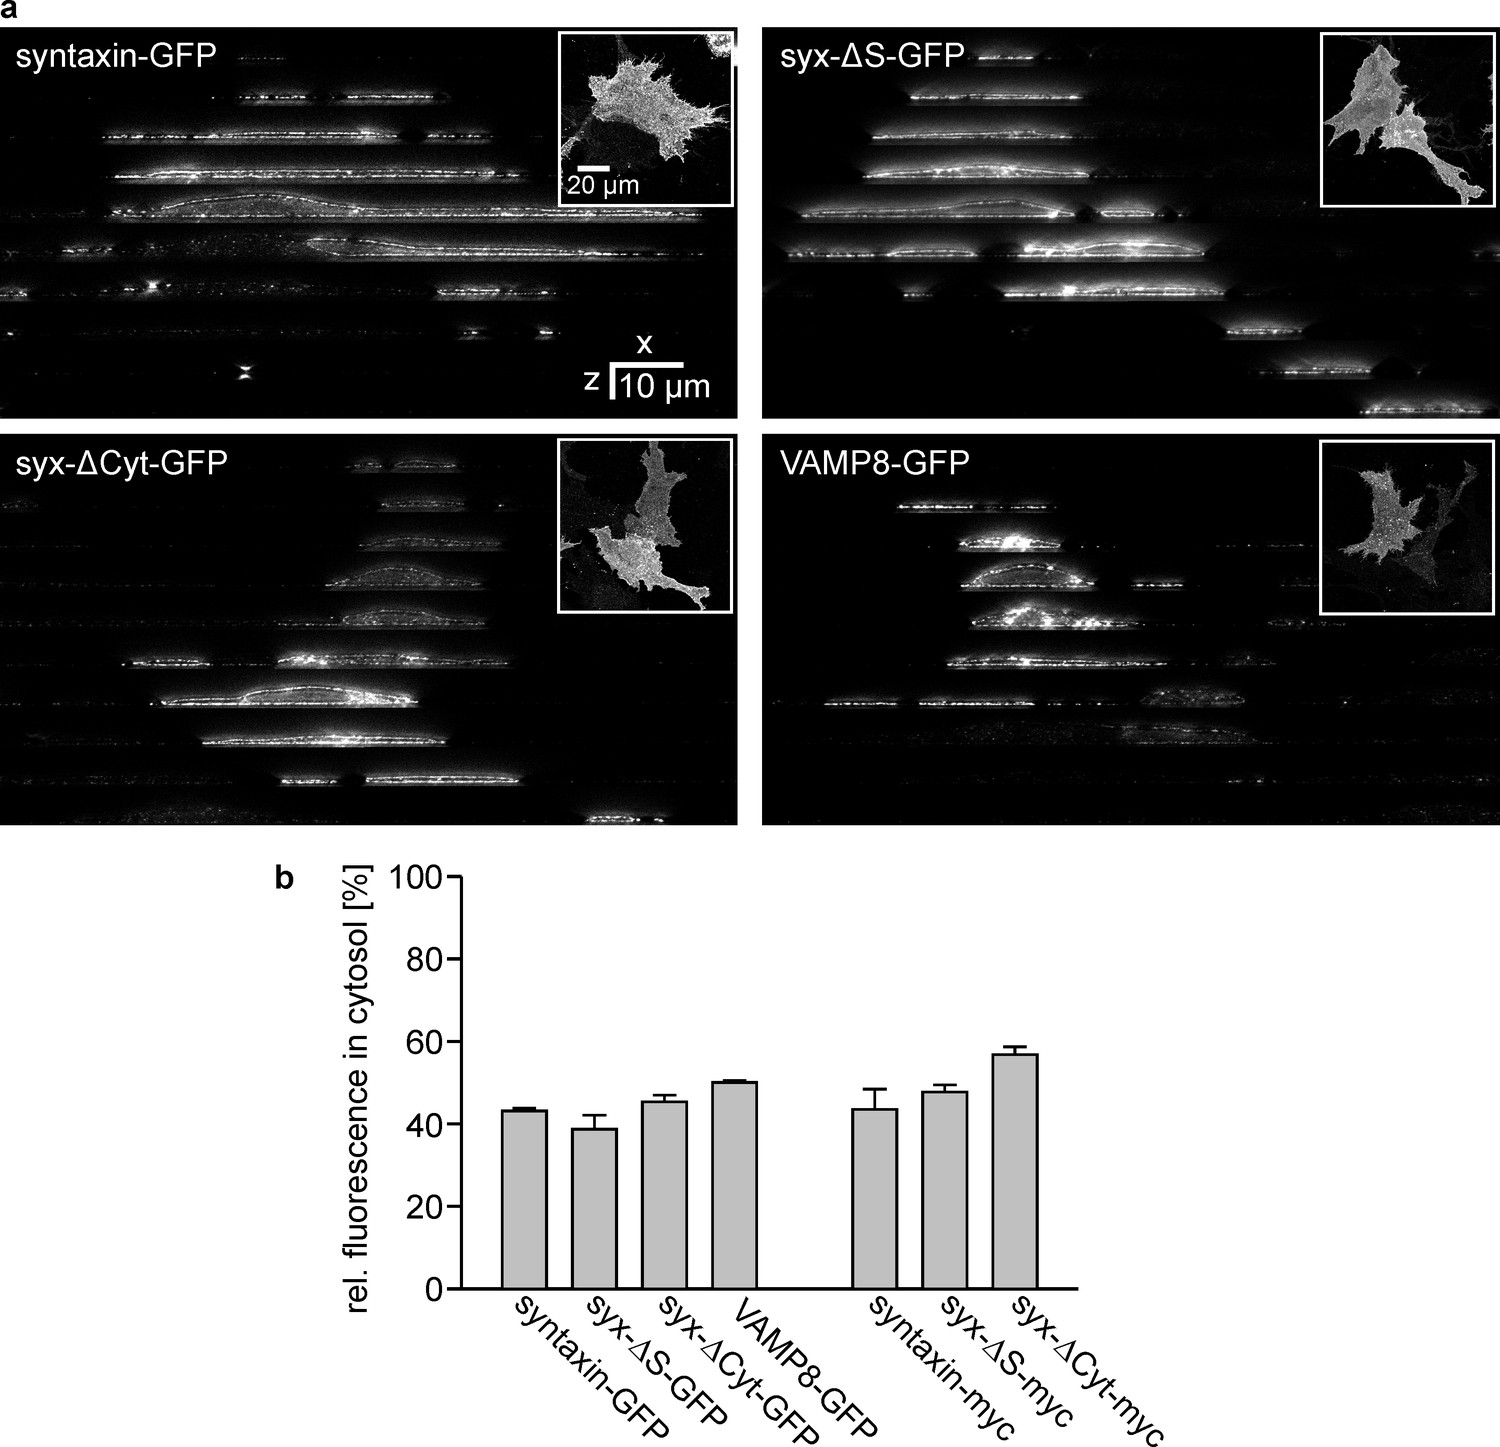
Plasma membrane targeting of the different syntaxin variants.
HepG2 cells expressing GFP-labelled SNAP25, syntaxin, syx-ΔS, syx-ΔCyt, or VAMP8 were incubated at 37°C for 45 min (a) without or (b) with 0.2 µM bafilomycin. The GFP-signal was imaged at pH7.4, followed by another image taken at pH4.3. Images in one column are shown at the same scaling. (c) Remaining cell fluorescence upon acidification is expressed in percent. Values are given as means ± S.E.M. (n = 3 independent experiments; for one experiment values from 16 to 38 cells per construct and condition were averaged).
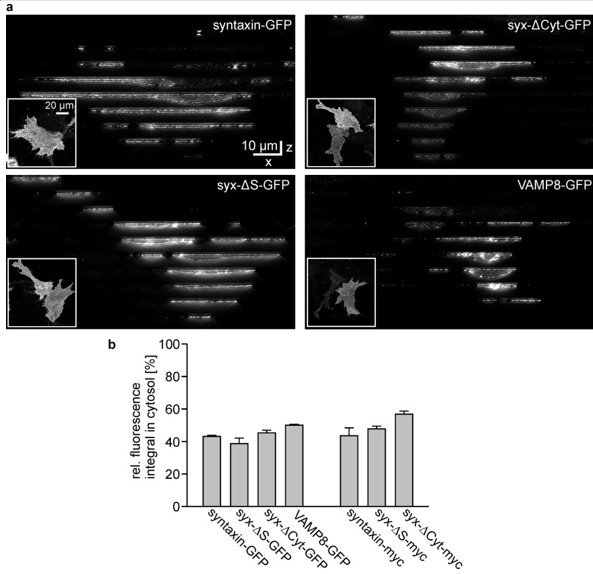
Figure 2—figure supplement 1
Subcellular distribution analysis by STED microscopy.
Cells expressing either syntaxin-GFP, syx-ΔS-GFP, syx-ΔCyt-GFP, VAMP8-GFP, syntaxin-myc, syx-ΔS-myc or syx-ΔCyt-myc were fixed and permeabilised prior to immunostaining with an antibody raised against the respective tag. The plasma membrane was counterstained with fluorescent labelled concanavalin A (not shown). (a) Images from the GFP-labelled constructs. The upper right insets show an x-y overview. Using this overview as reference an x-z slice was imaged every 10 µm (with reference to these overview images from top to bottom; the individual x-z-slices are shown as image collage) by two colour STED microscopy imaging concanavalin A (Alexa594) and the antibody labelling (Atto647). (b) Fraction of the intracellular signal. Values are given as means ± SEM (n = 2–3 independent experiments with 7–26 cells per condition).
Figure 3
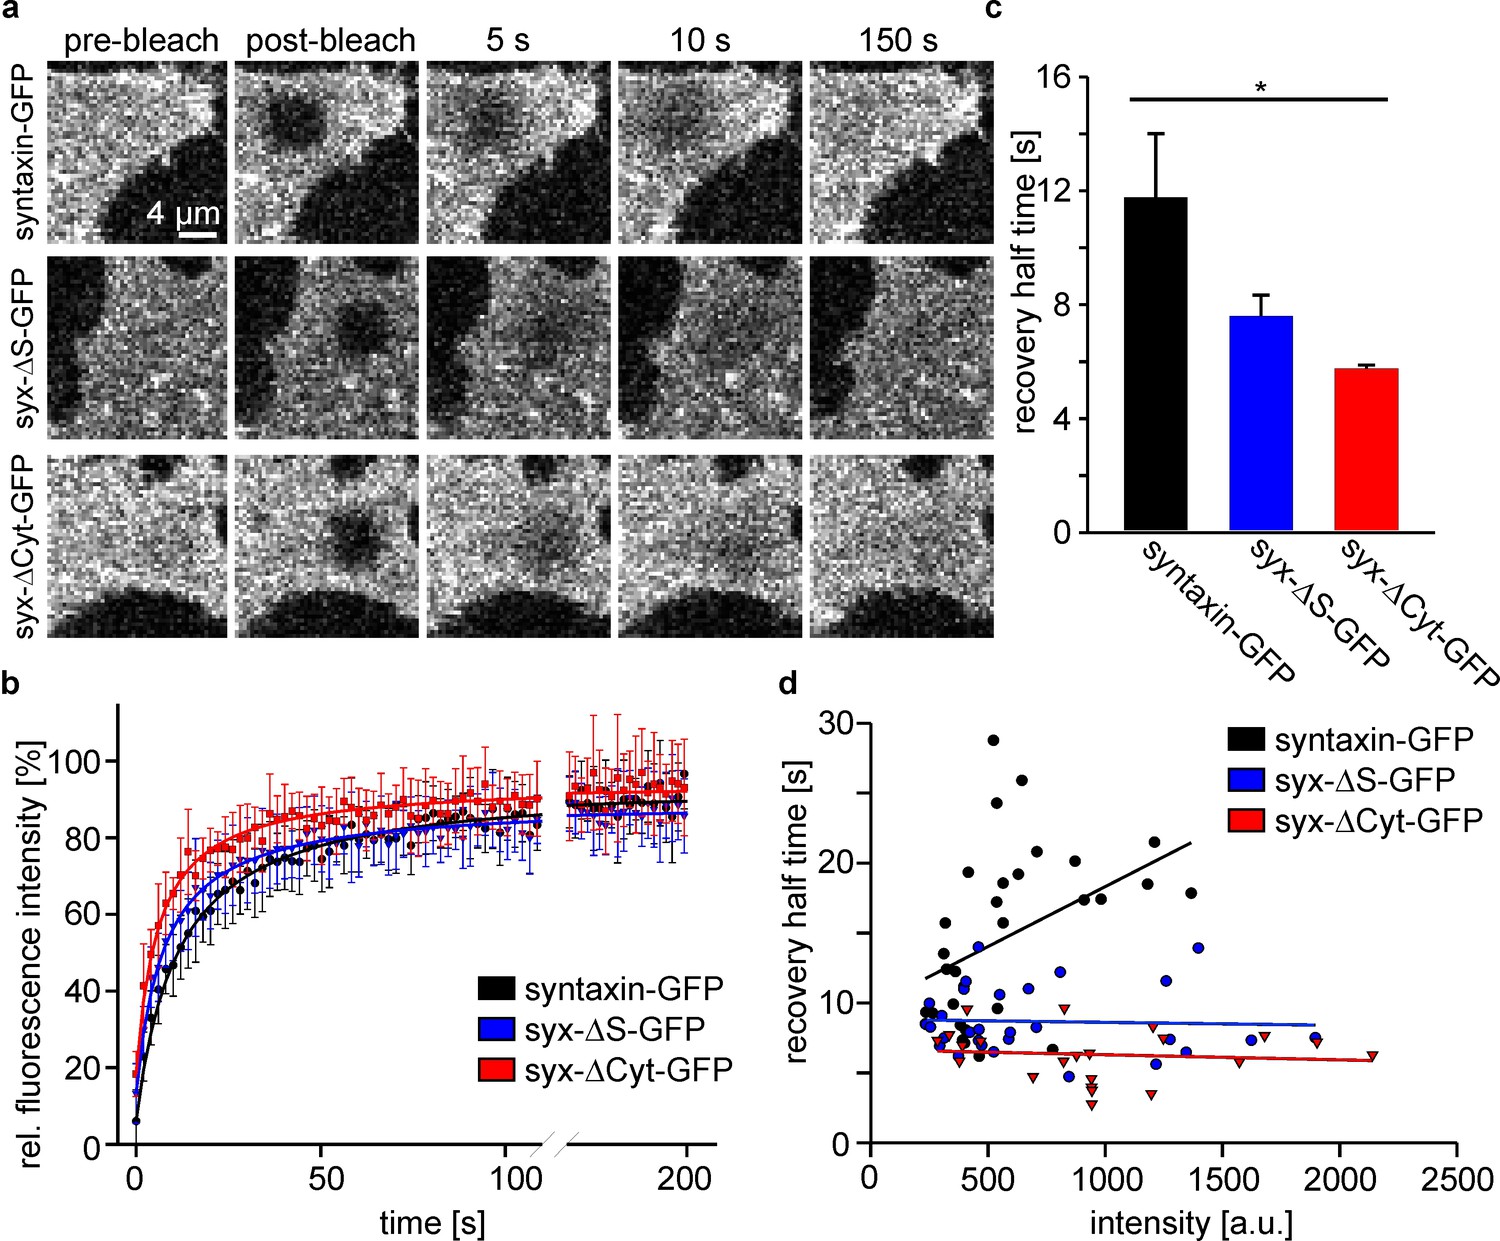
The intact syntaxin SNARE-motif is required for mobility restriction in HepG2 cells.
Comparative fluorescence recovery after photobleaching analysis of GFP-labelled full length syntaxin and the deletion constructs syx-ΔS and syx-ΔCyt (for details see Figure 1). (a) Live cells expressing the indicated constructs are imaged by confocal microscopy at the basal plasma membrane. In a squared region of interest (ROI) fluorescence is bleached (compare pre-bleach and post-bleach images). Then images are taken at 1 Hz for several minutes to monitor the recovery of fluorescence in the ROI whose half-time is inversely proportional to the apparent lateral diffusion coefficient (or molecule mobility). Images are shown at the same scalings. (b) Averaged recovery traces from several cells imaged for one experiment. Values are given as means ± S.D. To better illustrate the traces, only every second point of the measurement is shown. (c) Half-times of recovery obtained by fitting hyperbola functions to traces as shown in (b). Values are given as means ± S.E.M. (n = 3 independent experiments; Kruskal-Wallis one way analysis of variance on ranks (p=0.011; *p<0.05); 8–18 cells per construct and experiment). (d) Half-times of recovery were also determined for individual cells. Values obtained from all experiments were plotted versus the pre-bleach intensity (a relative measure for the expression level). Only for full length syntaxin at higher expression levels a trend is observed towards longer half-times of recovery.
Figure 4
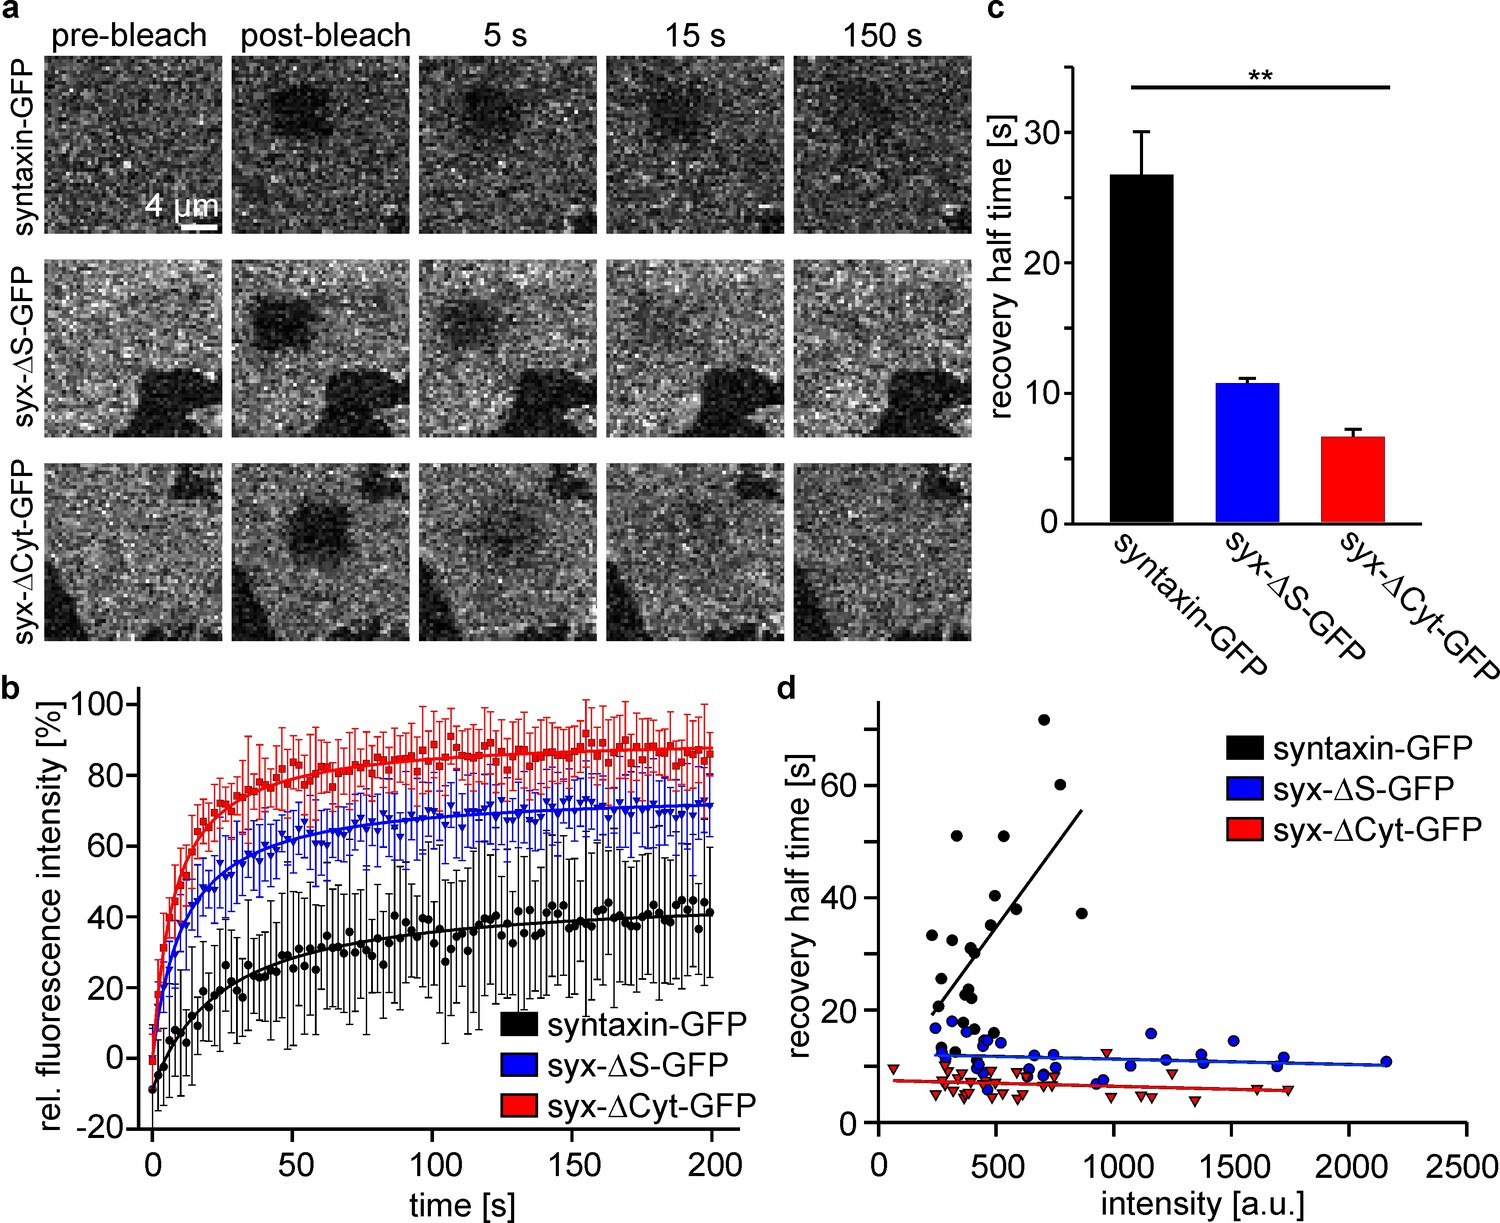
FRAP on membrane sheets shows the same mobility behaviour as in intact cells.
(a) Membrane sheets from cells expressing the indicated constructs were used in FRAP experiments as described in Figure 3. Images are shown at the same scalings. (b) Averaged recovery traces from 9 to 15 membrane sheets imaged for one experiment. Values are given as means ± S.D. Only every second measurement point is shown (c) Half-times of recovery. Values are given as means ± S.E.M. (n = 3 independent experiments; Kruskal-Wallis one way analysis of variance on ranks (p=0.004; **p<0.01); 9–17 membrane sheets per construct and experiment). (d) Half-times of recovery from all individual membrane sheets collected from all experiments, plotted versus the pre-bleach intensity. As in intact cells, only full length syntaxin tends to longer half-times of recovery at increased intensity levels.
Figure 5 with 1 supplement
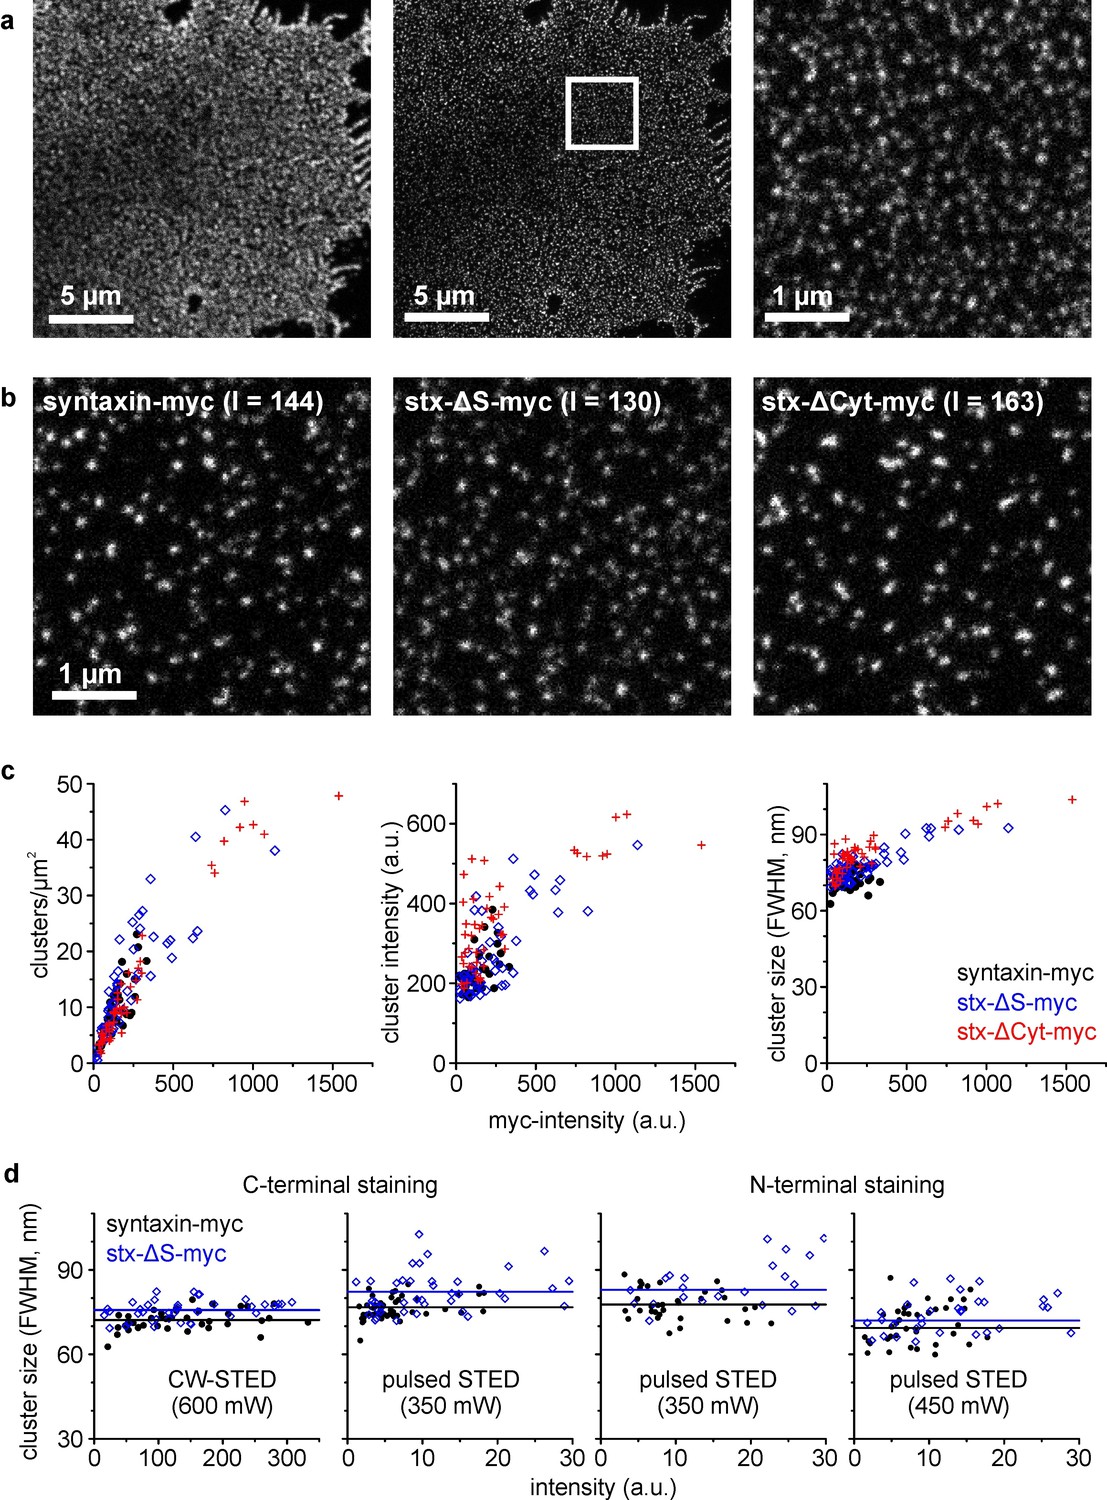
Clusters analysed by super-resolution microscopy.
(a) Plasma membrane with stained syntaxin-myc. Left and middle, images taken in the confocal and STED mode, respectively. A region of interest (white box; for magnified view see right panel) was defined for analysing the image intensity in the confocal image (used for plotting in c) and the cluster characteristics in the STED image. (b) Images from the different constructs as indicated, chosen with similar intensities (I = intensity; values are given in a.u. in the image). (c) Clusters per area, cluster intensity and cluster size, plotted versus the average image intensity. (d) Average cluster size for syntaxin-myc and syx-ΔS-myc determined under variable experimental conditions. As indicated, samples were stained with antibodies recognizing either the extracellular C-terminus (anti-myc; left graph is a zoom-in view of the right plot in c) or the intracellular N-terminus (anti-HPC1). Apart from CW-STED with a green dye and 600 mW depletion laser intensity (left panel), pulsed STED with a red dye was employed at 350 or 450 mW depletion laser intensity. Only the overlapping intensity range is shown. Black (syntaxin-myc) and blue (syx-ΔS-myc) lines indicate the average size. (c and d) Each data point represents one membrane sheet (size and intensity are average values of all clustered structures identified on one membrane sheet). Values from three independent experiments are pooled.
Figure 5—figure supplement 1
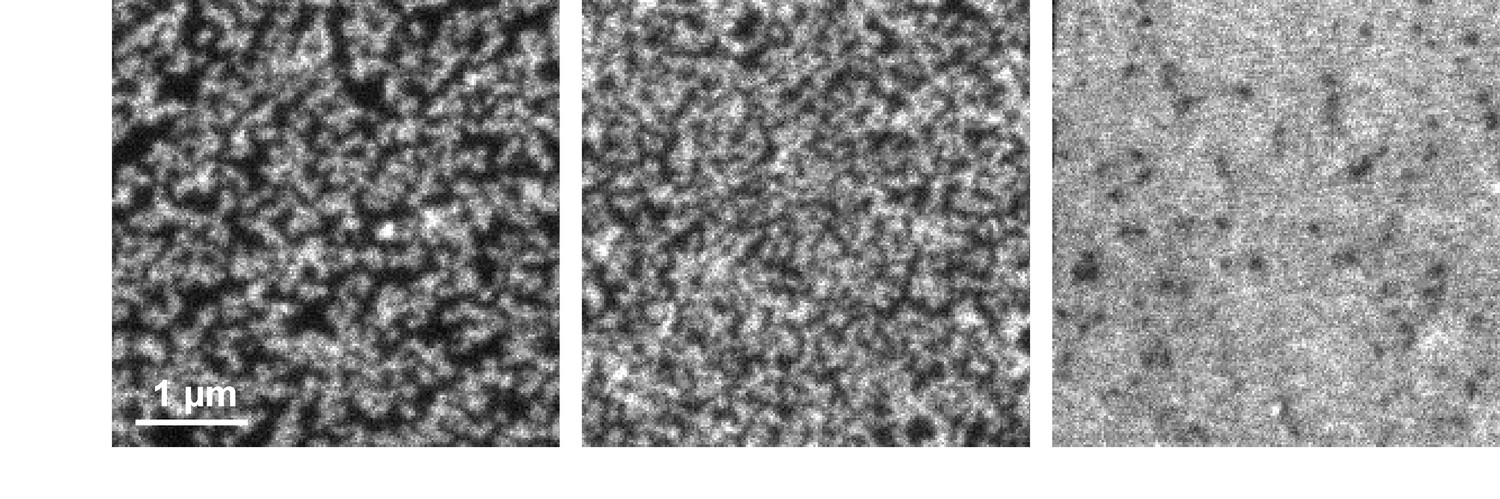
Clustering behaviour of syx-ΔS.
Pulsed STED micrographs of plasma membranes with syx-ΔS stained by the HPC1-antibody (from left to right the staining intensities increase). Note that clusters occasionally fuse into string-like domains that however could be as well non-resolved clusters. At very high expression levels, individual clusters are either not resolved or indeed dispersed, forming a homogenous distribution. Comparable images of syntaxin and syx-ΔCyt cannot be illustrated as syntaxin does not allow for bright staining and syx-ΔCyt is lacking the epitope for N-terminal staining, respectively.
Figure 6 with 1 supplement
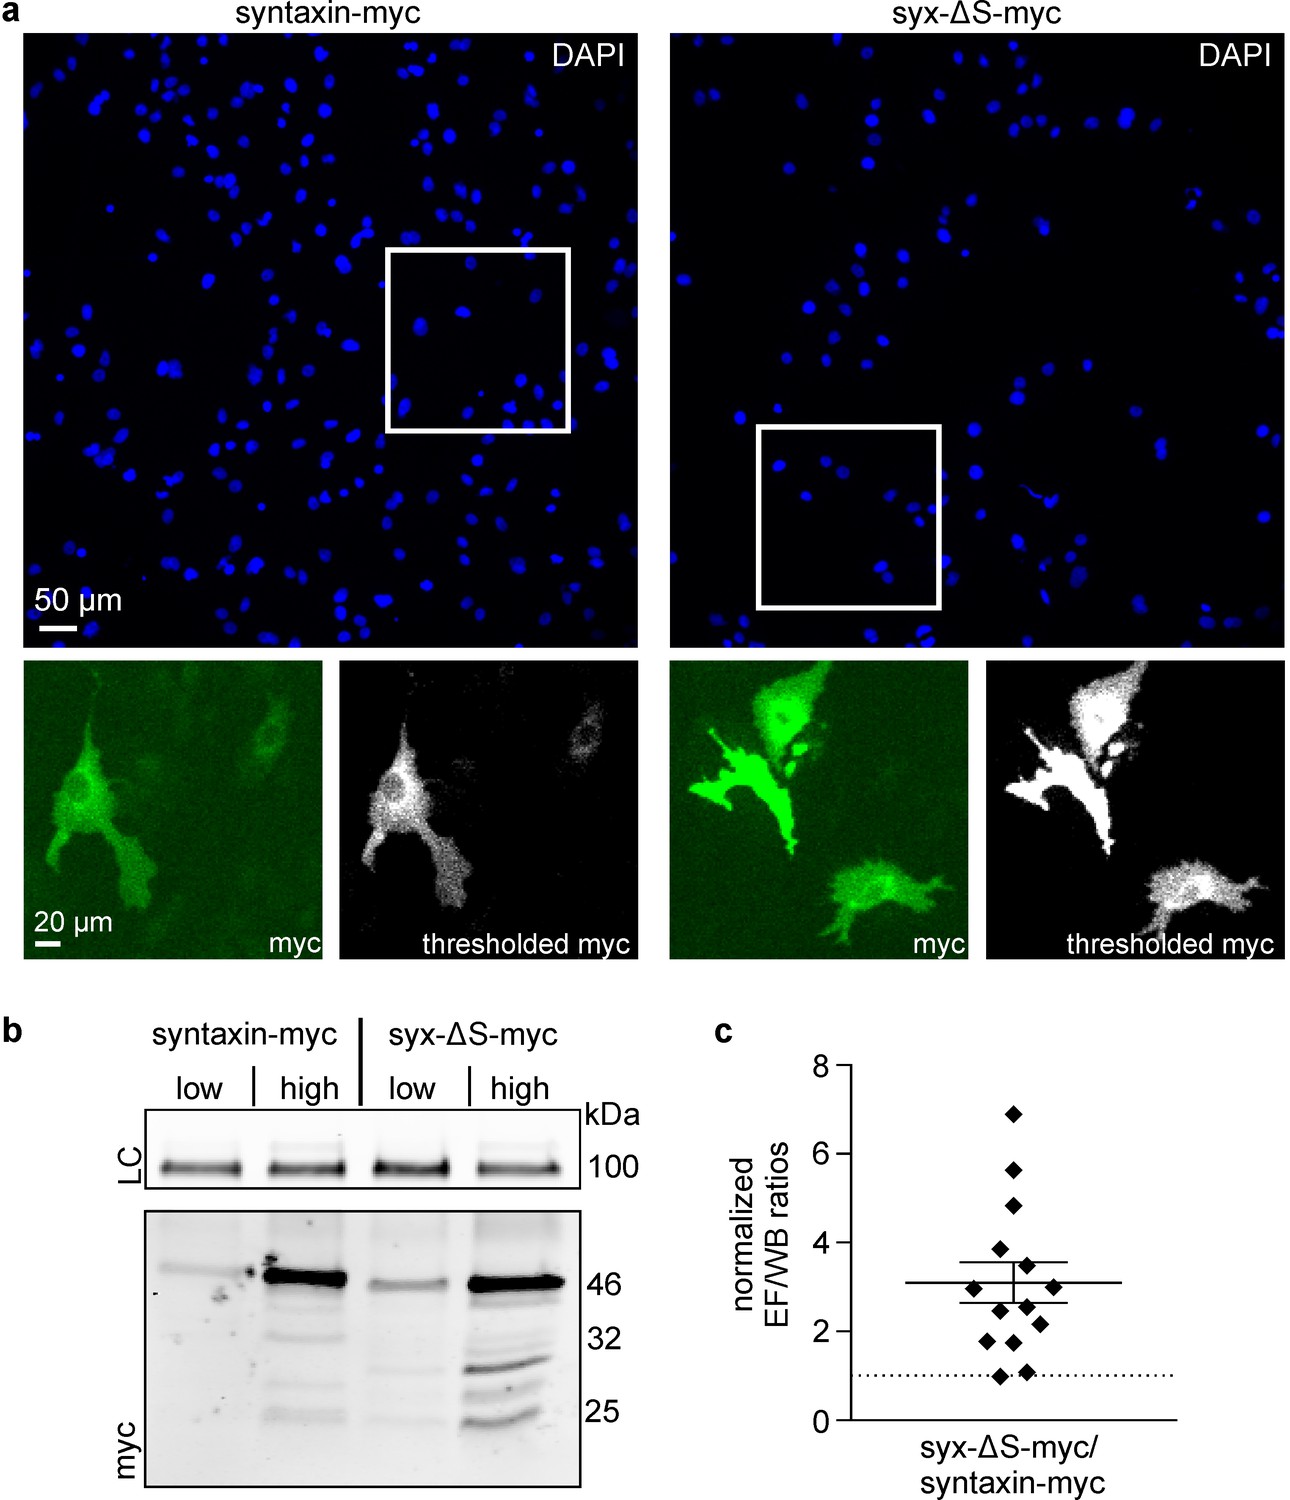
Partial SNARE-motif deletion increases antibody access to the C-terminal myc-tag.
Cells were transfected with plasmids encoding for syntaxin-myc or syx-ΔS-myc employing low or high plasmid concentrations and each transfection was split into two fractions (one for microscopy and one for western blot analysis). After one day the ‘low’ and ‘high’ syntaxin-myc/syx-ΔS-myc pairs were subjected to comparative analysis by microscopy and western blot. (a) For microscopy, fixed cells were stained for their nuclei by DAPI (upper panels represent large overviews of the blue channel) and for the myc-tag by immunostaining (green channel; lower left panels show magnified views from the boxed regions in the blue channel). Using mock transfected cells we set a threshold value to eliminate the offset of background signal. The lower right black-and-white images show the background corrected images. The integral of the thresholded myc-signal was determined and related to total number of cells, yielding the average myc-signal in epifluorescence (EF). (b) For western blot analysis, equal amounts of total protein were loaded for analysis by SDS-PAGE and western blotting, using transferrin receptor as a loading control (LC). Myc-band intensities were quantified and normalized to the respective transferrin receptor loading control, giving WB. (c) Strong variability of the absolute values both in microscopy and western blot analysis yielded highly variable absolute values of the EF/WB ratios (for details see Figure 6—figure supplement 1). Therefore, for each of the syntaxin-myc/syx-ΔS-myc pairs, the ratio of syx-ΔS-myc was related to the ratio of syntaxin-myc, yielding the ‘normalized EF/WB ratios’ plotted in (c). Dotted line indicates a value of 1 (no effect). Values are shown as a dot plot with the mean ± S.E.M. (n = 14 transfection pairs from 28 transfections; statistics was performed on the non-normalized ratios (see Figure 6—figure supplement 1).
Figure 6—figure supplement 1
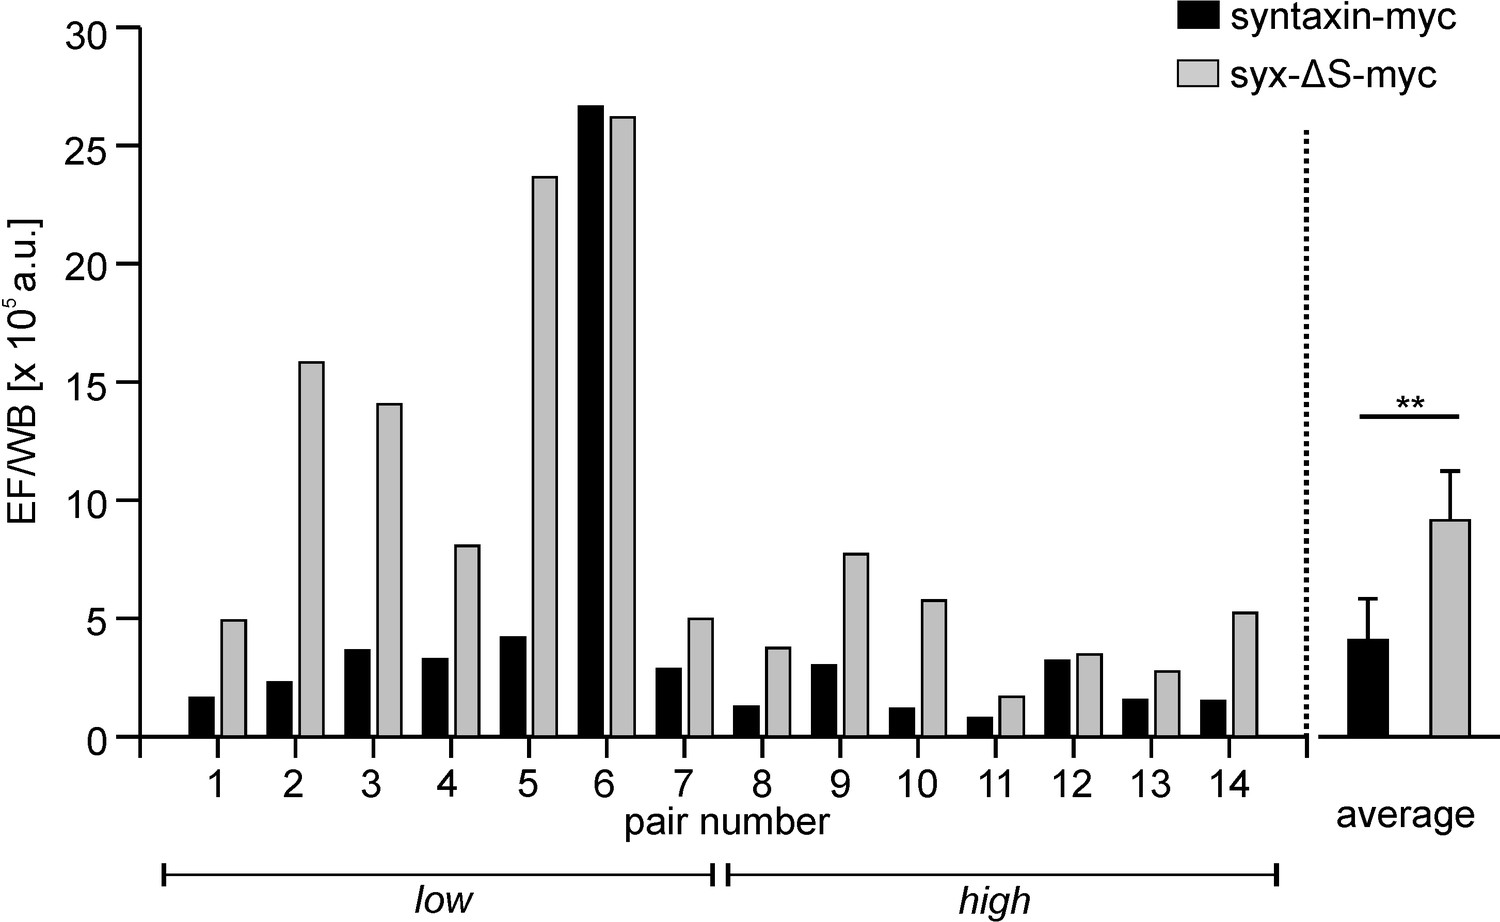
Ratios calculated from the absolute signals in microscopy (EF) and western blot (WB) analysis.
Shown are the ratios from in total 28 individual syntaxin-myc or syx-ΔS transfections that are grouped into 14 pairs (left, 4 transfections per experiment, yielding a ‘low’ and a ‘high’ pair; right, averaged ratios displayed as means ± SEM). The great difference in the absolute values of the ratios is due to variations in the western blotting technique and also variable imaging conditions. p=0.005 (paired t- test on the 14 pairs; **p<0.01).
Figure 7
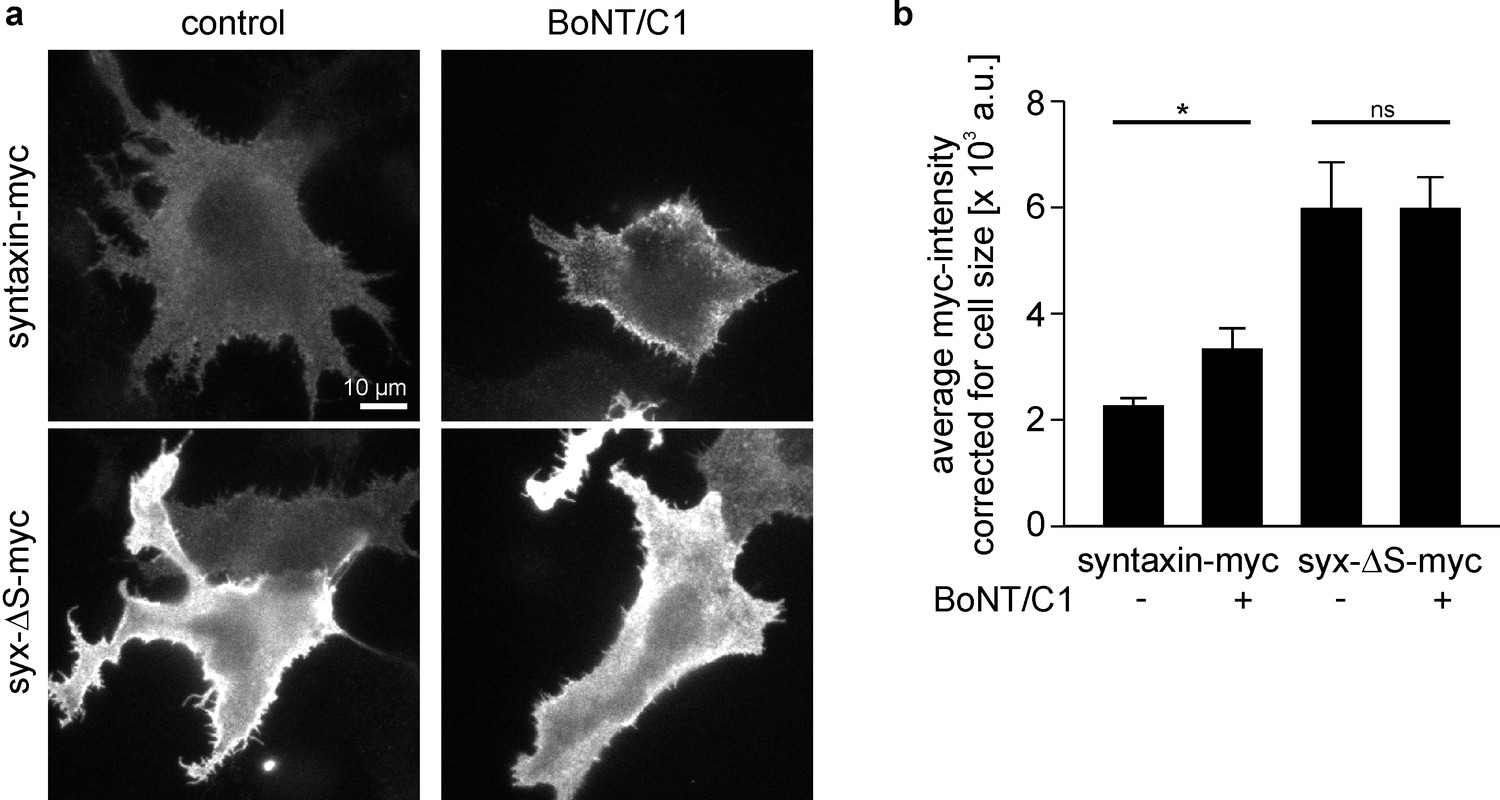
Myc-tag accessibility increases after intracellular cleavage of syntaxin.
(a) Cells expressing syntaxin-myc or syx-ΔS-myc were co-transfected (BoNT/C1) or not (control) with the light chain of botulinum neurotoxin C1 (BoNT/C1) fused to GFP. One day after transfection cells were fixed, stained for myc and imaged for quantification of the myc- (a) and GFP-intensity (not shown). Images are shown at the same scalings. (b) Staining quantified from outlined cells. While BoNT/C1 did not change the size of syx-ΔS cells, it produced ≈ 30% smaller syntaxin-myc cells, indicating that syntaxin-myc cells may concentrate their fluorescence on smaller areas. This may lead to an overestimation of the BoNT/C1 induced increase in brightness. Therefore the mean intensities were related to the average size of the cells. Values are given as means ± S.E.M. (n = 5). t-test on syntaxin-myc/syntaxin-myc + BoNT/C1, p=0.034 (*p<0.05); t-test on syx-ΔS-myc/syx-ΔS-myc + BoNT/C1, p=0.998 (ns, not significant p>0.05).
Figure 8 with 1 supplement
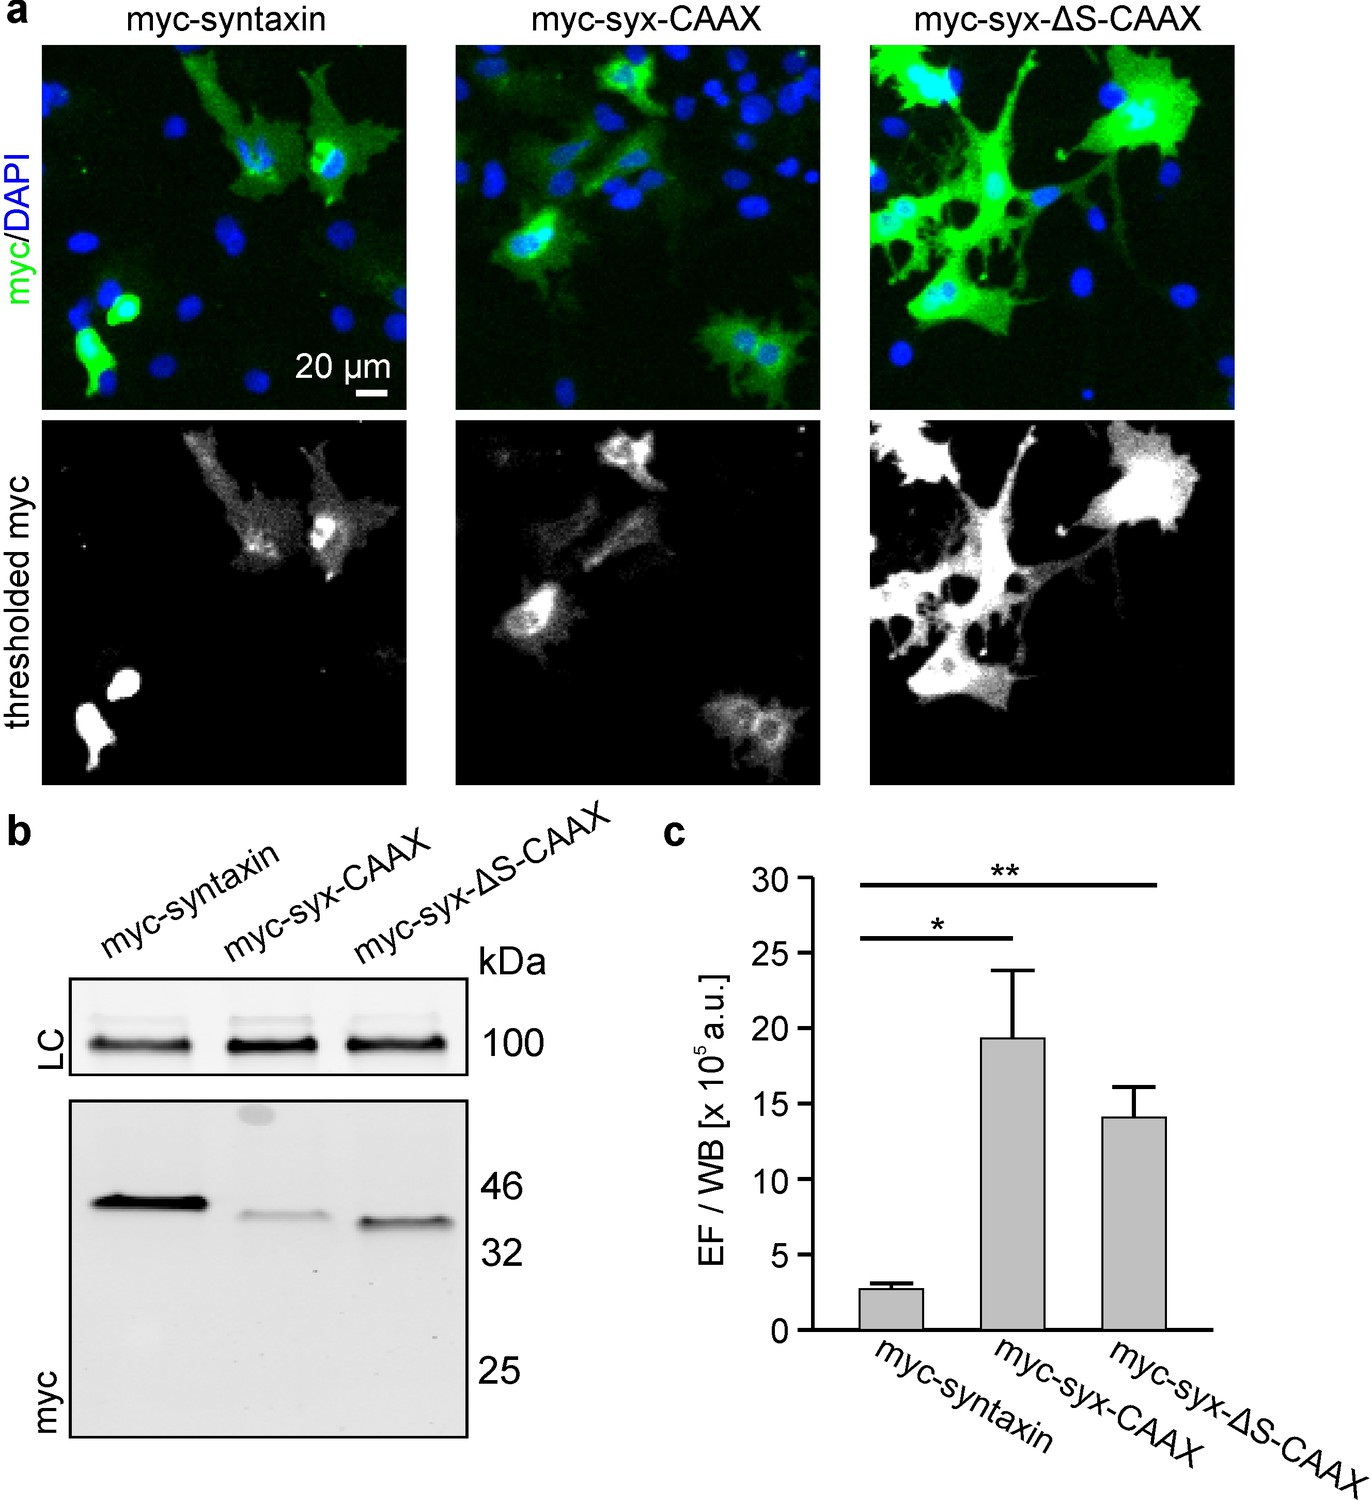
Exchange of the TMS by a CAAX-box decreases the packing density.
Cells were transfected with plasmids encoding for N-terminally myc-tagged syntaxin (myc-syntaxin), myc-syx-CAAX or myc-syx-ΔS-CAAX (see Figure 1 for details). Visualization on membrane sheets shows that also the CAAX-constructs form clusters (Figure 8—figure supplement 1). Constructs were analysed as described in Figure 6. (a) Microscopy images from fixed cells expressing the indicated constructs. Shown are magnified views from the images as overlays (blue, DAPI; green, myc-staining). (b) From the same transfections the western blot analysis is shown. Top, loading control (LC) using transferrin receptor staining; bottom, myc-signal. (c) Absolute epifluorescence signals (EF) related to the corresponding absolute western blot signals (WB). Values are given as means ± S.E.M. (n = 3), (t-test: p=0.021 for myc-syntaxin/myc-syx-CAAX; p=0.005 for myc-syntaxin/myc-syx-ΔS-CAAX; *p<0.05, **p<0.01).
Figure 8—figure supplement 1
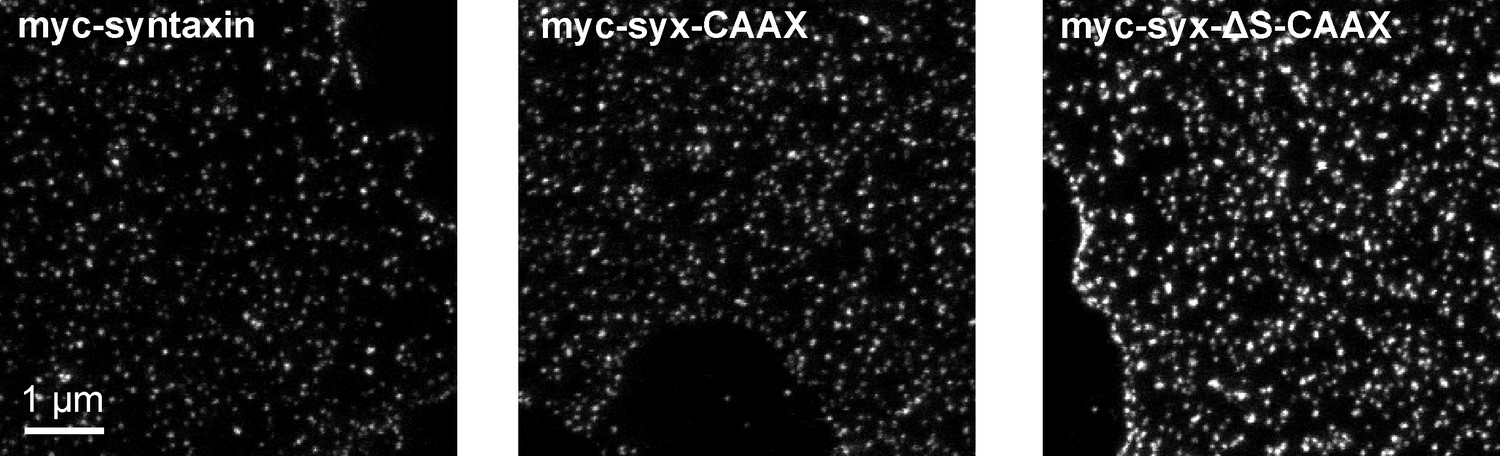
Visualization of myc-syntaxin, myc-syx-CAAX and myc-syx-ΔS-CAAX clusters on membrane sheets imaged by STED microscopy.
Shown are membrane sheets with comparable staining intensities. Note that on average the CAAX-constructs yielded brighter stainings.
Author response image 1
Subcellular distribution analysis by 3D-STED microscopy.
Cells expressing either syntaxin-GFP, syx-ΔS-GFP, syx-ΔCyt-GFP, VAMP8-GFP, syntaxin-myc, syx-ΔS-myc or syx-ΔCyt-myc were fixed and permeabilized prior to immunostaining with an antibody raised against the respective tag. The plasma membrane was counterstained with concanavalin A (not shown). (a) Images from the GFP-labelled constructs. The lower left insets show an x-y overview. Using this overview as reference an x-z slice was imaged every 10 µm by two colour 3D STED microscopy (using Alexa594 for concanavalin and Atto647N for the antibody labeling). (b) For analysis, in the concanavalin channel ROIs differentiating between the whole cell and the cytosol were generated. The integral of fluorescence was summed up for all slices from one cell. Background values from non-transfected cells were subtracted and the intracellular integrated signal from the cytosol was related to the whole cell signal for each cell. Values are given as means ± SEM (n = 2 – 3 independent experiments with 7 – 26 cells per condition).
Author response image 2

Recovery curves from syntaxin-GFP from sequences imaged at 1 Hz and 3 Hz.
Same experiment as shown in Figure 3 (previous Figure 2). In brief, live cells expressing syntaxin-GFP were imaged by confocal microscopy at the basal plasma membrane. The fluorescence was bleached in a squared ROI and the recovery of fluorescence was monitored for several minutes either at 1 Hz (left panel, light brown) or at 3 Hz (middle panel, dark brown). Shown are averaged recovery traces from 10-11 cells. The traces were fitted with a hyperbolic function (solid line). The right panel shows an overlay of the two traces. Values are given as mean ± SD.
Download links
A two-part list of links to download the article, or parts of the article, in various formats.
Downloads (link to download the article as PDF)
Open citations (links to open the citations from this article in various online reference manager services)
Cite this article (links to download the citations from this article in formats compatible with various reference manager tools)
The packing density of a supramolecular membrane protein cluster is controlled by cytoplasmic interactions
eLife 6:e20705.
https://doi.org/10.7554/eLife.20705


