How spatial release from masking may fail to function in a highly directional auditory system
- University of Toronto Scarborough, Canada
Figures
Figure 1
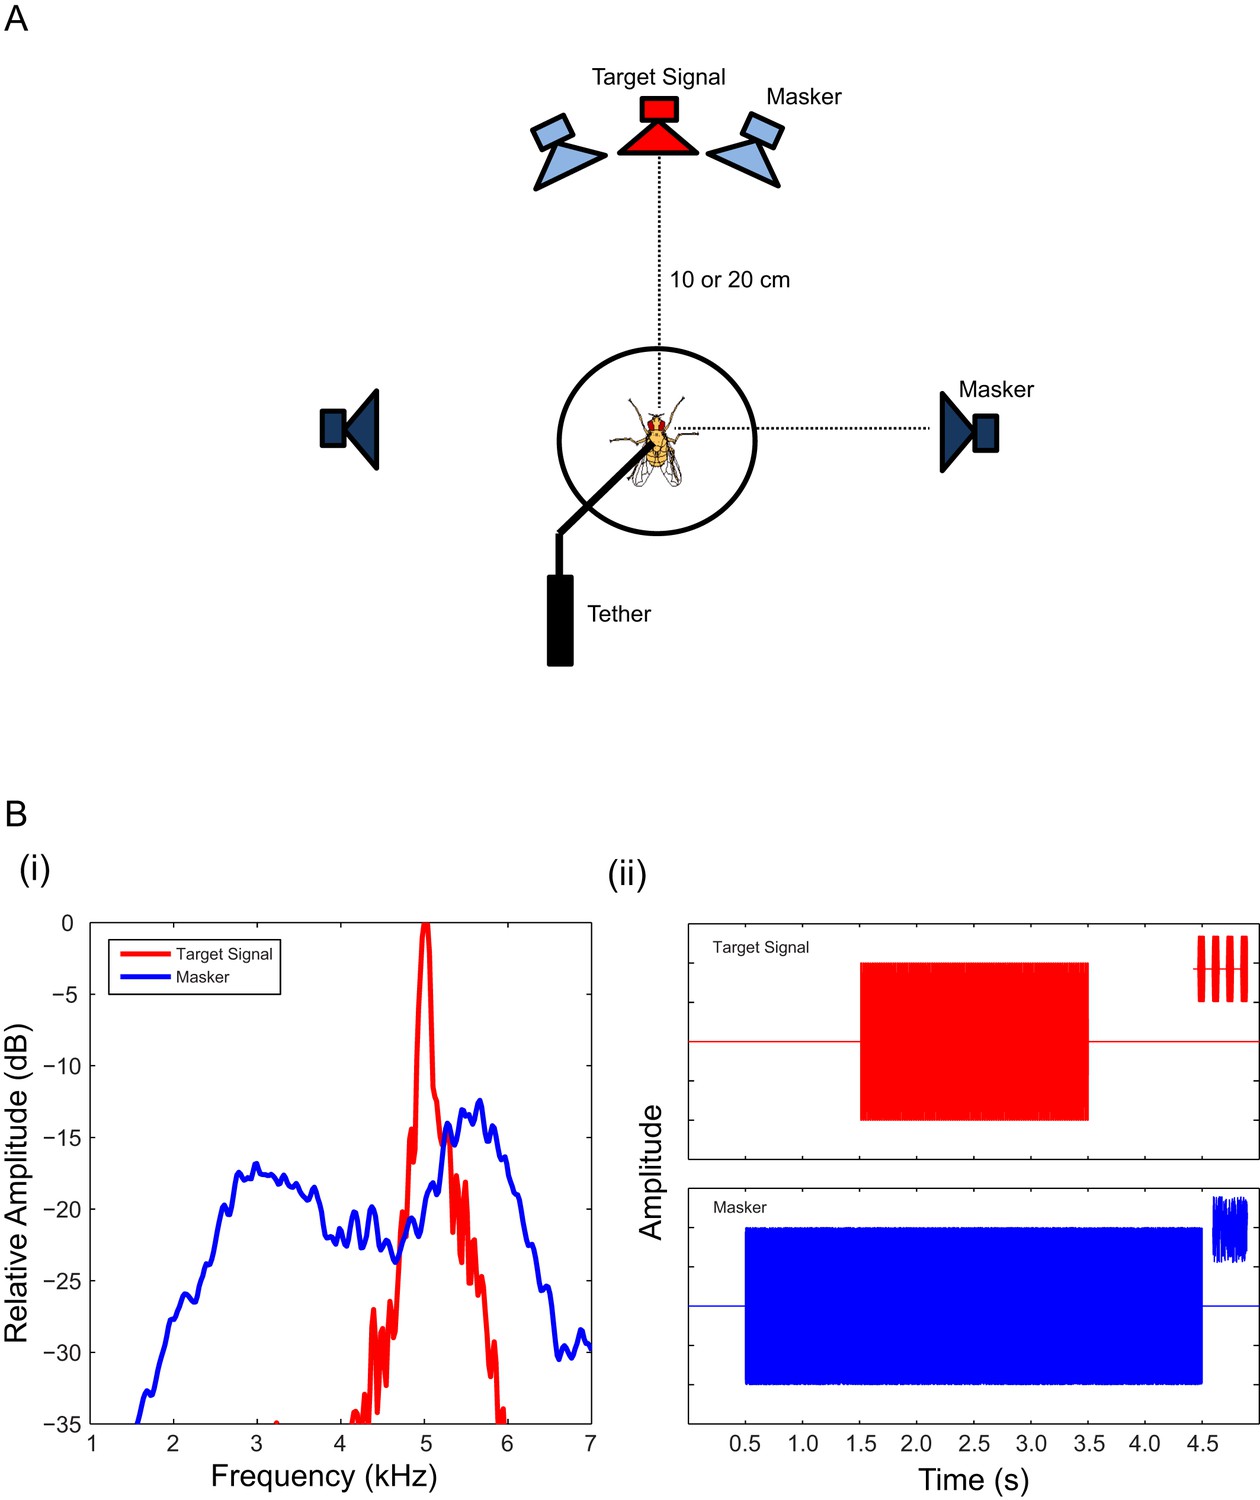
Signal and masker and experimental setup used in recording walking phonotaxis.
(A) Gravid female Ormia ochracea tethered on top of the treadmill system and positioned equidistant (Experiments 1 and 3: 20 cm, Experiment 2: 10 cm) from surrounding speakers. The target signal (synthetic cricket song) was broadcast from the forward (red) speaker and the masker (band-limited noise) was broadcast from an adjacent speaker (light blue – either to the left or right of the target signal speaker) separated by 6°, or from a laterally positioned speaker (dark blue - either to the left or right of the target signal speaker) separated by 90°. (B) (i) Spectral analysis of the target signal (ii - top panel) and masker (ii – lower panel). Insets in (ii) show expanded samples of stimulus waveforms. In test conditions, the masker (4 s in duration) was broadcast 0.5 s post-trigger for data acquisition, followed by the simultaneous broadcast of the target signal after a delay of 1.5 s.
Figure 2
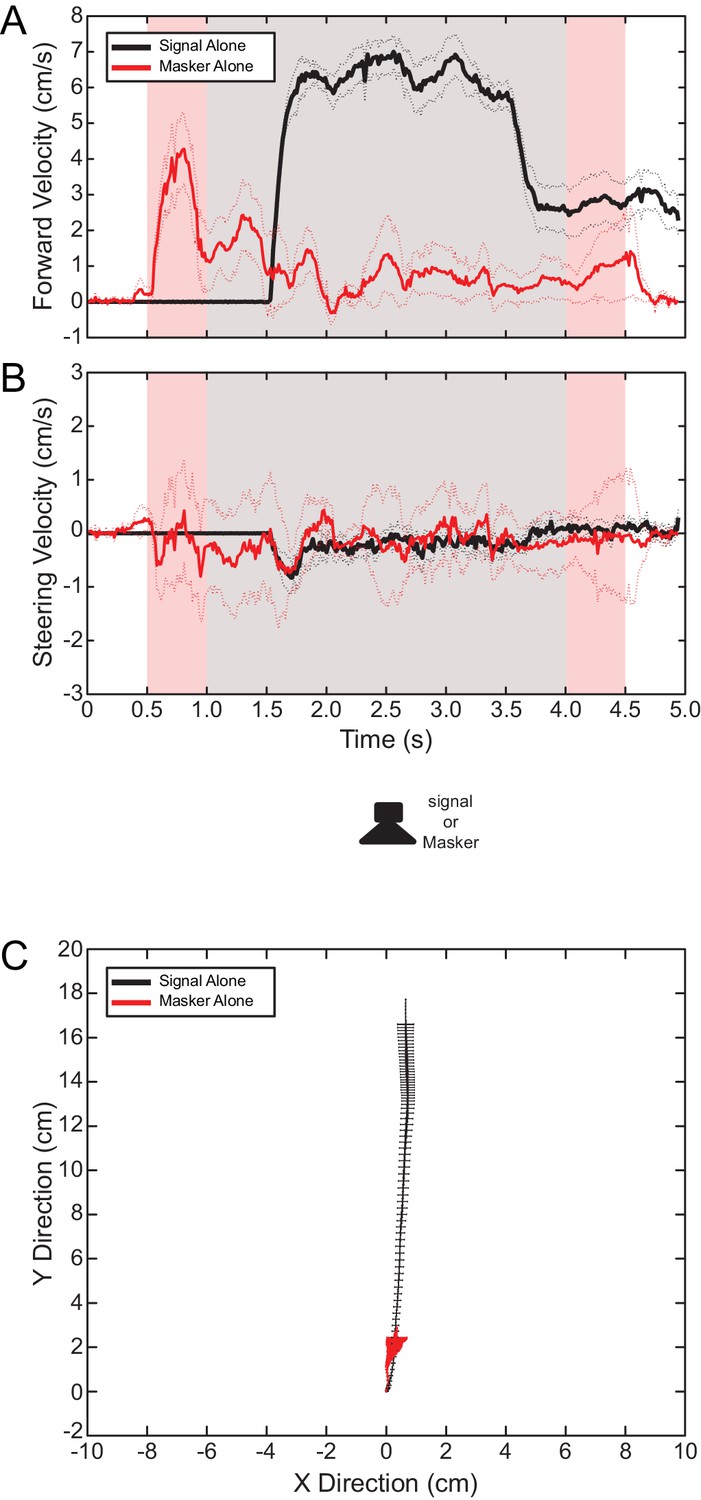
Walking phonotaxis in response to the target signal and masker in isolation.
Mean (solid lines) and SEM (dotted lines) of (A) forward and (B) steering velocity components from walking phonotaxis in response to a forward (0°azimuth) target signal (black) or masker (red) presented in isolation. Light pink shaded areas indicate the duration of masker presentation. Gray-shaded areas indicate the duration of signal presentation. (C) Virtual walking trajectory showing responses directed to the target signal (black) or masker (red). Walking responses were robust and accurately directed to the target signal. In contrast, flies only walked transiently in response to the masker presented alone.
-
Figure 2—source data 1
Translational velocity in response to the target signal and masker presented in isolation.
Masker presentation started and ended 0.5 and 4.5 s after the onset of data acquisition, respectively. Signal presentation started and ended 1.0 and 4.0 s after the onset of data acquisition, respectively. Data plotted in Figure 2A.
- https://doi.org/10.7554/eLife.20731.004
-
Figure 2—source data 2
Steering velocity in response to the target signal and masker presented in isolation.
Masker presentation started and ended 0.5 and 4.5 s after the onset of data acquisition, respectively. Signal presentation started and ended 1.0 and 4.0 s after the onset of data acquisition, respectively. Data plotted in Figure 2B.
- https://doi.org/10.7554/eLife.20731.005
-
Figure 2—source data 3
Virtual walking path in response to the target signal and masker presented in isolation.
‘X’ and ‘Y’ coordinates of virtual walking paths measured from the treadmill system. Data plotted in Figure 2C.
- https://doi.org/10.7554/eLife.20731.006
Figure 3
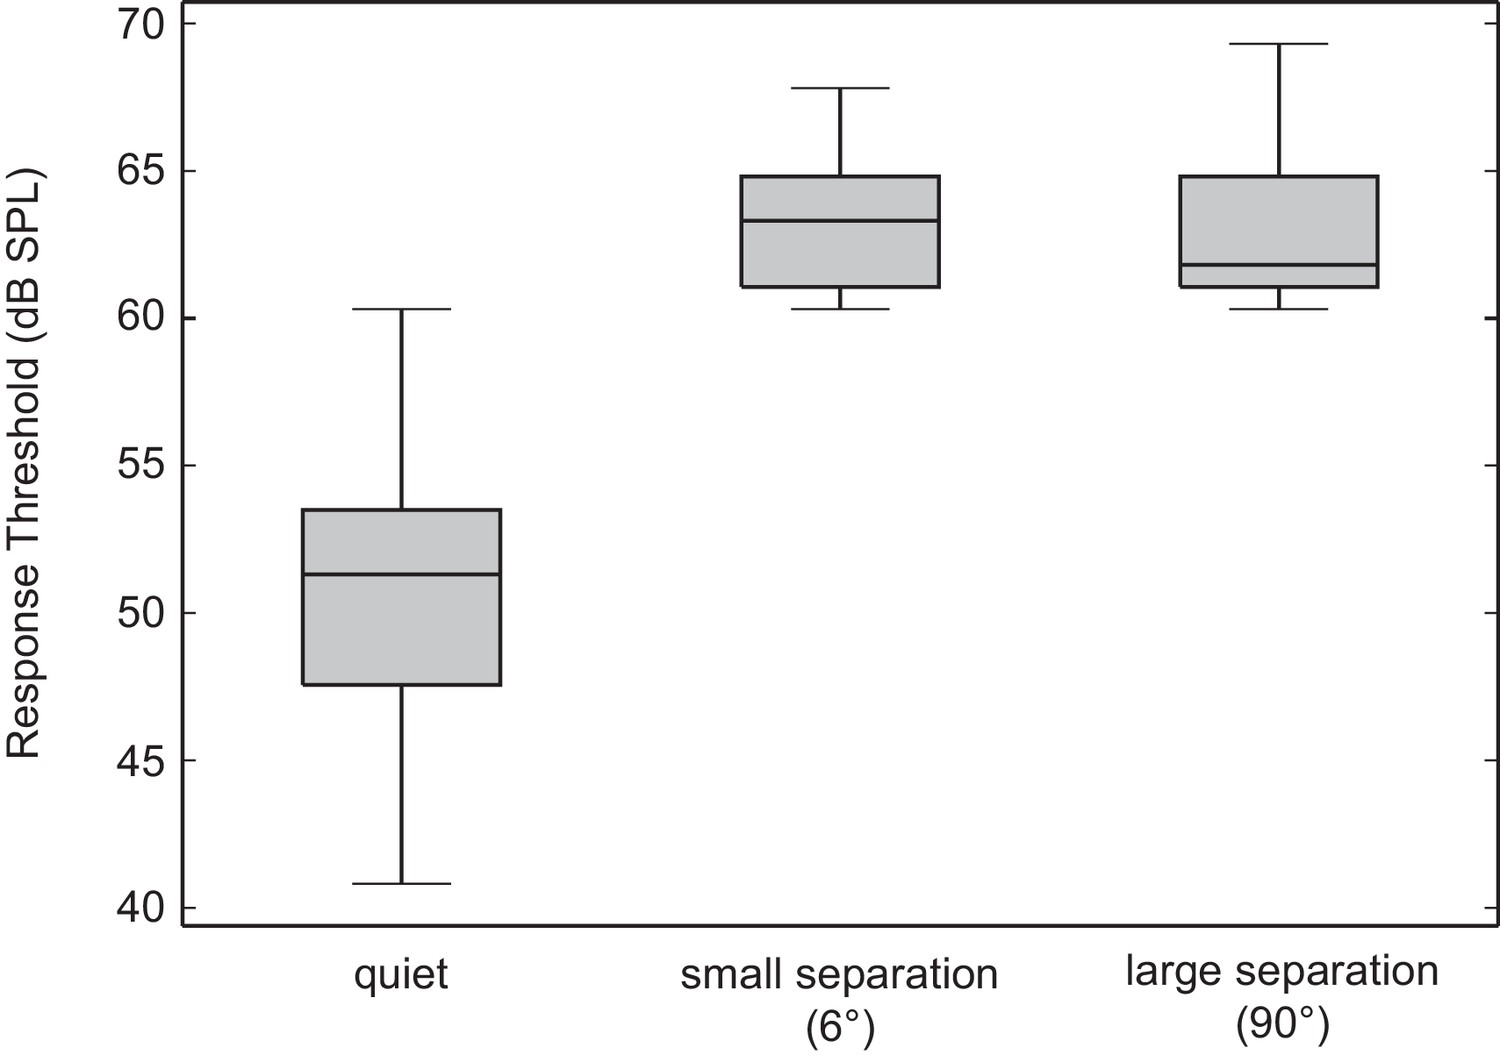
Spatial separation between target signal and masker does not decrease behavioural response thresholds.
Estimated behavioural response thresholds in quiet, with a target signal and masker separated by 6°, or 90°. Box plots depict first, second (median), and third quartiles. Whiskers depict 1.5 × interquartile range. The presence of the masker resulted in an increase in behavioural response thresholds compared to the target signal in quiet. Increased spatial separation between the target signal and masker does not improve response thresholds.
-
Figure 3—source data 1
Behavioral response thresholds to a target signal in quiet, and signal and masker separated by 6° or 90°.
Data plotted in figure.
- https://doi.org/10.7554/eLife.20731.008
Figure 4

Effects of spatial separation and signal-to-noise ratio on sound localization.
Mean (solid lines) and SEM (dotted lines) of (A) forward and (B) steering velocity components to a 76 dB SPL target signal alone (black trace) or signal and masker broadcasted at SNRs of −6 dB (orange trace), equal dB (blue trace),+6 dB (purple trace) from signal and masker with a 6° (left) or 90° (right) spatial separation. Light pink shaded areas indicate the duration of masker presentation. Dark pink shaded areas indicate the duration of the simultaneous presentation of signal and masker. At masker onset, flies responded with a brief walking component in the forward direction that quickly decayed. During this time frame, flies reactively steered to the masker, followed by steering movements away from the masker that were maintained for the remainder of stimulus presentation. Steering responses were minimally affected by SNR but were enhanced at greater signal and masker separation. At song onset, forward velocities increased to speeds well above responses to the masker onset. Average forward velocities depended on SNR but not signal and masker separation. Flies maintained steering away from the masker location. (C) Virtual walking trajectories in response to the target signal and masker separated by a 6° (left) or 90° (right) separation. Walking distance changed with SNR but not with signal and masker separation. The masker caused walking responses to be diverted away from the locations of the target signal and masker. With a 90° spatial separation walking responses were diverted even further in a direction contralateral to the masker location.
-
Figure 4—source data 1
Translational velocity in response to a target signal and masker separated by 6° and presented at different signal-to-noise ratios (SNRs).
The target signal was presented at 76 dB SPL while the masker intensity was varied to achieve three SNRs (−6, 0, +6 dB). Masker presentation started and ended 0.5 and 4.5 s after the onset of data acquisition, respectively. Signal presentation started and ended 1.0 and 4.0 s after the onset of data acquisition, respectively. Data plotted in Figure 4A (left).
- https://doi.org/10.7554/eLife.20731.010
-
Figure 4—source data 2
Steering velocity in response to a target signal and masker separated by 6° and presented at different signal-to-noise ratios (SNRs).
The target signal was presented at 76 dB SPL while the masker intensity was varied to achieve three SNRs (−6, 0, +6 dB). Masker presentation started and ended 0.5 and 4.5 s after the onset of data acquisition, respectively. Signal presentation started and ended 1.0 and 4.0 s after the onset of data acquisition, respectively. Data plotted in Figure 4B (left).
- https://doi.org/10.7554/eLife.20731.011
-
Figure 4—source data 3
Virtual walking path in response to a target signal and masker separated by 6° and presented at different signal-to-noise ratios (SNRs).
The target signal was presented at 76 dB SPL while the masker intensity was varied to achieve three SNRs (−6, 0, +6 dB). ‘X’ and ‘Y’ coordinates of virtual walking paths measured from the treadmill system. Data plotted in Figure 4C (left).
- https://doi.org/10.7554/eLife.20731.012
-
Figure 4—source data 4
Translational velocity in response to a target signal and masker separated by 90° and presented at different signal-to-noise ratios (SNRs).
The target signal was presented at 76 dB SPL while the masker intensity was varied to achieve three SNRs (−6, 0, +6 dB). Masker presentation started and ended 0.5 and 4.5 s after the onset of data acquisition respectively. Signal presentation started and ended 1.0 and 4.0 s after the onset of data acquisition, respectively. Data plotted in Figure 4A (right).
- https://doi.org/10.7554/eLife.20731.013
-
Figure 4—source data 5
Steering velocity in response to a target signal and masker separated by 90° and presented at different signal-to-noise ratios (SNRs).
The target signal was presented at 76 dB SPL while the masker intensity was varied to achieve three SNRs (−6, 0, +6 dB). Masker presentation started and ended 0.5 and 4.5 s after the onset of data acquisition respectively. Signal presentation started and ended 1.0 and 4.0 s after the onset of data acquisition, respectively. Data plotted in Figure 4B (right).
- https://doi.org/10.7554/eLife.20731.014
-
Figure 4—source data 6
Virtual walking path in response to a target signal and masker separated by 90° and presented at different signal-to-noise ratios (SNRs).
The target signal was presented at 76 dB SPL while the masker intensity was varied to achieve three SNRs (−6, 0, +6 dB). ‘X’ and ‘Y’ coordinates of virtual walking paths measured from the treadmill system. Data plotted in Figure 4C (right).
- https://doi.org/10.7554/eLife.20731.015
Figure 5
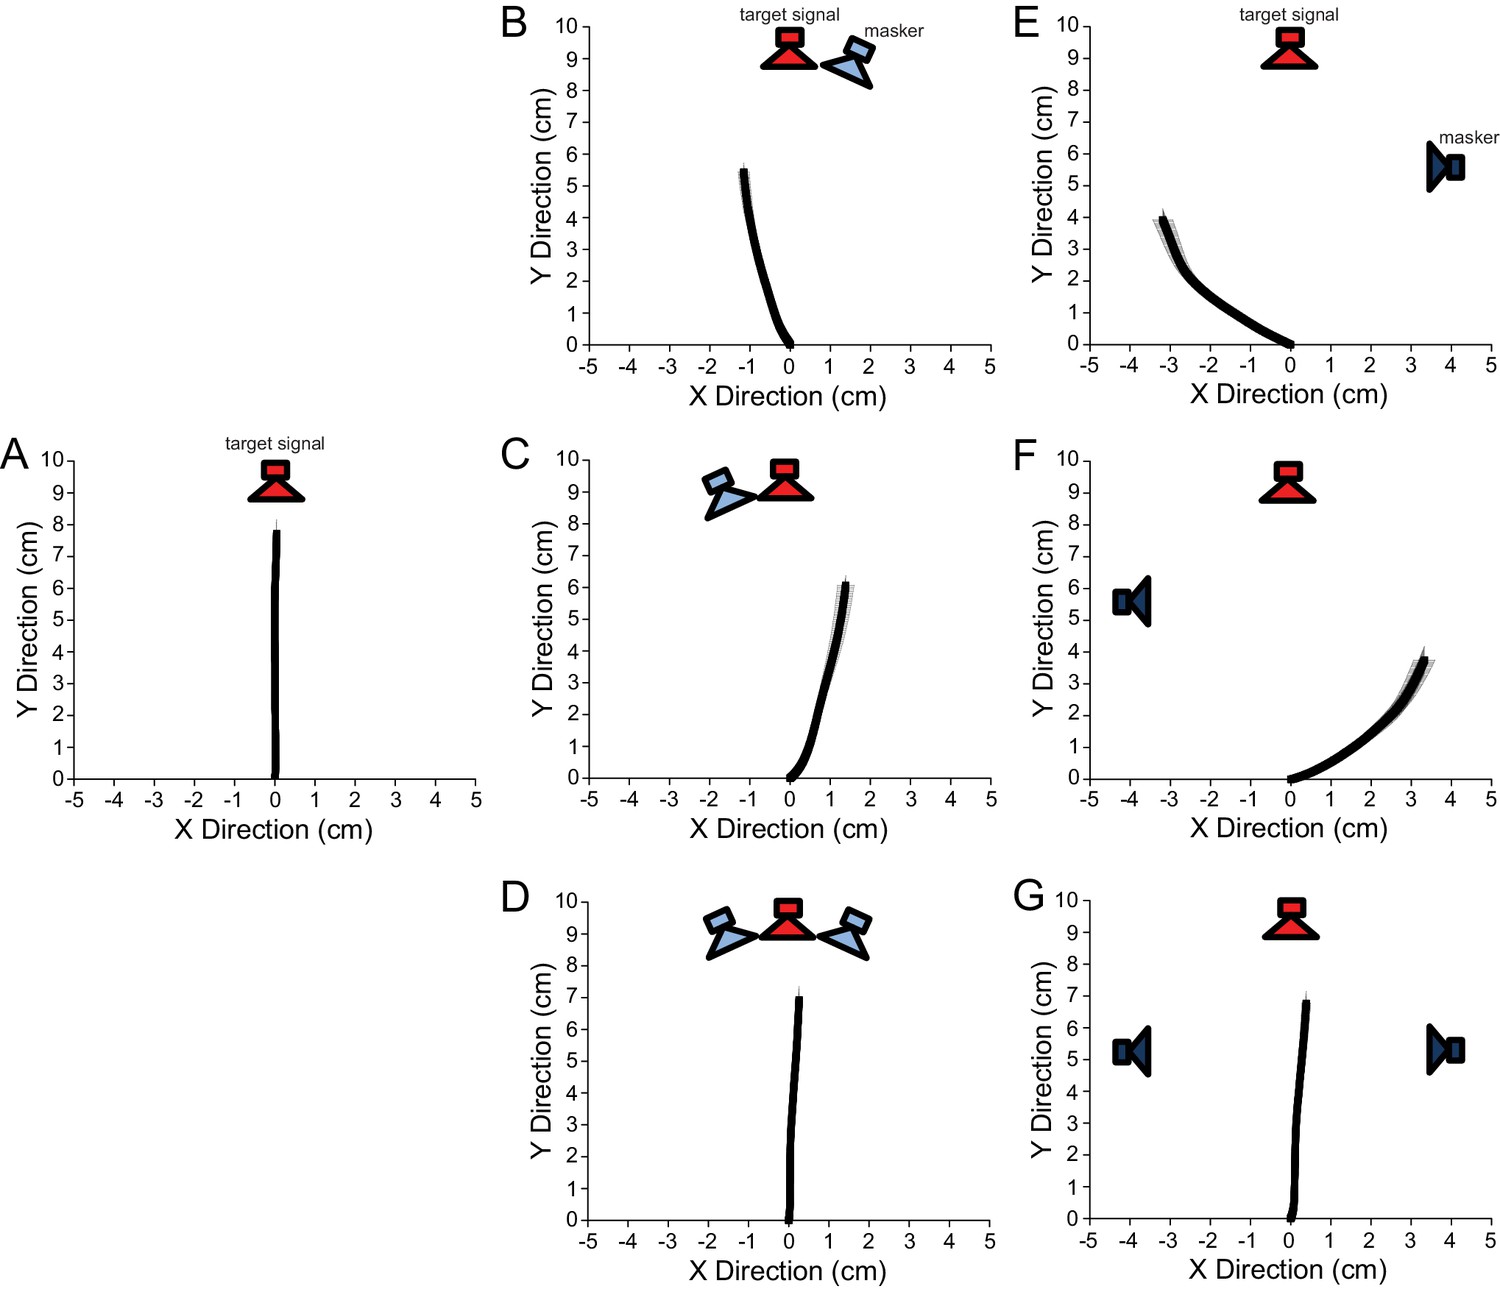
Virtual walking trajectories in response to asymmetrical and symmetrical auditory input.
Attractive target signal and masker broadcast at 76 dB SPL. Plots represent average walking responses ± SEM to a frontal signal broadcast (A) in isolation, or with (B) a masker in close proximity to the right (6° separation), (C) a masker in close proximity to the left (6° separation), (D) two coherent maskers at ±6° from the signal, (E) a masker to the right with a 90° separation, (F) a masker to the left with a 90° separation, and (G) two coherent maskers at ±90° from the signal. Red speakers indicate the location of the target signal. Light blue and dark blue speakers indicate the location of the masker. A masking source positioned asymmetrically about the midline body axis caused flies to divert their walking responses away from the signal and masker locations. When two identical maskers were used to balance temporal pattern interference on both sides of the auditory system, flies localized the signal location accurately.
-
Figure 5—source data 1
Virtual walking path in response to the target signal presented in isolation.
The target signal was presented at 76 dB SPL from a forward speaker. ‘X’ and ‘Y’ coordinates of virtual walking paths measured from the treadmill system. Data plotted in Figure 5A.
- https://doi.org/10.7554/eLife.20731.017
-
Figure 5—source data 2
Virtual walking path in response to a target signal and masker (on the right) separated by 6° and presented at equal intensity.
The target signal was presented at 76 dB SPL from a forward speaker while the masker was presented at the same intensity from an adjacent speaker to the right. ‘X’ and ‘Y’ coordinates of virtual walking paths measured from the treadmill system. Data plotted in Figure 5B.
- https://doi.org/10.7554/eLife.20731.018
-
Figure 5—source data 3
Virtual walking path in response to a target signal and masker (on the left) separated by 6° and presented at equal intensity.
The target signal was presented at 76 dB SPL from a forward speaker while the masker was presented at the same intensity from an adjacent speaker to the left. ‘X’ and ‘Y’ coordinates of virtual walking paths measured from the treadmill system. Data plotted in Figure 5C.
- https://doi.org/10.7554/eLife.20731.019
-
Figure 5—source data 4
Virtual walking path in response to a target signal and maskers separated by 6° and presented at equal intensity.
The target signal was presented at 76 dB SPL from a forward speaker while two coherent maskers were presented at the same combined intensity from adjacent speakers to the left and right of the signal speaker. ‘X’ and ‘Y’ coordinates of virtual walking paths measured from the treadmill system. Data plotted in Figure 5D.
- https://doi.org/10.7554/eLife.20731.020
-
Figure 5—source data 5
Virtual walking path in response to a target signal and masker (on the right) separated by 90° and presented at equal intensity.
The target signal was presented at 76 dB SPL from a forward speaker while the masker was presented at the same intensity from a lateral speaker to the right. ‘X’ and ‘Y’ coordinates of virtual walking paths measured from the treadmill system. Data plotted in Figure 5E.
- https://doi.org/10.7554/eLife.20731.021
-
Figure 5—source data 6
Virtual walking path in response to a target signal and masker (on the left) separated by 90° and presented at equal intensity.
The target signal was presented at 76 dB SPL from a forward speaker while the masker was presented at the same intensity from a lateral speaker to the left. ‘X’ and ‘Y’ coordinates of virtual walking paths measured from the treadmill system. Data plotted in Figure 5F.
- https://doi.org/10.7554/eLife.20731.022
-
Figure 5—source data 7
Virtual walking path in response to target signal and maskers that are separated by 90° and presented at equal intensity.
The target signal was presented at 76 dB SPL from a forward speaker while two coherent maskers were presented at the same combined intensity from lateral speakers to the left and right of the signal speaker. ‘X’ and ‘Y’ coordinates of virtual walking paths measured from the treadmill system. Data plotted in Figure 5G.
- https://doi.org/10.7554/eLife.20731.023
Figure 6

Effects of spatial separation on tympanal vibration.
(A) Exemplar vibration measurements to illustrate the effective amplitude, which is the signal driven response that is above the masker-driven response. Measurement (smoothed with a sliding RMS window) from the masker-ipsilateral ear (blue) and the masker-contralateral ear (red) in response to a signal and masker presented at −6 dB SNR (frontal signal: 70 dB SPL, lateral masker: 76 dB SPL) and separated by 90°. The masker-contralateral ear exhibits a greater effective response amplitude. (B and C) Tympanal vibration responses to repeated presentations of (forward-located) 2-pulse signal and masker with 6° (B) or 90° (C) spatial separation. (D) Effective response amplitudes vary with noise location. Effective amplitudes are slightly larger in the masker-contralateral ear compared to the masker-ipsilateral ear when there is a 6° spatial separation between the target signal and masker, and this interaural difference is greater for a 90° spatial separation between the target signal and masker.
-
Figure 6—source data 1
Raw traces of tympanal vibration in response to combined signal and masker under conditions of masker source located near (separated by 6°) or far (separated by 90°) from signal source.
Ipsi- and contralateral refer to the masker. Signal pulses were repeated at 400 ms intervals during continuous masker broadcast.
- https://doi.org/10.7554/eLife.20731.025
-
Figure 6—source data 2
Normalized-amplitude tympanal vibration responses.
Vibration measurements are normalized to the peak response in response to the target signal. Data plotted in Figure 6B,C.
- https://doi.org/10.7554/eLife.20731.026
-
Figure 6—source data 3
Smoothed tympanal vibration responses.
Measurements smoothed with a 2000-point sliding rms window.
- https://doi.org/10.7554/eLife.20731.027
-
Figure 6—source data 4
Effective amplitude measurements.
Effective amplitude measurements (i.e. within-trace signal-to-noise ratio) from smoothed tympanal responses for 23 iterations of signal within the masker. Signal amplitudes were measured from 30 ms time segments corresponding with signal pulses; masker amplitudes were measured from 30 ms segments in the middle of the interpulse interval (i.e. 200 ms after signal-pulse onset). Data plotted in Figure 6D.
- https://doi.org/10.7554/eLife.20731.028
Figure 7
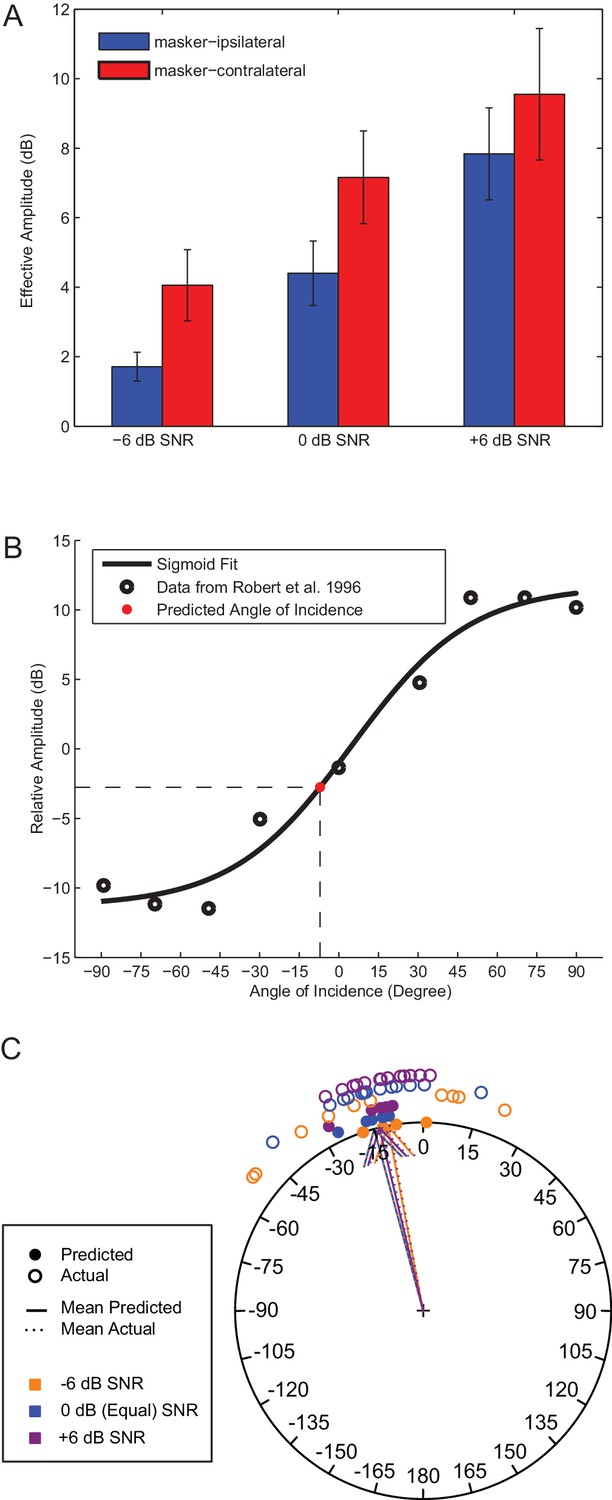
Tympanal interaural vibration amplitude difference predict error in sound localization.
(A) Effective vibration amplitudes measured in LDV experiments to a target signal broadcast simultaneously with an ipsilateral (blue) or contralateral (red) masker at varied SNRs. (B) Effective interaural vibration amplitude differences (IVADs) were used to generate predictions of the target signal sound direction (red circle) based on previously published directionality measurements (open circles) (redrawn from Robert et al., 1996b). (C) Mean predicted sound direction (closed circles) generally match with actual behavioural measurements (open circles) across all SNRs (colours). Source data for Figure 7 is available to download from Dryad Digital Repository under the titles of 'Figure 7 - source data 1' and 'Figure 7 - source data 2' (Lee and Mason, 2017a).
Figure 8
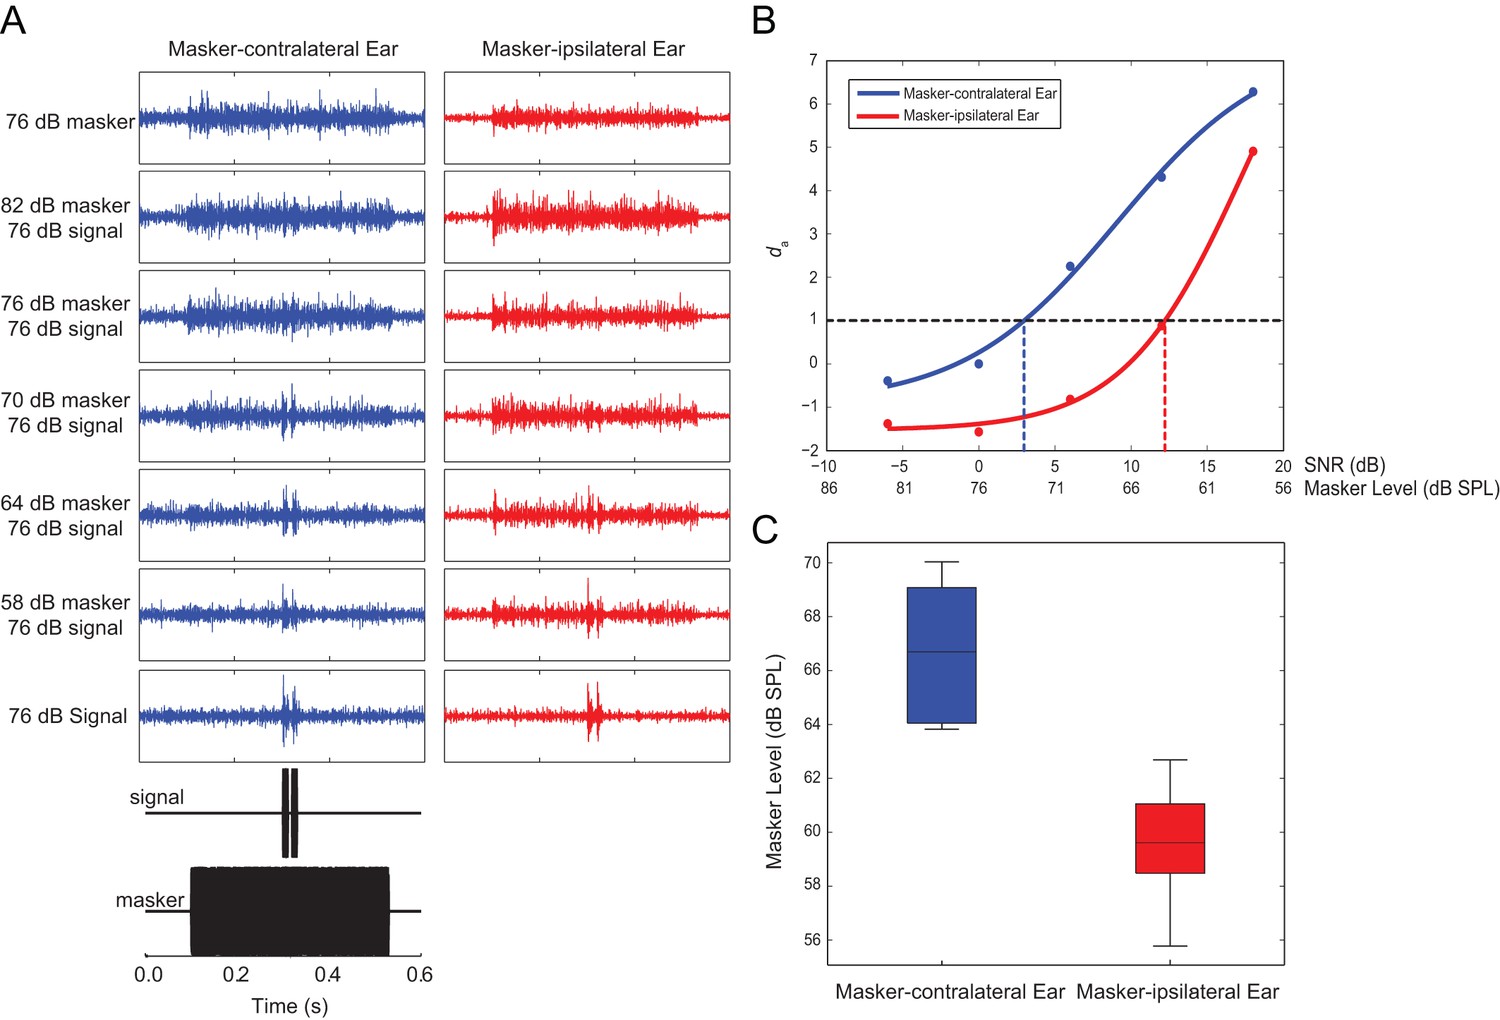
Better signal detection in the masker-contralateral ear.
(A) Exemplar multi-unit recordings from the both sides of the auditory system in response to signal and masker with a 90° spatial separation. Inset (black) shows the time course of the stimulation protocol. The target signal-driven response is apparent at lower SNRs for the masker-contralateral ear (blue) compared to the masker-ipsilateral ear (red). (B) Signal detection theory was applied to determine masked thresholds. The mean and variance of impulse rates to the masker and the target signal plus masker was expressed in terms of standard separation (da) for the masker-contralateral ear (blue) and the masker-ipsilateral ear (red). (C) Signal detection was possible at a higher masker level for the masker-contralateral ear (blue) compared to the masker-ipsilateral ear (red).
-
Figure 8—source data 1
Root Mean Square (RMS) values calculated from multiunit recordings of left and right auditory nerve.
RMS calculated over 40 ms time segments during an interval with a target signal and masker separated by 90° and broadcast at varied signal-to-noise ratios (−18, –12, −6, 0, +6 dB), and an equivalent time window during masker broadcast alone. Signal detection theory was applied to RMS measurements to determine masked thresholds for the masker ipsi- and contralateral ears. These data are plotted in Figure 8C.
- https://doi.org/10.7554/eLife.20731.031
Figure 9
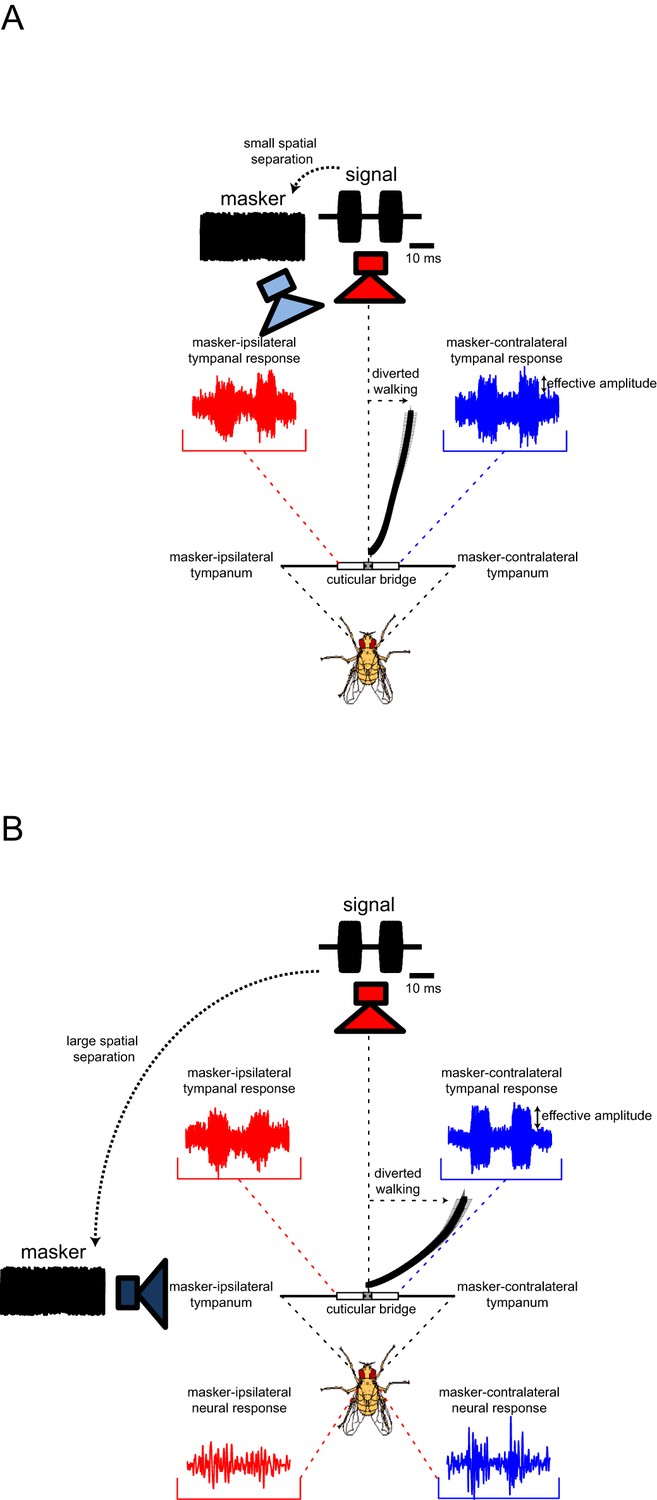
Current model of diverted walking phonotaxis in Ormia ochracea.
(A) 6° and (B) 90° spatial separations between the target signal (cricket song) and masker (band-limited noise). The forward target signal results in equal (symmetrical) stimulation to both tympana while the masker provides greater (asymmetrical) stimulation to the masker-ipsilateral tympana compared to the masker-contralateral tympana (exemplar vibration measurements shown). This results in binaural effective amplitude differences in the detection of the target signal above the masker-driven random noise floor. Such binaural effective amplitude differences are larger for larger spatial separations between the target signal and masker. This translates to better signal detection in the masker-contralateral ear (exemplar multi-unit recordings from the auditory nerve shown when the target signal and masker are separated by 90°). Binaural effective amplitude differences potentially encode ‘perceived’ target signal location. Flies respond by localizing a direction that is diverted away from the target signal and masker.
Download links
A two-part list of links to download the article, or parts of the article, in various formats.
Downloads (link to download the article as PDF)
Open citations (links to open the citations from this article in various online reference manager services)
Cite this article (links to download the citations from this article in formats compatible with various reference manager tools)
How spatial release from masking may fail to function in a highly directional auditory system
eLife 6:e20731.
https://doi.org/10.7554/eLife.20731


