Sam68 promotes self-renewal and glycolytic metabolism in mouse neural progenitor cells by modulating Aldh1a3 pre-mRNA 3'-end processing
- University of Rome Tor Vergata, Italy
- Fondazione Santa Lucia, Italy
- Institute of Cell Biology and Neurobiology CNR, Italy
Figures
Figure 1
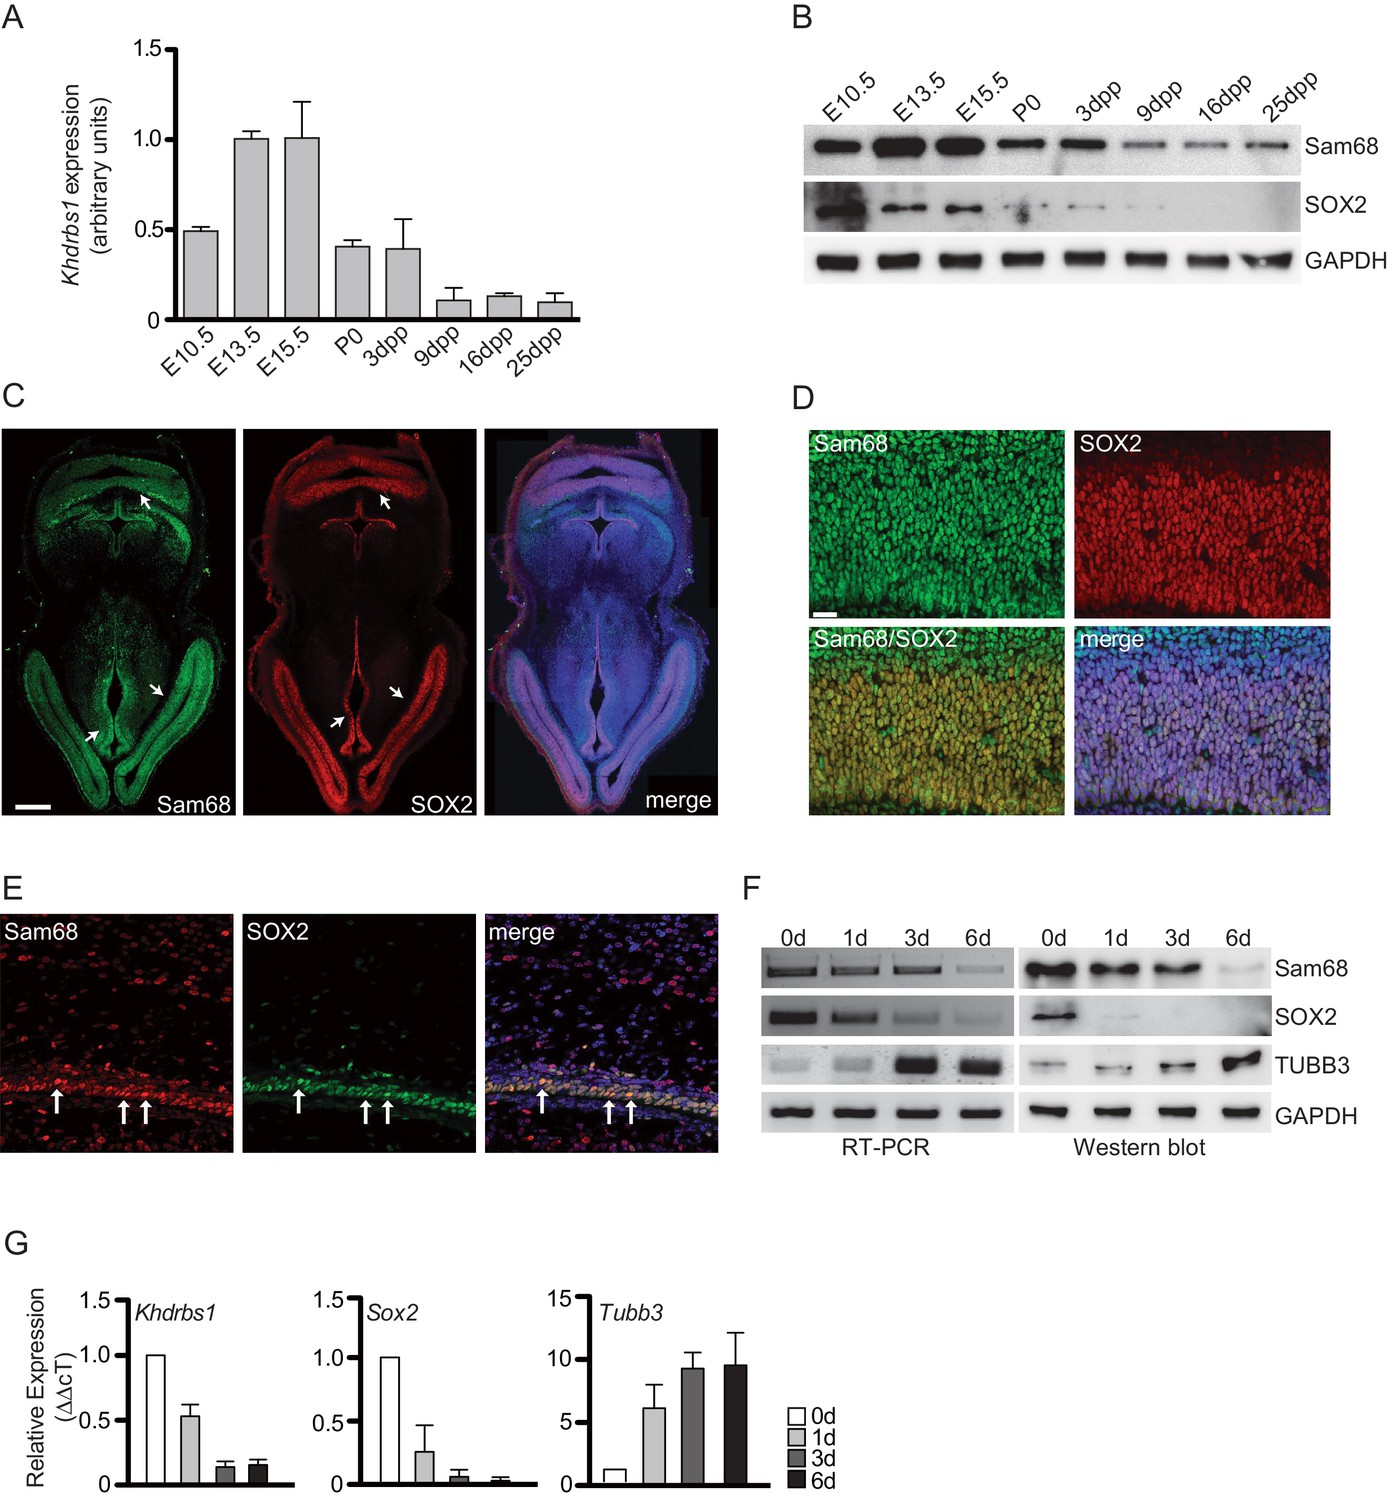
Sam68 is highly expressed in NPCs and decreases during differentiation.
(A) qPCR analysis of Khdrbs1 mRNA levels in the cortex of embryonic (E10.5-E15.5) and post-natal (P0-25dpp) mouse brain. Khdrbs1 relative expression was evaluated by △CT method using L34 expression for normalization. (B) Western blot analysis of Sam68 and SOX2 expression in lysates from embryonic (E10.5-E15.5) and post-natal (P0-25dpp) mouse cortices. GAPDH was used as loading control. (C and D) Immunofluorescence analyses of Sam68 and SOX2 expression in E13.5 mouse brain. (C) Horizontal sections of whole brain; white arrows point to periventricular zones where both proteins are highly expressed. Scale bar = 250 µm. (D) High-magnification confocal images confirm Sam68 and SOX2 colocalization in most cells of the VZ and SVZ. Scale bar = 25 µm. (E) High magnification of confocal images of 1 dpp mouse VZ-SVZ, show the colocalization of Sam68 and SOX2 in NPCs (white arrows). Scale bar = 25 µM. (F) Analysis of Sam68, SOX2 and TUBB3 mRNA (left panels) and protein levels (right panels) in NPCs cultured under proliferating condition (0d) or during 1–6 days of differentiation (1-6d). (G) qPCR analysis of Khdrbs1, Sox2 and Tubb3 mRNA levels in NPCs under proliferation conditions (0d) and 1–6 days of differentiation (1, 3, 6d). Relative expression was evaluated using △△CT method and 0d as reference point. L34 expression was used for the initial △CT normalization. NPCs, Neural progenitor cells.
Figure 2 with 1 supplement
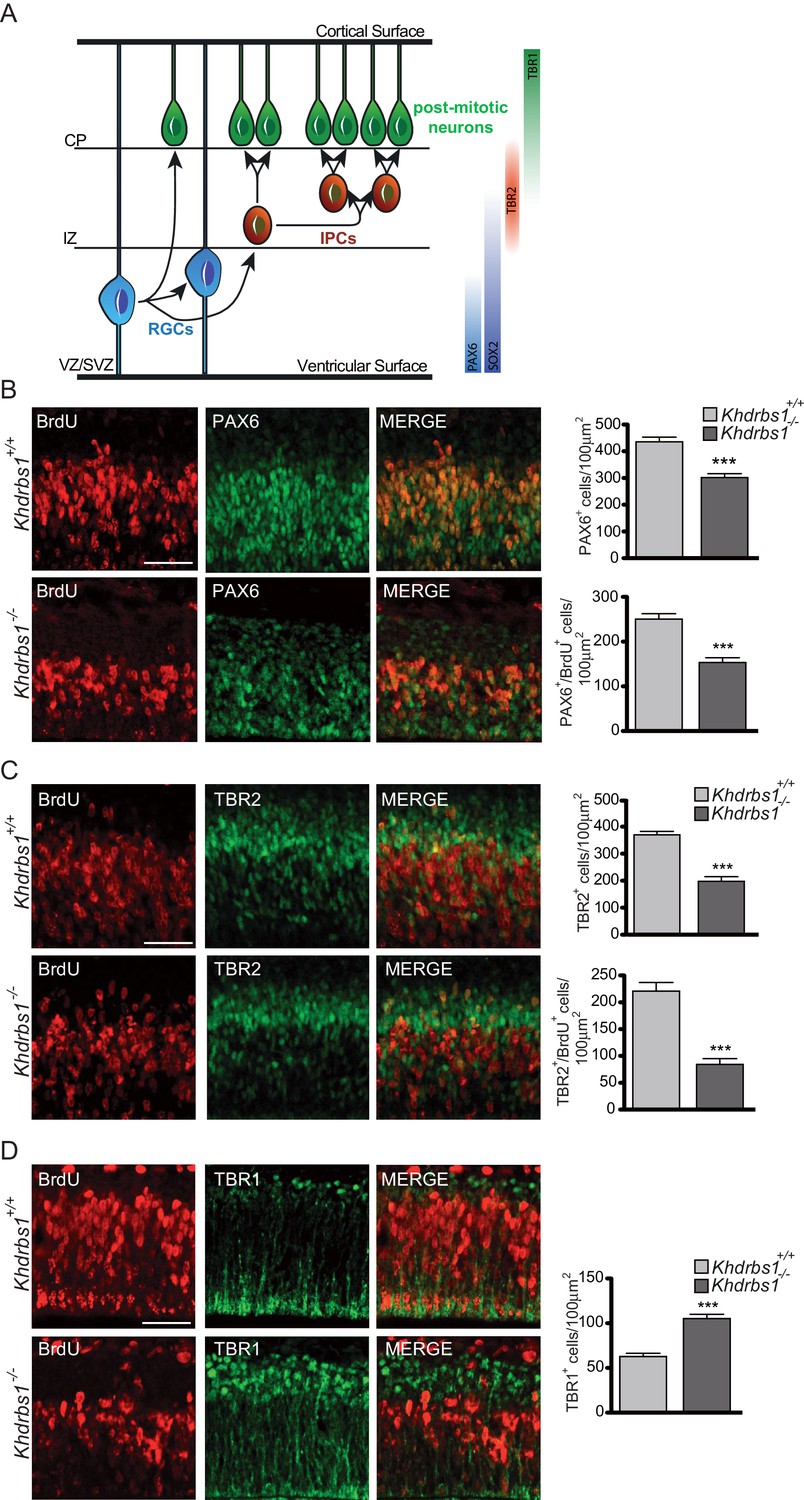
Ablation of Khdrbs1 perturbs neurogenesis in the embryonic cortex.
(A) Schematic representation of the stratification of the VZ/SVZ, intermediate zone (IZ) and cortical plate (CP) in the E13.5 embryonic cortex. Molecular markers, expressed by the respective cell types are represented on the right side of the scheme. (B–D) Immunofluorescence analyses on sections of Khdrbs1+/+and Khdrbs1-/- brain from E13.5 embryos treated for 2 hr with BrdU to label proliferating cells. Sections were stained with anti-PAX6 (B), anti-TBR2 (C) or anti-TBR1 (D). All sections were co-stained with anti-BrdU antibody. Bar graphs on the right side show the number of BrdU/PAX6 (B), BrdU/TBR2 (C) and TBR1 (D) positive cells counted in 100 μm2. N = 3; ***p<0.001. Scale bar = 100 µm. SVZ, Subventricular Zone; VZ, Ventricular Zone; IZ, Intermediate Zone; CP, Cortical Plate; RGCs, Radial Glia Cells; IPCs, Intermediate Progenitor Cells.
Figure 2—figure supplement 1
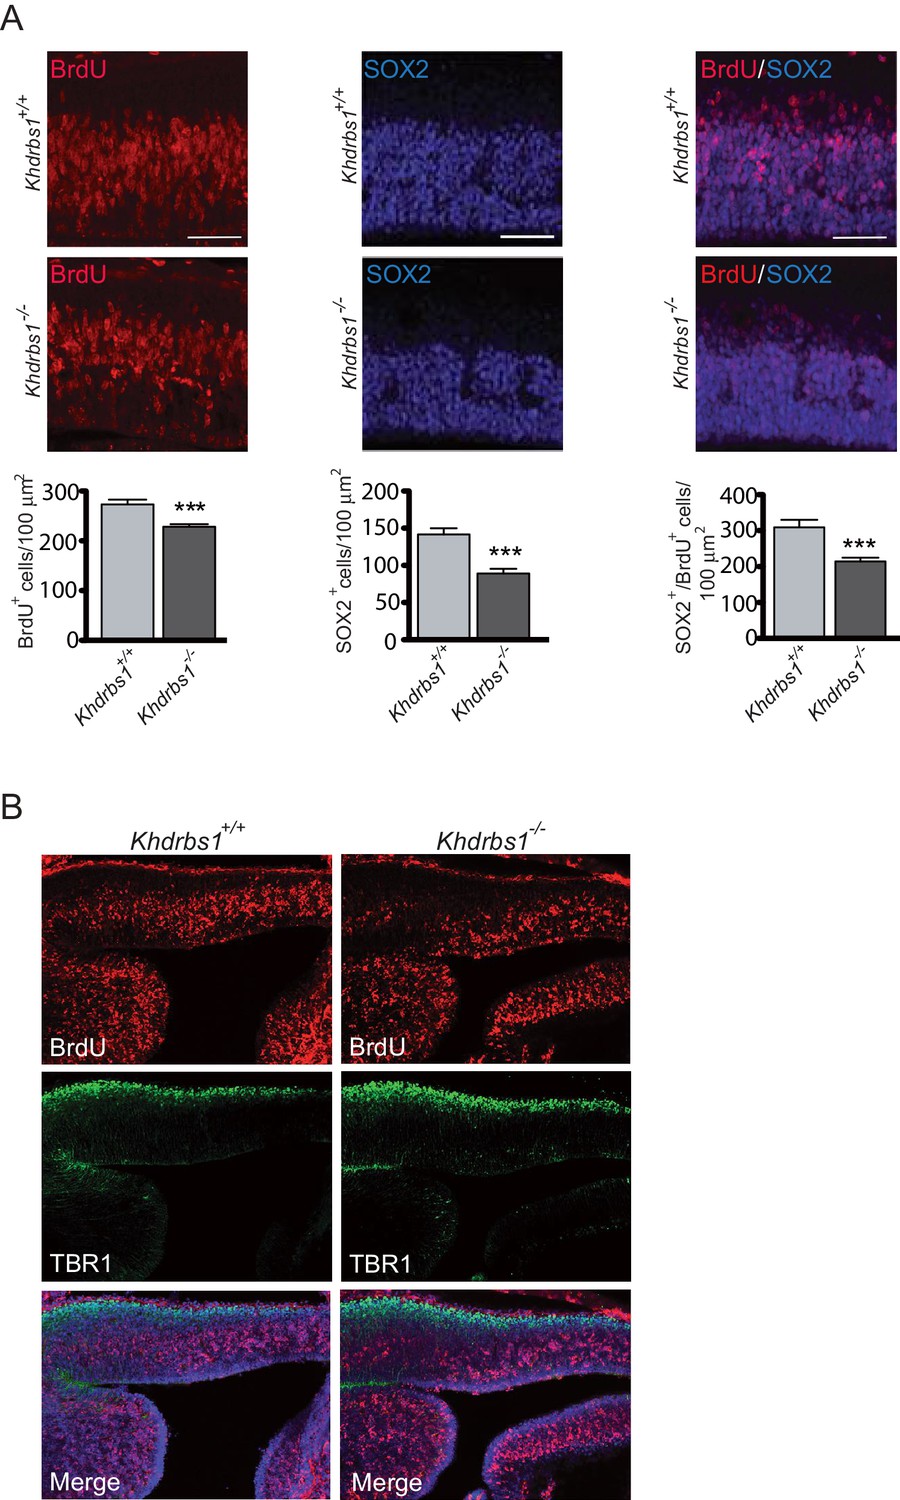
Ablation of Khdrbs1 perturbs neurogenesis in the embryonic cortex.
(A) Representative images of immunofluorescence analysis of BrdU (left panel) and SOX2(center panel) performed in E13.5 cortex of embryos treated with BrdU for 2 hr. Bar graphs represent (mean±SD) measurement of the number of BrdU+ cells (Graph on the left), SOX2+ (Graph on the center) and BrdU+/SOX2+ cells (Graph on the right). N = 3; *** p<0.001. Scale bar = 100 µm. (B) Representative immunofluorescence analysis of BrdU incorporation and TBR1 expression in E13.5 cortex of embryos treated for 2 hr with BrdU.
Figure 3 with 1 supplement
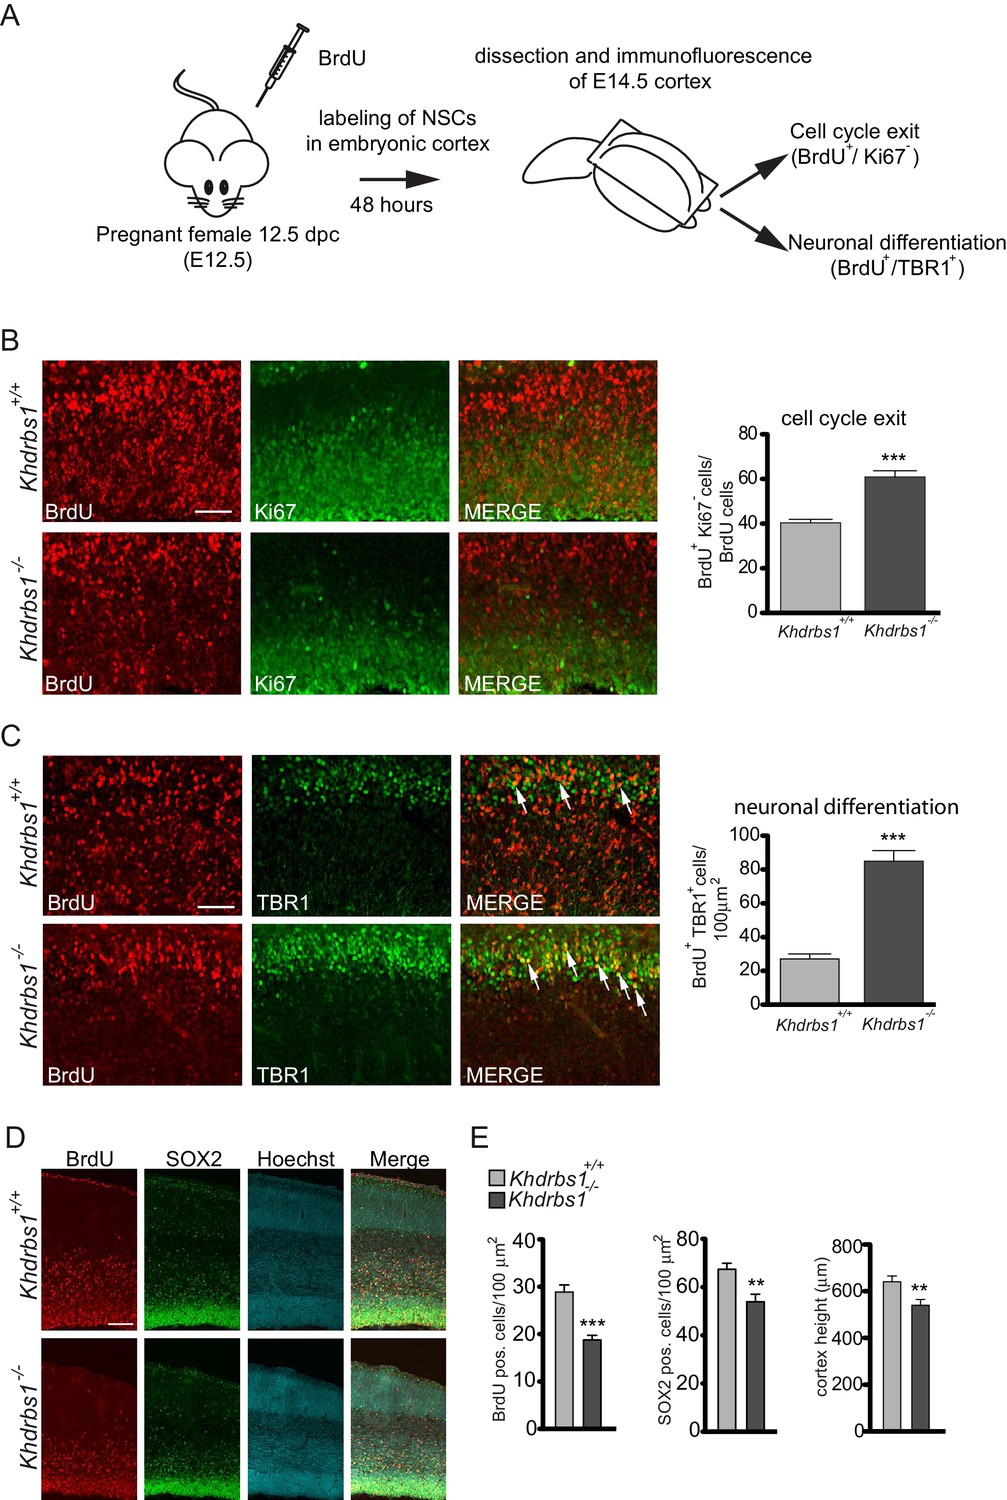
Differentiation of NPCs in post-mitotic neurons is accelerated in the Khdrbs1-/- mouse cortex.
(A) Diagram of the experimental design to investigate the fate on NPCs during neurogenesis. Pregnant females were treated with BrdU at E12.5, and embryos were collected after 2 days for immunofluorescence analyses. (B and C) Confocal images of immunofluorescence analysis of Ki67 (B) and TBR1 (C) in Khdrbs1+/+ and Khdrbs1-/- E14.5 cortex. All sections were co-stained with anti-BrdU antibody. Bar graphs on the right side show the number of BrdU+/Ki67- cells (B) and of BrdU+/TBR1+ cells (C) counted in 100 μm2. N = 3; ***p<0.001; scale bar = 100 µm. (D) Representative images of embryonic cortex of Khdrbs1+/+ andKhdrbs1-/- E17.5 embryos treated with BrdU 2 hr before collection. Sections were processed for immunofluorescence analysis of BrdU and SOX2 and co-stained with Hoechst to detect nuclei. (E) Bar graphs represent (mean±SD) measurement of cortex length from ventricular to pial surface (left), number of BrdU+ cells (middle) and SOX2+ cells (right). N = 3; *** p<0.001; ** p<0.01. Scale bar = 100 µm.
Figure 3—figure supplement 1
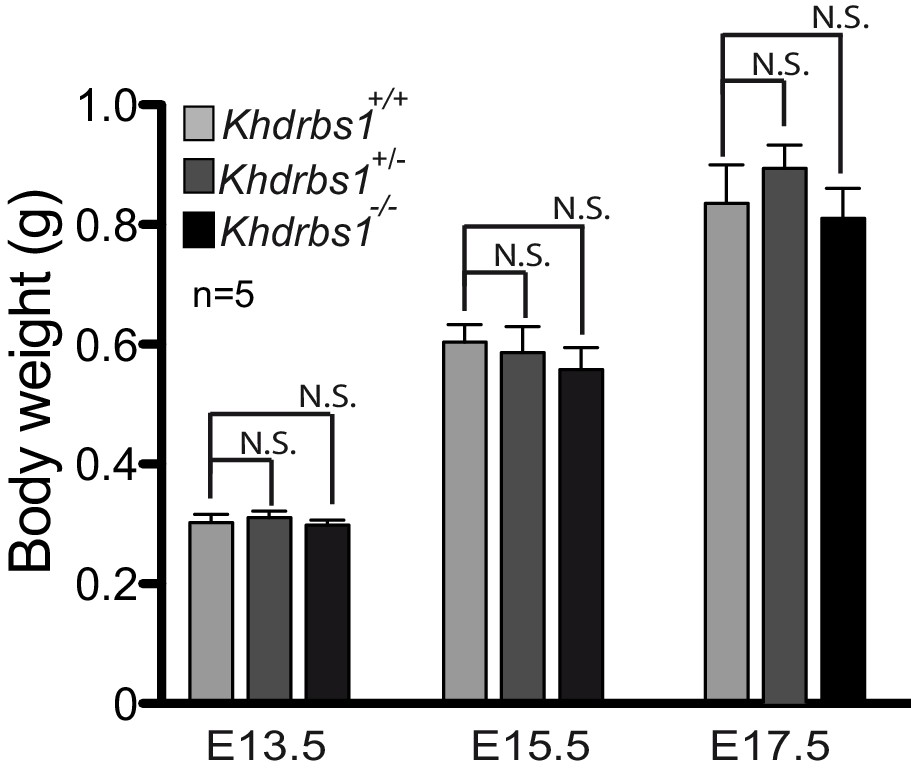
Ablation of Khdrbs1 does not affect overall embryo development.
Weight analysis of Khdrbs1+/+, Khdrbs1+/- and Khdrbs1-/- mouse embryos at E13.5, 15.5 and E17.5. At least 5 embryos for each genotype were weighted. Statistical analysis was performed using the ANOVA one-way test and Tuckey post-test.
Figure 4 with 3 supplements
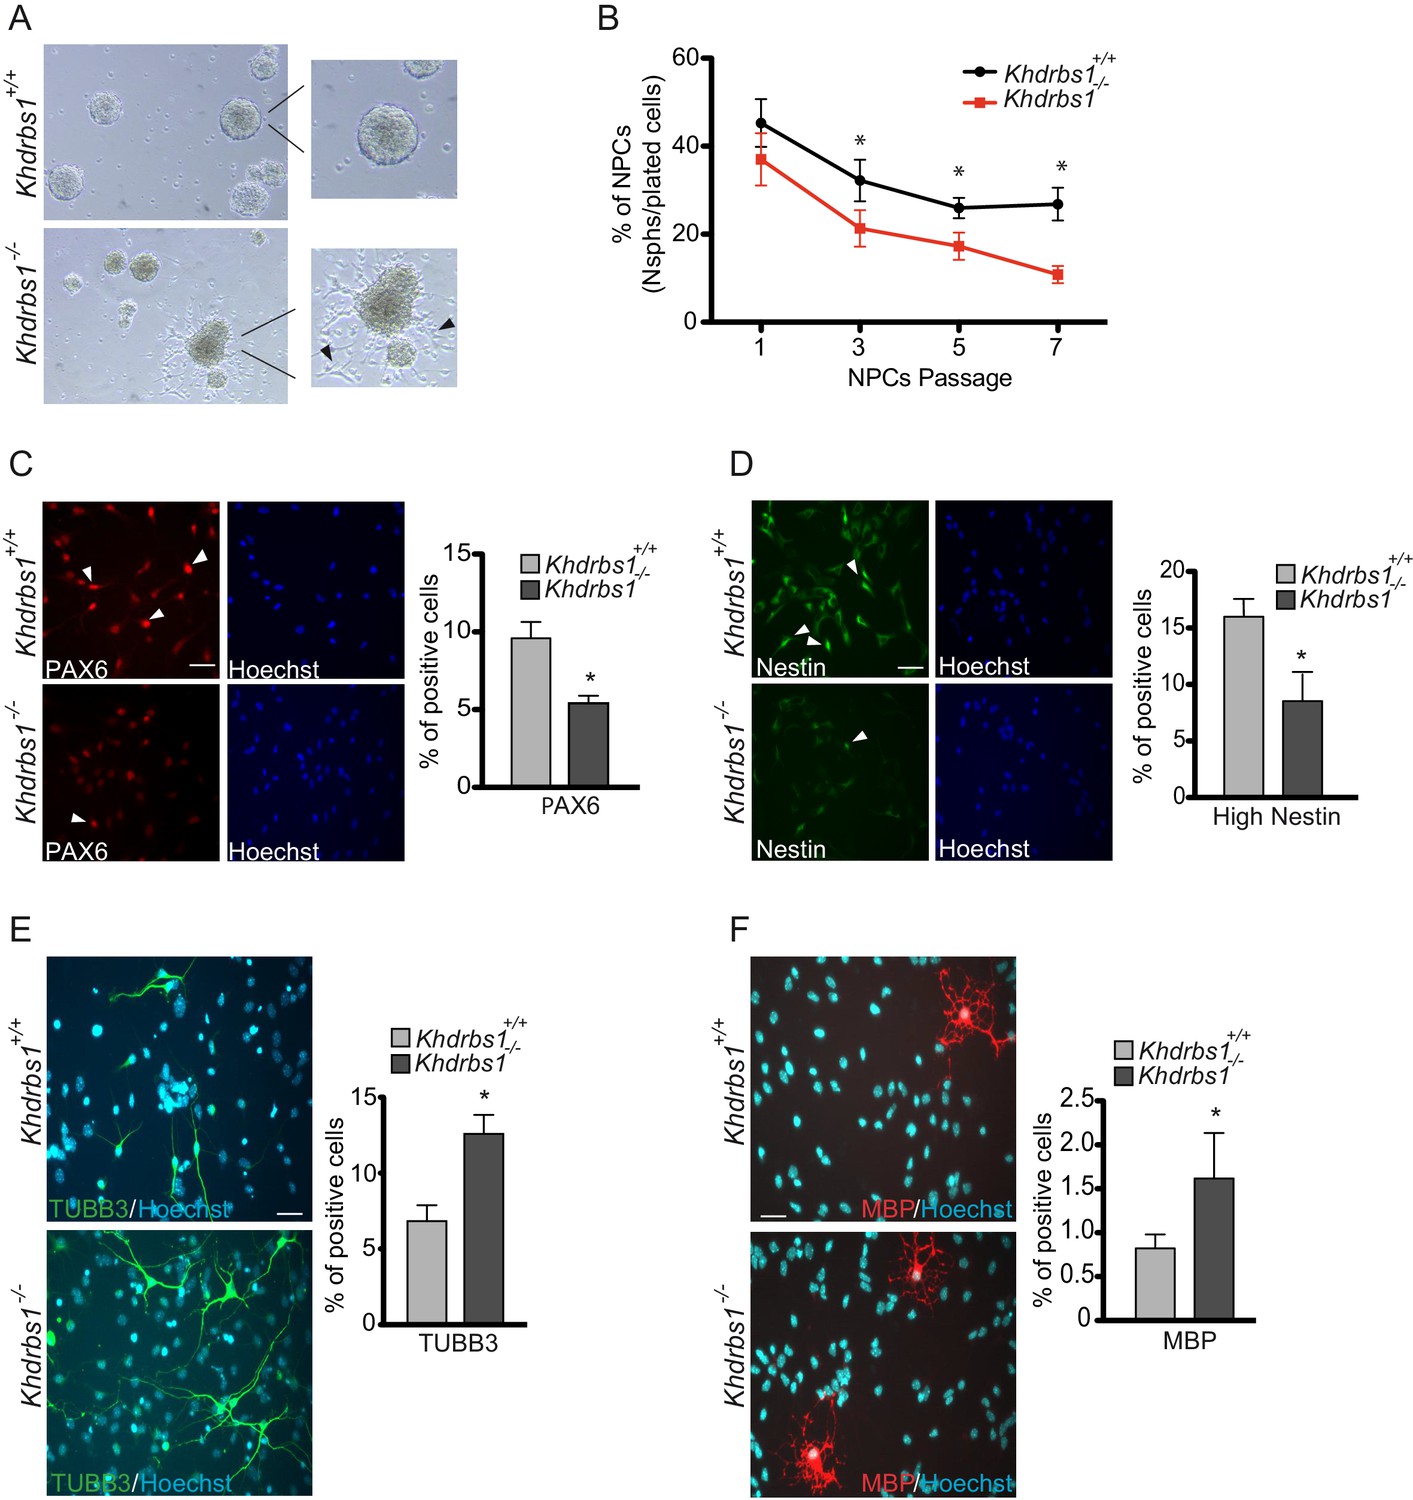
Sam68-/-NPCs lose stemness and are prone to differentiate in culture.
(A) Bright field images of Khdrbs1+/+ and Khdrbs1-/- NPCs cultured in proliferating condition for 3 days in culture. The insets show higher magnification of a selected neurosphere. Black arrowheads point to Khdrbs1-/- NPCs exiting the sphere and attaching to the surface. (B) Clonogenic assay of Khdrbs1+/+ and Khdrbs1-/- NPCs. Clonogenicity was expressed as the percentage of neurospheres obtained from the seeded NPCs at each indicated passage. Data represent mean±SD of 3 independent experiments; * p<0.05. (C and D) Immunofluorescence analysis of the stemness markers PAX6 (C) and Nestin (D) in Khdrbs1+/+ andKhdrbs1-/- NPCs cultured in differentiating condition for 1 day. Arrowheads point to high-PAX6+ cells (C) and high-Nestin+ cells (D). Bar graphs represent (mean±SD) measurement of number of high-PAX6+ cells (C) and high-Nestin+ cells (D). N = 3; * p<0.05; scale bars 50 µm. (E and F) Immunofluorescence analysis of expression of the neuronal marker TUBB3 (E) and of the oligodendrocyte marker MBP (F) in Khdrbs1+/+ and Khdrbs1-/- NPCs, differentiated for 3 days. Bar graphs represent (mean±SD) measurement of number of TUBB3+ cells (E) and MBP+ cells (F). Analysis results were reported on the graphs on the right of the images. N = 3; * p<0.05; scale bars 50 µm. NPCs, Neural progenitor cells.
-
Figure 4—source data 1
List of the genes upregulated and downregulated inSam68 knockout NPCs.
Yellow=upregulated genes; green=downregulated genes. NPCs, Neural progenitor cells.
- https://doi.org/10.7554/eLife.20750.009
-
Figure 4—source data 2
List of exons regulated by SAM68 in mouse NPCs.
Green: genes downregulated at expression level; Yellow: genes up-regulated at expression level; White: genes unchanged at expression level. NPCs, Neural progenitor cells.
- https://doi.org/10.7554/eLife.20750.010
Figure 4—figure supplement 1
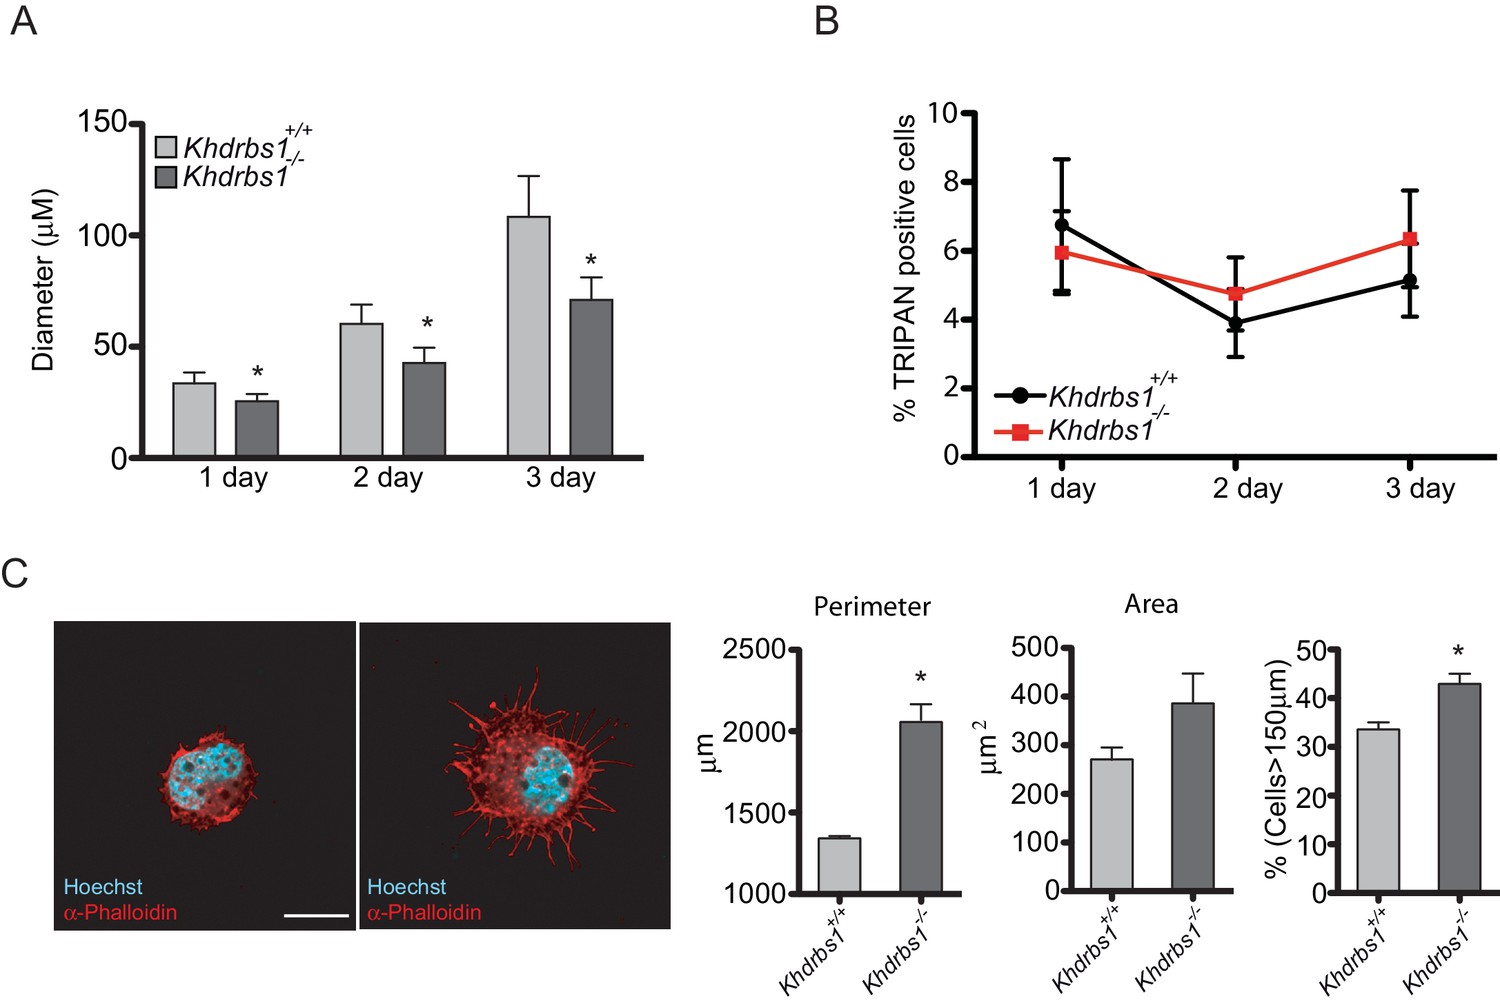
Khdrbs1-/- NPCs lose stemness and are prone to differentiate in culture.
(A) Bar graph reporting the analysis of the diameter of neurospheres formed by Khdrbs1+/+ and Khdrbs1-/- NPCs in 1–3 days of culture. N = 3; *p<0.05. (B) Cell death analysis of Khdrbs1+/+ and Khdrbs1-/- NPCs assessed during the indicated days of proliferation. (C) Confocal images of immunofluorescence analysis of actin cytoskeleton stained with phalloidin in Khdrbs1+/+ and Khdrbs1-/- NPCs seeded as single cell on polyornithine/laminin-coated dishes. The bar graphs on the right show the average perimeter, area and number of cells with a perimeter > 150 µm, respectively. At least 10 cells/experiment were measured. N = 5; * p<0.05. Scale bar = 10 µm. NPCs, Neural progenitor cells.
Figure 4—figure supplement 2
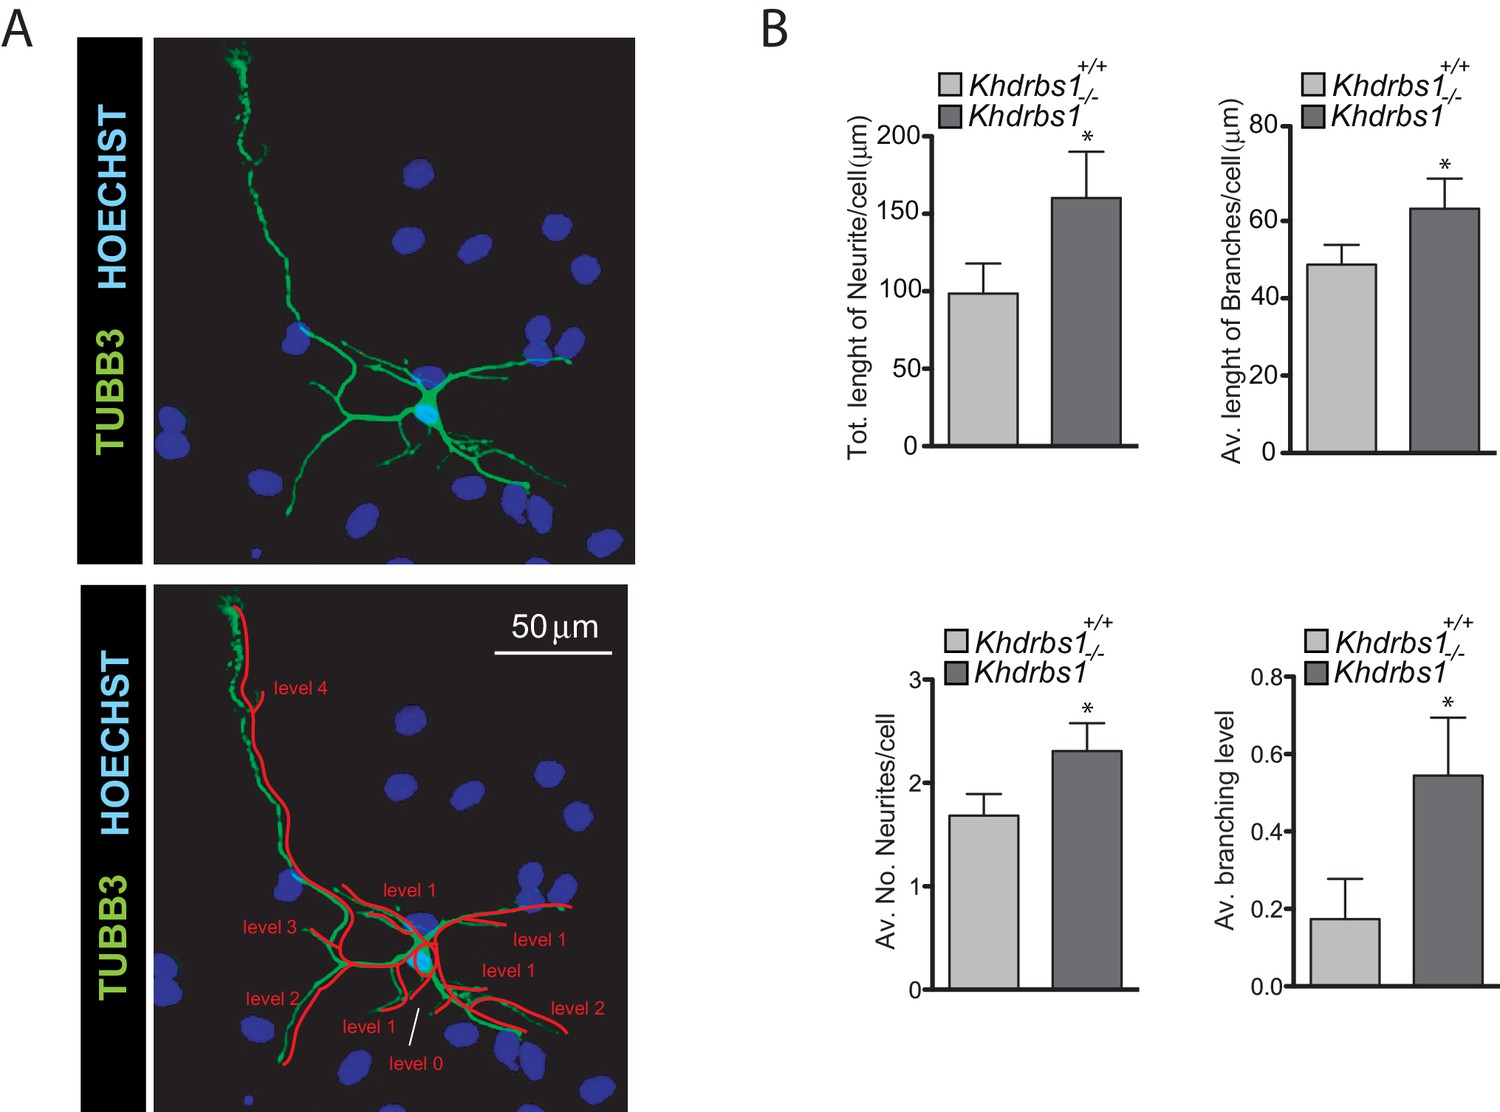
Khdrbs1-/- NPCs-derived neurons display more complex morphology.
(A) Images representing a typical neuron obtained through the differentiation of Khdrbs1-/- NPCs (upper image) and the representation of the scheme used to quantify the complexity of its structure for the evaluation of branching level (lower image). (B) Analysis of the complexity and of the differentiation stage of Khdrbs1+/+ and Khdrbs1-/-. Bar graphs represent the total length of neurites per cell, the average length of each branch per cell, the average number of neurites and the average branching level, as reported in (A) of neurons obtained after 3 days of differentiation. At least 10 cells/experiment were measured. N = 5; * p<0.05.
Figure 4—figure supplement 3
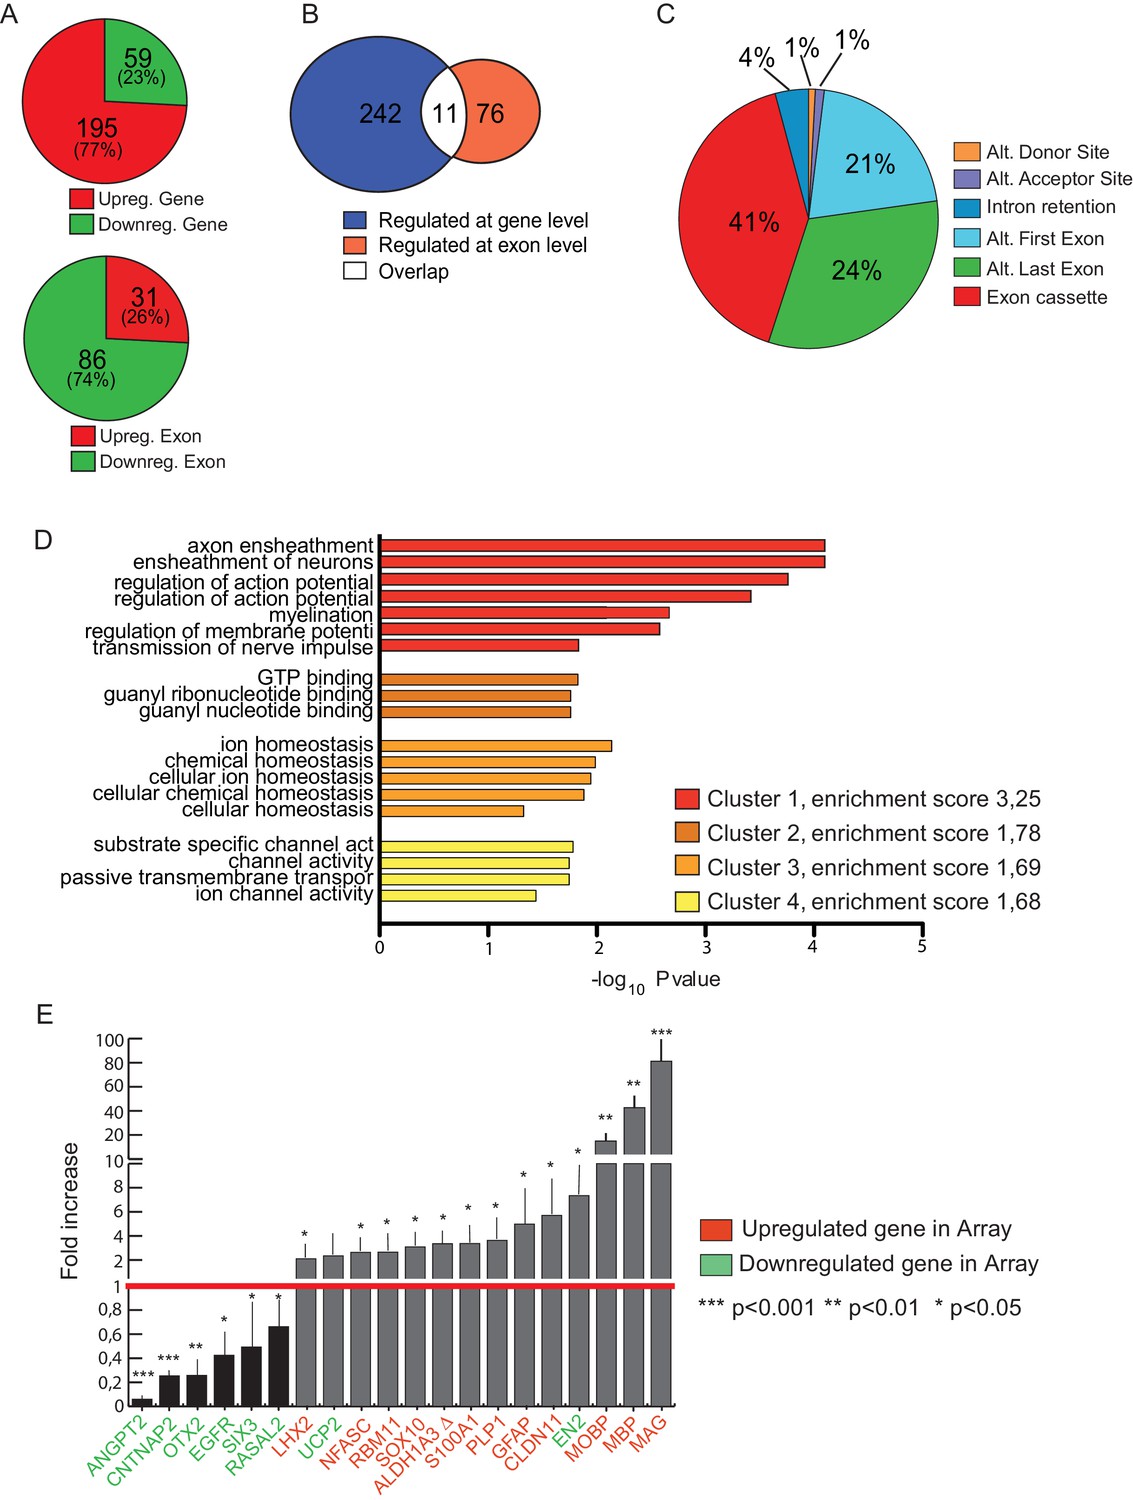
High-throughput analyses of the transcriptomic of Khdrbs1-/-NPCs.
(A) Analysis of the gene and exon expression in Khdrbs1-/- vs Khdrbs1+/+ NPCs reporting upregulated and downregulated events. (B) Overlap between the genes regulated at expression and splicing level in Khdrbs1-/- vs Khdrbs1+/+ NPCs. (C) Pie chart representing the percentage of each splicing pattern among the regulated events identified by the exon array experiment. (D) Cluster Gene Ontology (GO) terms enrichment analysis performed using DAVID bioinformatics resources. (E) Validation of exon array experiment performed by qPCR on representative genes. Validation rate was 80%. *p<0.05, **p<0.01, ***p<0.001. NPCs, Neural progenitor cells.
Figure 5 with 1 supplement

Sam68 regulates the alternative 3'-end processing of ALDH1A3 pre-mRNA.
(A) Diagram of ALDH1A3 gene structure. Red and green squares represent exons, respectively, upregulated and downregulated in the microarray analysis. Proximal polyadenylation site (pPAS) and distal (dPAS) polyadenylation site are also represented. Black arrows indicate the regions were primers for RT-PCR validation were designed. (B) Conventional RT-PCR analysis for the validation of the canonical and alternative ALDH1A3 transcripts expressed in Khdrbs1+/+ and Khdrbs1-/- NPCs. (C) Schematic representation of 3'-RACE PCR experimental design. Arrows indicate the position of the P1 and P2 forward primers used for the RACE experiment. (D) 3'-RACE PCR analysis of ALDH1A3 alternative transcripts expressed in Khdrbs1+/+ and Khdrbs1-/- NPCs. Asterisks mark the bands that were sequenced to identify the pPAS. (E) Sequence obtained through DNA sequencing of bands amplified by 3'-RACE PCR. Blue and green letters represent exon and intron sequences, respectively. Exon (blue), intron (green), alternative PAS (highlighted in yellow) and the two putative cleavage sites (red) are indicated. (F) CLIP assay of Sam68 binding to the ALDH1A3 pre-mRNA. E13.5 mouse cortices were UV-crosslinked and immunoprecipitated with control IgGs or anti-Sam68 IgGs. The upper panel shows a schematic representation of ALDH1A3 gene structure and primers (black arrows) used in the assay. The bar graph shows qPCR signals amplified from the CLIP assays expressed as percentage of amplification in the input RNA.
Figure 5—figure supplement 1
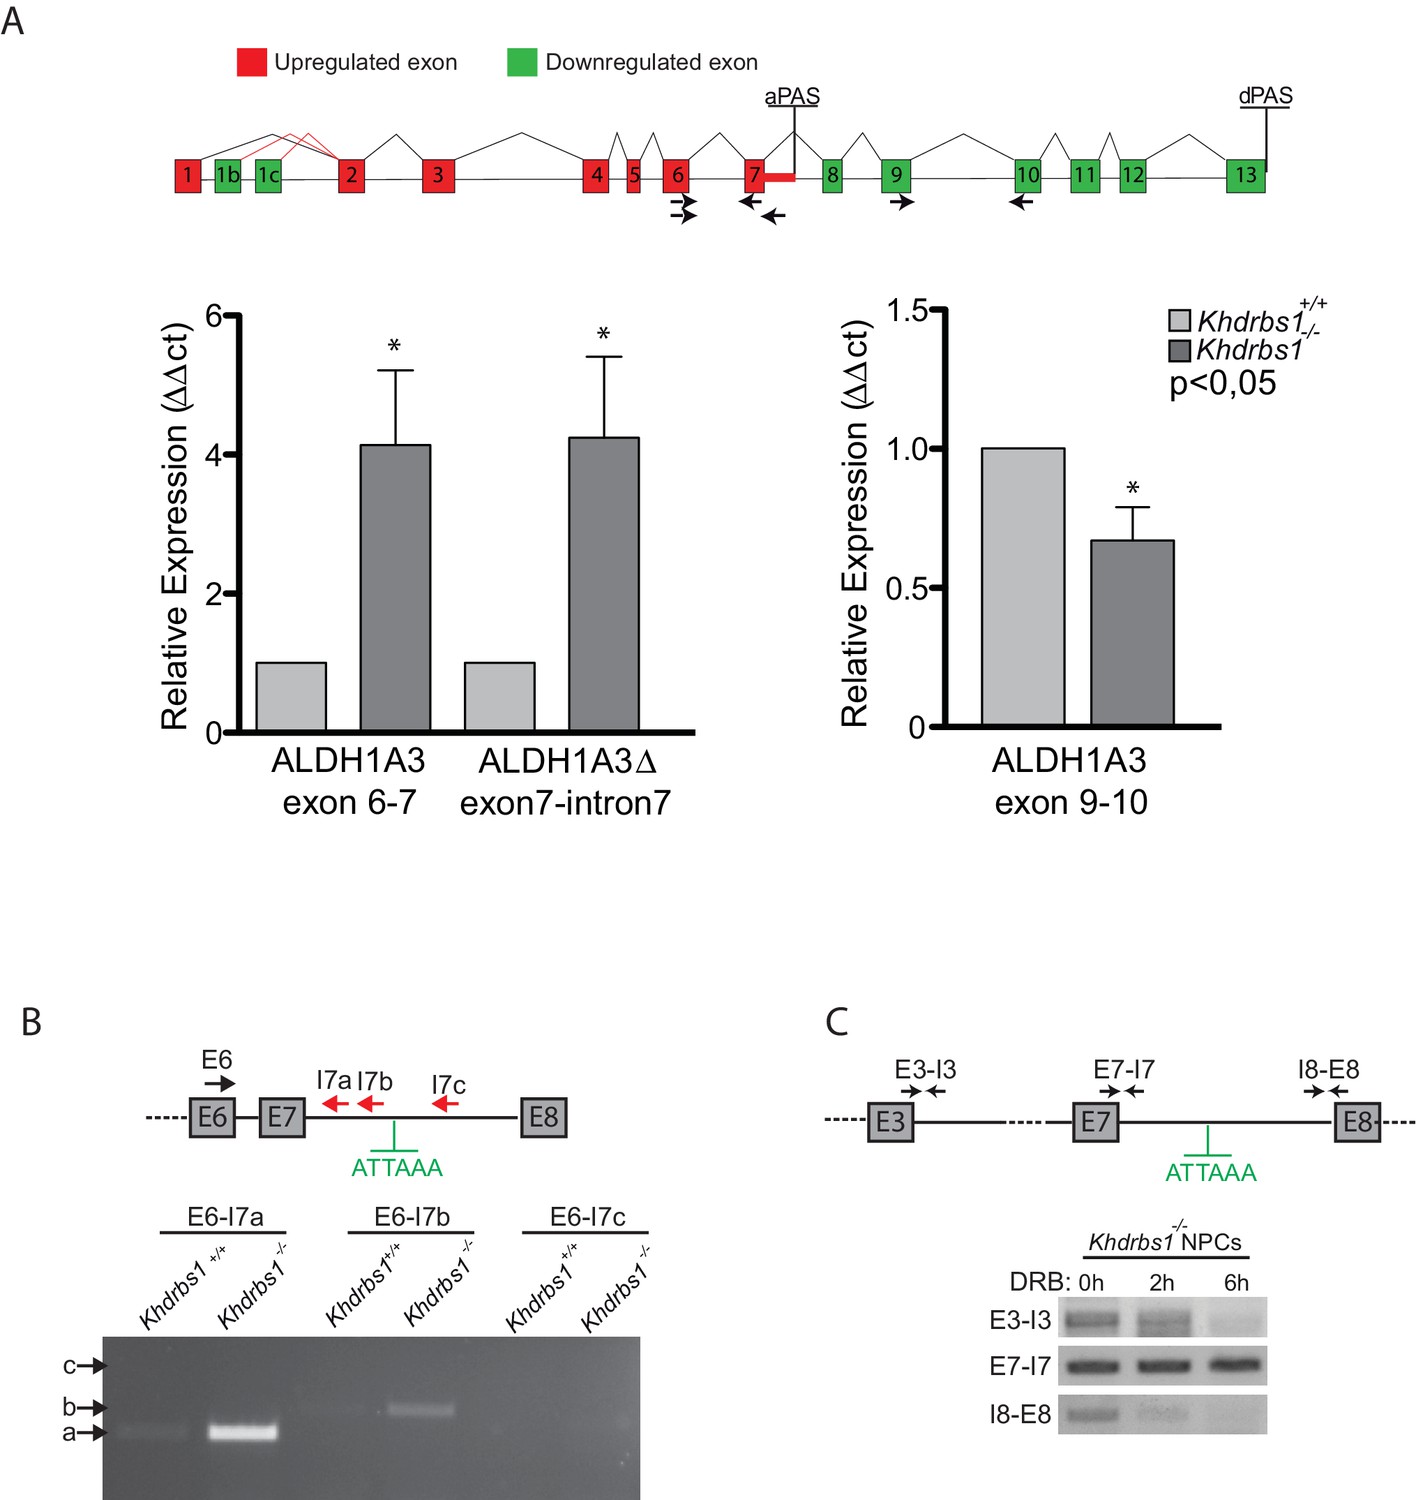
Sam68 regulates the alternative 3'-end processing of ALDH1A3 pre-mRNA.
(A) Diagramatic scheme of the Aldh1a3 gene reporting the up- (red) and down-regulated (green) exons identified by the microarray experiment. The bar graphs represent the results of qPCR analyses reported to validate the alternative 3-end processing event suggested by the microarray experiment in Khdrbs1-/- NPCs. N = 3; *p<0.05. (B) RT-PCR to validate the alternative polyadenylation of ALDH1A3 and to rule out accumulation of the unspliced pre-mRNA. Reactions were performed using a forward primer in exon 6 (E6) and reverse primers annealing upstream (I7a and I7b) or downstream (I7c) of the alternative PAS and RNA extracted from Khdrbs1+/+ and Khdrbs1-/- NPCs. (C) RT-PCR of Khdrbs1-/- NPCs treated for 2 or 6 hr with 75 µM DRB to block transcription. Amplification of ~150 bp bands was performed using primers spanning the exon-intron regions indicated in the diagram.
Figure 6 with 1 supplement

Sam68 promotes ALDH1A3 expression and activity.
(A) Western blot analysis of the expression of ALDH1A3 and Sam68 in lysates from Khdrbs1+/+ and khdrbs1-/- NPCs. Vinculin was used as loading control. The bar graph represent densitometric analyses of ALDH1A3 expression (mean±SD of 3 independent experiments; * p<0.05). (B) Representative flow cytometric analysis of ALDH activity performed on Khdrbs1+/+ and khdrbs1-/-NPCs (left and center panel) by ALDEFLUOR assay. Gate was determined using NPCs treated with DEAB as negative control. SSC: side scatter value to measure cell complexity. Results (mean±SD; * p<0.05) of 4 independent experiments are reported in the bar graph on the right. (C) Horizontal sections of E13.5 Khdrbs1+/+ and khdrbs1-/- cortex immunostained with ALDH1A3 and SOX2 antibodies. Scale bar 100 µm. Graph on the right represents counts of ALDH1A3+/SOX2+-positive cells. N = 3; *** p<0.001. (D) RT-PCR analysis of the expression of full length Aldh1a3, ALDH1A3△, and Khdrbs1 in Khdrbs1+/+ NPCs cultured under proliferating (0d) and differentiating conditions (1-6d). (E) Correlation analysis between the expression levels of Khdrbs1 and full length Aldh1a3 determined by qPCR analysis of RNA extracted from the indicated brain regions. Pearson’s correlation test was used. Trend line is represented in red and the inset shows the magnification of the respective portion of the graph. (F) qPCR analysis of the expression of full length Aldh1a3 (Ex 9–10) and ALDH1A3△ (Ex7– In7) in Khdrbs1+/+ and khdrbs1-/-cerebellum and olfactory bulbs. N = 3; *p<0.05. (E–F) Khdrbs1 and Aldh1a3 relative expression was evaluated by △CT method using L34 expression for normalization.
Figure 6—figure supplement 1
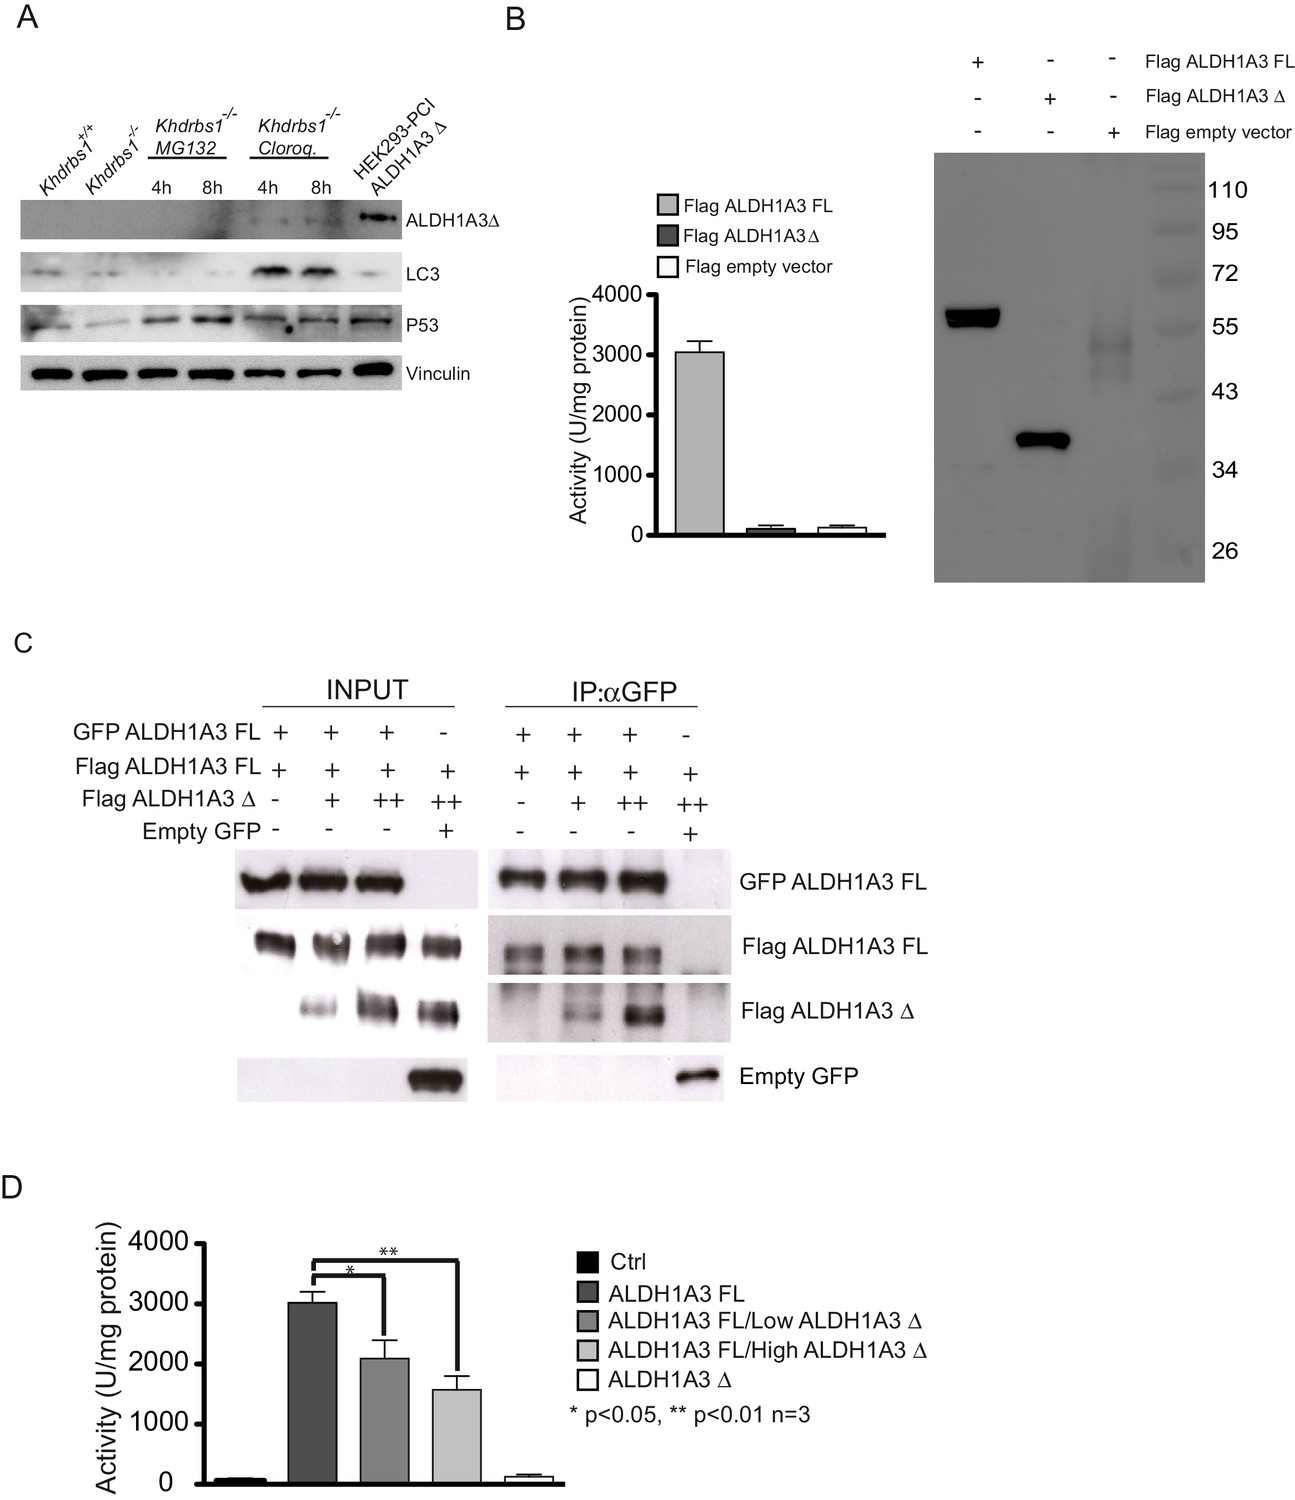
Sam68 promotes ALDH1A3 expression and activity.
(A) Western blot analysis of ALDH1A3△ expression in Khdrbs1-/- NPCs treated with 10 µM proteasome inhibitor MG132 and 2 µM autophagy inhibitor Chloroquine. HEK293 cells transfected with pCI-ALDH1A3△ were used as positive control for ALDH1A3△ expression. P53 (MG132) and LC3 (chloroquine) accumulation was used as control of the inhibitors activity; Vinculin was used as loading control. (B) Enzymatic assay (bar graph on the left) and western blot analysis (right panel) to analyze the activity and the expression of Flag-tagged FL ALDH1A3 and ALDH1A3△ recombinant proteins transfected in Hek293 cells. (C) Co-immunoprecipitation assays performed in HEK293 cell co-transfected with GFP-ALDH1A3 full length plasmid or GFP plasmid as control, Flag-ALDH1A3 full length plasmid and raising concentration (2.5 and 5 µg) of Flag-ALDH1A3 △ plasmid. After transfection cell lysates were immunoprecipitated with GFP antibody and the proteins in the complexes were revealed with either anti-GFP or anti-FLAG antibodies. (D) Enzymatic assay of the activity of full length (FL) ALDH1A3 and ALDH1A3△ recombinant proteins transfected either alone or in combination in HEK293 cells. (mean±SD of 3 independent experiments; * p<0.05; ** p<0.01).
Figure 7 with 2 supplements
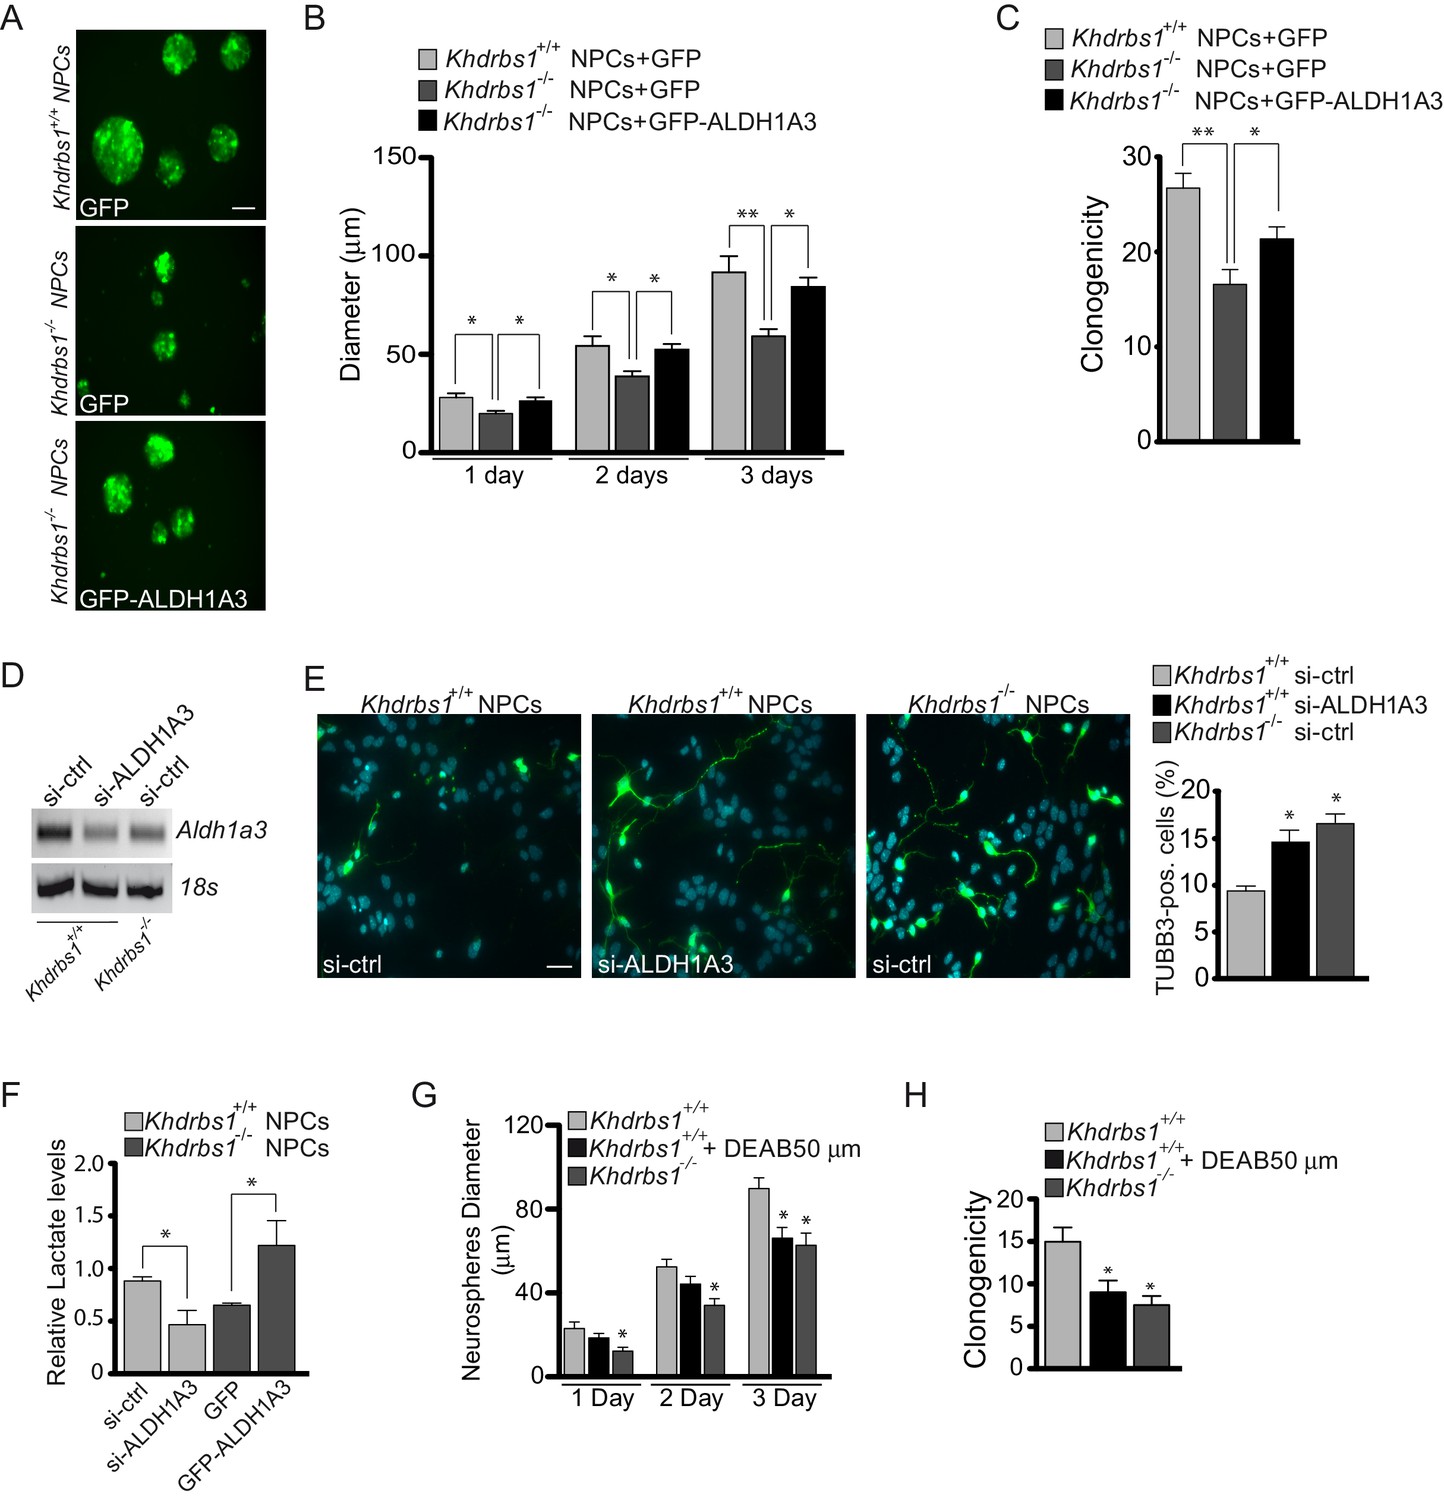
ALDH1A3-dependent glycolytic metabolism rescues the self-renewal potential of Khdrbs1-/- NPCs.
(A) Representative images of Khdrbs1+/+ NPCs transfected with GFP vector and Khdrbs1-/- NPCs transfected with GFP and GFP-ALDH1A3 vectors, cultured for 3 days in proliferating condition. Scale bar 50 µm. (B) Bar graph reporting the analysis of the diameter of neurospheres formed by transfected NPCs in 1–3 days of culture. N = 3; *p<0.05; **p<0.01. (C) Clonogenic assay of Khdrbs1+/+ and Khdrbs1-/- NPCs transfected as indicated. N = 3; *p<0.05. (D) RT-PCR analysis of Aldh1a3 expression in Khdrbs1+/+and Khdrbs1-/- NPCs transfected with si-CTRL or si-ALDH1A3 siRNAs. (E) Differentiation assay of Khdrbs1+/+ and Khdrbs1-/- NPCs transfected with the same siRNAs used in (D). Images are representative of the third day of culture in differentiation condition. Scale bar 50 µm. Bar graph represent (mean±SD) measurement of number of TUBB3+ cells. N = 3; * p<0.05 (F) Glycolytic activity measured by lactate accumulation in the medium of Khdrbs1+/+ and Khdrbs1-/- NPCs transfected as indicated. (G) Bar graph reporting the analysis of the diameter of neurospheres formed by Khdrbs1+/+ and Khdrbs1-/- NPCs cultured in proliferating condition for 3 days in the presence or absence of the ALDH inhibitor DEAB (50 µM). N = 3; *p<0.05. (H) Clonogenic assay of Khdrbs1+/+ and Khdrbs1-/- NPCs cultured in proliferating condition in the presence or absence of 50 µM DEAB. N = 3; *p<0.05.
Figure 7—figure supplement 1
ALDH1A3-dependent glycolytic metabolism rescues the self-renewal potential of Khdrbs1-/- NPCs.
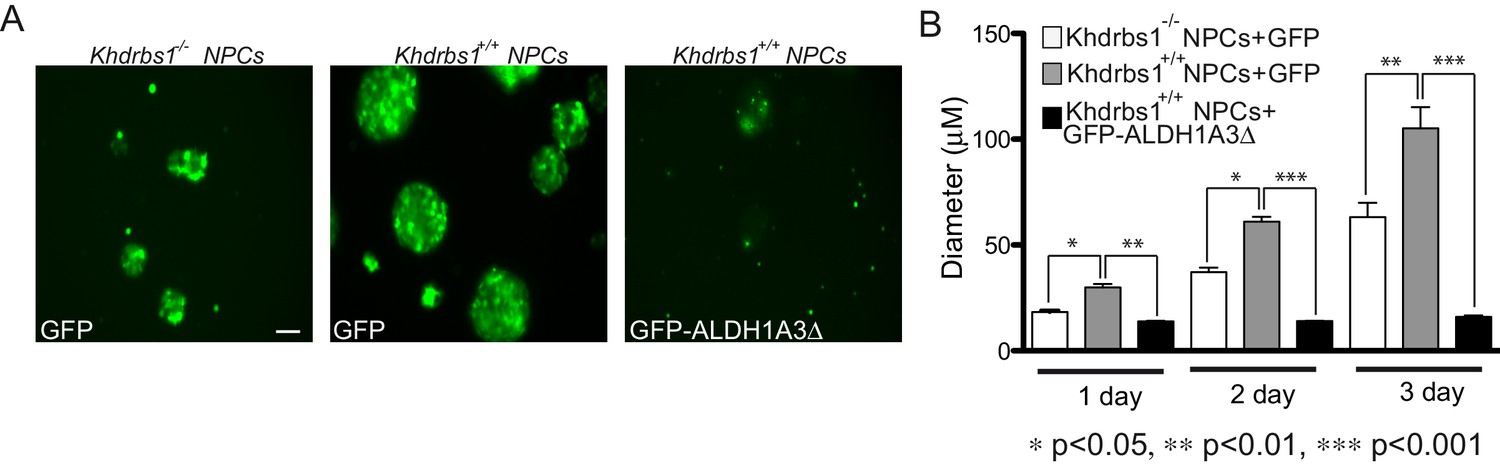
(A) Representative images of Khdrbs1-/- NPCs transfected with GFP vector and Khdrbs1+/+ NPCs transfected with GFP and GFP-ALDH1A3△ vectors, cultured for 3 days in proliferating condition. Scale bar 50 µm. (B) Bar graph reporting the analysis of the diameter of neurospheres formed by transfected NPCs in 1–3 days of culture. N = 3; *p<0.05; **p<0.01; ***p<0.001.
Figure 7—figure supplement 2

ALDH1A3-dependent glycolytic metabolism rescues the self-renewal potential of Khdrbs1-/- NPCs.
(A) Evaluation of the relative lactate production of Khdrbs1+/+ and Khdrbs1-/- NPCs cultured under proliferating condition. (B) Relative lactate production in Khdrbs1+/+ or Khdrbs1-/- NPCs treated or not with the indicated concentration of the ALDH inhibitor DEAB. (C) Analysis of the relative lactate production in Khdrbs1+/+ in proliferation condition (0d) and during differentiation process (1-6d). N = 3, *p<0.05, **p<0.01, ***p<0.001.
Figure 8
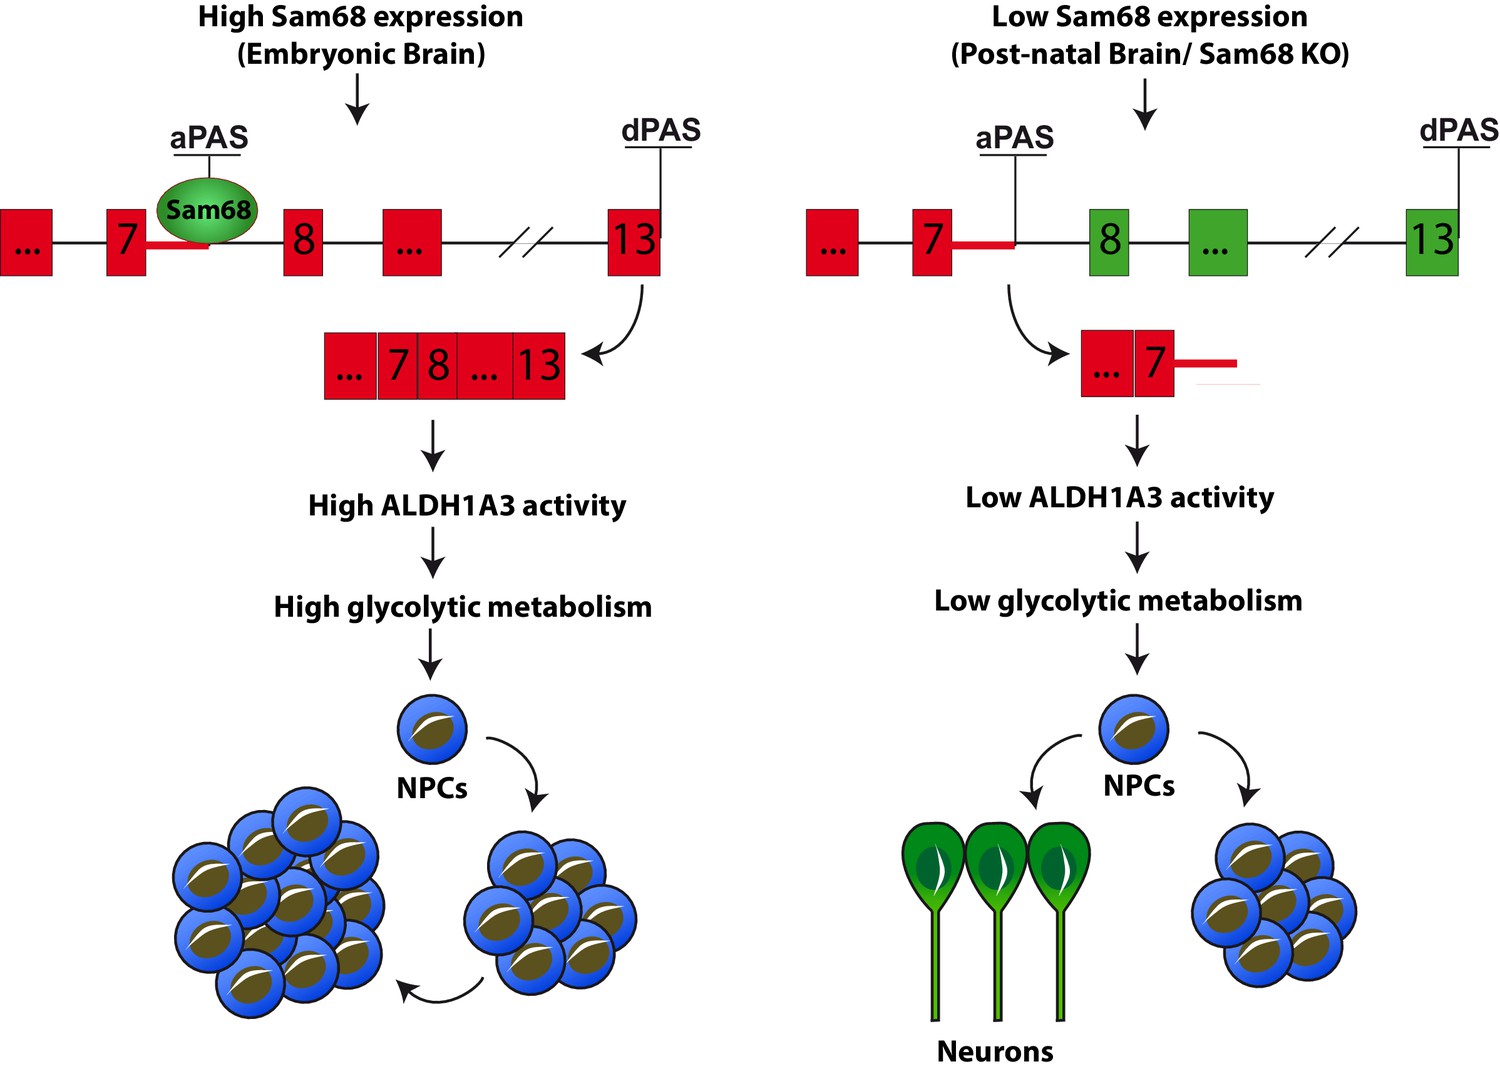
Sam68 modulates neurogenesis through regulating ALDH1A3 expression.
Schematic model of the function of Sam68 in the modulation of NPCs stemness. High Sam68 expression in NPCs of the neocortex insures high expression of ALDH1A3 protein and anaerobic glycolysis, thus promoting NPC self-renewal and cortical expansion. Upon differentiation, Sam68 expression declines, causing premature termination of Aldh1a3 transcription, reduced ALDH activity and glycolytic metabolism, thus enhancing NPC differentiation into post-mitotic neurons.
Additional files
-
Supplementary file 1
List of the oligonucleotides used as PCR primers and siRNAs in the study.
- https://doi.org/10.7554/eLife.20750.022
Download links
A two-part list of links to download the article, or parts of the article, in various formats.
Downloads (link to download the article as PDF)
Open citations (links to open the citations from this article in various online reference manager services)
Cite this article (links to download the citations from this article in formats compatible with various reference manager tools)
Sam68 promotes self-renewal and glycolytic metabolism in mouse neural progenitor cells by modulating Aldh1a3 pre-mRNA 3'-end processing
eLife 5:e20750.
https://doi.org/10.7554/eLife.20750


