AMP-activated protein kinase fortifies epithelial tight junctions during energetic stress via its effector GIV/Girdin
- University of California, San Diego, United States
Figures
Figure 1
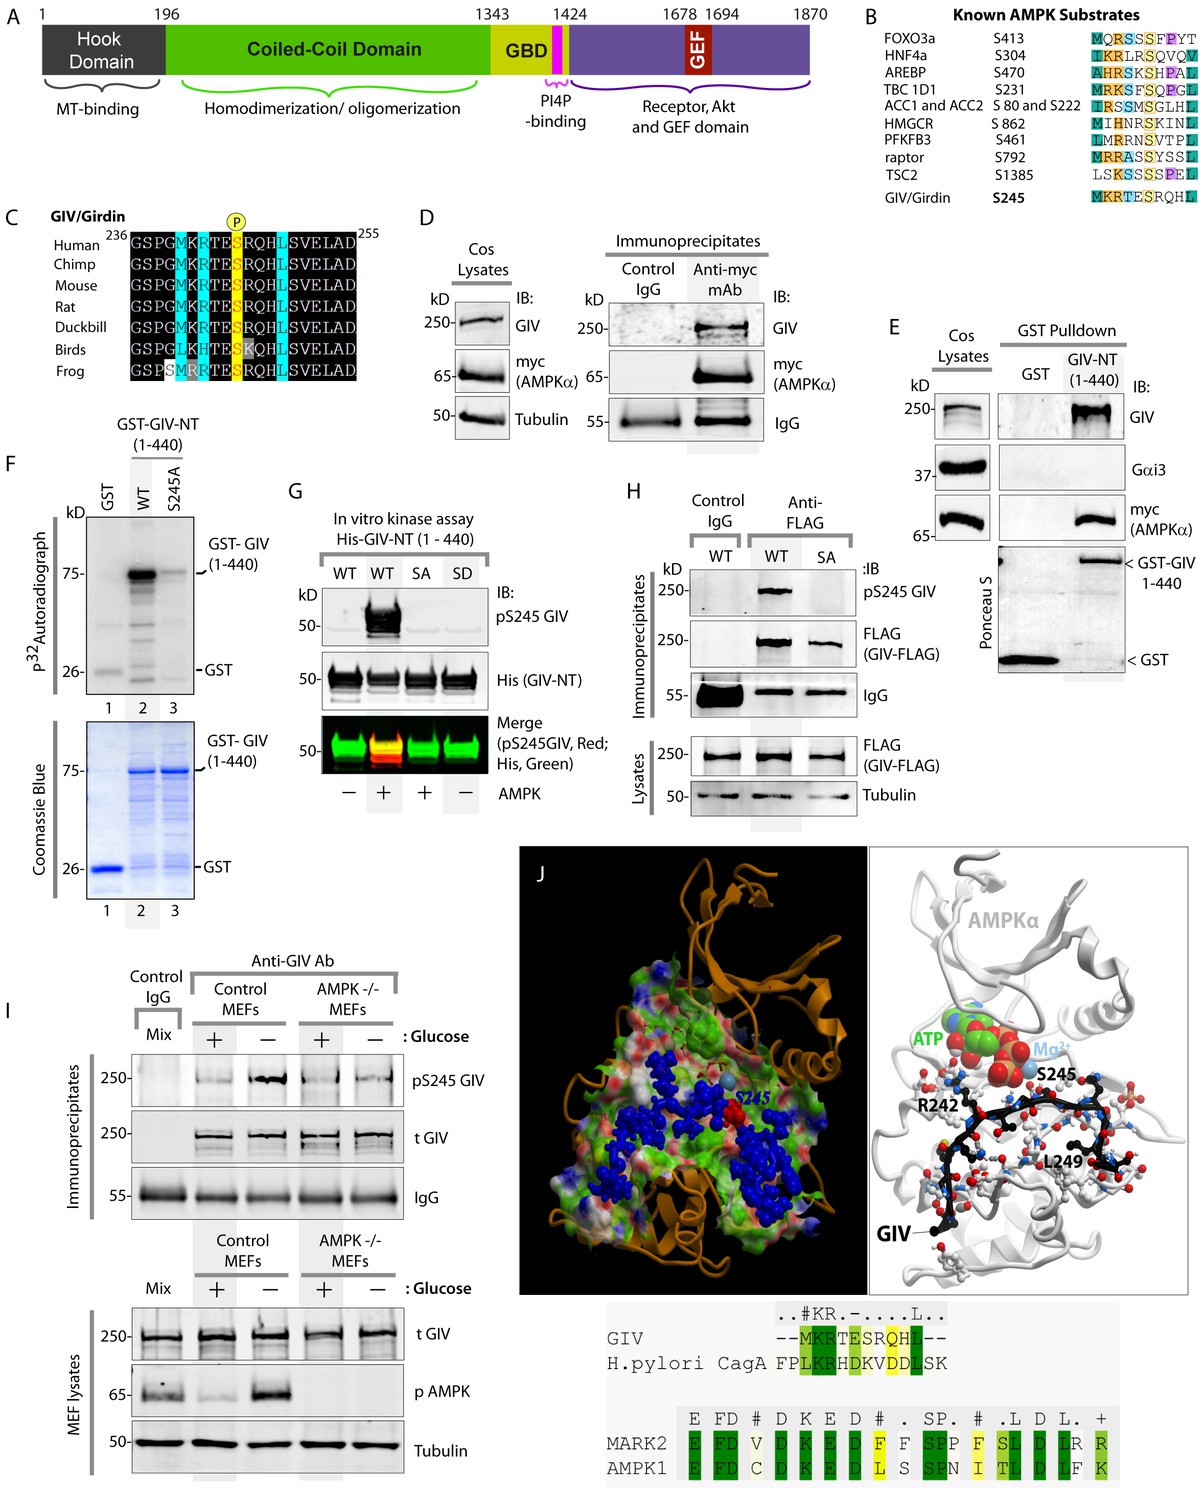
AMPK binds and phosphorylates GIV at Ser (S) 245.
(A) Schematic showing the functional modules of the multimodular signal transducer GIV. From the N- to the C-terminus the domains are-- a Hook-domain (grey) which binds microtubules (Simpson et al., 2005); a long coiled-coil domain (green) assists in homo/oligomerization (Enomoto et al., 2005); a Gα-binding domain (GBD; yellow) which constitutively binds Gαi/s proteins (Le-Niculescu et al., 2005); a PI(4)P-binding motif (pink) which enables GIV to bind PI4P-enriched membranes at the Golgi and the PM (Enomoto et al., 2005); an evolutionarily conserved GEF motif (red) which binds and activates Gαi (Garcia-Marcos et al., 2009) and inactivates Gαs (Gupta et al., 2016), and releases ‘free’ Gβγ from both. The C-terminal ~200 aa of GIV (purple) also has key domains that enable GIV to bind and remodel actin (Enomoto et al., 2005), bind and enhance phosphorylation of Akt (Anai et al., 2005; Enomoto et al., 2005), bind ligand-activated RTKs (Ghosh et al., 2010; Lin et al., 2014), and bind and activate Class 1 PI3-Kinases (Lin et al., 2011). (B) Consensus phosphorylation site for previously identified substrates of AMPK are aligned with the putative AMPK substrate site in human GIV. Conserved residues are highlighted with colors. (C) The sequence encompassing the putative AMPK substrate motif was aligned among various species using ClustalW. Conserved residues are shaded in black and similar residues in gray. The consensus residues within the sequence are highlighted in blue. The residue, Ser(S)245 which was predicted to be phosphorylated by AMPK is highlighted in yellow. (D) Immunoprecipitations were carried out on lysates of Cos7 cells expressing myc-AMPKα2 using anti-myc mAb. Immune complexes were analyzed for endogenous GIV and myc (AMPKα2) by immunoblotting (IB). (E) Lysates of Cos7 cells expressing myc-AMPKα2 were used as a source of AMPK in pulldown assays with bacterially expressed GST or GST-GIV-NT (aa 1–440; which includes S245) immobilized on glutathione beads. Bound proteins were analyzed for myc (AMPKα), Gαi3 (negative control; because this G protein binds GIV's C-terminus, not N-terminus) and endogenous GIV (positive control; because GIV homo-oligomerizes via its NT) by immunoblotting (IB). (F) In vitro kinase assays were carried out using recombinant AMPK heterotrimers (α2/β/γ) and bacterially expressed and purified GST-GIV-NT (1–440) proteins or GST alone (negative control) and γ -32P [ATP]. Phosphoproteins were analyzed by SDS-PAGE followed by autoradiography (top). Equal loading of substrate proteins was confirmed by staining the gel with Coomassie blue (bottom). AMPK phosphorylated GST-GIV-NT WT, but not the non-phosphorylatable SA mutant or GST alone. (G) Biochemical validation of a phosphospecific rabbit polyclonal antibody which detects GIV exclusively when it is phosphorylated at S245. In vitro kinase assays were carried out as described above and incubated in the presence of cold ATP. Phosphoproteins were analyzed for pS245-GIV and His (GIV-NT) by immunoblotting (IB). (H) In cellulo kinase assays were carried out in Cos7 cells co-expressing GIV-FLAG (WT or SA mutant) and myc-AMPKα constructs, and stimulating AMPK by glucose deprivation for 6 hr prior to lysis. GIV was immunoprecipitated from these lysates using anti-FLAG mAb and analyzed for phosphorylation of GIV at S245 by immunoblotting (IB) with anti-pS245-GIV and FLAG (GIV-Flag). GIV-WT, but not GIV-SA is phosphorylated at S245 in cells responding to energetic stress. (I) AMPK-/- and control MEFs were subjected or not to energetic stress by exposing them to growth conditions with (+) or without (-) glucose for 4 hr prior to lysis. GIV immunoprecipitated from equal aliquots of lysates (lower panel) were analyzed for total (t) and phosphorylated (pS245) GIV by immunoblotting. Representative blots are shown (n = 3). (J) Top: Homology model of GIV-bound AMPKα generated using the solved crystal structure of constitutively active Par1-MARK2 (a member of the AMPK family of kinases) in complex with the CagA protein encoded by pathologic strains of Helicobacter pylori [PDB: 3IEC (Nesic et al., 2010)] as template. Bottom: The target:template alignment is shown for the GIV peptide (with H. pylori CagA protein) and AMPK (with MAPK2, partial alignment of binding site residues).
Figure 2 with 2 supplements
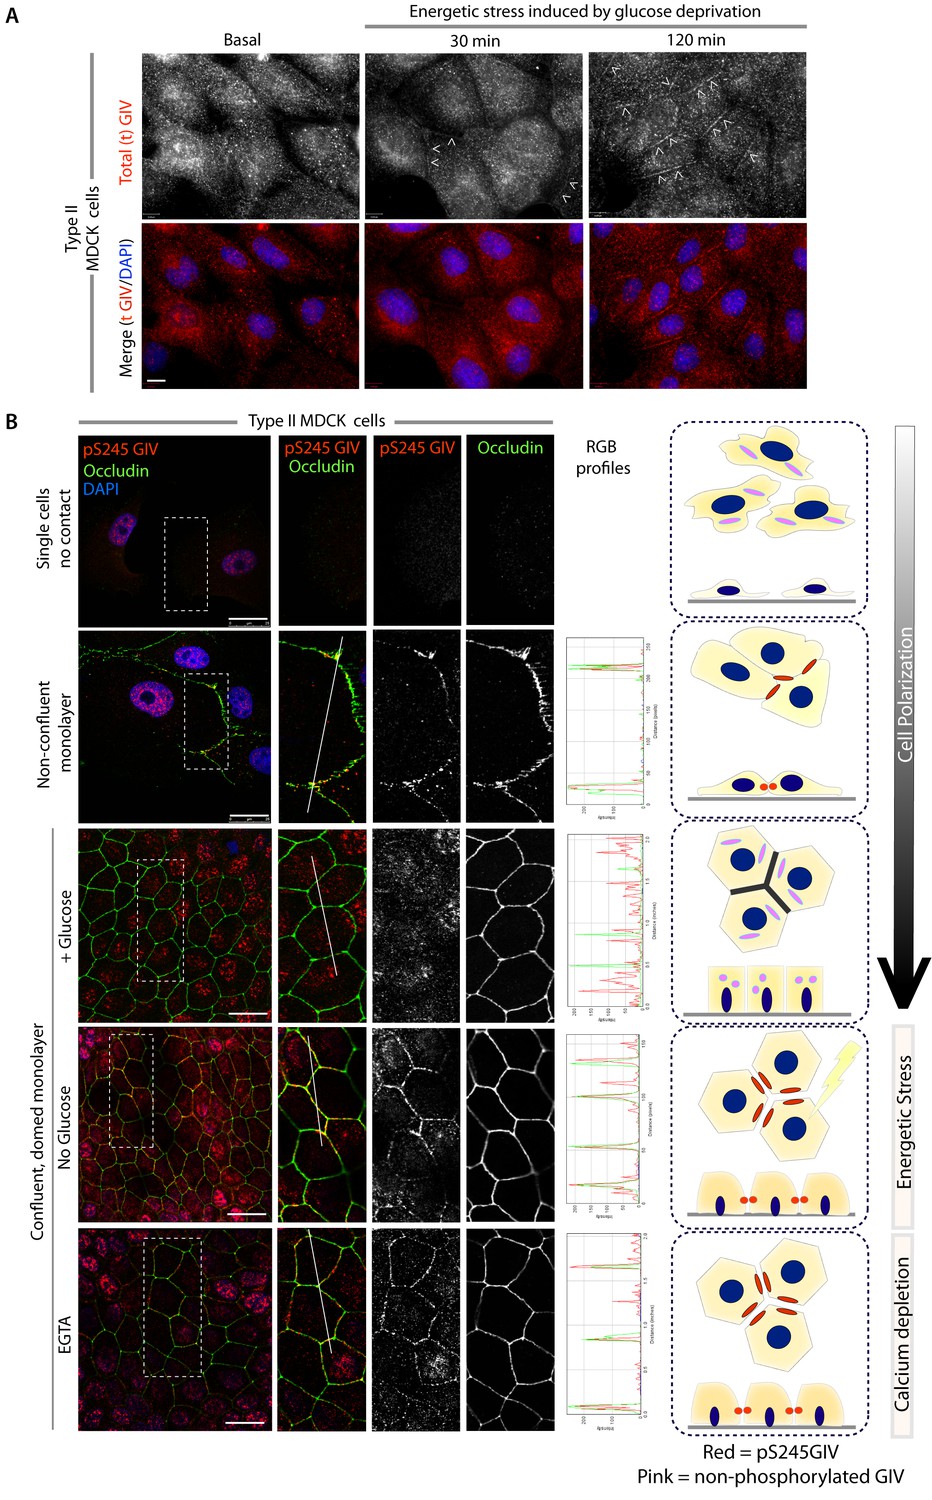
GIV and S245-phosphorylated GIV localize to cell-cell junctions.
(A) MDCK cells were grown on glass cover slips, exposed or not to energetic stress (glucose deprivation for 30 and 120 min), and subsequently fixed and stained for total (t) GIV (red) and DAPI (blue; nuclei) and analyzed by confocal microscopy. Representative confocal images are shown. In domed monolayers at basal condition, GIV is absent from cell-cell junctions. However, GIV is detected at cell-cell junctions (arrowheads) after energetic stress induced by glucose deprivation. Scale bar = 10 μm. (B) MDCK cells were grown on glass cover slips, at various stages during their growth phase: from single-cells (top), to non-confluent monolayers (middle), to confluent domed monolayers (bottom). They were fixed and stained for Occludin (a TJ marker; green), pS245-GIV (red) and DAPI (blue; nuclei) and analyzed by confocal microscopy. Confluent monolayers were either maintained in complete medium in the presence of glucose (+ Glucose), or subjected to energetic stress by glucose deprivation (No Glucose) or calcium deprivation (EGTA). Representative fields are shown on the left. RGB plots, generated using ImageJ on the right assess the degree of colocalization between pS245-GIV and Occludin along the lines in the corresponding images during cell polarization are shown in the middle. Schematics summarizing the staining pattern in each condition are shown on the right. Scale bar = 25 μm.
Figure 2—figure supplement 1
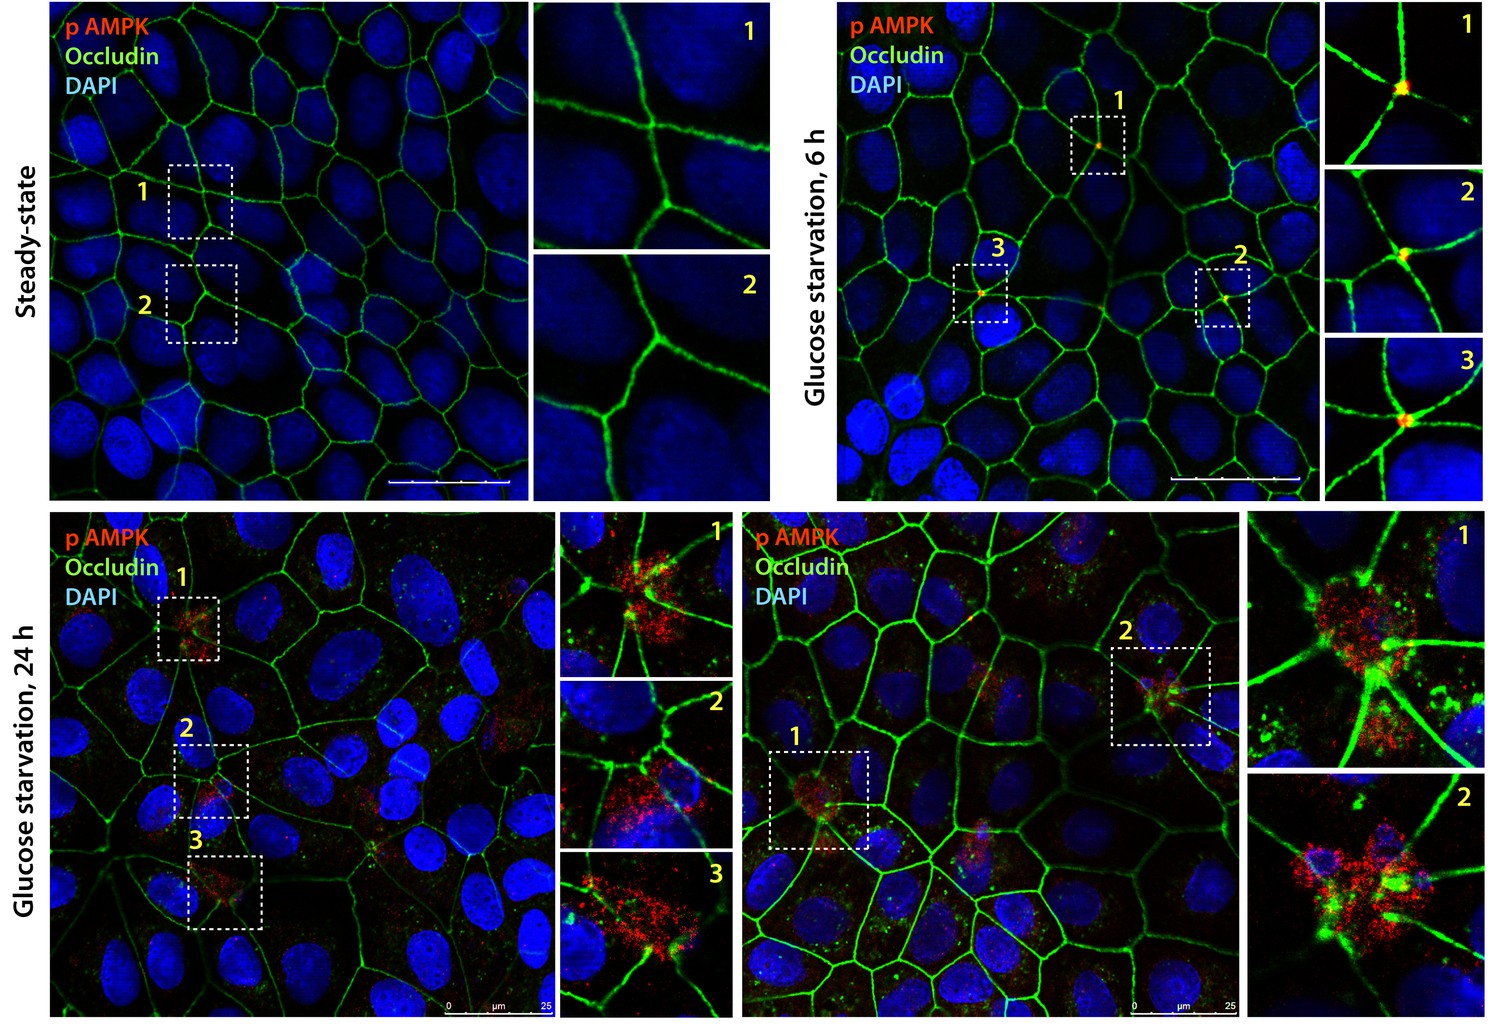
Active AMPK localizes to specialized regions of the TJs called tricellular TJs exclusively after energetic stress.
Fully polarized domed monolayers of type II MDCK cells at steady-state were exposed to energetic stress induced by glucose deprivation for indicated duration of time prior to fixation. Fixed cells were stained for phospho(p) AMPK (red), Occludin (green) and DAPI (nuclei, blue) and analyzed by confocal microscopy. Representative images are displayed. Active (phospho)-AMPK was not detected at steady-state (upper left); however, when domed monolayers are subjected to 6 hr of energetic stress active, AMPK was detected exclusively at the TJs of tricellular contact (tTJs), as determined by colocalization with Occludin where three or more cells come in contact (Furuse et al., 2014). With prolonged energetic stress (i.e., 12 hr of glucose starvation), tTJs were the first to disassemble and were associated with a blush of active AMPK. Longer duration of glucose starvation was associated with loss of signal for active AMPK (not shown).
Figure 2—figure supplement 2
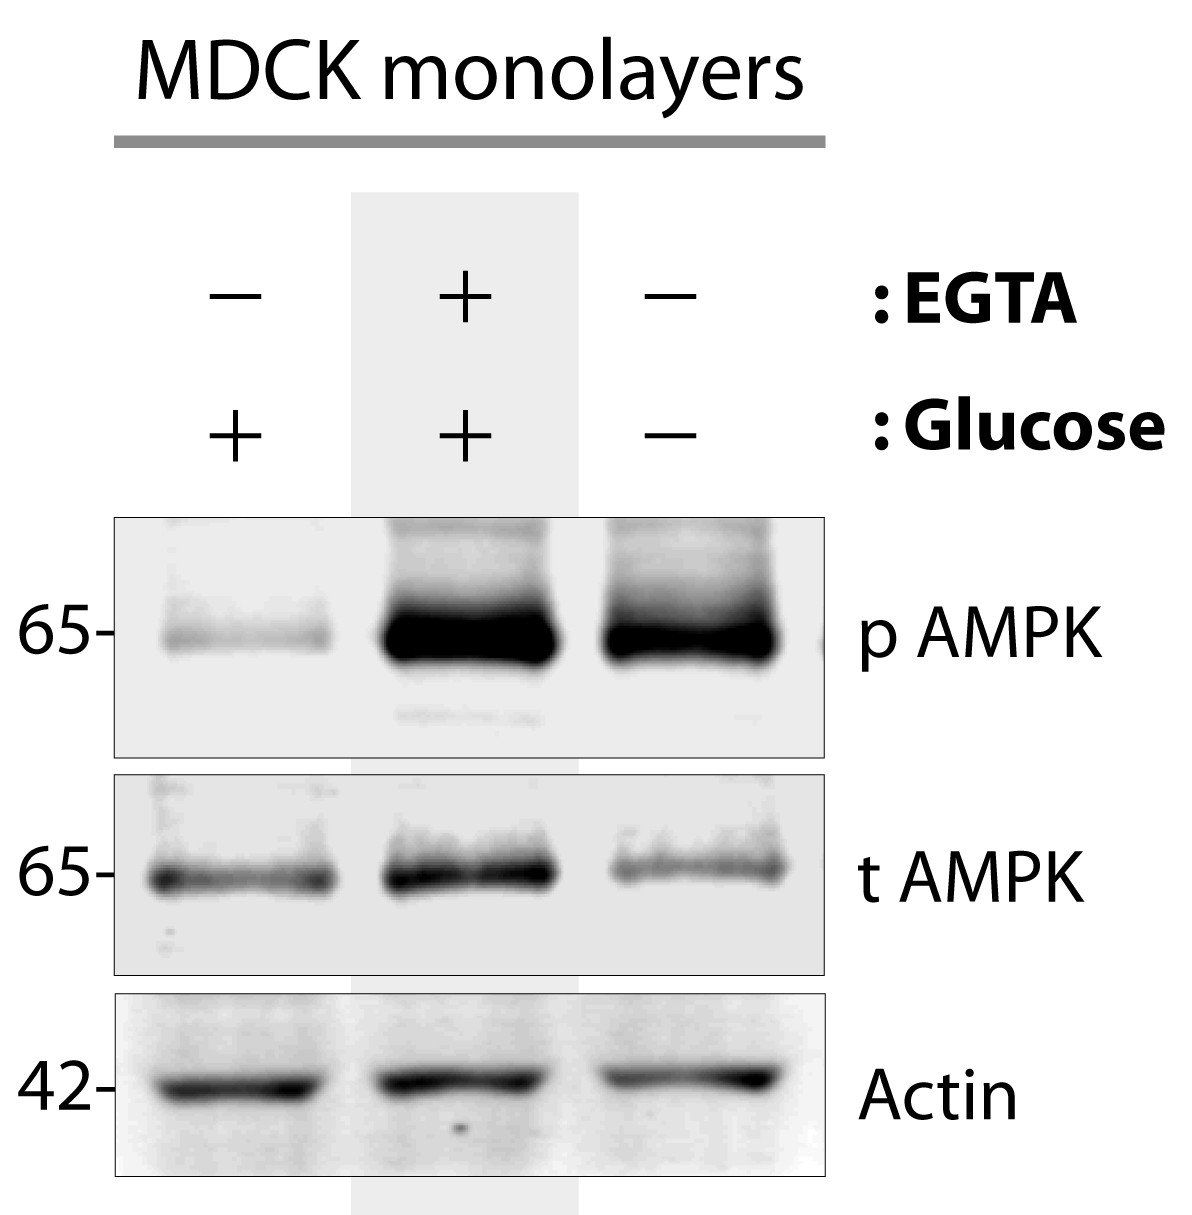
AMPK is activated when type II MDCK cells are exposed to energetic stress or low-calcium growth conditions.
Type II MDCK cells grown to domed confluence on culture dishes in the presence of normal calcium and glucose (left lane), were exposed to low calcium [+ EGTA] but normal glucose conditions (middle lane), or to energetic stress by depriving them of glucose (-) while maintaining normal calcium (right lane) for 6 hr prior to lysis. Equal aliquots of whole cell lysates were analyzed for total (t) and phospho (p) AMPK and actin (loading control) by immunoblotting. Representative blots are shown (n = 5–7 times for EGTA and glucose starvation, respectively, alongside various experiments using these stimuli during the course of this project).
Figure 3
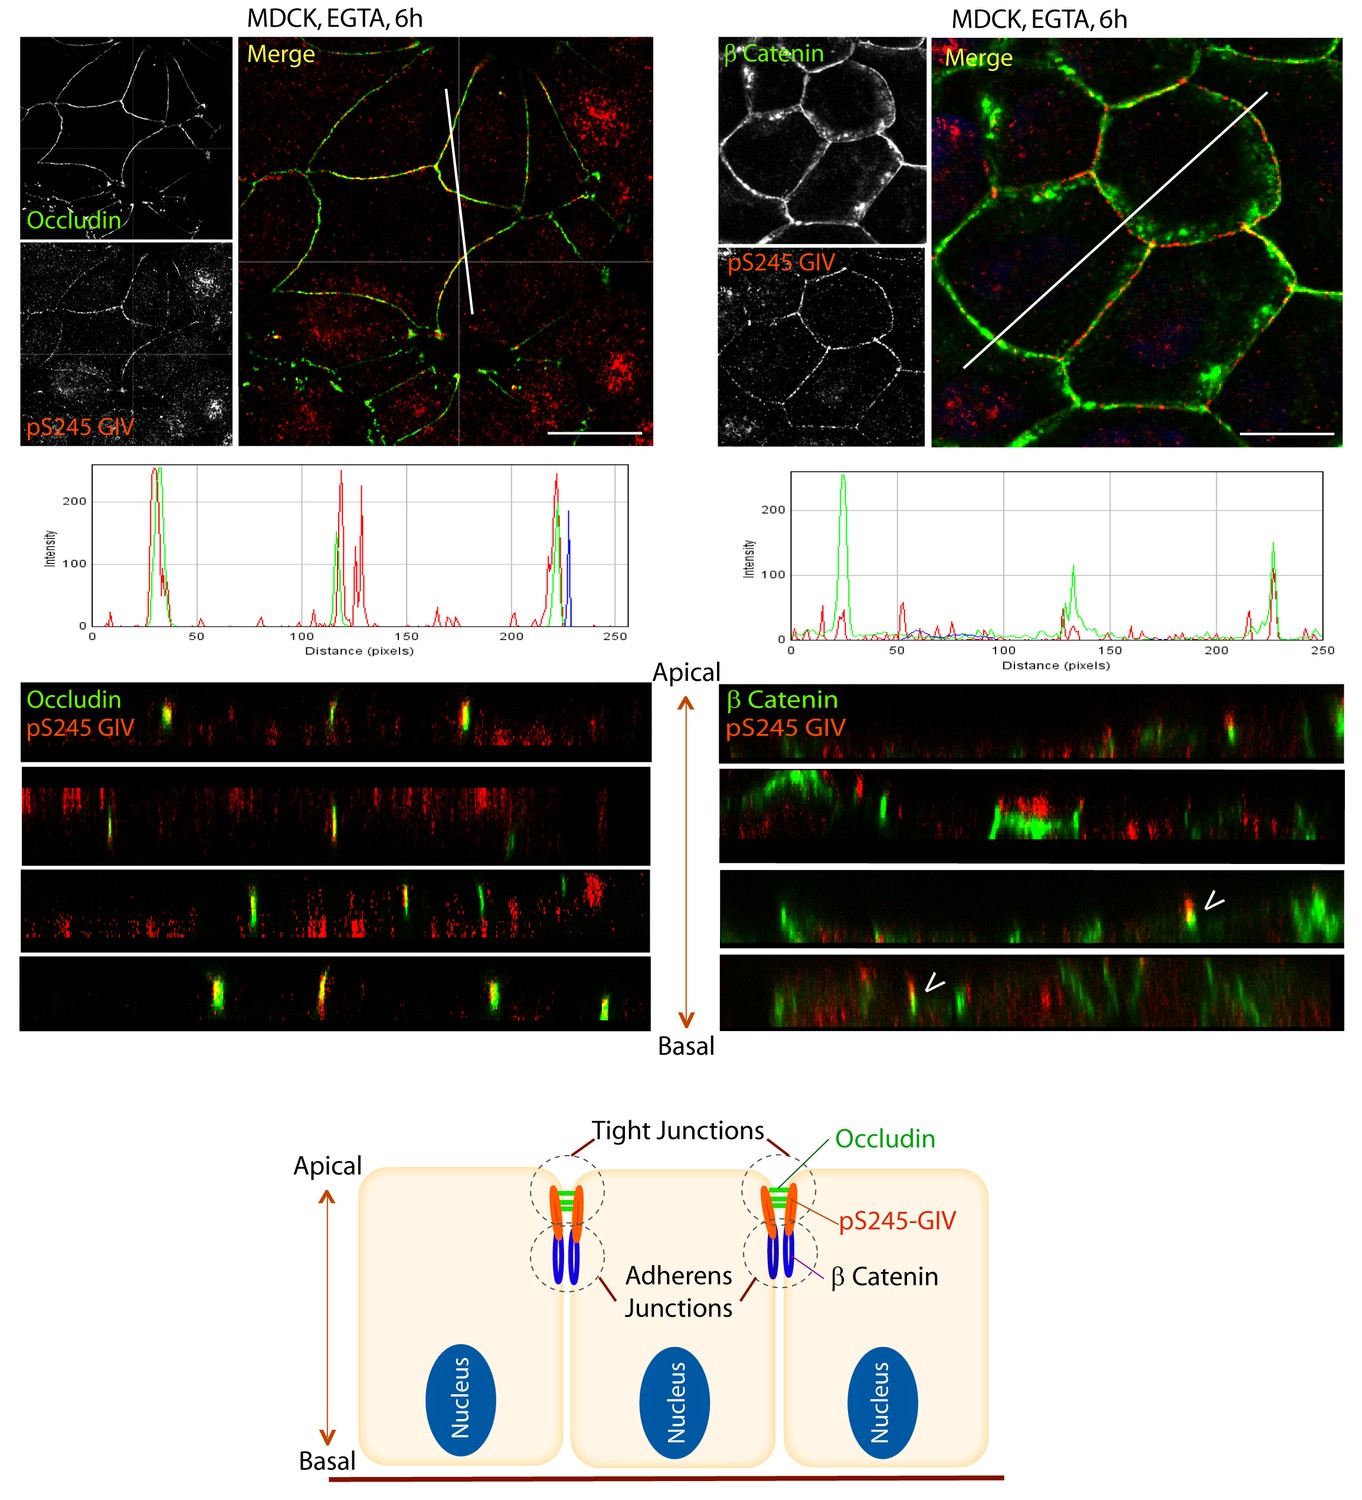
S245-phosphorylated GIV (pS245-GIV) localizes preferentially to tight junctions (TJs).
MDCK cells were grown to full confluency into domed monolayers prior to exposing them to the Ca2+ chelator EGTA for 6 hr prior to fixation. Fixed cells were co-stained for pS245-GIV (red) and either the TJ-marker Occludin (Left; green) or the AJ-marker β-Catenin (Right; green) and analyzed by confocal microscopy (z-stack projections and x-z cross-sections). Top: Representative confocal images are shown, each taken at the level of the TJs (marked by Occludin; left) and AJs (marked by β-Catenin; right). Middle: RGB profiles showed that pS245 GIV colocalized with Occludin but not β-Catenin. Bottom: Sections through the 3D reconstruction of a confocal Z-stack confirms that, in most instances the pS245-GIV colocalizes with the TJ marker Occludin, and lies just apical to the AJ marker β-Catenin. In some cases (arrowheads), the lower pole of the pS245-GIV signal partially colocalizes with the upper pole of the β-Catenin signal. Schematic summarizes the localization of pS245-GIV and its relationship to the TJ and AJs. Scale bar = 25 μm.
Figure 4 with 5 supplements
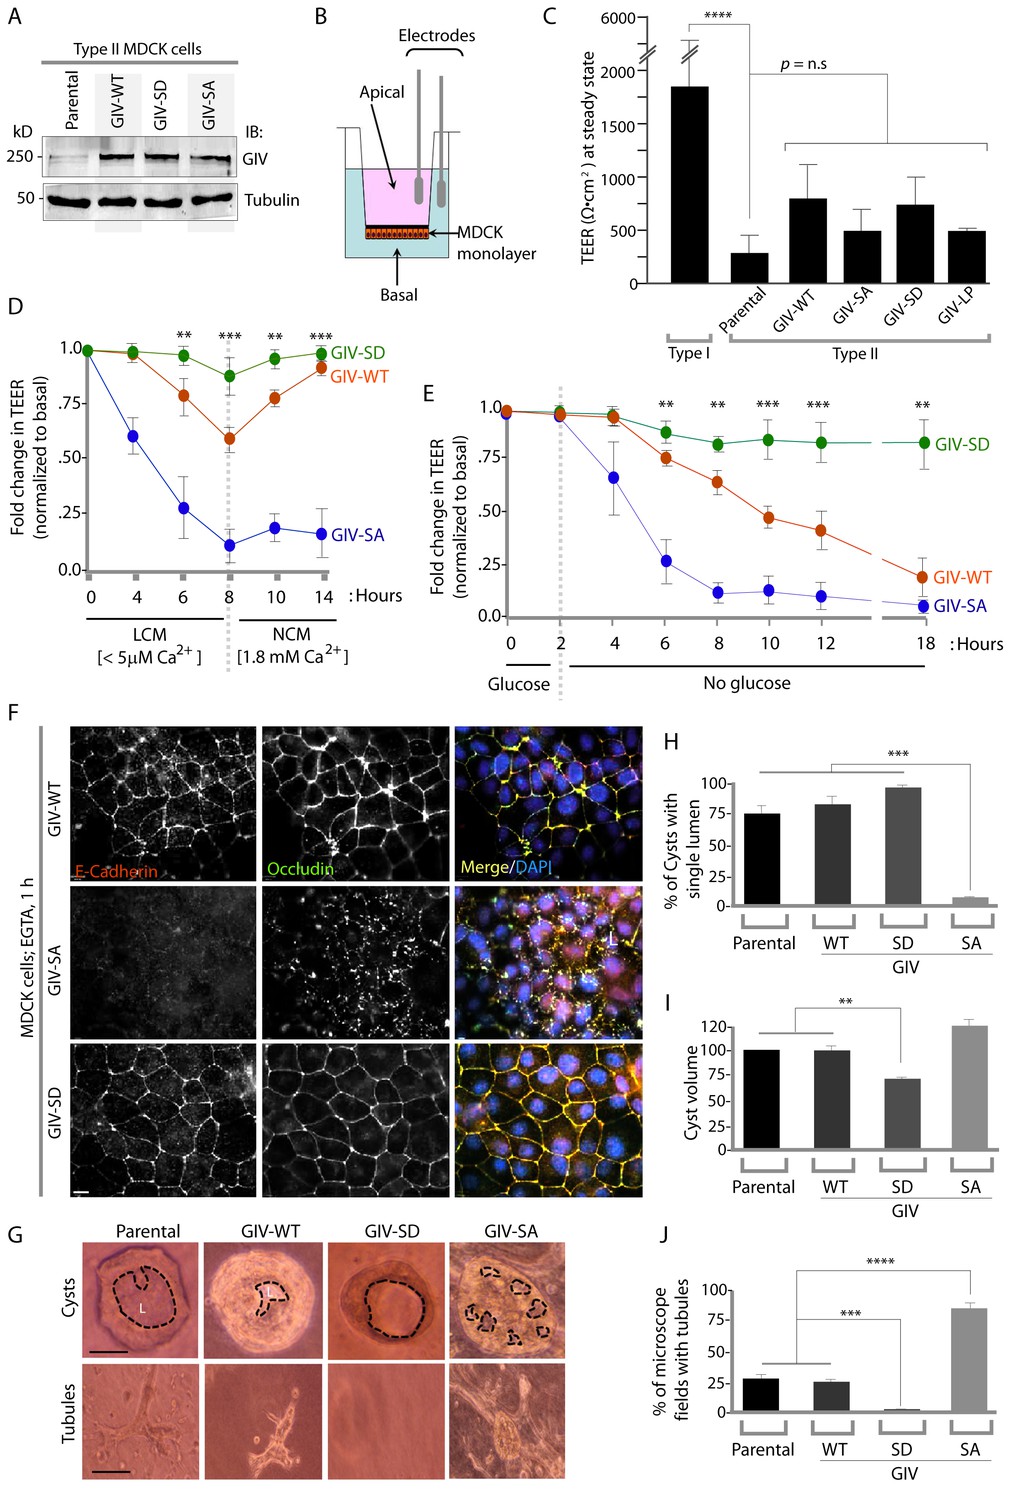
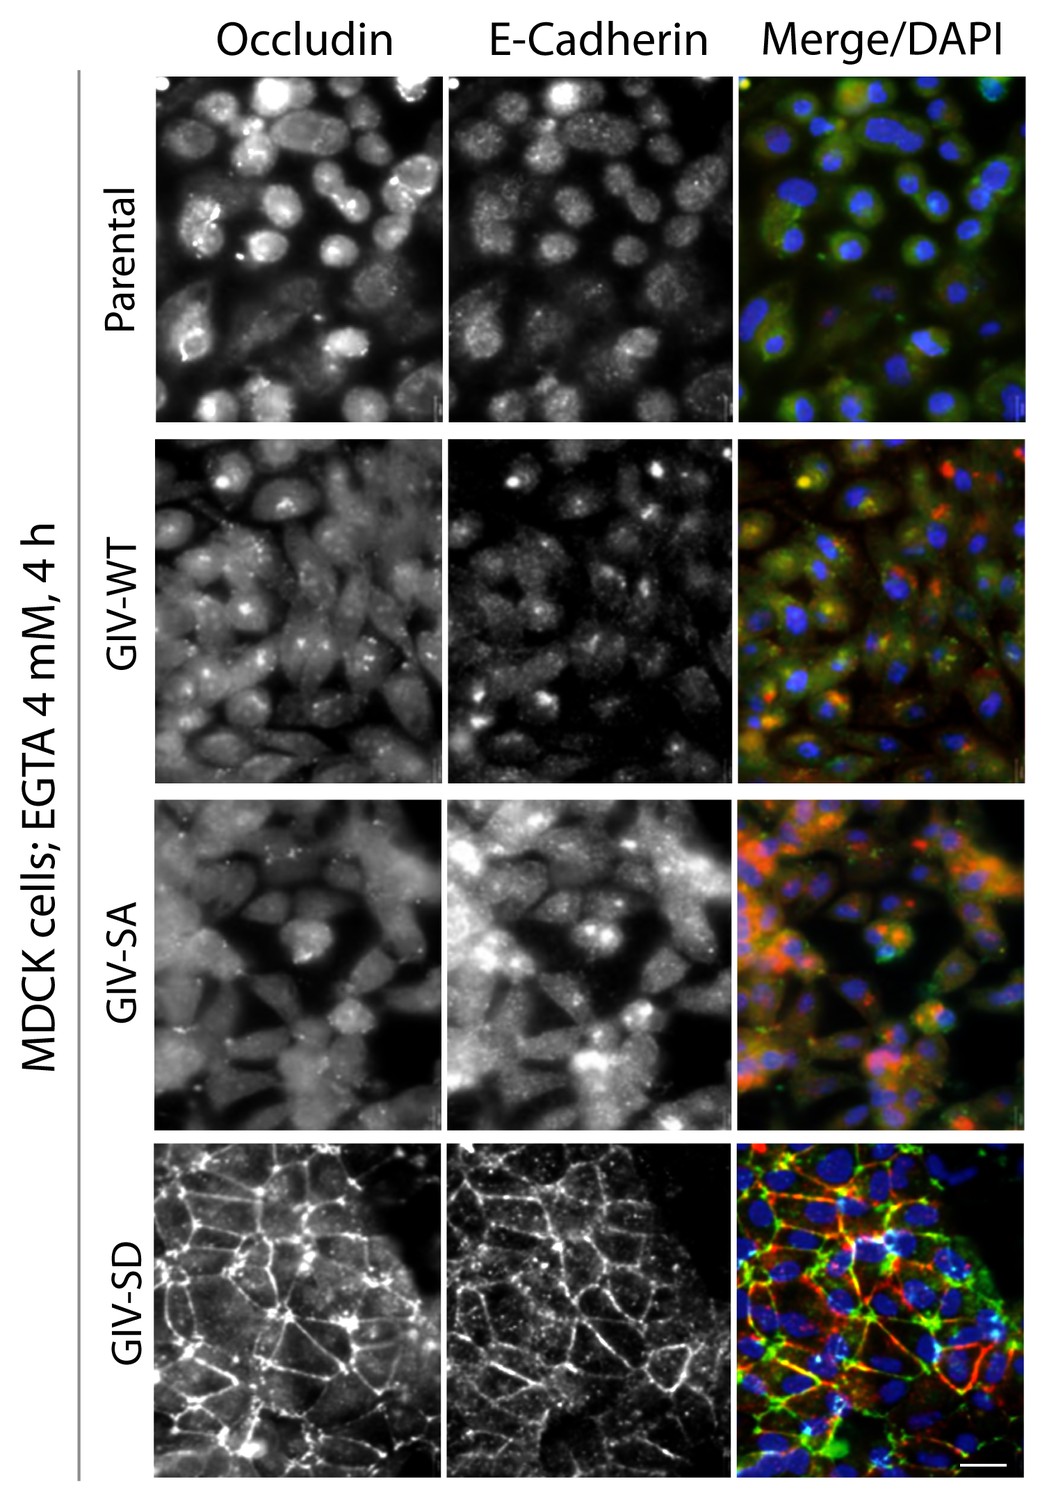
Phosphorylation of GIV at S245 stabilizes tight junctions (TJs) under low-calcium states and is essential for epithelial barrier function and morphogenesis.
(A) Whole cell lysates of MDCK cells stably expressing wild-type GIV (GIV-WT), or non-phosphorylatable (S→A; GIV-SA), or phospho-mimicking (S→D; GIV-SD) mutants of GIV were analyzed for GIV and tubulin by immunoblotting. (B–C) Transepithelial electrical resistance (TEER) was measured using a Millicel-ERS resistance meter across fully polarized domed monolayers of various MDCK cell lines grown to domed confluency in Transwell inserts (schematic shown in B) in the presence of full growth media with normal calcium. Bar graphs (C) display the TEER measured across each cell line. As expected, type I MDCKs exhibit higher TEER than type II cells. No significant differences were noted between the MDCK-GIV cell lines stably expressing the various GIV constructs. n = 3. Results are expressed as ± SEM. ****p<0.0001. (D–E) Changes in TEER was measured across monolayers of various MDCK cell lines during exposure to low-calcium media (LCM; left), followed by switching to normal calcium media (NCM; right) or during energetic stress when exposed to media without glucose. Graphs in D and E show that compared to MDCK-GIV-WT cells, TEER rapidly dropped across MDCK-GIV-SA monolayers exposed to LCM (D) as well as energetic stress (E) but relatively preserved in MDCK-GIV-SD cells. This drop is rapidly and completely reversed upon exposure to NCM in MDCK-GIV-WT and SD cells, but remains impaired in MDCK-GIV-SA cells. n = 3. Results are expressed as ± SEM. **p<0.01; ***p<0.001; **p<0.01. (F) MDCK-GIV cell lines were grown to full confluency into domed monolayers, treated with EGTA for 1 hr, and subsequently fixed. Fixed cells were stained for E-cadherin, Occludin, and DAPI (nuclei; blue), and analyzed by confocal microscopy. Images displayed are representative of 13–15 HPF images captured at 60X mag in each cell line. Preservation of TJs and AJs, as visualized using Occludin and E-Cadherin as markers, was significantly higher in MDCK-GIV-WT and MDCK-GIV-SD [65–90% of the imaged surface area; n = 15 randomly imaged fields in each cell line], but not in MDCK-GIV-SA cell lines [0–4% of the imaged surface area; n = 13 randomly imaged fields; p<0.001]. Scale bar = 10 μm. See also Figure 4—figure supplements 2 and 3 for the findings at baseline and at 4 hr time point. (G) Parental MDCK cells and various MDCK-GIV cell lines were seeded and grown in collagen-containing matrix for 2 weeks and analyzed for the formation of cyst and tubular structures by light microscopy. Representative cysts and tubular structures are shown for each cell line. L = lumen. Scale bar = 50 μm. (H–J) Bar graphs display the % of cysts with single lumens (Y axis; H), cyst volume (Y axis; I) and % fields with tubule formations (Y axis; J) seen in each cell line in G. Absolute numbers for cyst volume were normalized to parental cells (set to 100%). Three independent experiments comprising 450–600 cysts per cell line are summarized. Results are expressed as ± SEM. **p<0.01; ***p<0.001; ****p<0.0001.
Figure 4—figure supplement 1
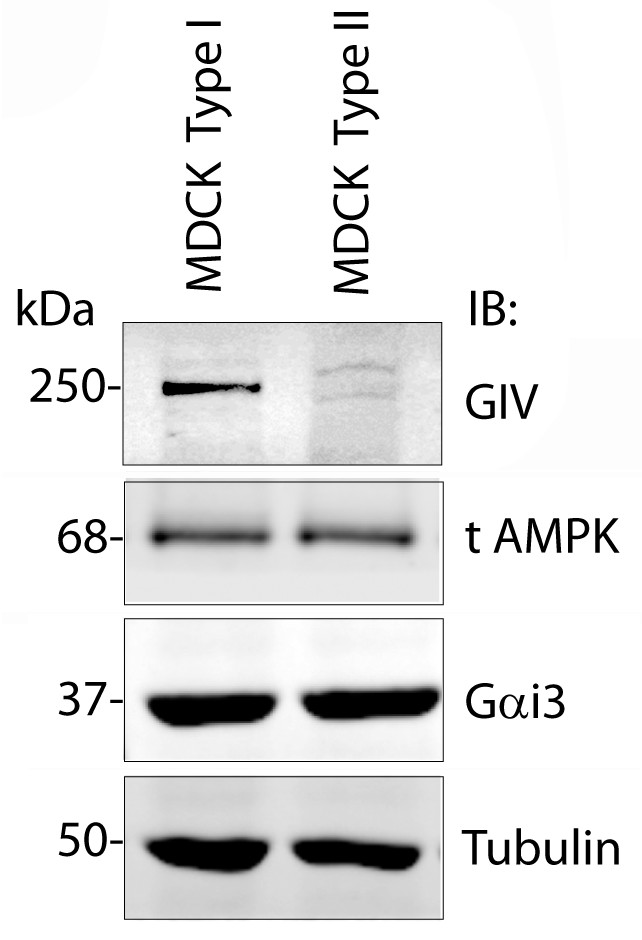
A comparison of levels of GIV expression in Type I vs Type II MDCK cells.
Whole-cell lysates of MDCK cells type I and type II were grown to domed confluence on culture dishes in the presence of normal calcium media (NCM), lysed, and analyzed for GIV, AMPK, Gαi3 and tubulin by immunoblotting (IB). While GIV is detected in both Type I and II MDCK subclones, its level of expression is significantly lower in MDCK Type II cells. Levels of expression of AMPK, Gαi3, and tubulin are equal in both Type I and II cell lines.
Figure 4—figure supplement 2
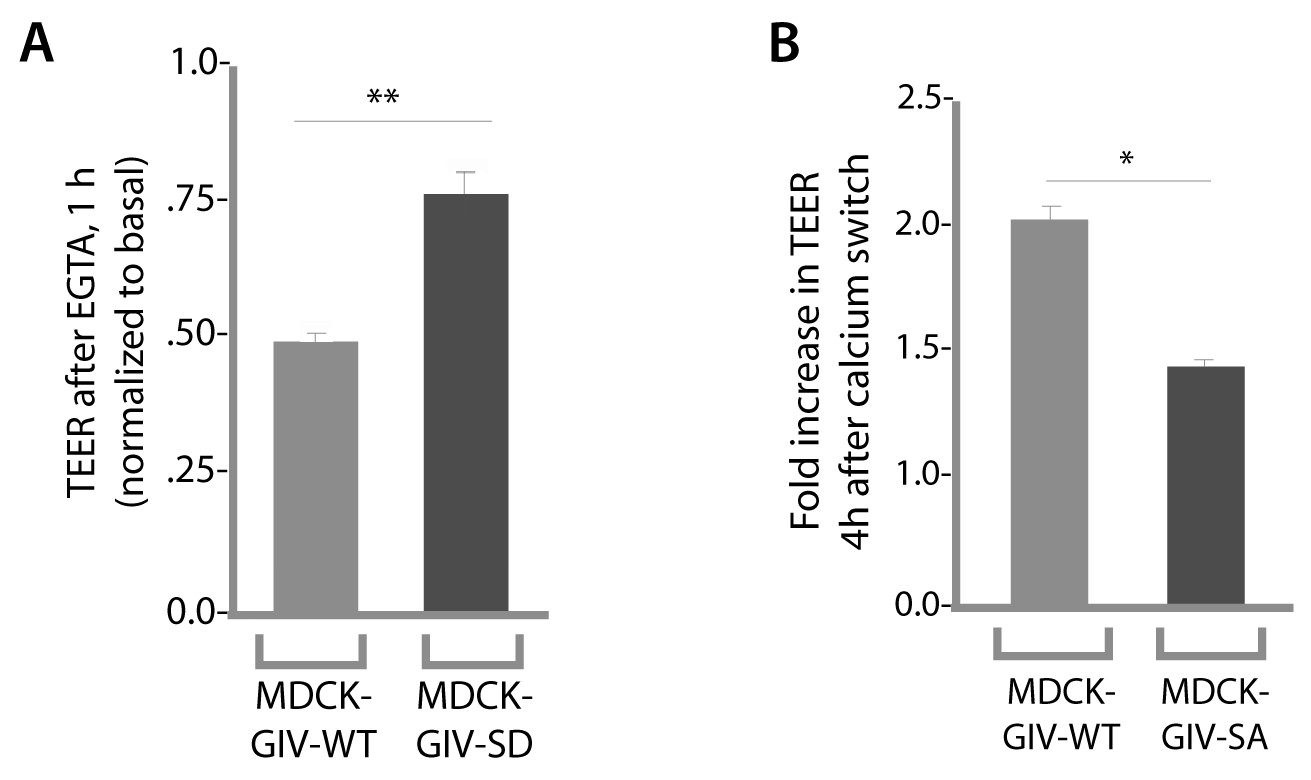
Phosphorylation of GIV at S245 is required for maintenance of TEER in the absence of calcium in growth media, as well as for recovery of TEER after calcium switch.
Drop in TEER in the presence of the Ca2+ chelator EGTA (E) and recovery of TEER during Ca2+ switch (after EGTA washout) were measured in MDCK-GIV cell lines as in Figure 4B–D. Bar graphs in E show that compared to controls (MDCK-GIV-WT), MDCK-GIV-SD showed less drop in TEER compared to basal (i.e. more resistance to EGTA). Bar graphs in F show that compared to controls (MDCK-GIV-WT), MDCK-GIV-SA showed impaired recovery of TEER compared to basal (i.e. less responsive to Ca2+ switch). **p<0.01. *p<0.05.
Figure 4—figure supplement 3

A comparison of tight junction morphology in parental and the various Type II MDCK-GIV cell lines.
Parental and MDCK-GIV cell lines were grown to fully polarized domed confluence on culture dishes in the presence of normal calcium and glucose, fixed, and stained for occludin (a TJ marker) and analyzed by confocal microscopy. No discernible differences were noted in the intensity or pattern of staining with Occludin. These findings are consistent with the similar TEER values measured across these monolayers (Figure 4C), indicating that all these cells make similar functional tight junctions. Scale bar = 20 μm.
Figure 4—figure supplement 4
Phosphorylation of GIV at S245 stabilizes tight junctions (TJs) under low-calcium states.
MDCK cell lines stably expressing various GIV constructs were grown to full confluency into domed monolayers prior to treating them with EGTA for 4 hr prior to fixation. Fixed cells were stained for E-cadherin, occludin, and DAPI (nuclei; blue), and analyzed by confocal microscopy. Both TJs and AJs, as visualized using occludin and E-Cadherin as markers, were preserved in MDCK-GIV-SD, but not in MDCK-GIV-WT or SA cell lines. See also Figure 4F for the findings at 1 hr.
Figure 4—figure supplement 5

Phosphorylation of GIV at S245 stabilizes tight junctions (TJs) in cells exposed to energetic stress.
Parental MDCK cells and MDCK cell lines stably expressing various GIV constructs were grown to full confluency into domed monolayers prior to subjecting them to energetic stress by expositing them to glucose-free media (glucose deprivation) for 120 min prior to fixation. Fixed cells were stained for various markers of TJs (Occludin, ZO-1) and AJs (β-catenin, E-cadherin), Actin (Phalloidin) and DAPI (nuclei; blue), and analyzed by confocal microscopy. MDCK-GIV-SA cells, but not parental MDCK cells, or MDCK-GIV-WT or SD cells showed increased actin stress fibers (visualized by Phalloidin staining), loss of E-cadherin from cell-cell junctions, interruptions in occludin and ZO-1 staining along cell-cell contact sites (arrowheads) and gaps between cells (yellow starts).
Figure 5 with 1 supplement
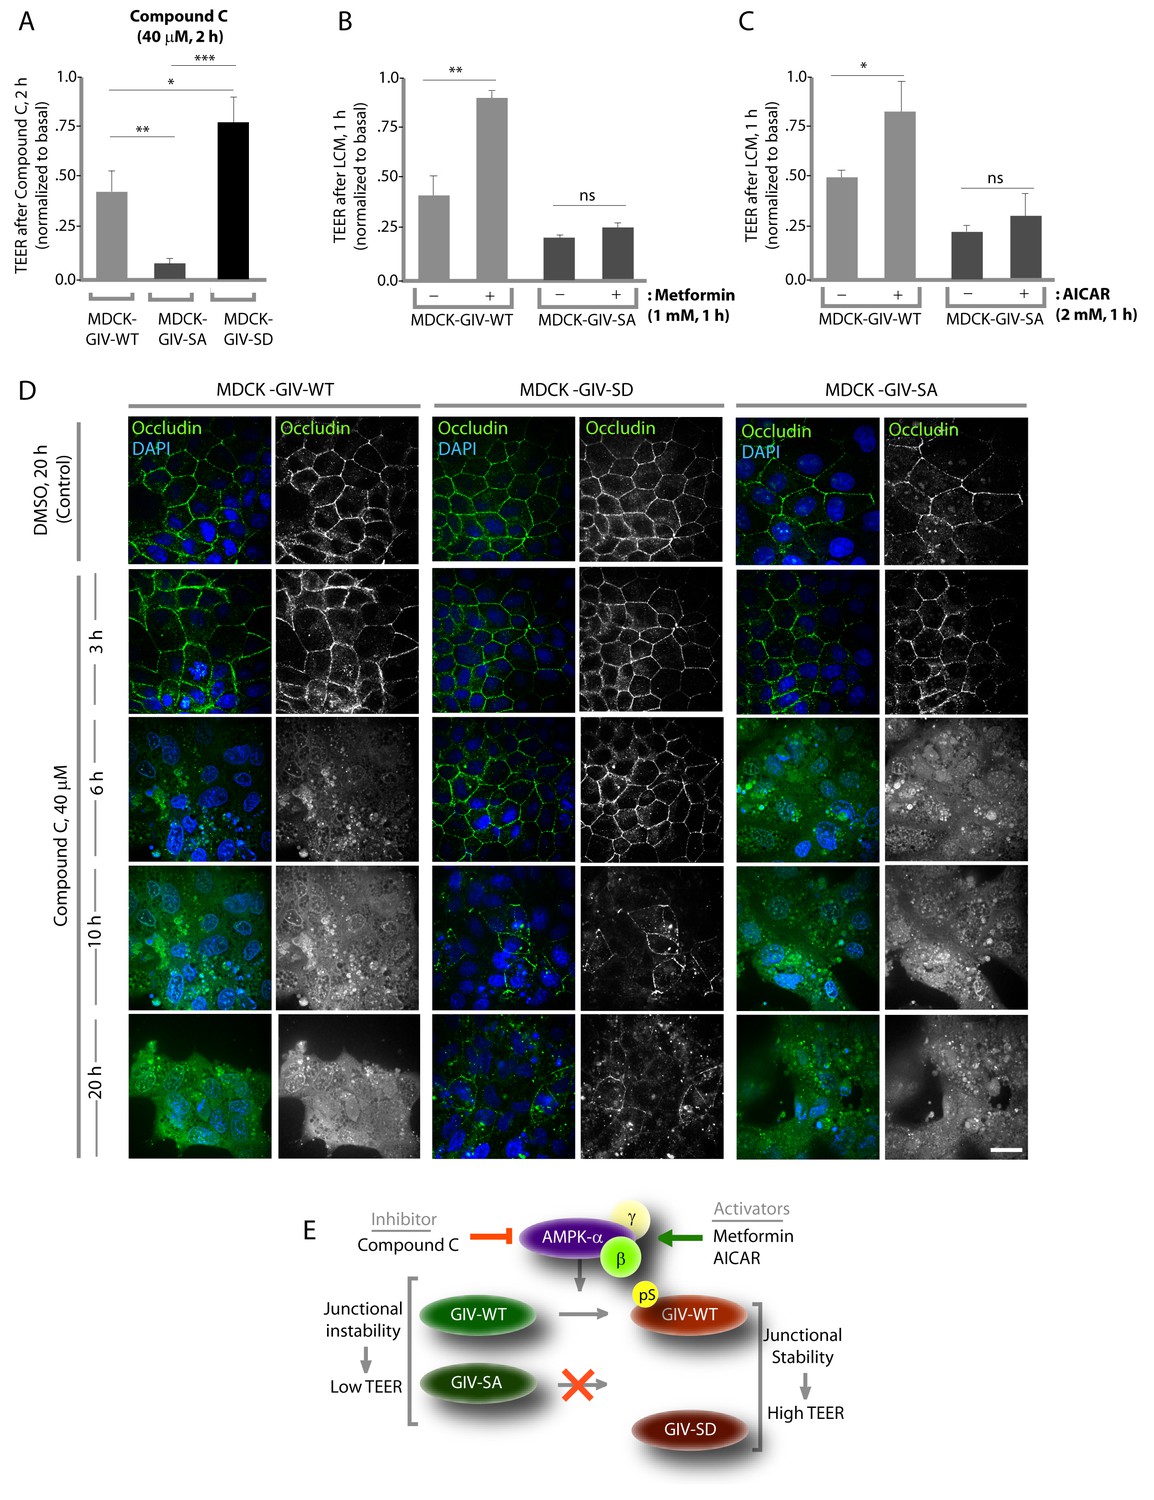
Stabilization of tight junctions (TJs) by AMPK requires phosphorylation of GIV at S245.
(A) MDCK cell lines stably expressing various GIV constructs were grown in Transwell inserts to full confluency into domed monolayers prior to exposing them to Compound C for 1 hr. TEER was measured before and after treatment with Compound C as in 4B-C. Bar graphs display the change in TEER in response to Compound C (compared to basal). MDCK-GIV-SA cells show more drop in TEER and GIV-SD cells show less drop in TEER compared to MDCK-GIV-WT cells. n = 3. Results are expressed as ± SEM. *p<0.05; **p<0.01; ***p<0.001. (B,C) MDCK-GIV cell lines were grown in Transwell inserts as described above and pre-treated (+) or not (-) for 1 hr with either Metformin (B) or AICAR (C) prior to exposure to low calcium media (LCM). Bar graphs display the drop in TEER after exposure to LCM. Drop in TEER was significantly less in MDCK-GIV-WT cells when pre-treated with Metformin (B) or AICAR (C). No significant difference was seen in the degree of drop in TEER in MDCK-GIV-SA cells irrespective of pre-treatment with Metformin (B) or AICAR (C). n = 3. Results are expressed as ± SEM. ns = not significant; *p<0.05; **p<0.01. (D) MDCK cell lines stably expressing various GIV constructs were grown to full confluency into domed monolayers prior to exposing them to Compound C for the indicated periods of time prior to fixation. Fixed cells were stained for the TJ-marker Occludin (green) and DAPI (blue; nuclei) and analyzed by confocal microscopy. Images displayed are representative of 10–11 HPF images captured randomly at 60X mag in each cell line. Loss of TJs, as determined by loss of Occludin staining from cell-cell contact sites, was observed early in MDCK-GIV-SA and WT cells, but preserved for longer in MDCK-GIV-SD cells (compare 6, 10 and 20 hr time points). At each time point, the % area of the monolayer that showed loss of Occludin at cell-cell contact sites was significantly higher in MDCK-GIV-WT (65–90% of the imaged surface area; n = 10 HPFs) and in MDCK-GIV-SA cells (85–100% of the imaged surface area; n = 11 HPFs) when compared to MDCK-GIV-SD cell lines (2–10% of the imaged surface area; n = 10 HPFs; p<0.0001). MDCK-GIV monolayers exposed to Compound C for 20 hr were also monitored by light microscopy, and representative images are shown in Figure 5—figure supplement 1. (E) Schematic summarizes the effect of the pharmacologic modulators of AMPK used in various panels of this figure and their effect on the AMPK-GIV signaling axis, junctional stability and TEER. Compound C, which inhibits AMPK, inhibits phosphorylation of GIV-WT at S245, destabilizes TJs and reduces TEER. The phosphomimicking GIV-SD mutant which bypasses the need for AMPK, is relatively resistant to the action of Compound C. Metformin and AICAR, two activators of AMPK trigger phosphorylation of GIV-WT at S245, stabilize TJs and preserve TEER. The non-phosphorylatable GIV-SA mutant is relatively insensitive to the actions of Metformin and AICAR.
Figure 5—figure supplement 1
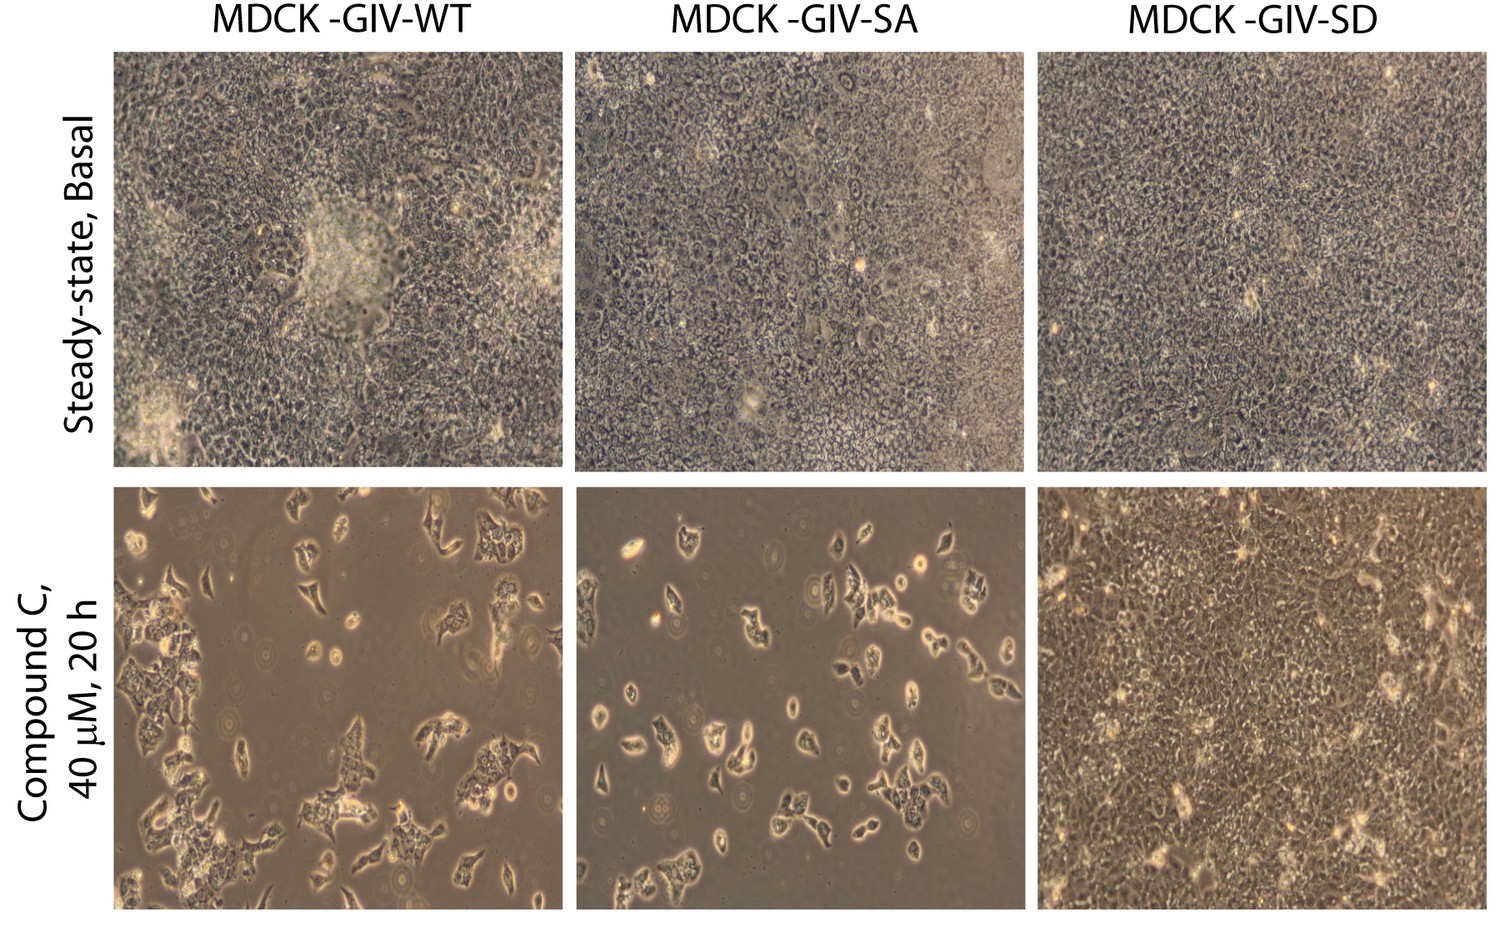
Phosphorylation of GIV at S245 is sufficient for bypassing the pro-apoptotic actions of the AMPK-inhibitor Coumpound C.
MDCK cell lines stably expressing various GIV constructs (WT, the non-phosphorylatable SA and the phosphomimic SD mutants) were grown to full confluence into domed monolayers prior to exposing them to Compound C for 20 hr. The integrity of the epithelial monolayers were analyzed by serial observations by light microscopy. As expected inhibition of AMPK by Compound C results in extensive detachment and death of MDCK-GIV-WT and MDCK-GIV-SA monolayers. The MDCK-GIV-SD cells, on the other hand, were virtually insensitive to the effects of Compound C.
Figure 6 with 2 supplements
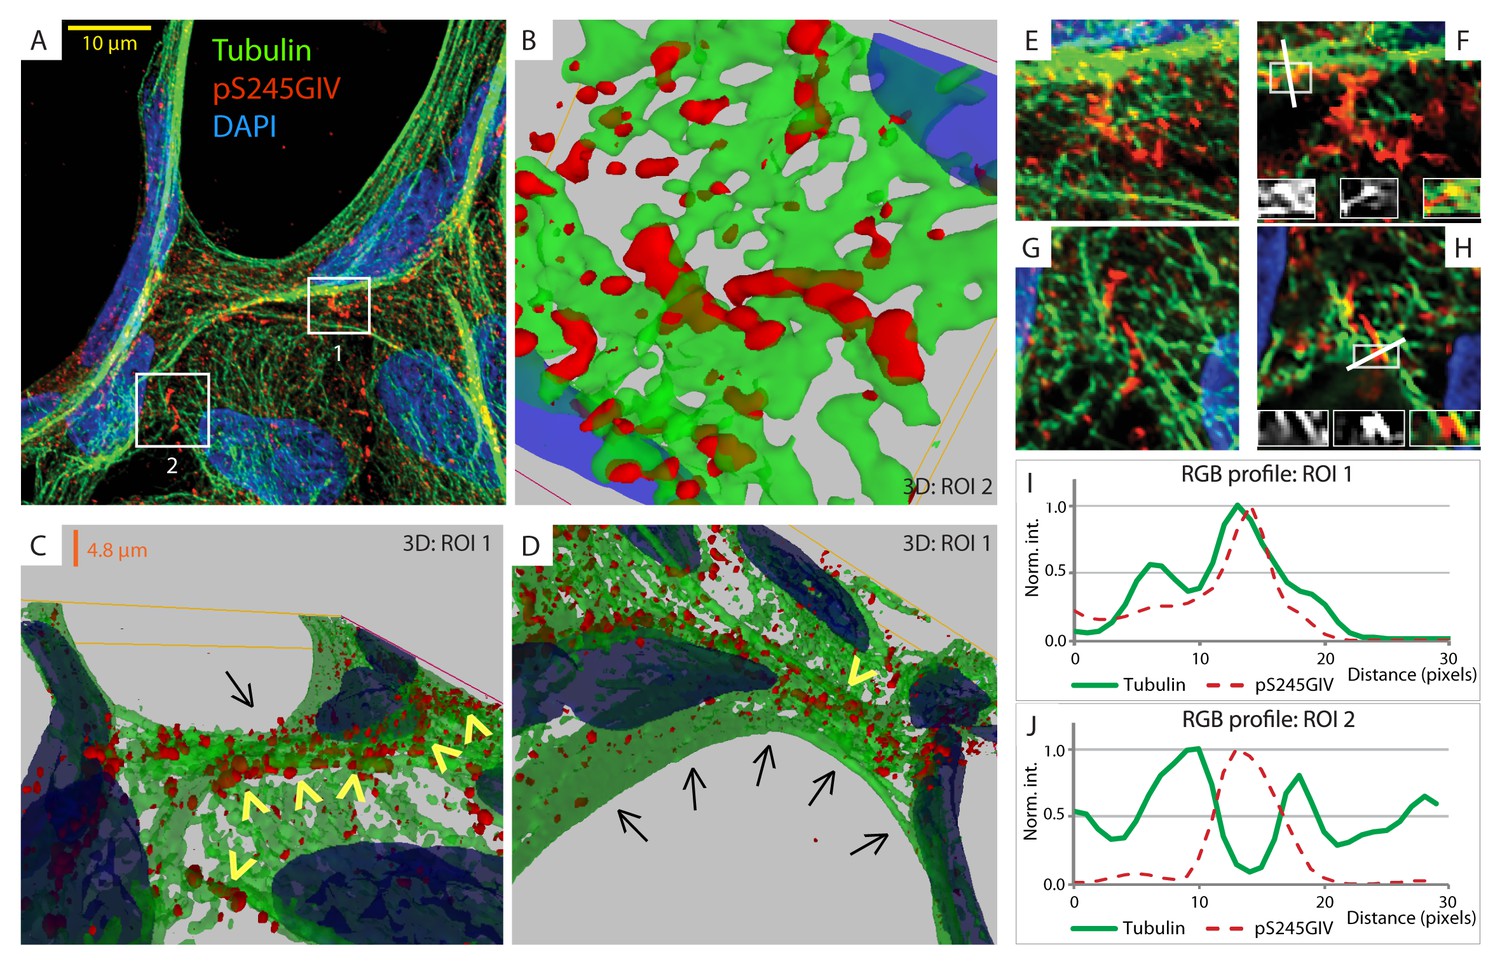
GIV phosphorylated at S245 (pS245-GIV) localizes along junction-associated microtubules.
(A) Subconfluent monolayers of MDCK cells grown on cover slips were fixed and stained for α-Tubulin (green), pS245-GIV (red) and DAPI (blue; nuclei) and analyzed by confocal microscopy. Image A shows an xy-plane maximum projection of a deconvolved stack of images, acquired at 20-nm z-intervals using a Olympus cellSens deconvolution (constrained iterative) and restoration system (Olympus FV3000) and a Apochromat 60XOSC2, NA 1.4 objective. The total thickness of the image stack is 4.8 mm. Two regions of interest (ROI), 1 and 2, are indicated with white boxes. (B–D) 3D reconstruction of each ROI shows the close proximity of pS245-GIV (red) to connecting microtubules (green) running along the cell-cell junctions (arrowheads). Little or no pS245-GIV staining (red pixels) is seen on microtubules at the 'free' cell border in panel D (arrows). (E–H) Maximum projected ROI‘s 1 and 2 are magnified in E and G, respectively. Individual Z-stacks of each ROI is shown in Figure 6—figure supplement 2. Single Z-stacks of ROI‘s 1 and 2 are displayed in F and H, respectively. The insets in panels F and H show red, green and merged channels of respective figures. The white line indicates the pixels used for generating the RGB profile plots shown in I and J. RGB profiles show that pS245-GIV (red pixels) often co-localizes either completely with microtubule tracks (green pixels; I) or lay between two microtubule tracks (J) at the cell-cell junctions.
Figure 6—figure supplement 1

Phosphorylation of GIV at S245 does not affect its ability to homodimerize.
Lysates of Cos7 cells were used as a source of full length GIV (INPUT) in pulldown assays with GST-tagged wild type (WT), a non-phosphorylatable SA, or a phosphomimicking SD mutant GIV-NT constructs or GST alone (negative control) immobilized on glutathione beads. Bound proteins were analyzed for full length GIV by immunoblotting (IB). Equal aliquots of GST proteins were confirmed by Ponceau S staining. GST-GIV-NT was sufficient to bind full length GIV from Cos7 cell lysates, Both GIV-NT-SA and SD mutants bound GIV as efficiently as did GIV-NT-WT, indicating that phosphorylation at S245 may not have a significant effect on its ability to homodimerize.
Figure 6—figure supplement 2
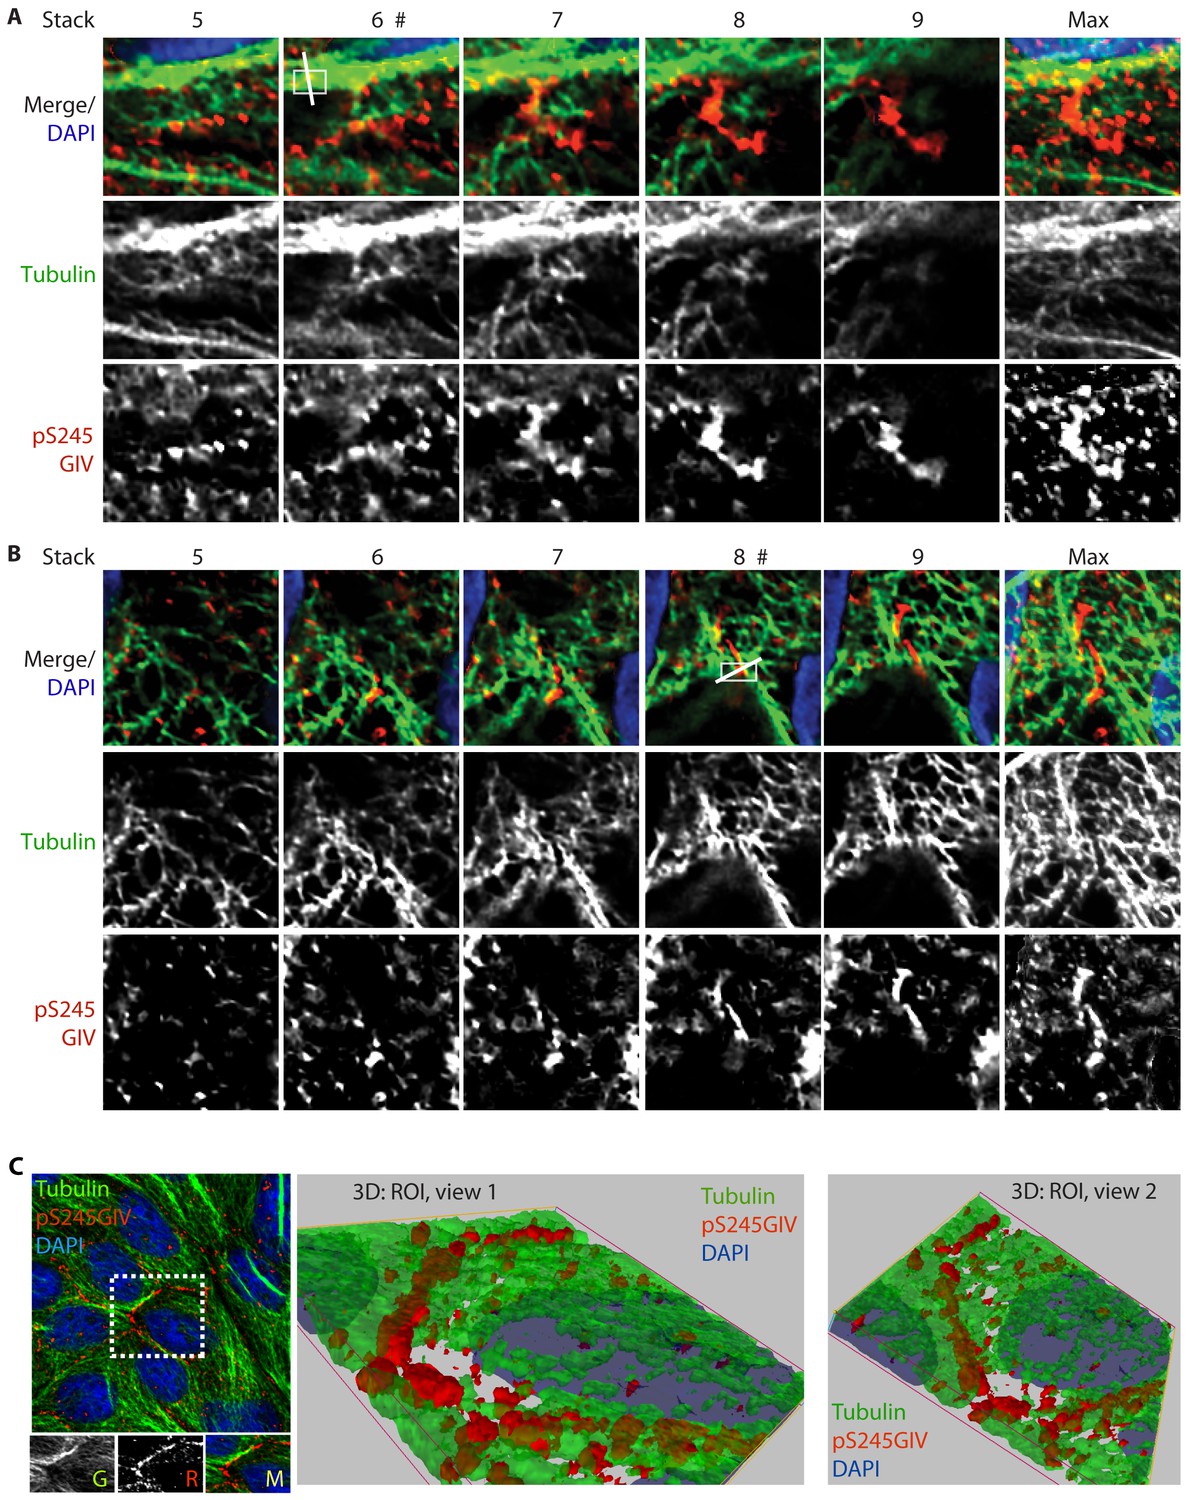
GIV phosphorylated at S245 (pS245-GIV) localizes along microtubules at the tight junction (TJ).
Subconfluent monolayers of MDCK cells were fixed and stained for α-Tubulin (green), pS245-GIV (red) and DAPI (blue; nuclei) and analyzed by confocal microscopy. Panels A and B display the individual Z-stacks of each ROI (numbered 1 and 2, respectively) indicated on the Image displayed in Figure 6A. The maximum projected ROI‘s 1 and 2 are magnified in 6E and 6G, respectively. (C) A confluent monolayer of MDCKs were treated with EGTA (as in Figure 2), fixed, stained for α-Tubulin (green), pS245-GIV (red) and DAPI (blue; nuclei), and imaged as in Figure 6A. The image on the left shows an xy-plane maximum projection of a deconvolved stack of images. A region of interest is indicated with a white box. Images in the middle and on the right display a 3D reconstruction of the region of interest viewed from two different angles. Each view shows the close proximity of pS245-GIV (red) laced along microtubules (green) exclusively at the cell-cell junctions.
Figure 7 with 1 supplement
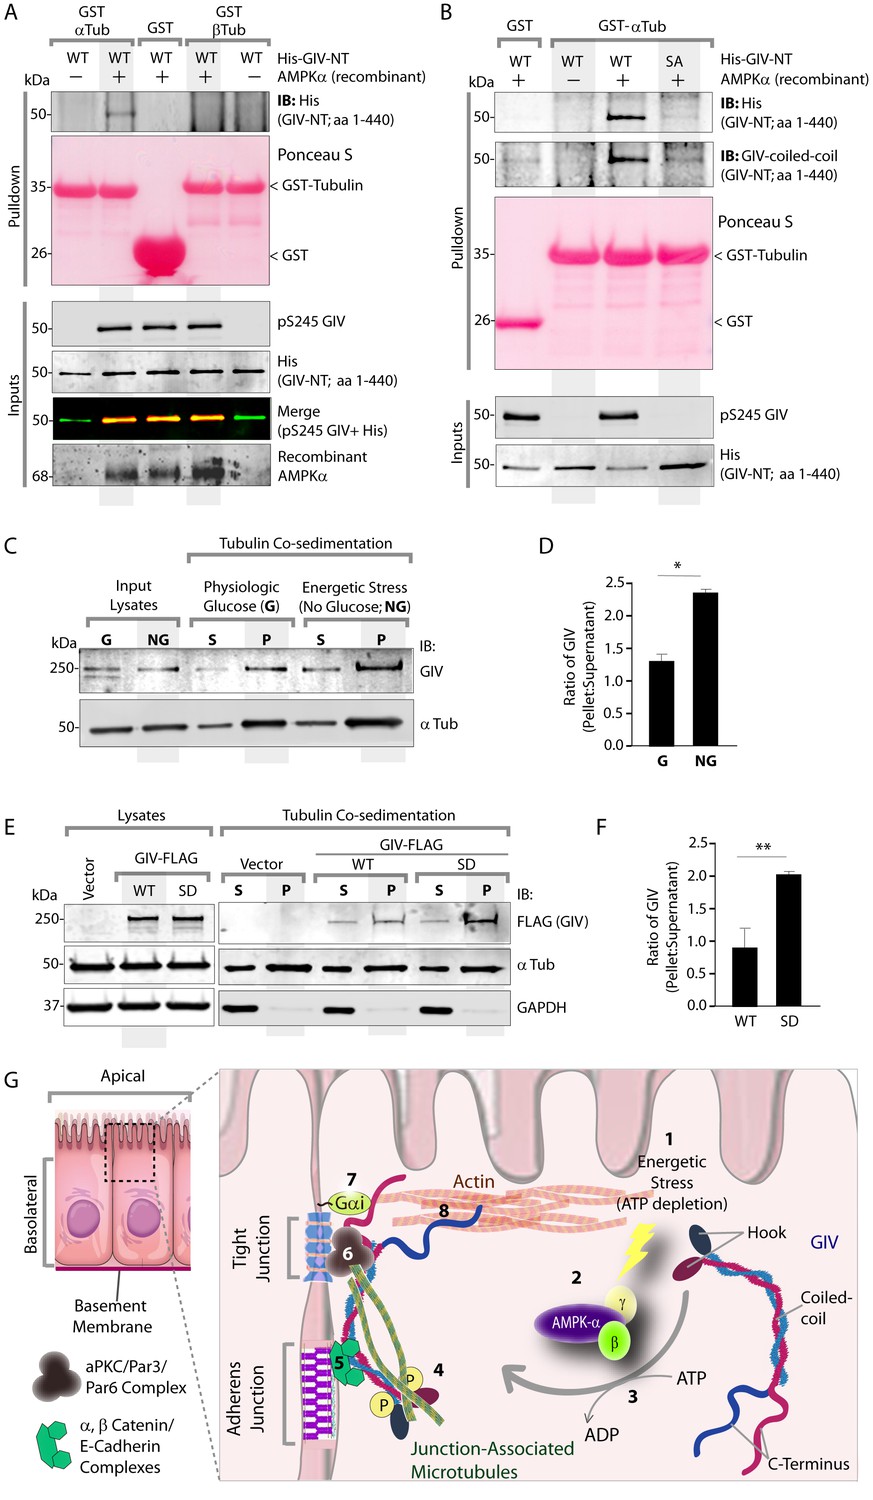
Phosphorylation of GIV at S245 increases its ability to bind α-tubulin.
(A) Bacterially expressed and purified His-GIV-NT WT were phosphorylated (+) or not (-) with recombinant AMPK heterotrimers (α/β/γ) in vitro prior to their use in binding assays with GST-α-Tubulin-CT or GST-β-Tubulin-CT immobilized on glutathione-agarose beads. Bound proteins were analyzed for GIV-NT (anti-His) by immunoblotting (IB). His-GIV-NT(1–440) binds GST-tagged carboxyl terminus of α-Tubulin exclusively after phosphorylation by AMPK. No binding is seen with β-Tubulin regardless of phosphorylation. (B) WT and non-phosphorylatable SA mutant His-GIV-NT proteins were phosphorylated (+) or not (-) by recombinant AMPK as in A prior to use in binding assays with GST-tagged carboxyl terminus of α-Tubulin. Bound proteins were analyzed for GIV (His) by immunoblotting (IB). (C–D) Tubulin cosedimentation assays (see Materials and methods) were carried out with equal aliquots of pre-cleared lysates of Cos7 cells that were grown in the presence (G) or absence (NG) of glucose for 18 hr. Samples were centrifuged at high speed to separate the microtubule polymer (P; pellet) from the soluble tubulin (S; supernatant), resolved by SDS-PAGE, and analyzed for the presence of GIV and tubulin by immunoblotting (IB). The ratio of GIV in pellet vs supernatant was quantified by band densitometry and displayed as bar graphs in D. Error bars represent mean ± S.E.M; n = 3; *p<0.05. (E–F) Tubulin cosedimentation assays were carried out with equal aliquots of pre-cleared lysates of Cos7 cells expressing either vector control, or FLAG tagged GIV-WT or SD mutant as in C, and analyzed for the presence of GIV, GAPDH (negative control) and tubulin by immunoblotting (IB). The ratio of GIV in pellet vs supernatant was quantified by band densitometry and displayed as bar graphs in F. Error bars represent mean ± S.E.M; n = 3; **p<0.01. (G) Schematic summarizing the role of GIV in the regulation of cell-cell junction stability during an energetic stress and illustrating how the current findings relate to prior work. Exposure of epithelial cells to conditions that induce energetic stress result in depletion of cellular ATP stores and accumulation of AMP (step 1); the latter activates AMPK kinase (step 2). Once activated, AMPK phosphorylates GIV at S245 (step 3) triggering its localization to the cell-cell junction (TJs) via increased ability to bind TJ-associated microtubules (Lee et al., 2007) (step 4). Once localized to the cell-cell junctions, GIV has been shown (Houssin et al., 2015) to bind AJ-localized protein complexes, e.g., α- and β-Catenins and E-cadherin and links the catenin-cadherin complexes to the actin cytoskeleton (steps 5 and 8). GIV has also been shown to bind TJ proteins, e.g., aPKC/Par3/Par6 complex (Ohara et al., 2012) (step 6), and link these proteins to G proteins and the actin cytoskeleton (Sasaki et al., 2015) (steps 7 and 8).
Figure 7—figure supplement 1
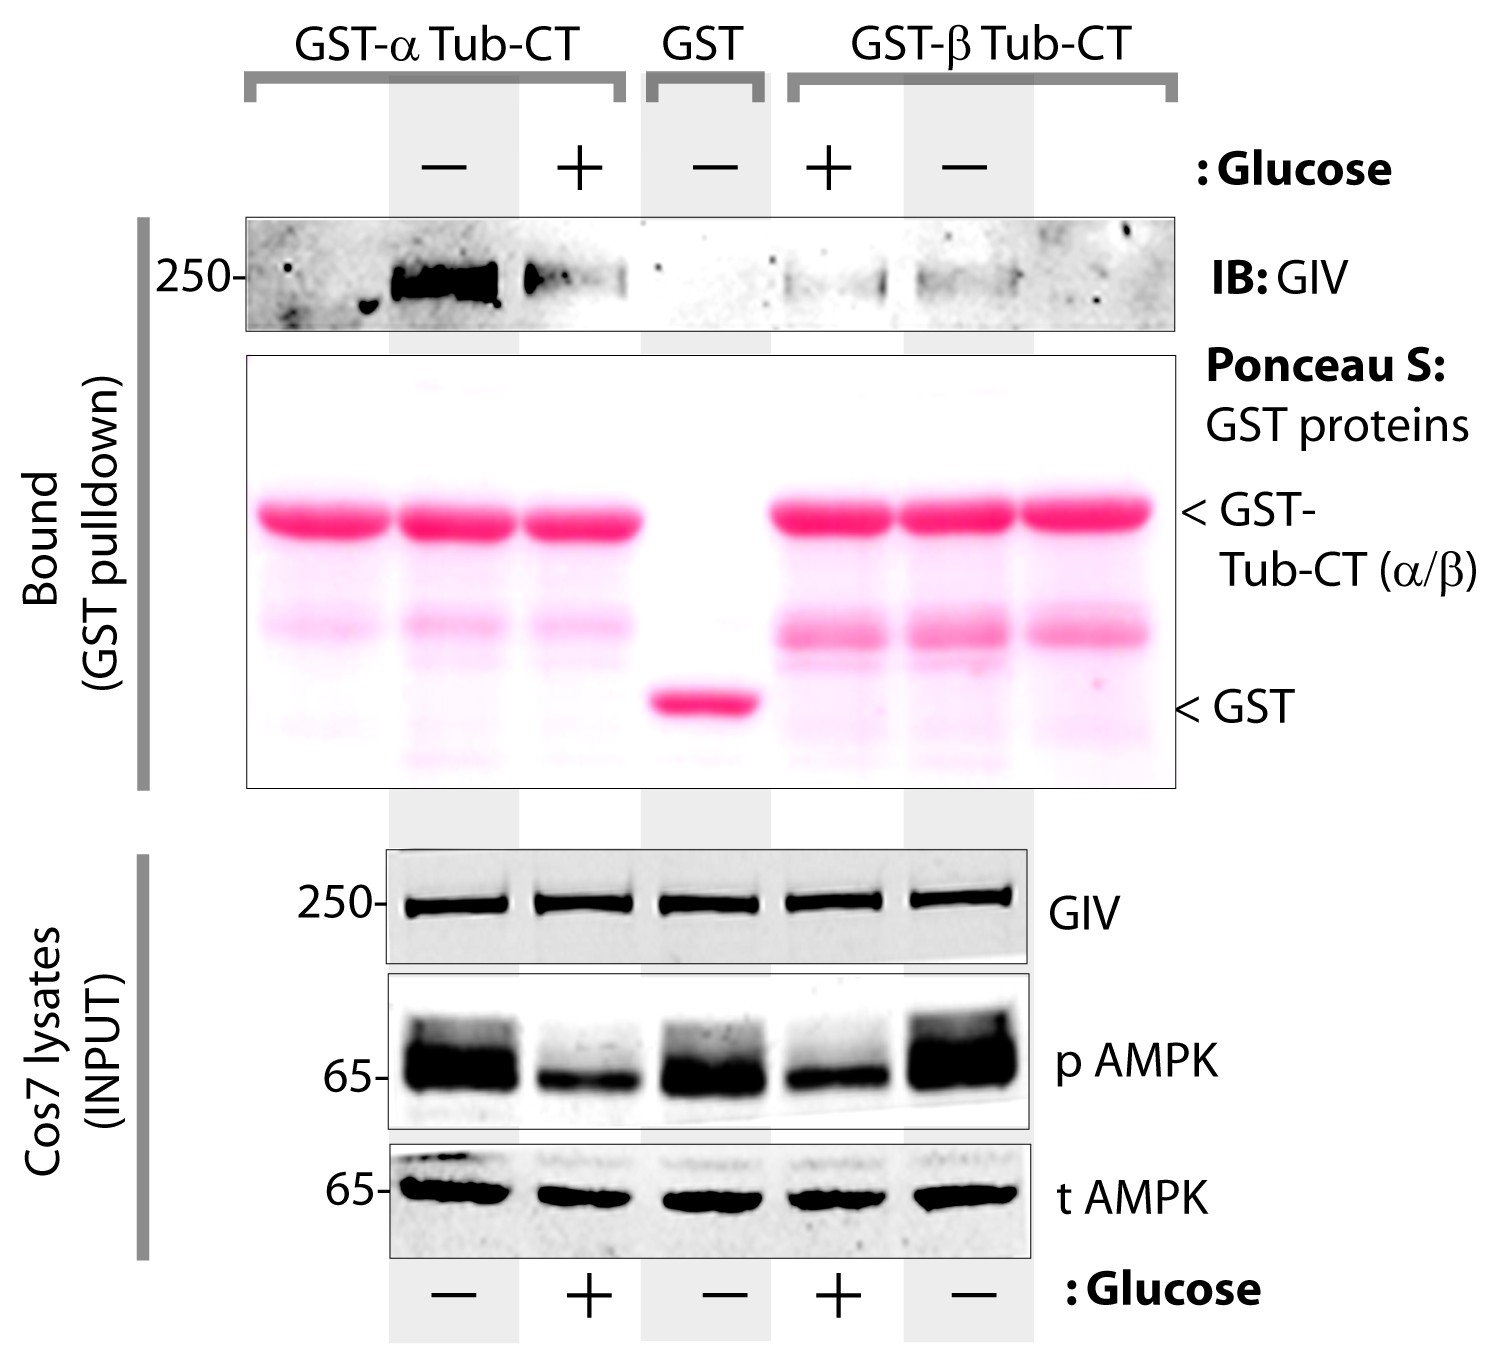
The carboxyl terminus of α-tubulin, but not β-tubulin binds full length GIV from lysates of cells exposed to energetic stress by glucose starvation.
Cos7 cells were either grown in the presence of normal glucose (+) or subjected to energetic stress by exposing them to glucose-free media (-) for 6 hr prior to lysis. Equal aliquots of these lysates were used as source of full length GIV (INPUT; bottom) in pulldown assays with GST-tagged carboxyl termini of α- or β-tubulin (GST-Tub-CT) or GST alone (negative control) immobilized on glutathione beads. Additional negative controls included GST-Tub-CT constructs alone without exposing them to any Cos7 lysates (both flanks). Bound proteins were analyzed for full length GIV by immunoblotting (IB). Equal aliquots of GST proteins were confirmed by Ponceau S staining. Left: GST-α-Tub-CT bound full length GIV preferentially from lysates of cells exposed to energetic stress (- glucose) compared to lysates of cells grown in the presence of glucose. Right: No significant GIV was detected in pulldowns with GST-β-Tub irrespective of energetic stress. As expected, no GIV bound GST alone control, or when GST-Tub-CT proteins were never exposed to Cos7 lysates (both flanks).
Figure 8 with 1 supplement
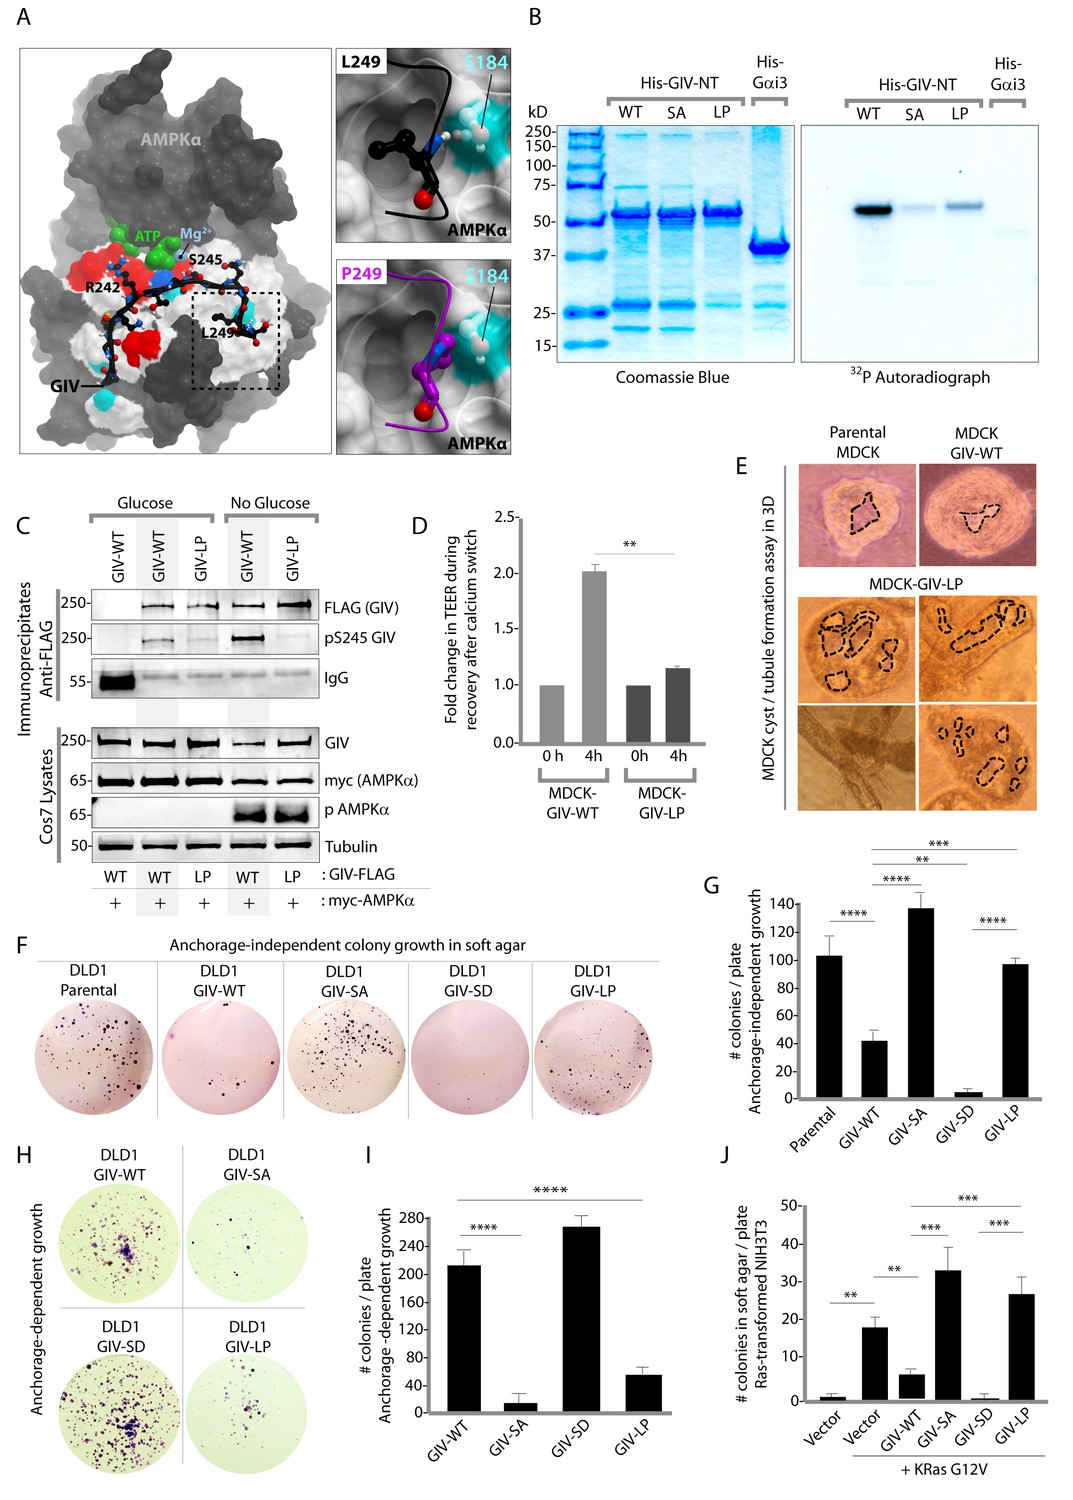
An oncogenic non-phosphorylatable GIV mutant reduces junctional stability and favors anchorage-independent growth.
(A) Homology model of GIV-bound AMPKα is shown on the left. Boxed area in the model is magnified to show the impact of replacing Leu (L) at 249 with Pro (P). L249 is predicted to be favorably buried in a hydrophobic pocket in AMPKα, contributing to binding energy; P249 is expected to induce a steric clash. See also Figure 8—figure supplement 1 for a complete list of mutations within and flanking the motif in GIV that is targeted by AMPKα. (B) In vitro kinase assays were carried out using recombinant AMPK heterotrimers (α/β/γ), bacterially expressed and purified substrates, His-GIV (WT and mutants) and His-Gαi3 (negative control), and γ-32P [ATP]. Phosphoproteins were analyzed by SDS-PAGE followed by autoradiography (right). Equal loading of substrate proteins was confirmed by staining the gel with Coomassie blue (left). AMPK efficiently phosphorylated His-GIV-NT-WT, but not the SA or the LP mutant. (C) In cellulo kinase assays were carried out in Cos7 cells co-expressing GIV-FLAG (WT or LP mutant) and myc-AMPKα constructs, and stimulating AMPK by glucose deprivation for 6 hr prior to lysis. GIV was immunoprecipitated from these lysates using anti-FLAG mAb and analyzed for phosphorylation of GIV at S245 by immunoblotting (IB) with anti-pS245-GIV and FLAG (GIV-Flag). GIV-WT, but not GIV-LP is phosphorylated at S245 in cells responding to energetic stress. (D) Bar graphs display the change in TEER measured across monolayers of MDCK-GIV-WT and LP cells during Ca2+ switch. TEER is restored efficiently in MDCK-GIV-WT cells, but not MDCK-GIV-LP cells. (E) MDCK cells grown in collagen containing matrix were analyzed for the formation of cyst and tubular structures by light microscopy as in 5G. Representative cysts and tubular structures are shown. L = lumen. Images were captured at 20X magnification. (F–G) DLD1 colorectal cancer cells stably expressing various GIV constructs were analyzed for their ability to form colonies in soft agar for ~2–3 weeks. Representative fields photographed at 20X magnification are shown in F. Bar graphs in G display the number of colonies (Y axis) seen in each cell line in F, as determined by light microscopy throughout the depth of the matrix in 15 randomly chosen fields. Compared to GIV-WT, GIV-SD inhibits, whereas the non-phosphorylatable GIV-SA and GIV-LP mutants enhance colony formation. (H-I) DLD1 cells in F were analyzed for their ability to form adherent colonies on plastic plates for ~2 weeks prior to fixation and staining with crystal violet. Image of the crystal violet-stained 6-well plate is displayed in H. Bar graphs in I display the number of colonies (Y axis) as determined by ImageJ (colony counter plugin). (J) NIH3T3 cells expressing HA-KRas-G12V alone, or co-expressing HA-KRas-G12V and GIV-WT-FLAG (WT or mutants) were analyzed for their ability to form colonies in soft agar prior to staining with MTT. Bar graphs display the number of colonies formed/plate (Y axis) in each condition. Compared to GIV-WT, GIV-SD inhibits, whereas the non-phosphorylatable GIV-SA and GIV-LP mutants enhance colony formation. n = 3. Results are expressed as ± SEM. ns = not significant; **p<0.01; **p<0.01; ***p<0.001; ****p<0.0001.
Figure 8—figure supplement 1
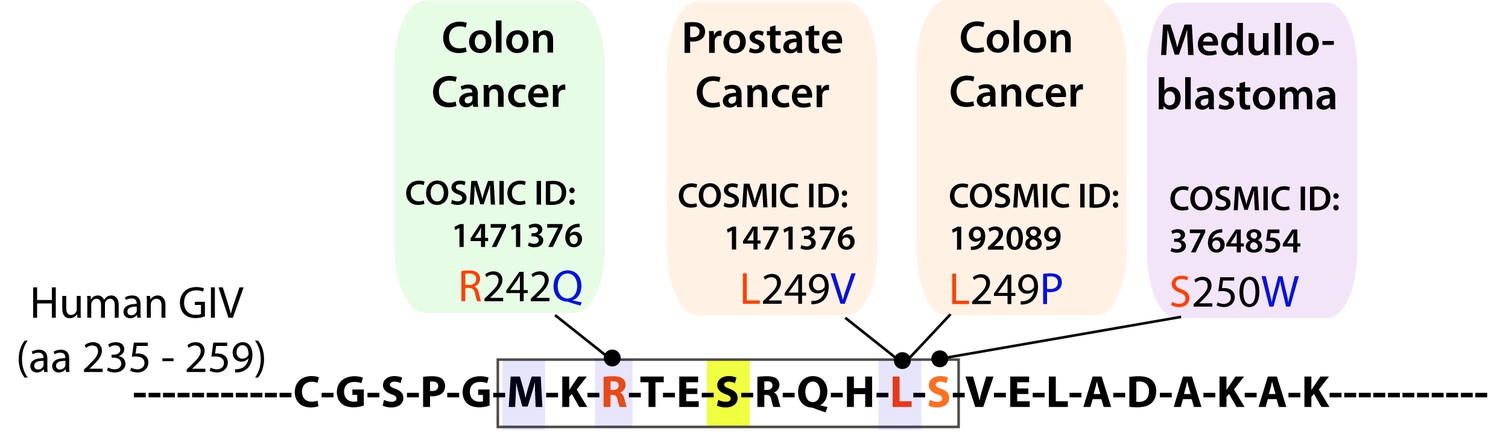
The consensus phosphorylation site for AMPK on GIV is frequently mutated in cancers.
Schematic summarizes mutations found in cancer and localized in the consensus phosphorylation site for AMPK on GIV using Catalogue of Somatic Mutations in Cancer (COSMIC) database. According to our homology model of GIV-bound AMPKα displayed in Figure 1I, R242Q (found in 1 tumor) and L249P (found in 2 tumors) mutations that were found in colon cancers are predicted to reduce the AMPKα-GIV interaction. L249V and S250W mutations are predicted to have a milder effect on the interaction. The L249P mutant was investigated in detail in Figure 8.
Figure 9
Phosphorylation of GIV at S245 is essential for the tumor-suppressive actions of AICAR and Metformin.
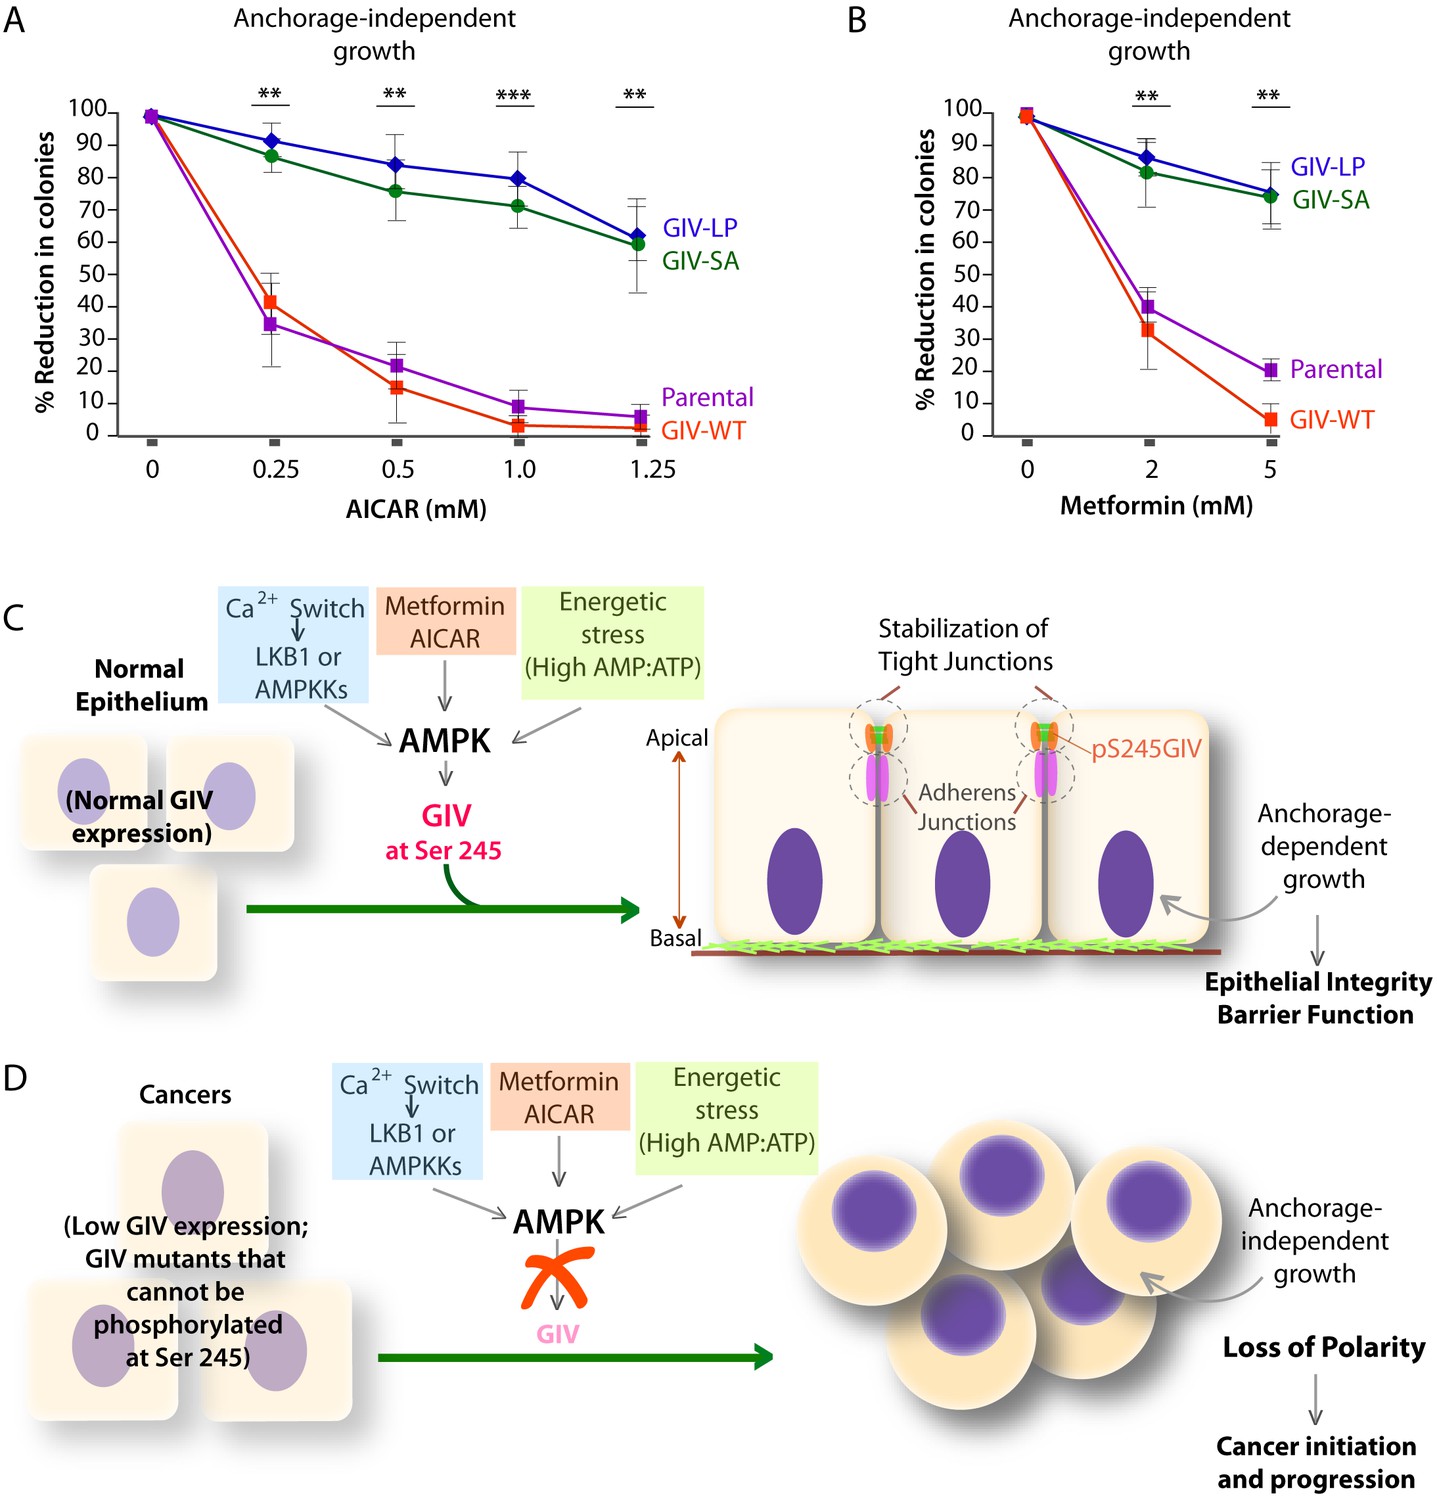
(A, B) Parental DLD1 colorectal cancer cells and those stably expressing GIV-WT and the non-phosphorylatable SA and LP mutant GIV constructs were analyzed for their ability to form colonies in soft agar for 2–3 weeks in the presence of increasing concentrations of AICAR (A) or Metformin (B). The number of colonies was counted by light microscopy throughout the depth of the matrix in 15 randomly chosen fields. Graphs display the % reduction in colonies (Y axis) in each cell line, normalized to their respective controls (no treatment). Error bars represent mean ± S.E.M; n = 3; **p<0.01; ***p<0.001; ****p<0.0001. The growth suppressive effects of AICAR (A) and Metformin (B) observed in DLD1 cells expressing GIV-WT were significantly reduced in cells expressing GIV-SA or GIV-LP. (C,D) Working models for how the AMPK-GIV axis impacts cell polarity in normal epithelial cells and in cancers. In the presence of a functional AMPK-GIV axis (C) in which GIV can be phosphorylated by AMPK at S245, cell polarity and the integrity of TJs are preserved in the face of energetic stress, thereby maintaining epithelial barrier function and homeostasis and anchorage-dependency for growth. In the absence of a functional AMPK-GIV axis (D), either because AMPK cannot be activated or GIV cannot be phosphorylated by AMPK at S245, TJs succumb to energetic stress, cell polarity is lost, and cells can undergo anchorage-independent sustained growth.
Figure 10

GIV (CCDC88A) functions at the nexus of a variety of cellular pathways that regulate and respond to changes in cell-cell junctions.
A protein-protein interaction network (see Materials and methods) shows all known and predicted protein-protein interactions (relevant to the current work), both functional and directly physical in nature, that stem from computational prediction, from knowledge transfer between organisms, and from interactions reported in other (primary) databases. The clusters of functional associations shown here are meant to be specific and meaningful, i.e. proteins jointly contribute to a shared function; this does not necessarily mean they are physically binding each other. The interaction network shows that GIV (CCDC88A) functions as a key polarity-determinant scaffold which links major components that sense cellular energy (STK11, LKB1; PRKA, AMPK) and determine cellular growth and survival responses (on the left) and signaling pathways, e.g., Wnt (top; light blue) and growth factor and integrin pathways (purple; bottom) that dictate anchorage-dependent vs independent growth in normal and transformed cells, respectively, to cell-cell junctions (both tight and adherens; on the right). The microtubule stability determinants (upper left; dark blue) are likely to synergize with the AMPK-GIV axis for protecting junctions against stress-induced collapse. Two previously defined functional interactions of PRKA (AMPK) studied in different contexts stand out as key links: (1) Phosphorylation of the microtubule plus end protein CLIP-170 (CLIP1; deep blue) by AMPK enhances the speed of microtubule polymerization (Nakano et al., 2010); and (2) Phosphorylation of the TJ- protein cingulin (CGN; green) by AMPK increases the association of plus ends of microtubules with TJs (Yano et al., 2013). Key at the lower left corner indicates how each functional interaction within this network was color-coded.
Download links
A two-part list of links to download the article, or parts of the article, in various formats.
Downloads (link to download the article as PDF)
Open citations (links to open the citations from this article in various online reference manager services)
Cite this article (links to download the citations from this article in formats compatible with various reference manager tools)
AMP-activated protein kinase fortifies epithelial tight junctions during energetic stress via its effector GIV/Girdin
eLife 5:e20795.
https://doi.org/10.7554/eLife.20795


