Plasmodium falciparum ligand binding to erythrocytes induce alterations in deformability essential for invasion
- The Walter and Eliza Hall Institute of Medical Research, Australia
- Washington University School of Medicine, United States
- Hawaii Pacific University, United States
- The University of Melbourne, Australia
- The Queen's Medical Center and John A. Burns School of Medicine, University of Hawaii, United States
Figures
Figure 1 with 2 supplements
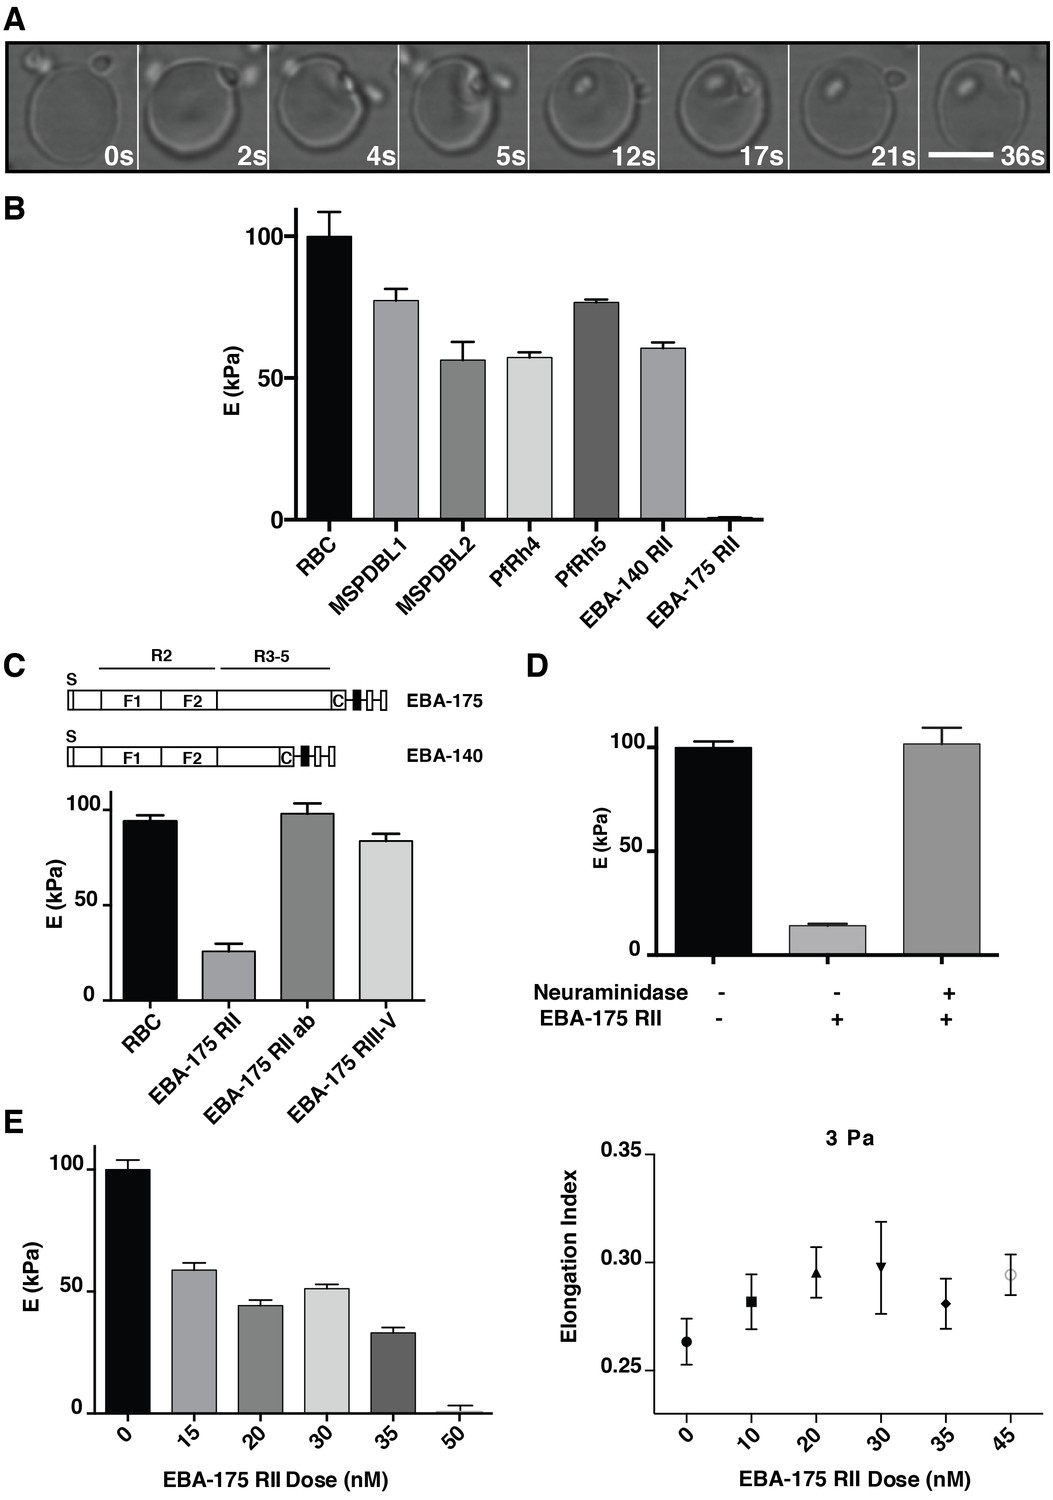
P. falciparum EBA-175 RII binding to GPA increases deformability of the erythrocyte.
(A) Live imaging time frames showing a merozoite deforming an erythrocyte. Scale bar 5 μm. (B) Atomic force microscopy (AFM) screen of the effect of P. falciparum invasion ligands on the erythrocyte Young’s modulus (E). (C) Schematics showing EBA-175 and EBA-140 domain structure (top). The bottom panel is the AFM Young’s modulus of erythrocytes treated with EBA-175 region II, region III-IV and EBA-175 RII in the presence of EBA-175 RII antibodies (EBA-175+Ab). (D) AFM Young’s modulus of neuraminidase treated erythrocytes in the presence or absence of EBA-175 RII. (E) EBA-175 titration on erythrocytes and comparison of the AFM Young’s modulus (left) with the elongation index measured by rheology (right). 4 μg (B), 3.5 μg (C), 3.8 μg (D) and 1–4 μg (E) were added to 500 μL erythrocytes in RPMI-HEPES at 2% haematocrit. Error bars represent the mean and SEM for three independent experiments.
Figure 1—figure supplement 1
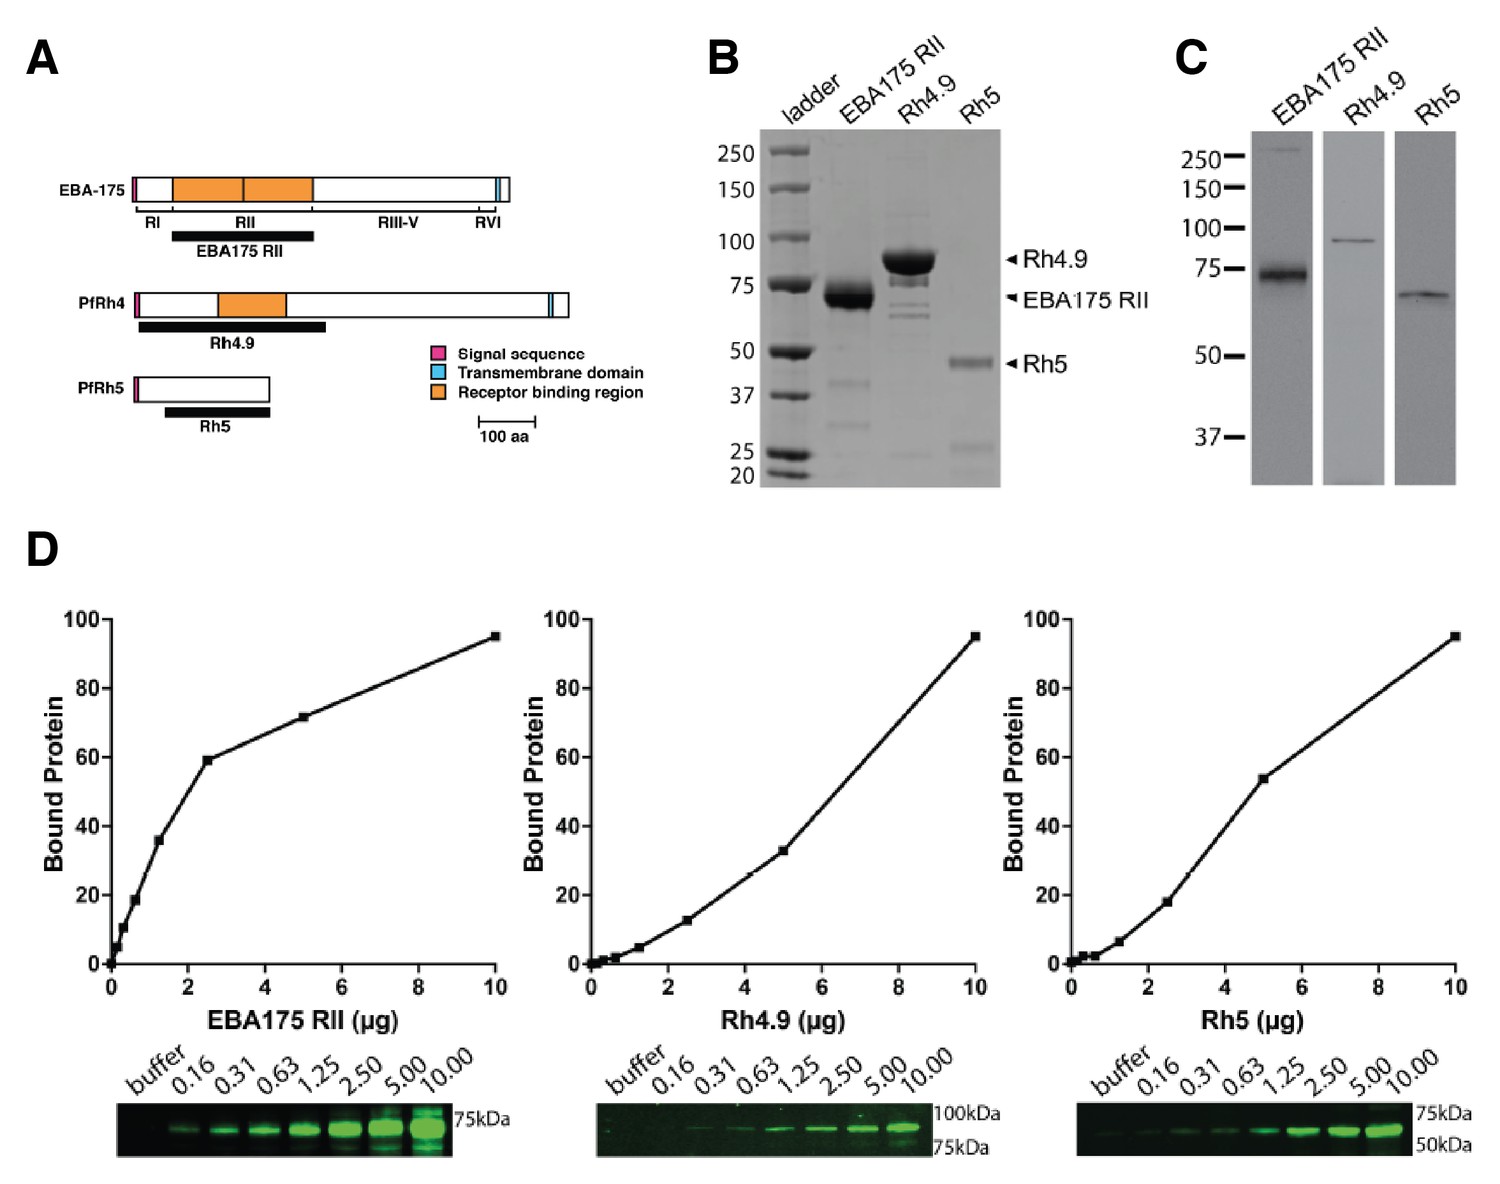
Binding of P. falciparum recombinant ligands to human erythrocytes.
(A) Schematics showing EBA-175, PfRh4 and PfRh5 domain structure. The black bars represent the recombinant fragments spanning the binding domains used in this study. (B) Coomasie gel of the recombinant proteins EBA-175 RII, Rh4.9 and Rh5 used for erythrocyte binding assays. (C) Erythrocyte binding assays showing that EBA-175 RII, Rh4.9 and Rh5 bind erythrocytes as detected by immuno-blot (molecular weight markers are labeled on the left). (D) Erythrocyte binding of EBA-175 RII, Rh4.9 and Rh5. Erythrocyte binding profiles with the bound protein analysed by immuno-blotting using specific primary antibodies. Bound protein was quantified using fluorescent secondary antibodies and densitometry. The curves show that EBA175 RII and Rh5 binding is saturable as the slope of the curve decreases with increasing amounts of input protein. Binding of Rh4.9 increases linearly between 0 and 20 μg of input protein. An immuno-blot is shown below the graph, with molecular weight markers on the right and lanes labeled as the amount of protein added to binding assays (μg).
Figure 1—figure supplement 2
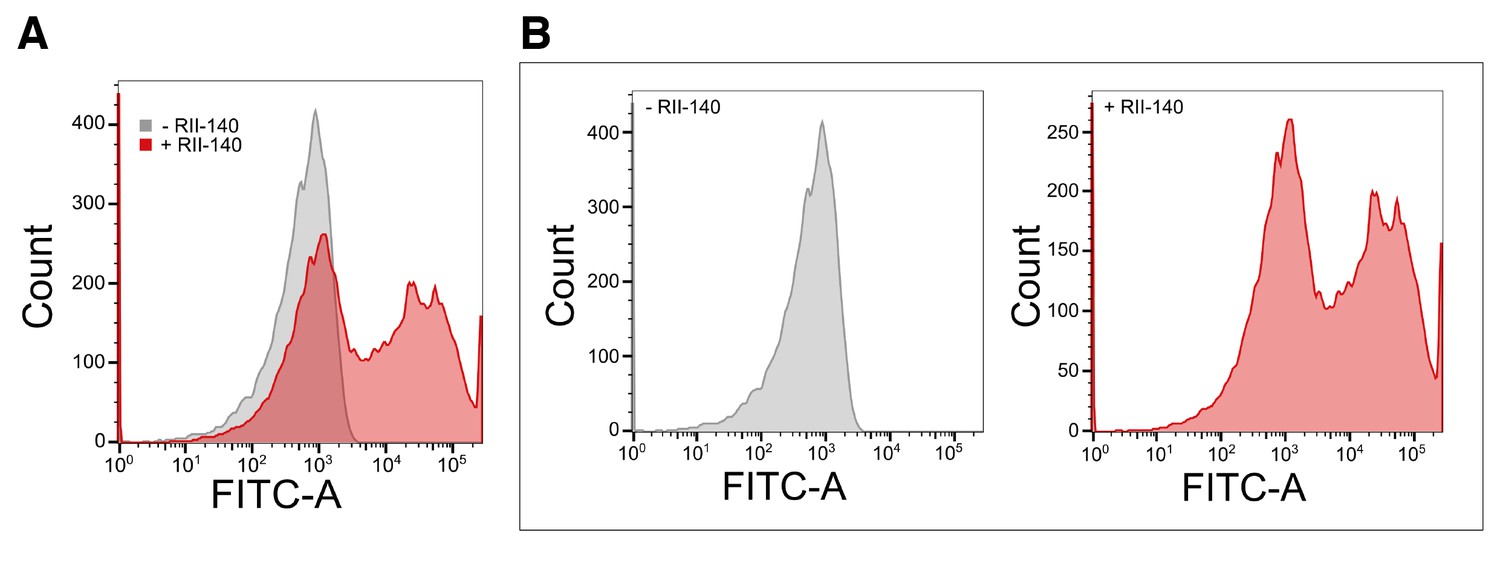
Binding of recombinant EBA-140 RII to human erythrocytes.
(A) Quantitative binding assay of a 6x-His tagged recombinant EBA-140 RII. Erythrocytes were labeled with recombinant RII-140 and stained with a FITC conjugated anti-6x-His antibody. (B) Representative flow cytometry profile for untreated erythrocytes (gray, left) and erythrocytes treated with RII-140 (red, right).
Figure 2 with 2 supplements
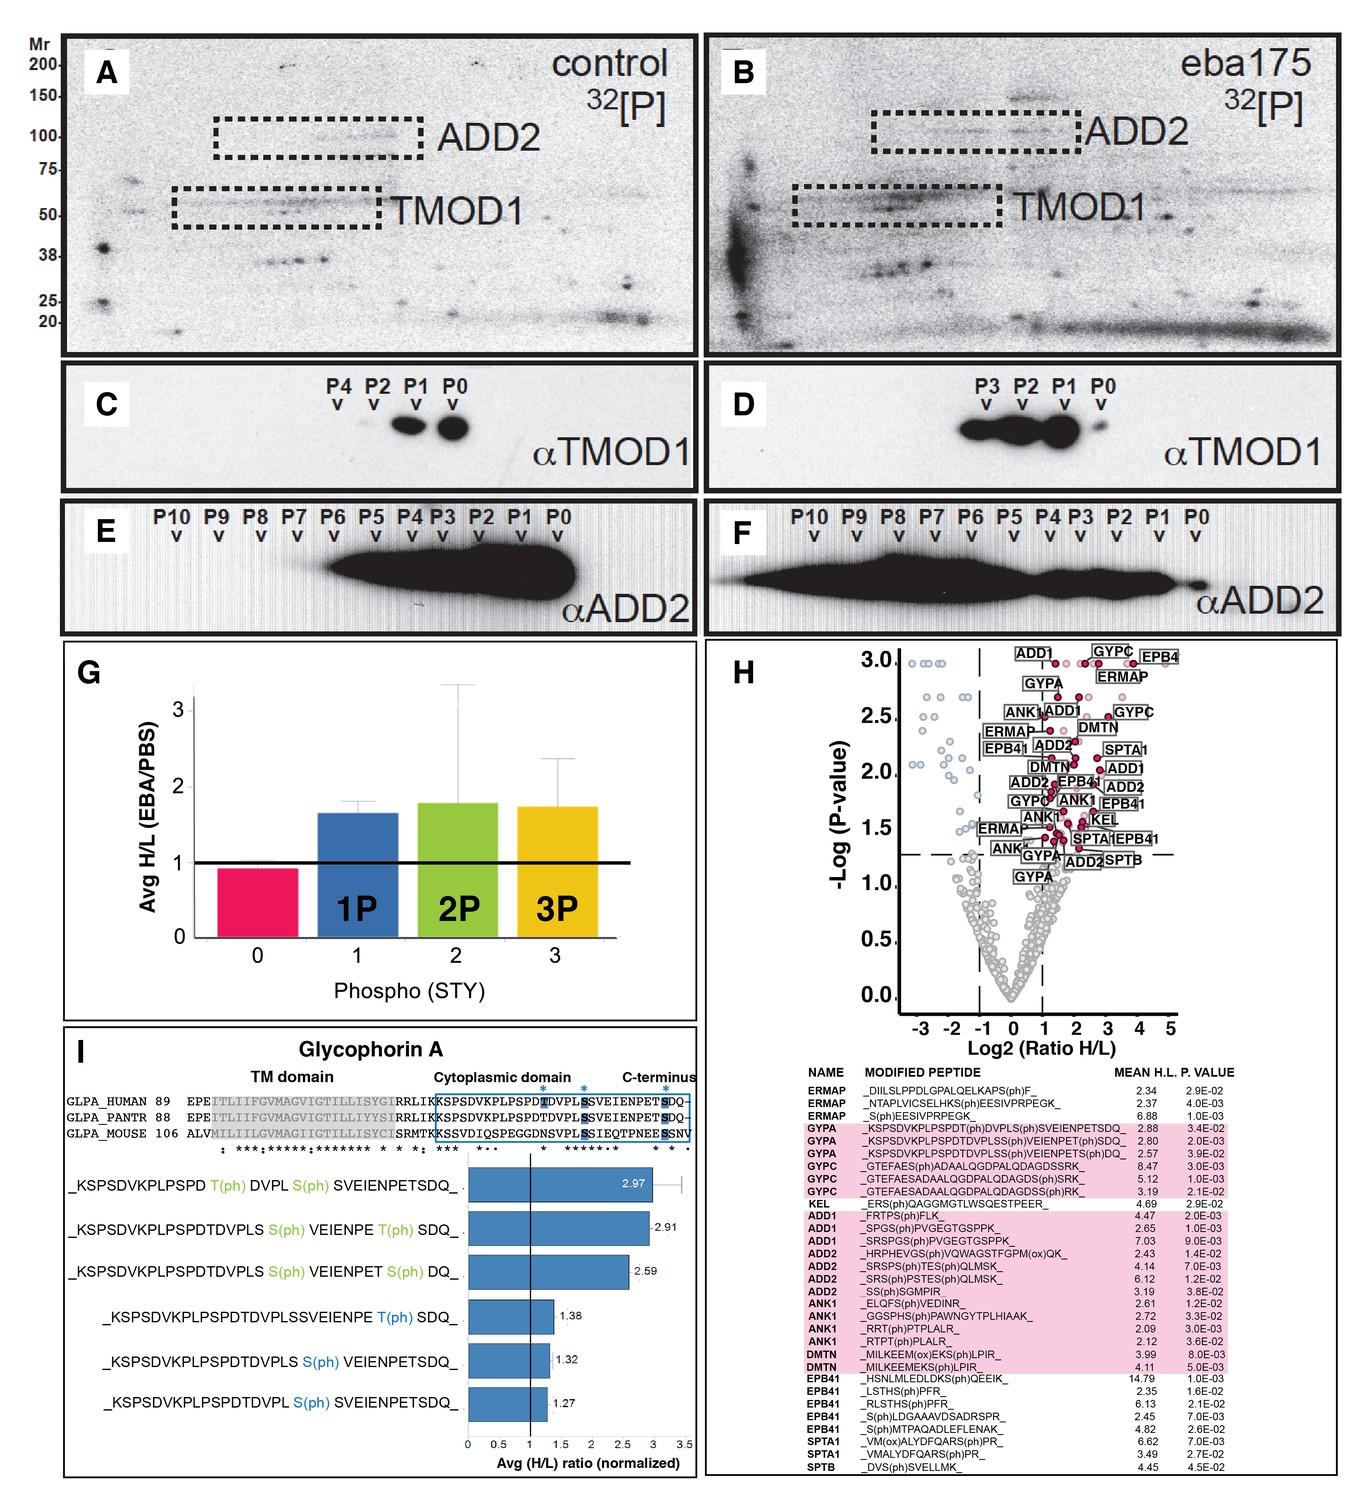
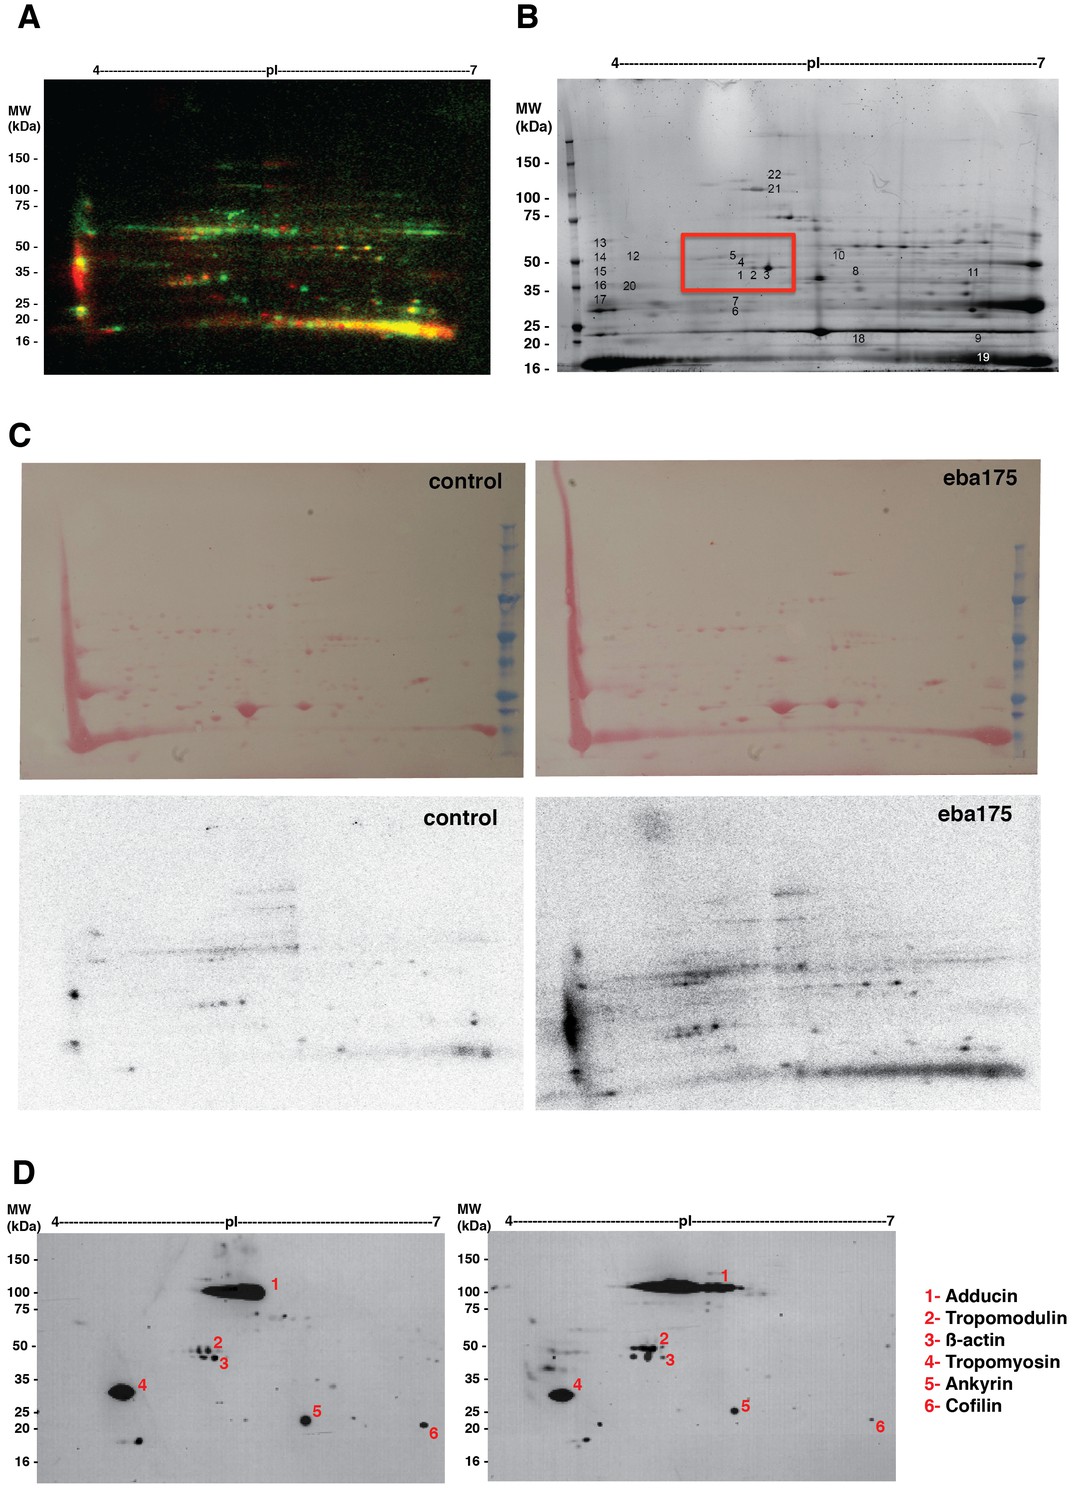
EBA-175 RII induces an increase in phosphorylation of trans-membrane and cytoskeletal erythrocyte proteins.
(A–B) MW vs. pI 2D electrophoresis gel autoradiographs of EBA-175 RII treated (B) or untreated (A) 32P radio-labeled erythrocyte ghosts. (C–F) Western blot phosphorylation validation of tropomodulin 1 (C–D) and adducin-2 (E–F). P0-P10 indicate the number of phosphorylation sites. (G) Mass spectrometry phosphopeptide heavy (H) to light (L) ratios of EBA-175 (H) mixed with PBS (L) treated ghosts. (H). Volcano plot showing quantitative analysis of unique phosphopeptides. Red dots indicate significant upregulated unique phosphopeptides corresponding to cytoskeletal protein IDs highlighted in the list. (I) Amino acid sequence of glycophorin A (top), red square highlights the cytoplasmic domain conserved across different species. Glycophorin A unique phosphopeptides detected (bottom), red circles point out phosphorylation sites all located in the cytoplasmic domain.
Figure 2—figure supplement 1
Binding of EBA-175 tohuman erythrocytes activates increased phosphorylation of the host cytoskeleton.
(A) Autoradiographs overlay of MW vs. pI 2D electrophoresis gel of EBA-175 treated (red) or untreated (green) 32P radio-labeled RBC ghosts. (B) Coomasie blue stained preparative 2-D gel of untreated erythrocyte ghosts. (C) Ponceau stains (top) of the 2-D electrophoresis gels of untreated (left) and EBA-175 treated (right) ghosts with the corresponding autoradiographs (bottom). (D) Overlap of western blots of the 2-D preparative gel using antibodies against adducin-2, tropomodulin-1, beta-actin, tropomyosin, ankyrin-1 and cofilin-1. Top panel corresponds to untreated red blood cell ghosts and bottom panel to EBA-175 RII ghosts. Notice the increase in band intensity and acid shift for adducing (1), tropomodulin (2) and β-actin (3) in the bottom panel.
Figure 2—figure supplement 2
Quantitation and identification of peptides phosphorylated after EBA-175 binding to human erthrocytes.
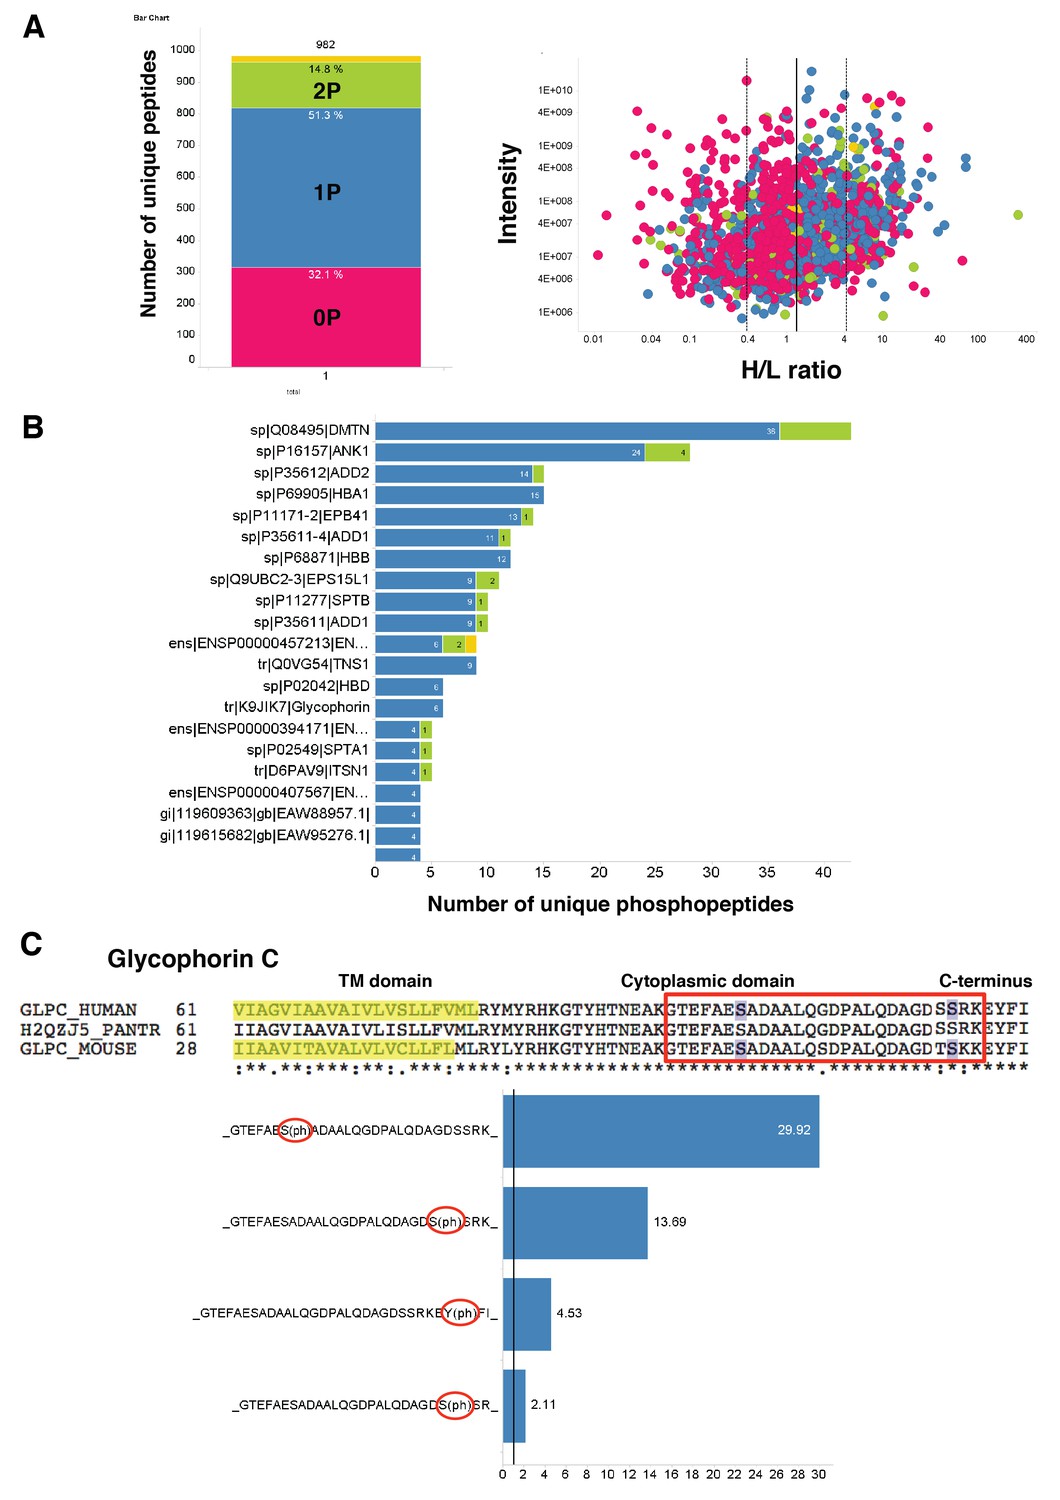
(A) Stacked bar graph (left) of the total number of unique peptides detected (982) in the H + L mix plotting the percentage of no phosphorylated peptides (0P) and with single (1P), double (2P) and triple (yellow) phosphorylation. Scatter plot (right) showing the intensity of the different H/L ratio groups detected (0P, pink; 1P, blue; 2P, green; 3P, yellow). (B) Number of unique phosphopeptides with multiple phosphorylations (1P, 2P, 3P) for a number of erythrocyte transmembrane and cytoskeletal protein IDs. (C) Amino acid sequence of glycophorin C (top), red square highlights the cytoplasmic domain conserved across different species. Glycophorin C unique phosphopeptides detected (bottom), red circles point out phosphorylation sites all located in the cytoplasmic domain.
Figure 3
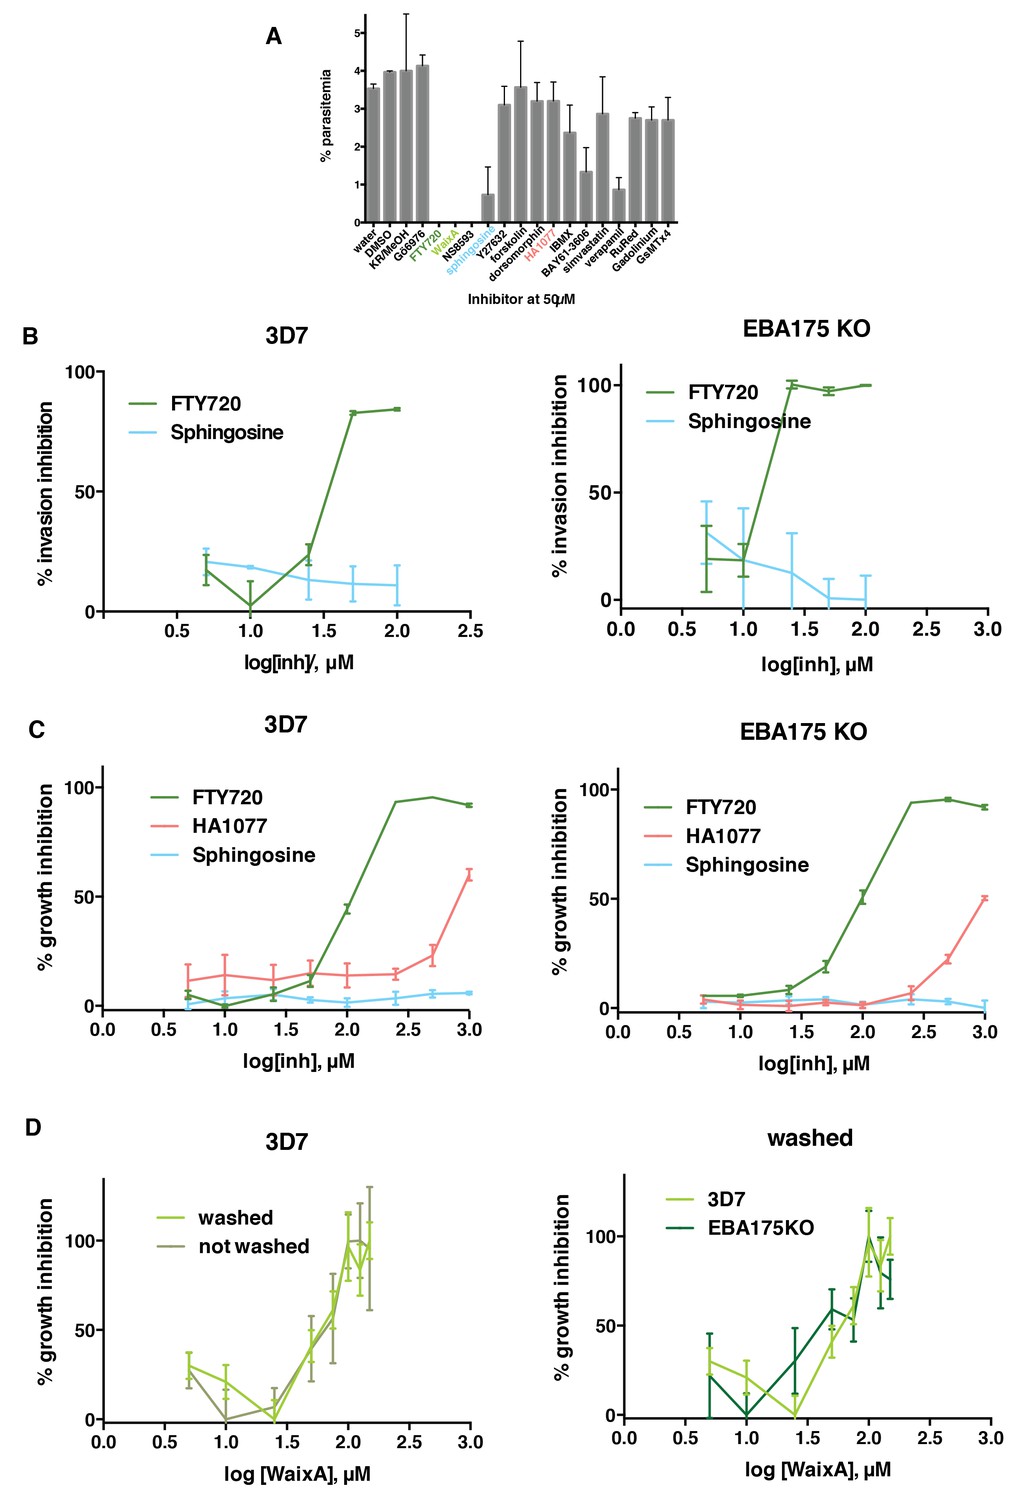
FTY720 and Waixenicin A, inhibitors of TRPM7, block P. falciparum erythrocyte invasion.
(A) Parasitemia after 12–16 hr post addition of synchronous schizonts to erythrocytes treated with different inhibitors at 50 μM. Parasitaemia was normalized to the control. Error bars show SEM corresponding to three independent experiments. (B) Invasion inhibition assays. Purified merozoites from either 3D7 (left) or 3D7∆EBA-175 (right) parasite lines were added to erythrocytes treated with varied concentrations of FTY720 or sphingosine. Parasitaemia was counted after 24 hr, normalized to the control and expressed as % inhibition. (C) Growth inhibition assays (GIAs) showing inhibitory activity of FTY720, HA1077 and sphingosine for 3D7 (left) and 3D7∆EBA-175 (right) parasite lines. (D) GIAs after washing or not washing waixenicin A treated 3D7 (left) and 3D7∆EBA-175 parasites (right). All trophozoite-synchronized cultures were treated with serial inhibitor concentrations and parasitaemia was counted after 24 hr. Error bars show SEM corresponding to three independent experiments.
Figure 4
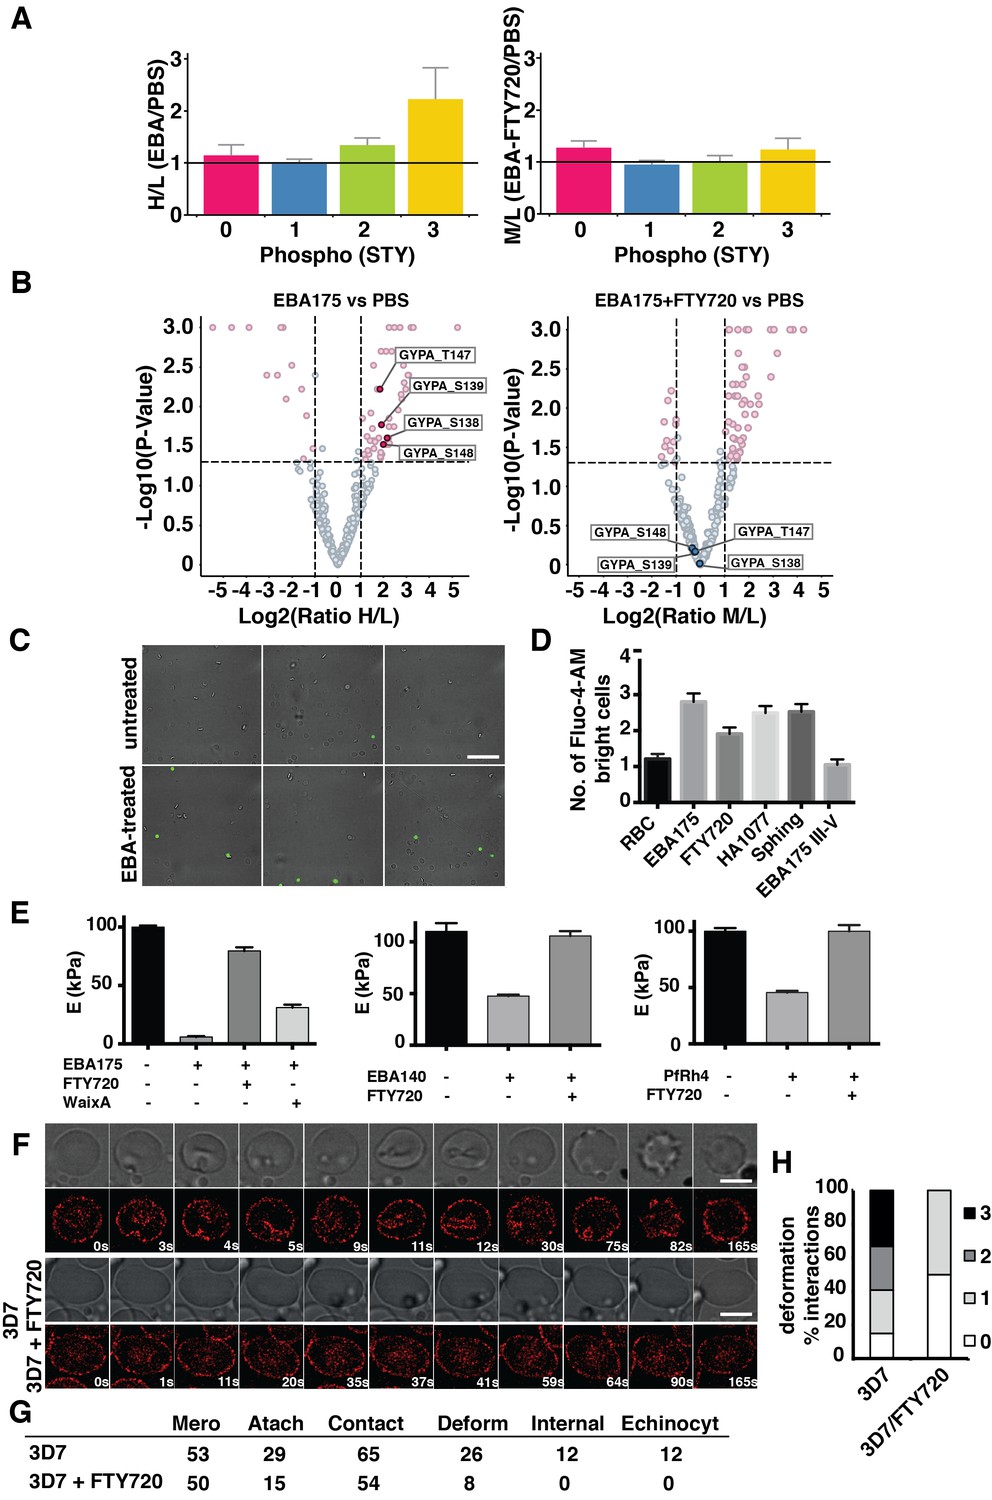
FTY720 inhibits P. falciparum invasion by interfering with a post-translational pathway triggered by EBA-175 binding to GPA.
(A) Phosphopeptide heavy (H) to light (L) ratios of EBA-175 (H) with PBS (L) treated ghosts (left). Phosphopeptide intermediate (M) to light (L) ratios of EBA-175 and FTY720 treated (M) with untreated (L) ghosts (right). (B) Equivalent quantitative analysis of unique phosphopeptides represented in volcano plots showing that GPA phosphorylation sites are not phosphorylated in the presence of FTY720. (C) Fluorescence microscopy showing of erythrocytes in the presence of calcium indicator Fluo-4-AM. EBA-175 treated erythrocytes (bottom) are more permeable to Ca2+. Scale bar 40 μm. (D) High content screen analysis of the number of Fluo-4-AM bright cells untreated or treated with EBA-175 RIII-IV and EBA-175 RII in the presence of FTY720, HA1077 and sphingosine (50 μM). (E) AFM Young’s modulus measurements. Erythrocytes treated with PBS or EBA-175 RII in the presence of FTY720 or waixenicin A (left). Erythrocytes treated with EBA-140 RII (middle) or PfRh4 (right) in the absence or presence of FTY720. (F) Frames of live imaging experiments for 3D7 merozoites and erythrocytes in the absence or presence of FTY720 (6 μM). In each condition, bright field is shown in top panels and 594 channels in the bottom ones. Scale bars are 5 μm. (G) Table detailing the number of merozoites (Mero) that attach, contact (number of contacted erythrocytes), deform, invade and undergo echinocytosis (Echinocyt). (H) Stacked graphs showing the deformation score percentage of total interactions for 3D7 merozoites in the absence or presence of FTY720. Deformation scores are according to a simplified four-point deformation scale (Weiss et al., 2015). Error bars show SEM corresponding to three independent experiments.
Videos
Video 1
This video is linked to Figure 4F which shows the still time lapse images of this video-microscopy of P. falciparum merozoites invading Bodipy TR Ceramide labelled human erythrocytes.
This shows the deformation caused by the merozoites during the initial interaction before invasion is activated.
Video 2
This video is linked to Figure 4F which shows the still time lapse images of this video-microscopy of P. falciparum merozoites attempting to invade Bodipy TR Ceramide labelled human erythrocytes in the presence of FTY720.
This shows the lack of severe deformation caused by the merozoites during the initial interaction and their inability to invade. This is linked to Figure 4F which shows the still time lapse images of the movie.
Additional files
-
Supplementary file 1
Table of LC-MSMS evidence and quantitative statistics for the double labelling experiment in which EBA-175 treated erythrocyte proteins were labelled with heavy isotope (H) versus untreated that were labelled with light isotope (L).
- https://doi.org/10.7554/eLife.21083.012
-
Supplementary file 2
Table of LC-MSMS evidence and quantitative statistics for the triple labelling experiment in which EBA-175 treated erythrocytes were labelled with heavy isotope (H), EBA-175+FTY720 treated erythrocyte proteins were labelled with medium isotope (M) versus untreated erythrocyte proteins labelled with light isotope (L).
- https://doi.org/10.7554/eLife.21083.013
Download links
A two-part list of links to download the article, or parts of the article, in various formats.
Downloads (link to download the article as PDF)
Open citations (links to open the citations from this article in various online reference manager services)
Cite this article (links to download the citations from this article in formats compatible with various reference manager tools)
Plasmodium falciparum ligand binding to erythrocytes induce alterations in deformability essential for invasion
eLife 6:e21083.
https://doi.org/10.7554/eLife.21083


