Proteolytic maturation of α2δ represents a checkpoint for activation and neuronal trafficking of latent calcium channels
- University College London, United Kingdom
Figures
Figure 1 with 3 supplements
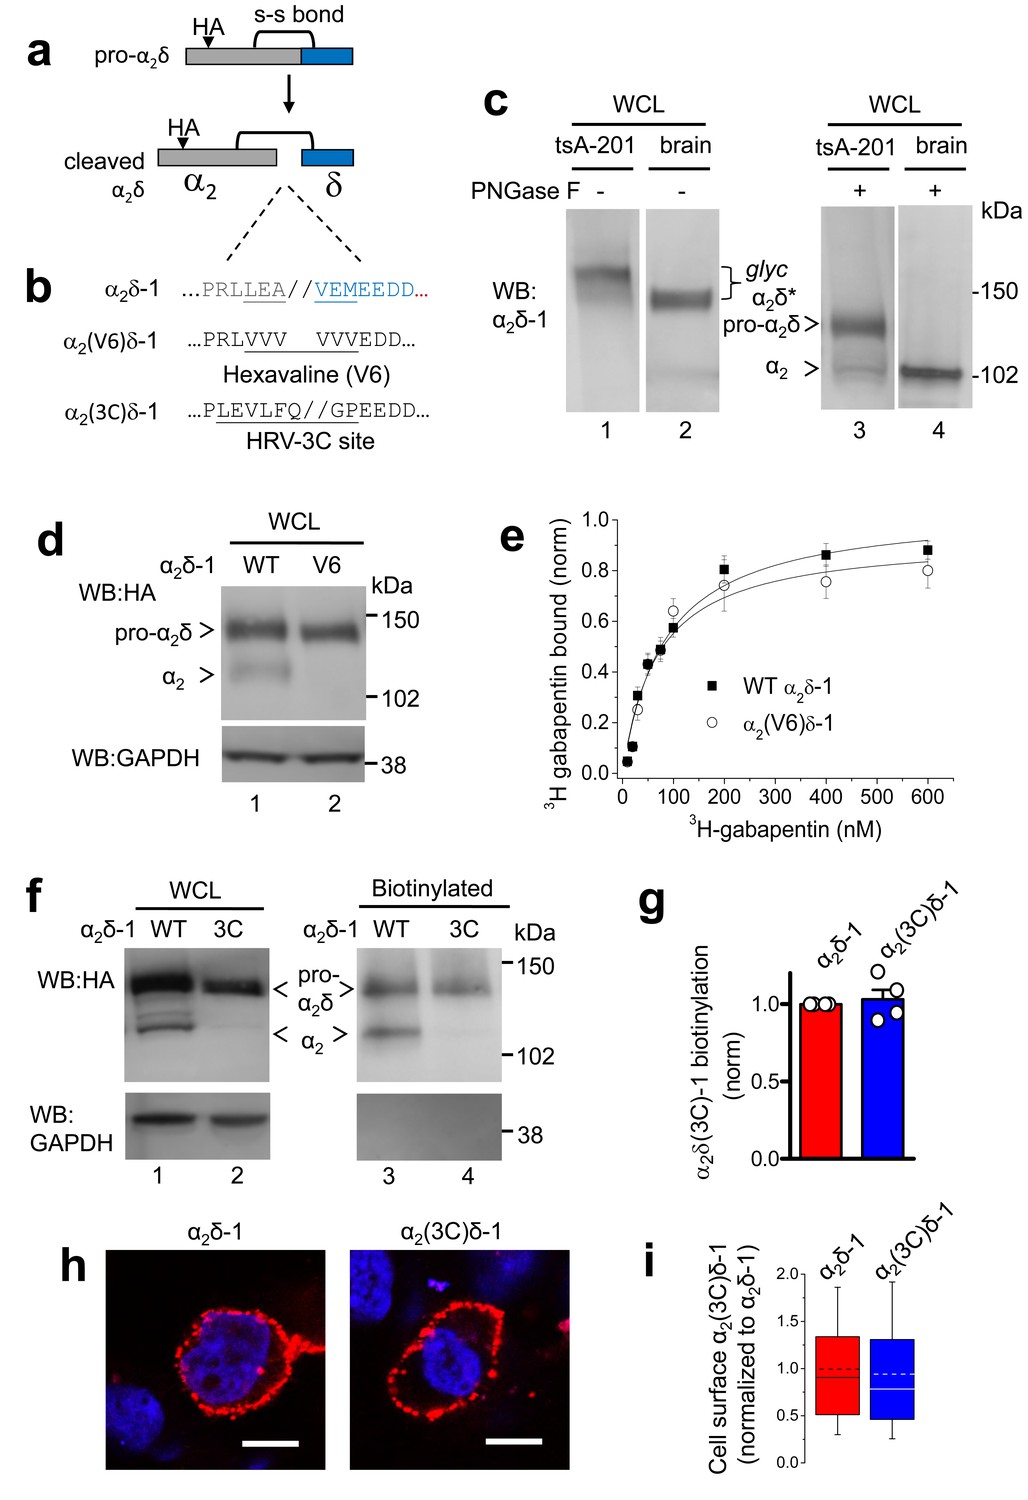
Effect of mutation of α2δ-1 to disrupt the proteolytic cleavage site.
(a) Cartoon of uncleaved pro-α2δ-1 and cleaved α2δ-1, showing the approximate position of inserted HA tag and disulfide bonds between α2 (grey) and δ (blue). (b) Rat α2δ-1 sequence at the identified cleavage-site. The underlined sequence (including LEA//VEM) in α2δ-1 was mutated to a V6 or 3C-protease motif. (c) Comparison of glycosylated (lanes 1, 2) and deglycosylated α2δ-1 (lanes 3, 4), expressed in tsA-201 cells (lanes 1, 3) or present in the brain (lanes 2, 4), showing resolution between pro-α2δ-1 and the cleaved form of α2δ after deglycosylation. α2δ* indicates glycosylated species, and pro-α2δ and α2 indicate deglycosylated proteins. Uncleaved pro-α2δ-1 is observed in transfected cells, but not brain. Proteins visualized with α2-1 Ab. (d) α2δ-1-HA (left) and α2(V6)δ-1-HA (right) expressed in tsA-201 cells; proteins deglycosylated with PNGase-F. Upper panel: HA-blots, lower panel: endogenous GAPDH loading control. (e) Normalized binding curves, using DRM fractions from transfected tsA-201 cells, for 3H-gabapentin binding to WT α2δ-1 (■, n = 4) and α2(V6)δ-1 (○, n = 4). Mean (± SEM) data are fit by hyperbolae with KD of 82.3 and 68.3 nM, respectively. (f) Imunoblot analysis of deglycosylated α2δ-1-HA and α2(3C)δ-1-HA. WCL input (lanes 1, 2) and cell-surface biotinylated material (lanes 3, 4) are shown. Upper panel: HA-blot, lower panel: endogenous GAPDH. (g) Mean ± SEM (and individual data points) of α2(3C)δ-1 (blue) cell surface levels, measured as a proportion of biotinylated: total protein, normalized to control (WT α2δ-1; red), for 4 experiments including that shown in (f). p=0.5057, one sample t test. (h) Cell-surface expression of α2δ-1-HA (left) and α2(3C)δ-1-HA (right) in non-permeabilized tsA-201 cells, using HA Ab (red). Nuclei visualized with DAPI (blue). Scale bars 20 μm. (i) Box and whisker plots for quantification of α2δ-1 on cell-surface, from HA fluorescence, for experiments including (h), for WT α2δ-1 (red) and α2(3C)δ-1 (blue). N = 290 and 317 cells, respectively, from 3 separate transfections, normalized to WT α2δ-1 in each experiment. p=0.259, Student’s t test.
Figure 1—figure supplement 1
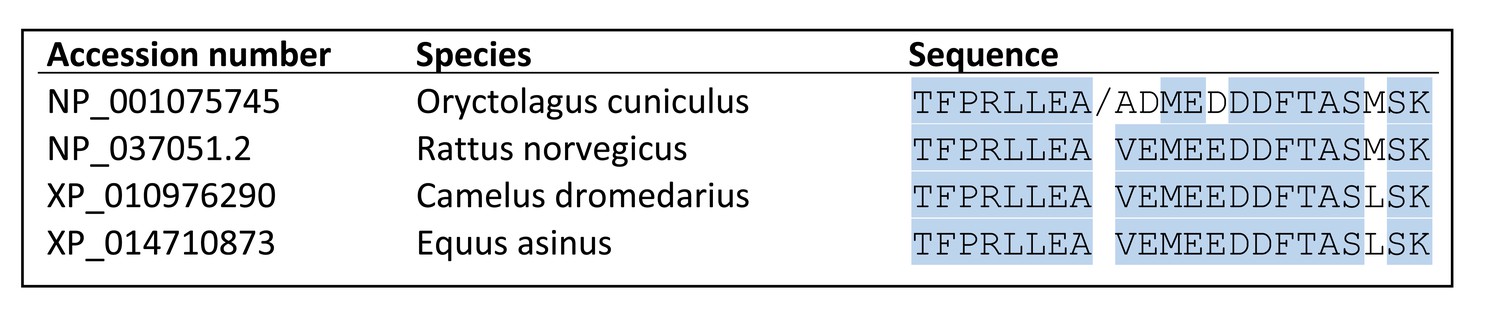
Alignment of the proteolytic cleavage site in α2δ-1, showing species conservation.
/ indicates cleavage site previously identified in rabbit α2δ-1 by N-terminal sequencing of delta Jay et al., 1991; De Jongh et al., 1990.
Figure 1—figure supplement 2
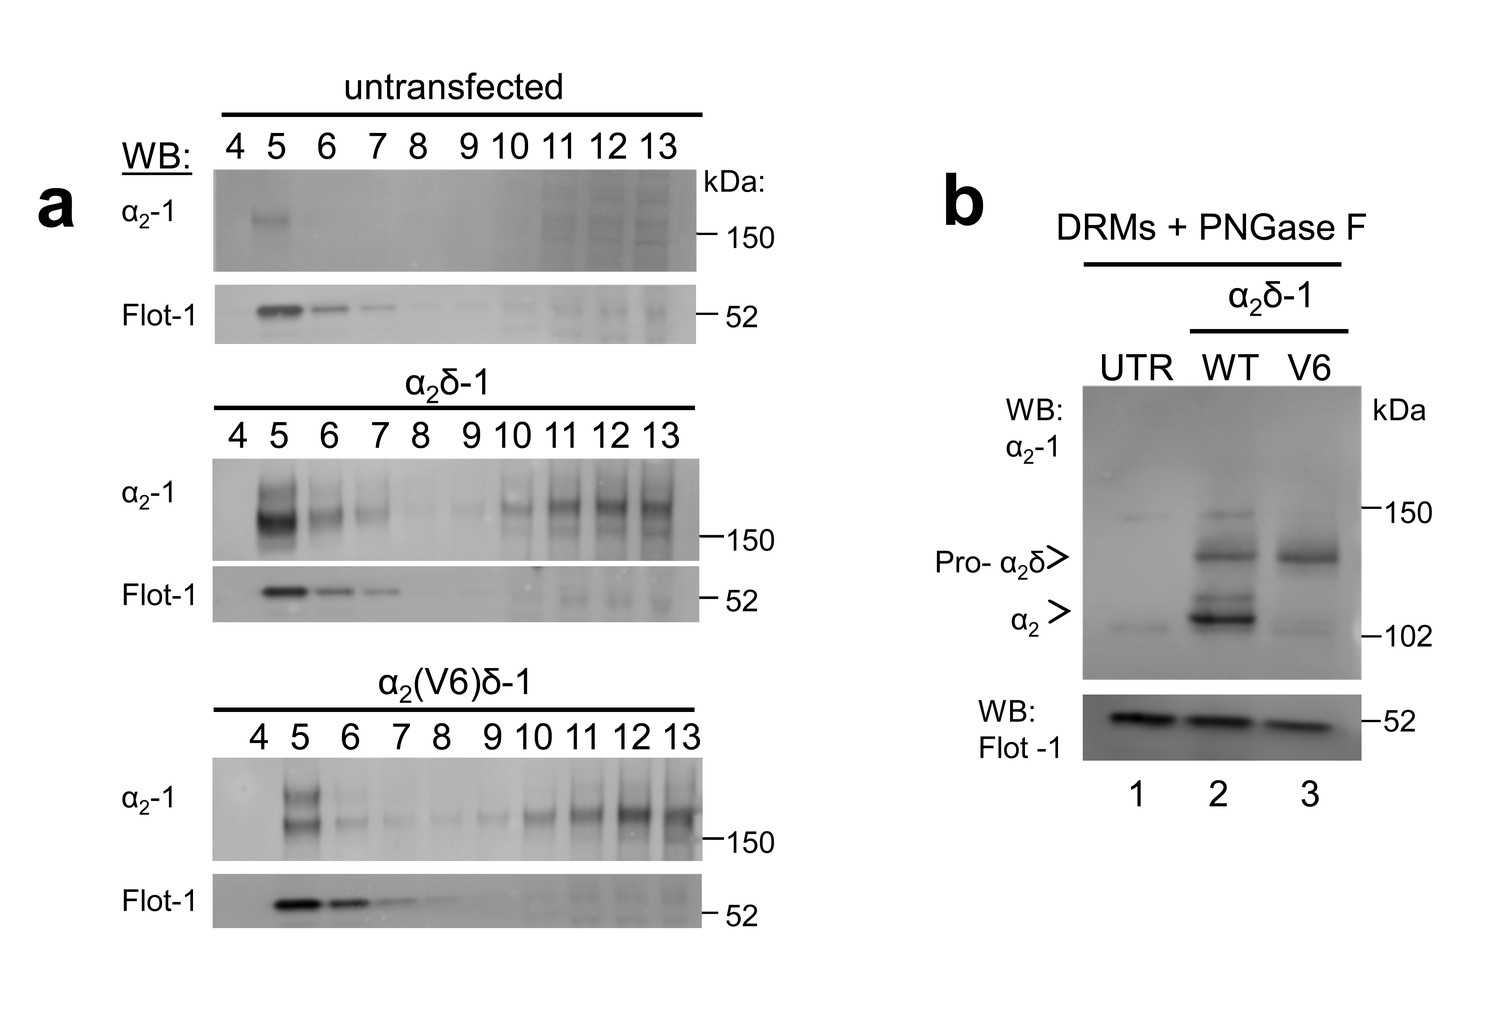
α2(V6)δ-1 is localised in DRMs to a similar extent to α2δ-1.
(a) Sucrose gradient fractions showing a comparison of DRM localisation (lanes 2–4) of α2δ-1 in untransfected (UTR) tsA-201 cells (top panels, showing some endogenous α2δ-1), α2δ-1 transfected cells (middle panels) and α2(V6)δ-1-transfected cells (bottom panels). The upper panel is a Western blot with α2δ-1 mAb, and the lower panel of each set shows Flotillin-1 (Flot-1) a DRM marker. (b) Deglycosylation of the peak DRM fractions from the three conditions shown in A, demonstrating the absence of any proteolytic cleavage of α2(V6)δ-1 (lane 3). The small amount of free α2-1 indicated is identical to that in the UTR cells (lane 1).
Figure 1—figure supplement 3
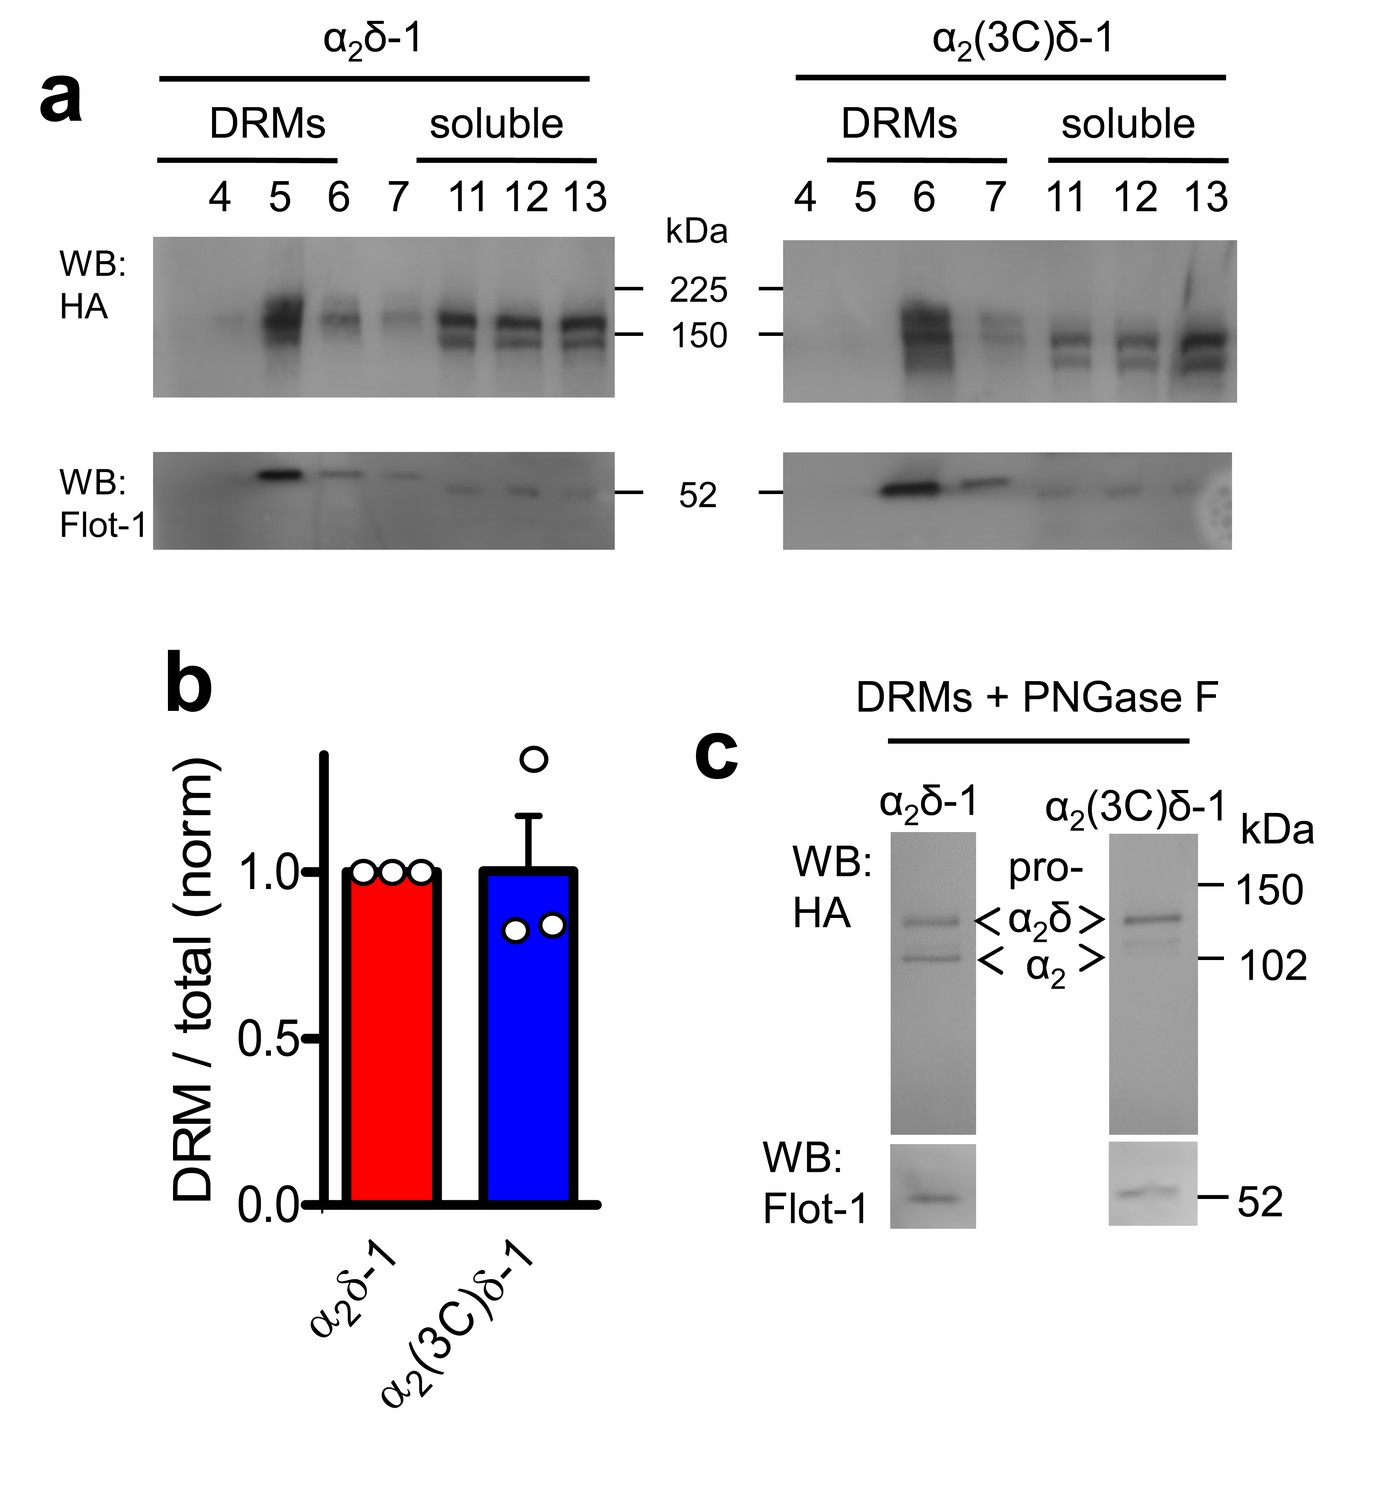
α2(3C)δ-1 is localised in DRMs to a similar extent to α2δ-1.
(a) Comparison of DRM localisation of α2δ-1-HA (left panels) and α2(3C)δ-1-HA (right panels), isolated from transfected tsA-201 cells. Only peak DRM (4–7) and soluble (11–13) fractions are shown. The upper panel is a Western blot with HA Ab, and the lower panels show Flotillin-1 (Flot-1), a DRM marker. (b) Quantification of DRM localization for α2δ-1 (red) and α2(3C)δ-1 (blue), expressed as DRM/total for n = 3 experiments, normalized to the DRM localization for WT α2δ-1 in each experiment. Mean ± SEM and individual data points. (c) Deglycosylation of the peak DRM fractions from the two conditions shown in A, demonstrating the absence of any proteolytic cleavage of α2(3C)δ-1. Flot-1 (lower panel) is a loading control.
Figure 2 with 3 supplements
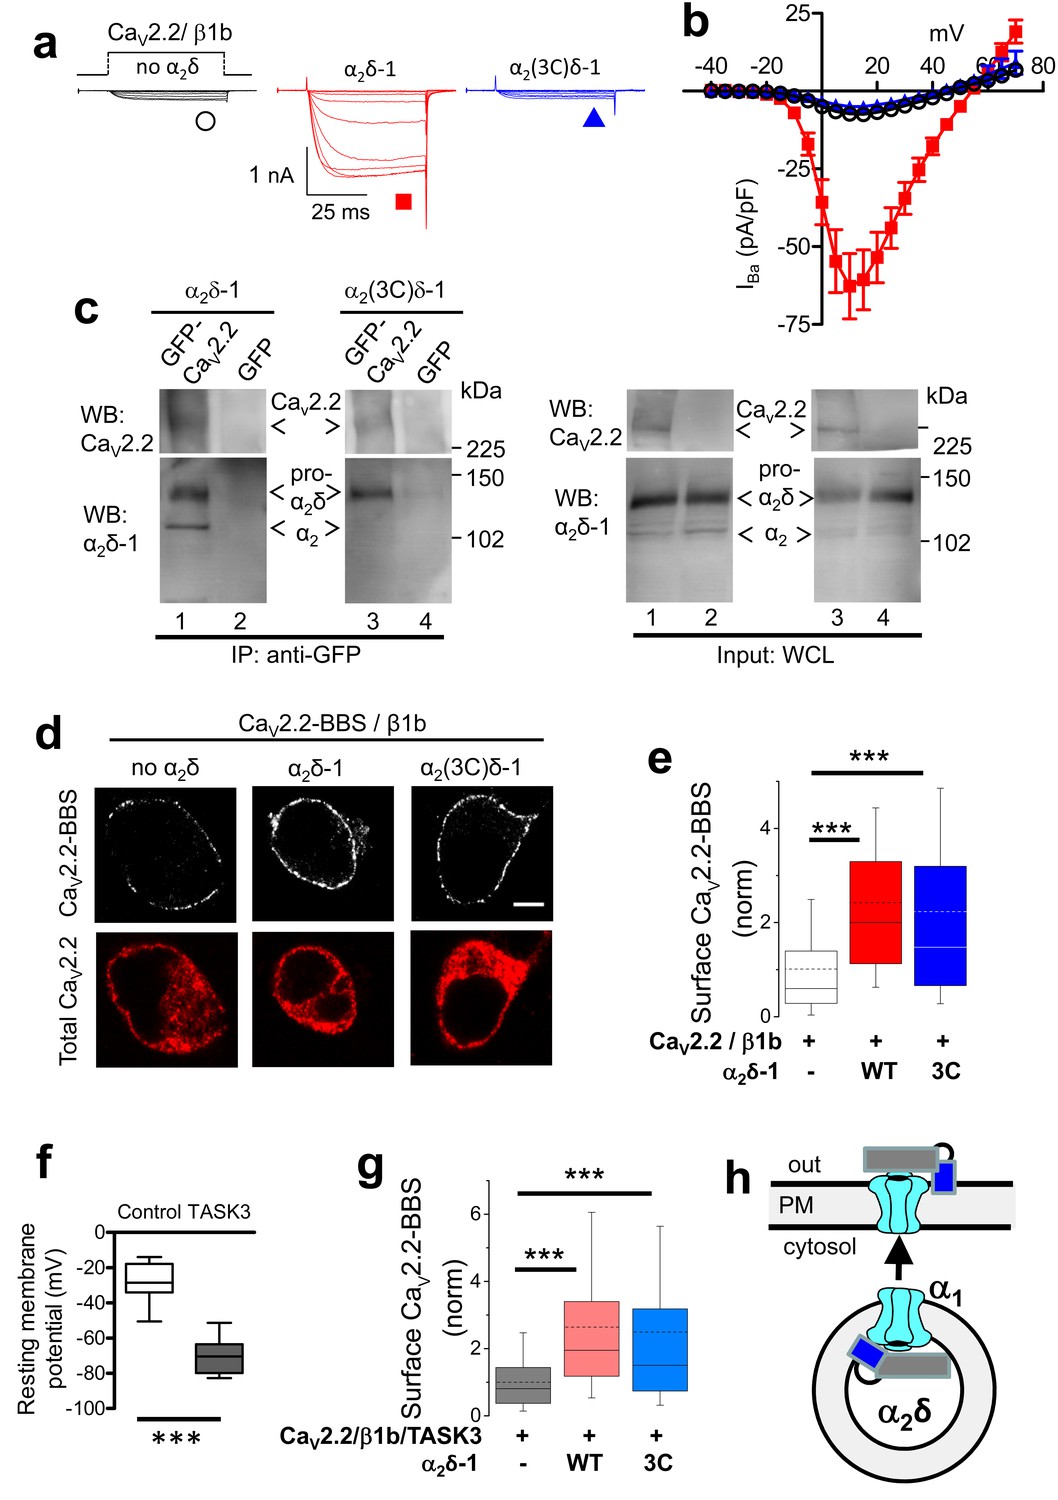
Effect of mutation of α2δ-1 cleavage site to an HRV-3C site on cell-surface expression and functional properties of CaV2.2.
(a) Example traces (−30 to +10 mV in 5 mV steps) for CaV2.2/β1b-GFP and no α2δ (black traces), WT α2δ-1 (red traces) or α2(3C)δ-1 (blue traces). Charge carrier 1 mM Ba2+. Scale bars refer to all traces. (b) Mean (± SEM) IV curves for CaV2.2/β1b-GFP and no α2δ (black open circles, n = 14), WT α2δ-1 (red squares, n = 34) or α2(3C)δ-1 (blue triangles, n = 21). Gmax: 0.25 ± 0.04, 1.91 ± 0.30 and 0.20 ± 0.03 nS/pF, respectively. V50,act: 2.85 ± 0.68, 3.33 ± 0.46 and 3.89 ± 0.53 mV, respectively. (c) tsA-201 cells transfected with GFP-CaV2.2 (lanes 1 and 3) or GFP (lanes 2 and 4), plus β1b, and either WT α2δ-1 (lanes 1 and 2) or α2(3C)δ-1 (lanes 3 and 4). Immunoprecipitation of GFP-CaV2.2 with anti-GFP Ab; WB with CaV2.2 II-III loop Ab (upper panels, lanes 1 and 3) produced co-immunoprecipitation (lower panels) of WT α2δ-1 (lane 1) and α2(3C)δ-1 (lane 3), revealed by α2δ-1 mAb. Right panels: WCL input for lanes 1–4: upper panels, CaV2.2-GFP input; lower panels, α2δ-1 input. All samples deglycosylated. (d) Immunocytochemical detection of cell-surface expression of CaV2.2-BBS, with β1b, and empty vector (left), WT α2δ-1-HA (middle) or α2(3C)δ-1-HA (right) in N2A cells. Upper panel: CaV2.2-BBS cell-surface staining prior to permeabilization (grey-scale); lower panel: total CaV2.2 after permeabilization (II-III loop Ab, red). Scale bar 5 µm. (e) Quantification of CaV2.2-BBS cell-surface expression (box and whisker plots) with empty vector (open bar, n = 206), WT α2δ-1 (red bar, n = 191) or α2(3C)δ-1 (blue bar, n = 181). Statistical differences: ANOVA and Bonferroni post-hoc test; ***p<0.001, compared to no α2δ. (f) Resting membrane potential of control N2A cells (white bar, n = 16) and following expression of TASK3 (gray bar, n = 12). Box and whisker plots; ***p<0.0001, Student’s t test. (g) Quantification of CaV2.2-BBS cell-surface expression in N2A cells co-expressing TASK3, with empty vector (gray bar, n = 70), WT α2δ-1 (pink bar, n = 73) or α2(3C)δ-1 (pale blue bar, n = 81). Box and whisker plots, statistical differences: ANOVA and Bonferroni post-hoc test, compared to no α2δ; ***p<0.001. (h) Cartoon showing the ability of ‘latent’ CaV2.2 (cyan) plus α2(3C)δ-1 (grey α2, blue δ), to traffic to the plasma membrane (PM).
Figure 2—figure supplement 1
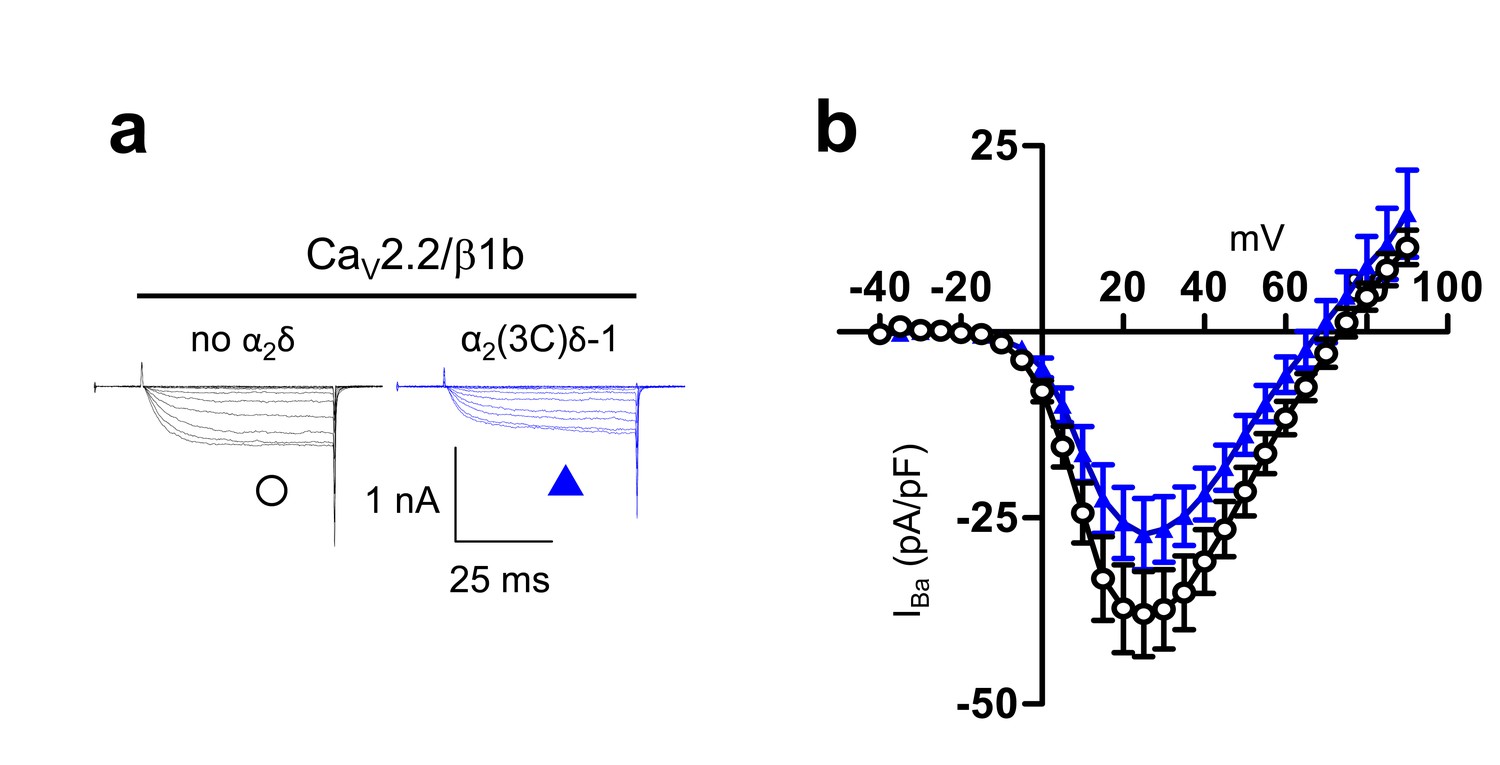
Examination of effect of α2(3C)δ-1 on CaV2.2/β1b calcium channel currents in tsA-201 cells.
These experiments were performed using 10 mM Ba2+ to amplify any differences in current amplitude between the two conditions examined. (a) Example traces (−25 to +25 mV steps) for CaV2.2/β1b-GFP and either no α2δ (black traces) or α2(3C)δ-1 (blue traces). The scale bars refer to all traces. (b) Mean (± SEM) IV curves for experiments including those in (a), for CaV2.2/β1b-GFP and either no α2δ (black open circles, n = 10) or α2(3C)δ-1-HA (blue triangles, n = 14). Peak IBa at +25 mV was −37.9 ± 5.7 pA/pF and −27.2 ± 4.8 pA/pF, respectively. Gmax values were 0.91 ± 0.19 and 0.76 ± 0.12 nS/pF, respectively. V50,act values were 13.1 ± 1.6, and 14.9 ± 1.0 mV, respectively.
Figure 2—figure supplement 2
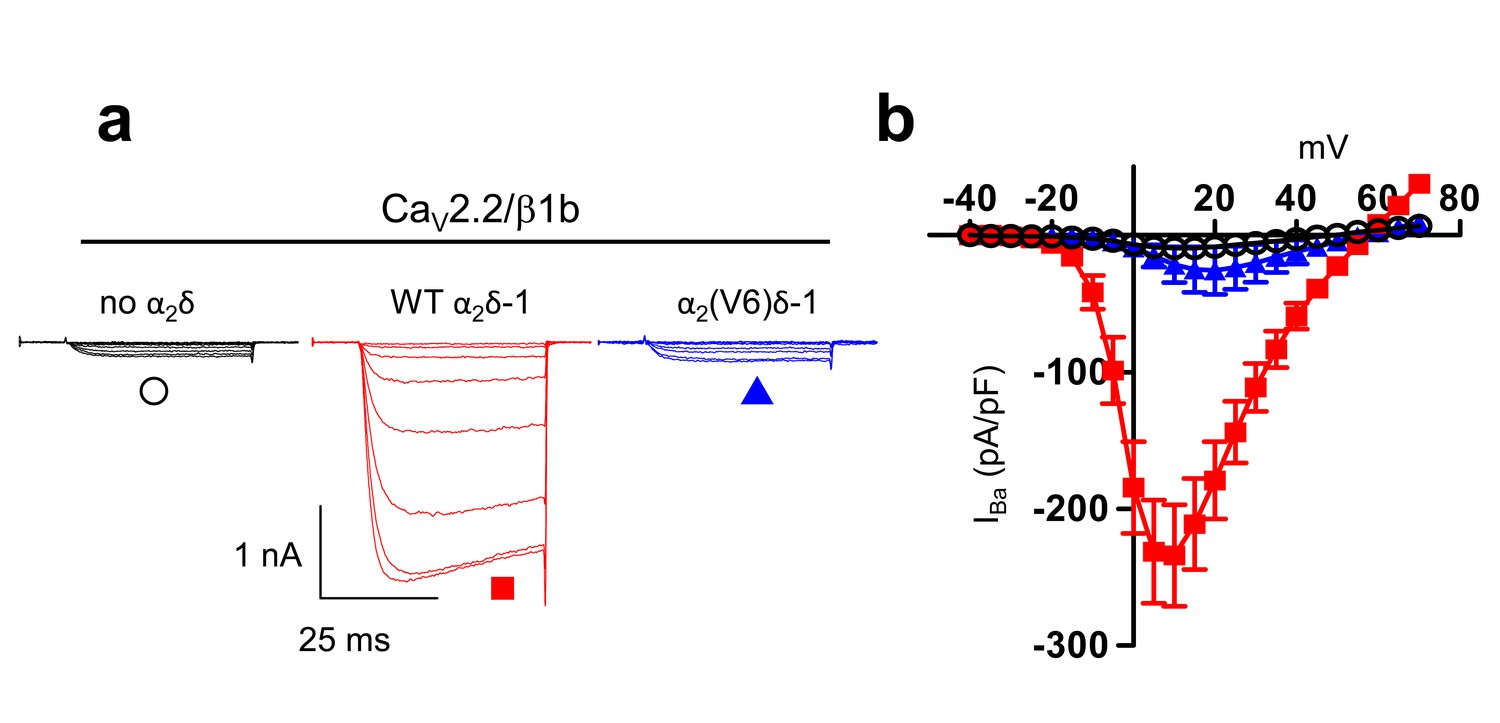
Examination of effect of α2(V6)δ-1 on CaV2.2/β1b calcium channel currents in tsA-201 cells.
(a) Example traces (−25 to +10 mV in 5 mV steps) for CaV2.2/β1b-GFP and either no α2δ (black traces), α2δ-1 (red traces) or α2(V6)δ-1 (blue traces). The scale bars refer to all traces. Charge carrier 1 mM Ba2+ (b) Mean (± SEM) IV curves for experiments including those in (c), for CaV2.2/β1b-GFP and either no α2δ (black open circles, n = 8), WT α2δ-1 (red squares, n = 7) or α2(V6)δ-1 (blue triangles, n = 8). Gmax values were 0.32 ± 0.04, 6.72 ± 1.09 and 0.83 ± 0.52 nS/pF, respectively. V50, act values were 3.6 ± 2.2,,–0.7 ± 1.1 and 5.8 ± 1.1 mV, respectively.
Figure 2—figure supplement 3
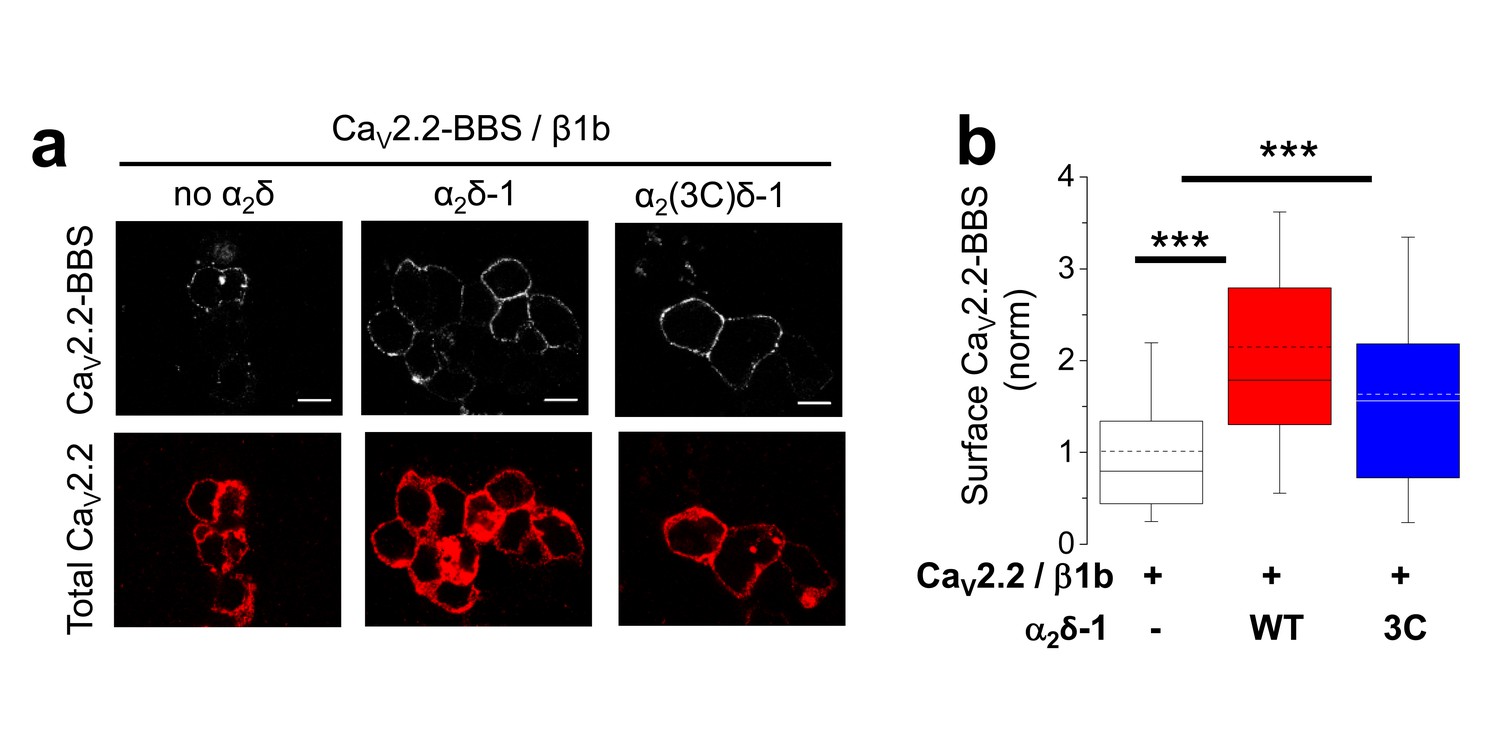
Examination of effect of α2(3C)δ-1 on CaV2.2/β1b cell surface expression in tsA-201 cells.
(a) Immunocytochemical detection of cell-surface expression of CaV2.2-BBS, with β1b, and empty vector (left), WT α2δ-1-HA (middle) or α2(3C)δ-1-HA (right) in tsA-201 cells. Upper panel: CaV2.2-BBS cell-surface staining prior to permeabilization (grey-scale); lower panel: total CaV2.2 after permeabilization (II-III loop Ab, red). Scale bar 5 µm. (b) Quantification of CaV2.2-BBS cell-surface expression in tsA-201 cells (box and 10%–90% whisker plots) with empty vector (open bar, n = 191), WT α2δ-1 (red bar, n = 175) or α2(3C)δ-1 (blue bar, n = 177). N = 3 experiments. Statistical differences: ANOVA and Bonferroni post-hoc test; ***p<0.001, compared to no α2δ.
Figure 3 with 2 supplements
Effect of proteolytic cleavage of α2δ-1 containing an HRV-3C cleavage site on cell-surface expression and functional properties of CaV2.2.
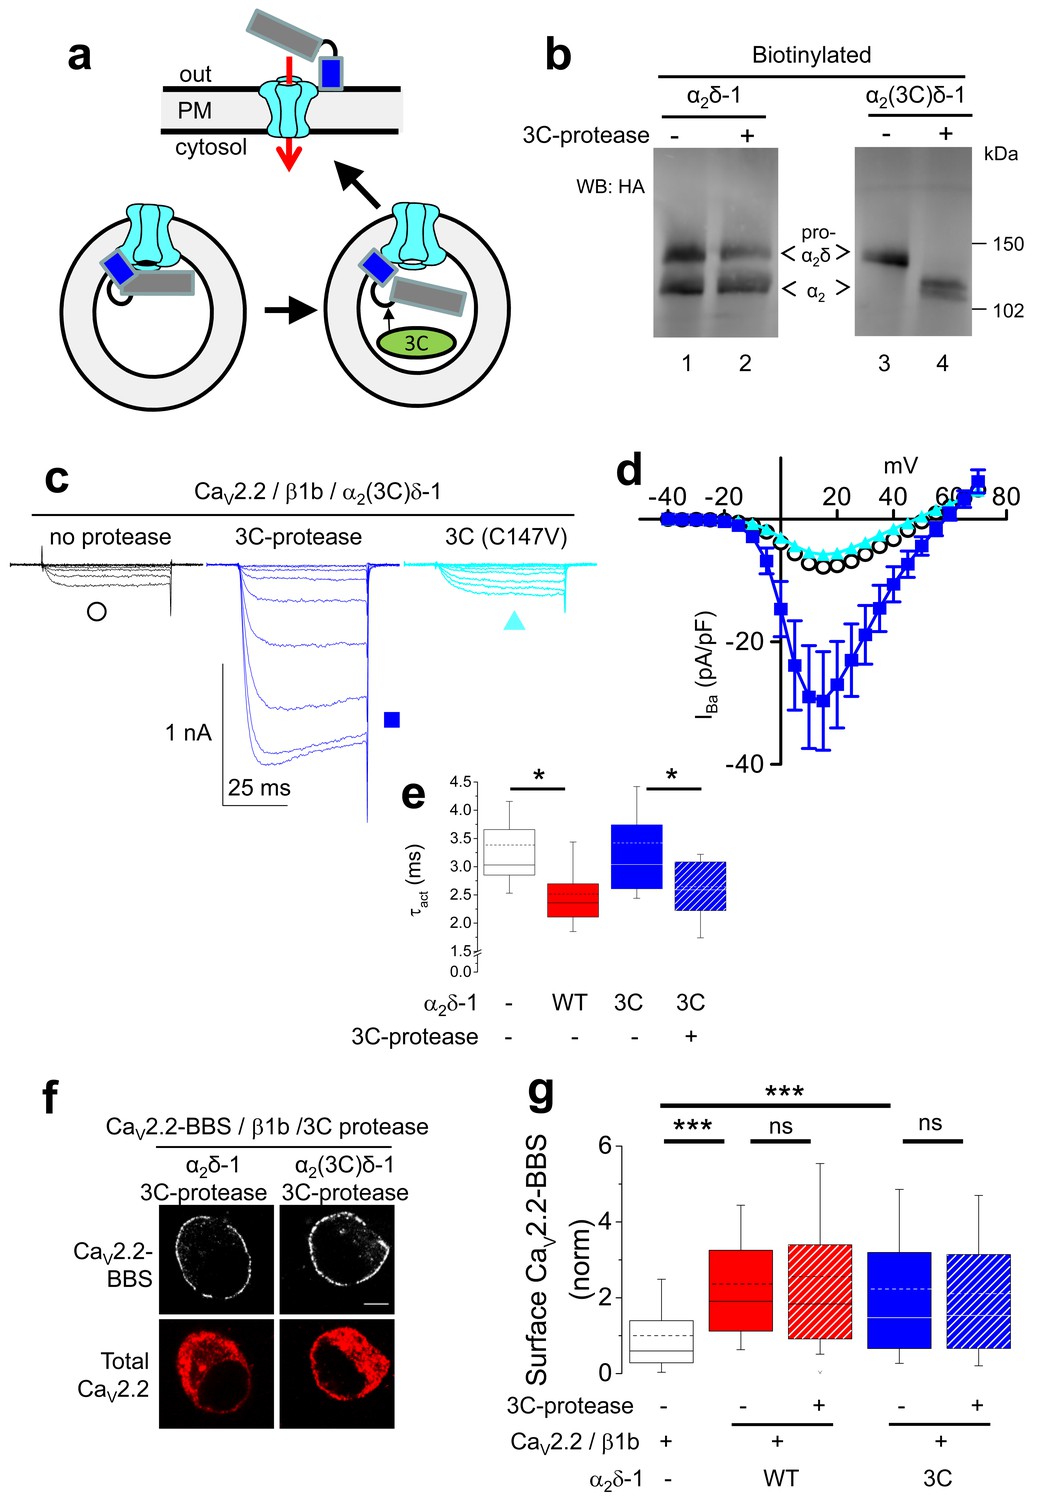
(a) Cartoon showing intracellular cleavage by 3C-protease (green) of α2(3C)δ-1 (gray/blue) associated with CaV2.2 (cyan). (b) Deglycosylated, cell-surface biotinylated fractions for α2δ-1-HA (lanes 1 and 2) and α2(3C)δ-1-HA (lanes 3 and 4), expressed in tsA-201 cells without (lanes 1 and 3) or with (lanes 2 and 4) 3C-protease. Representative of n = 4 experiments. WCL in Figure 3—figure supplement 1 (c) Example traces (−30 to +10 mV steps) for CaV2.2/β1b-GFP/α2(3C)δ-1-HA and no protease (black traces), 3C-protease (blue traces) or inactive mutant 3C-(C147V) protease (cyan traces). Charge carrier 1 mM Ba2+. Scale bars refer to all traces. (d) Mean (± SEM) IV curves for CaV2.2/β1b-GFP/α2(3C)δ-1-HA and no protease (black open circles, n = 26), 3C-protease (blue squares, n = 22) or 3C-(C147V)-protease (cyan triangles, n = 23). Gmax: 0.26 ± 0.04, 0.90 ± 0.22 and 0.22 ± 0.03 nS/pF, respectively. Gmax values in the presence of the active 3C-protease were greater than in the absence of protease or presence of 3C-(C147V)-protease (Kruskal-Wallis test with Dunn’s multiple comparison post-hoc test, p<0.05). V50,act: 6.05 ± 0.82, 5.18 ± 0.74 and 6.20 ± 1.20 mV, respectively. (e) Time constant of activation (τact) for IBa at +10 mV for CaV2.2/β1b-GFP with no α2δ-1 (open bar, n = 14), WT α2δ-1-HA (red bar, n = 25), α2(3C)δ-1-HA (blue bar, n = 21) or α2(3C)δ-1-HA + 3C-protease (blue hatched bar, n = 17). Box and whisker plots. Statistical significance determined by ANOVA and Bonferroni’s post-hoc test (*p<0.05). (f) Immunocytochemical detection of cell-surface CaV2.2-BBS, plus β1b, and α2δ-1-HA (left panel) or α2(3C)δ-1-HA (right panel), with 3C-protease. Upper panel: CaV2.2-BBS cell-surface staining (grey-scale), lower panel total CaV2.2 (II-III loop staining). Scale bar 5 µm. (g) Lack of effect of 3C-protease (hatched bars) on cell-surface expression of CaV2.2-BBS following expression of CaV2.2-BBS/β1b in N2A cells, with no α2δ (open bar, n = 206), WT α2δ-1 (red bar, n = 212), WT α2δ-1 and 3C-protease (red hatched bar, n = 192), α2(3C)δ-1 (blue bar, n = 181) or α2(3C)δ-1 and 3C-protease (blue hatched bar, n = 200). Box and whisker plots. Statistical differences determined by ANOVA and Bonferroni’s post-hoc test (***p<0.001; ns: p>0.05).
Figure 3—figure supplement 1
The effect of 3C-protease on α2δ-1 and α2(3C)δ-1 expressed in tsA-201 cells.
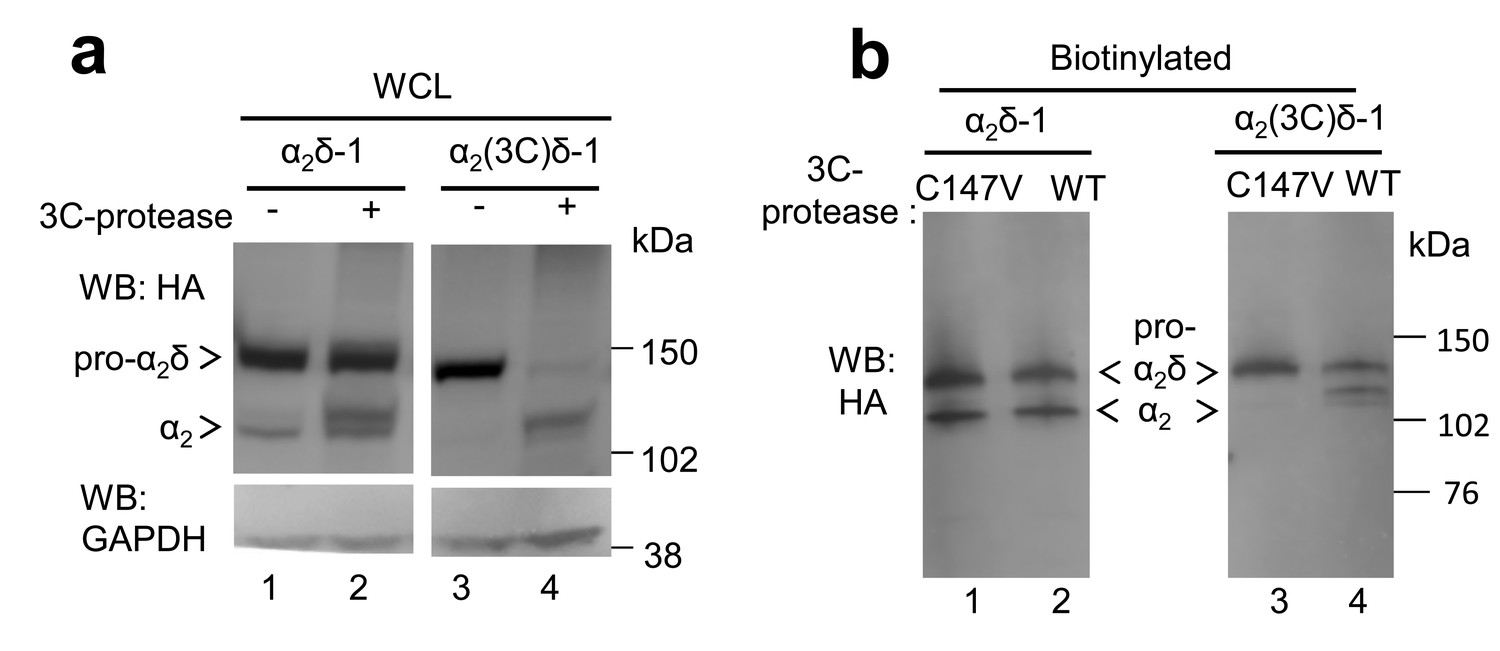
(a) Deglycosylated WCL for the experiment shown in Figure 3b; α2δ-1-HA (lanes 1 and 2) and α2(3C)δ-1-HA (lanes 3 and 4), expressed in tsA-201 cells, without (lanes 1 and 3) or with (lanes 2 and 4) 3C-protease. Upper panel shows HA blot, lower panel: shows GAPDH blot loading control. (b) Cell surface biotinylation for α2δ-1-HA (lanes 1 and 2) and α2(3C)δ-1-HA (lanes 3 and 4), expressed in tsA-201 cells with inactive C147V (lanes 1 and 3) or (lanes 2 and 4) 3C-protease. Proteins were deglycosylated. WB was performed with HA Ab.
Figure 3—figure supplement 2
Lack of effect of 3C-protease on CaV2.2/β1b currents expressed in tsA-201 cells.
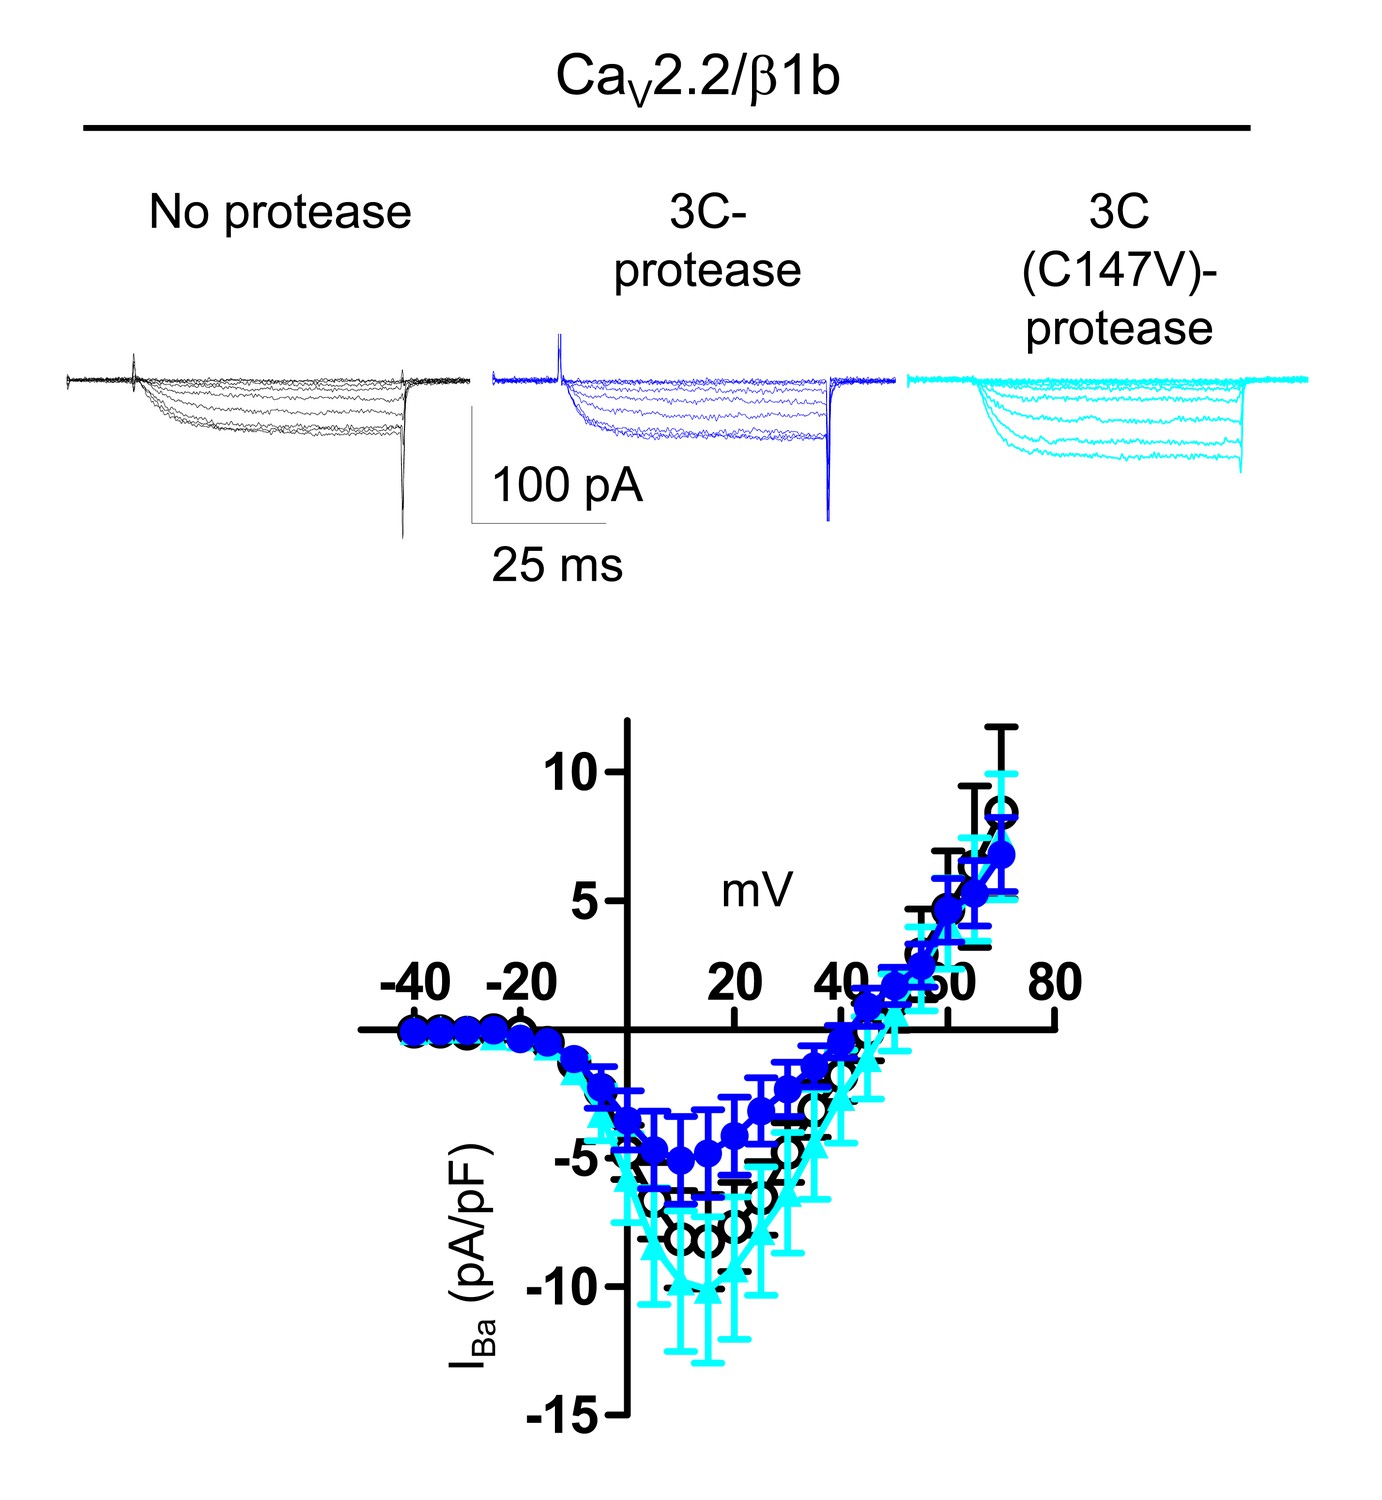
Top: example traces (−25 to +15 mV steps) for CaV2.2/β1b-GFP and either no protease (black traces), WT 3C-protease (blue traces) or inactive mutant 3C-protease (C147V, cyan traces). The charge carrier was 1 mM Ba2+. The scale bars refer to all traces. Bottom: Mean (± SEM) IV curves for experiments including those shown, for CaV2.2/β1b-GFP and either no protease (black open circles, n = 9), WT 3C-protease (blue circles, n = 11) or inactive mutant 3C-protease (C147V) (cyan triangles, n = 9). Peak IBa at +15 mV was −8.2 ± 1.8 pA/pF, −4.8 ± 1.7 pA/pF and −10.1 ± 2.8 pA/pF, respectively. Gmax values were 0.32 ± 0.08, 0.20 ± 0.06 and 0.36 ± 0.09 nS/pF, respectively. V50, act values were 4.1 ± 0.7, 1.2 ± 1.2 and 3.8 ± 1.0 mV, respectively.
Figure 4 with 3 supplements
Effect of proteolytic cleavage of α2δ-3 containing an HRV-3C cleavage site on cell-surface expression and functional properties of CaV2.2.
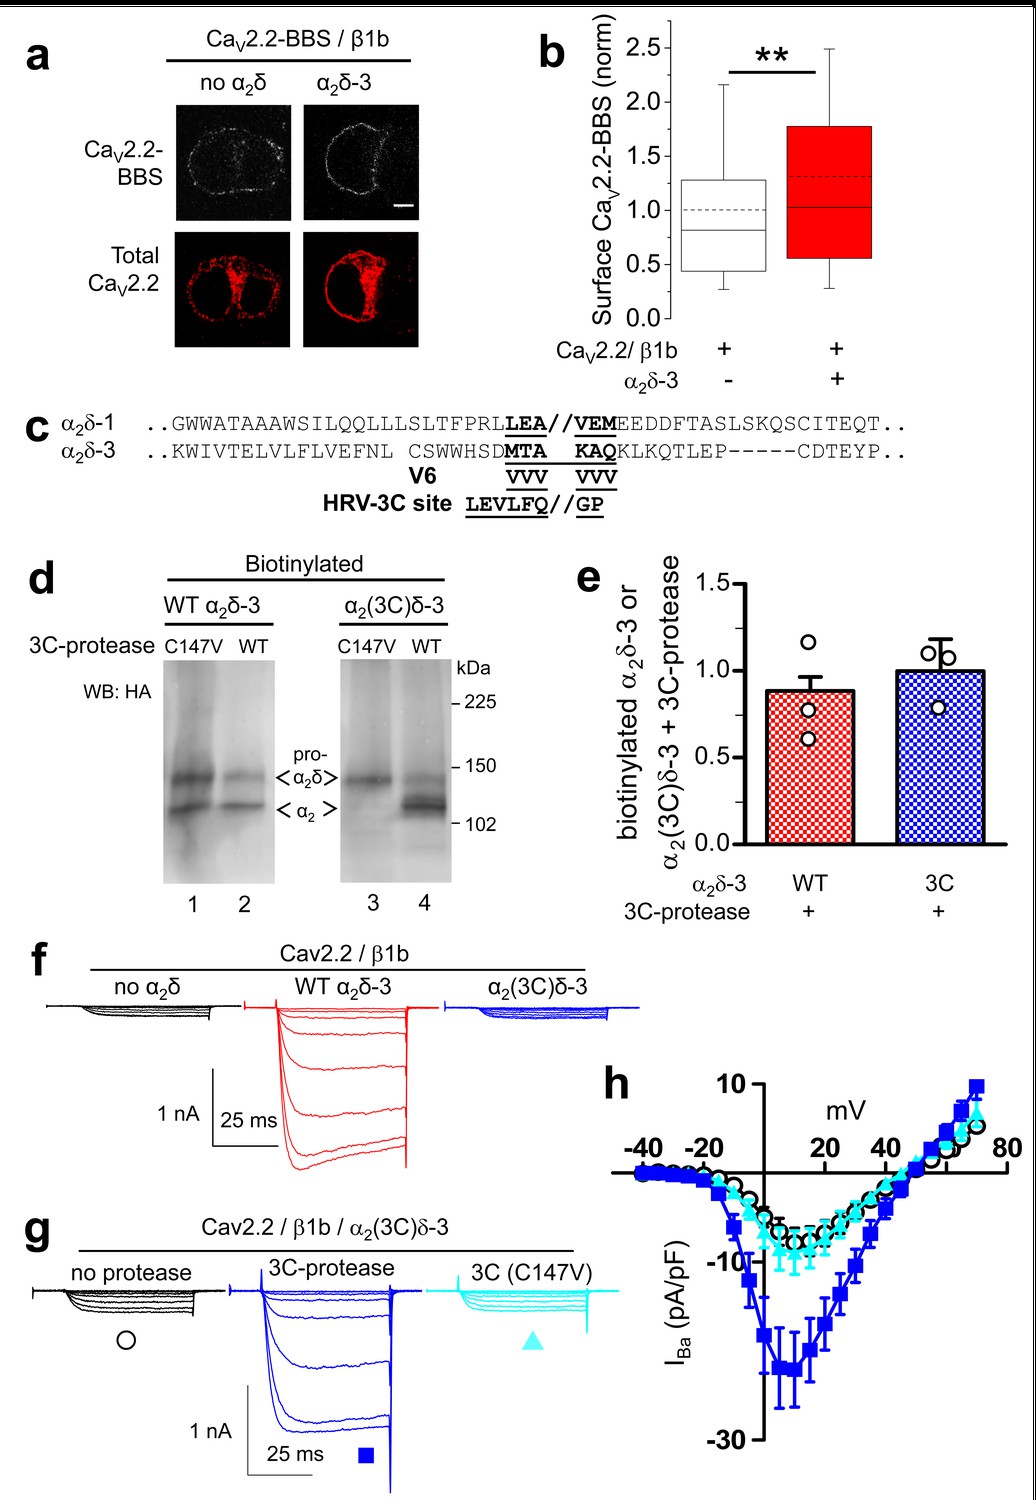
(a) Images showing cell-surface CaV2.2-BBS (upper row, white), and total CaV2.2 (II-III loop Ab, lower row, red), for CaV2.2-BBS/β1b in N2A cells, with empty vector (panel 1) or α2δ-3-HA (panel 2). Scale bar 5 µm. (b) Quantification (box and whisker plots) of effect α2δ-3 on cell-surface CaV2.2-BBS following expression of CaV2.2-BBS/β1b with empty vector (open bar, n = 188) or WT α2δ-3 (red bar, n = 188). Statistical difference determined by Student’s t test, **p=0.0028. (c) Alignment of α2δ-3 sequence around the predicted cleavage site with α2δ-1, showing weak homology. Underlined sequence (MTAKAQ) mutated to V6 or HRV-3C cleavage motif. (d) α2δ-3-HA (lanes 1, 2) and α2(3C)δ-3-HA (lanes 3, 4) expressed in tsA-201 cells, with either inactive (C147V, lanes 1, 3) or WT 3C-protease (WT, lanes 2, 4), cell-surface biotinylated and deglycosylated. Full WB and corresponding WCL in Figure 4—figure supplement 3 (e) Quantification of cell-surface expression of WT α2δ-3-HA (red speckled bar) and α2(3C)δ-3-HA (blue speckled bar), with 3C-protease, normalized relative to inactive 3C-protease (C147V) for n = 3 experiments. Data are mean (± SEM) and individual data points: p=0.4721 for WT α2δ-3-HA and p=0.9513 for α2(3C)δ-3 (1 sample t-test compared to respective control). (f) Example traces (−30 to +5 mV steps) for CaV2.2/β1b-GFP with no α2δ (black traces), WT α2δ-3 (red traces) or α2(3C)δ-3 (blue traces). Gmax: 0.24 ± 0.03, 1.46 ± 0.22 and 0.21 ± 0.03 nS/pF respectively. V50,act: 0.91 ± 1.015, 1.01 ± 0.85 and 4.03 ± 1.04 mV, respectively. (g) Example traces (−30 to +10 mV steps) for CaV2.2/β1b-GFP/α2(3C)δ-3 and no protease (black traces), 3C-protease (blue traces) or inactive 3C-protease (C147V) (cyan traces). For (f) and (g), charge carrier 1 mM Ba2+, scale bars refer to all traces. (h) Mean (± SEM) IV curves for CaV2.2/β1b-GFP/α2(3C)δ-3 without protease (black open circles, n = 28), with 3C-protease (blue squares, n = 29) or inactive 3C-(C147V)-protease (cyan triangles, n = 24). Gmax: 0.28 ± 0.05, 0.70 ± 0.11 and 0.30 ± 0.08 nS/pF, respectively. Gmax for 3C-protease condition larger than other two conditions (Kruskal-Wallis test with Dunn’s post-hoc test, p<0.05). V50, act: 4.0 ± 0.7, 0.3 ± 0.7 and 1.5 ± 0.6 mV, respectively.
Figure 4—figure supplement 1
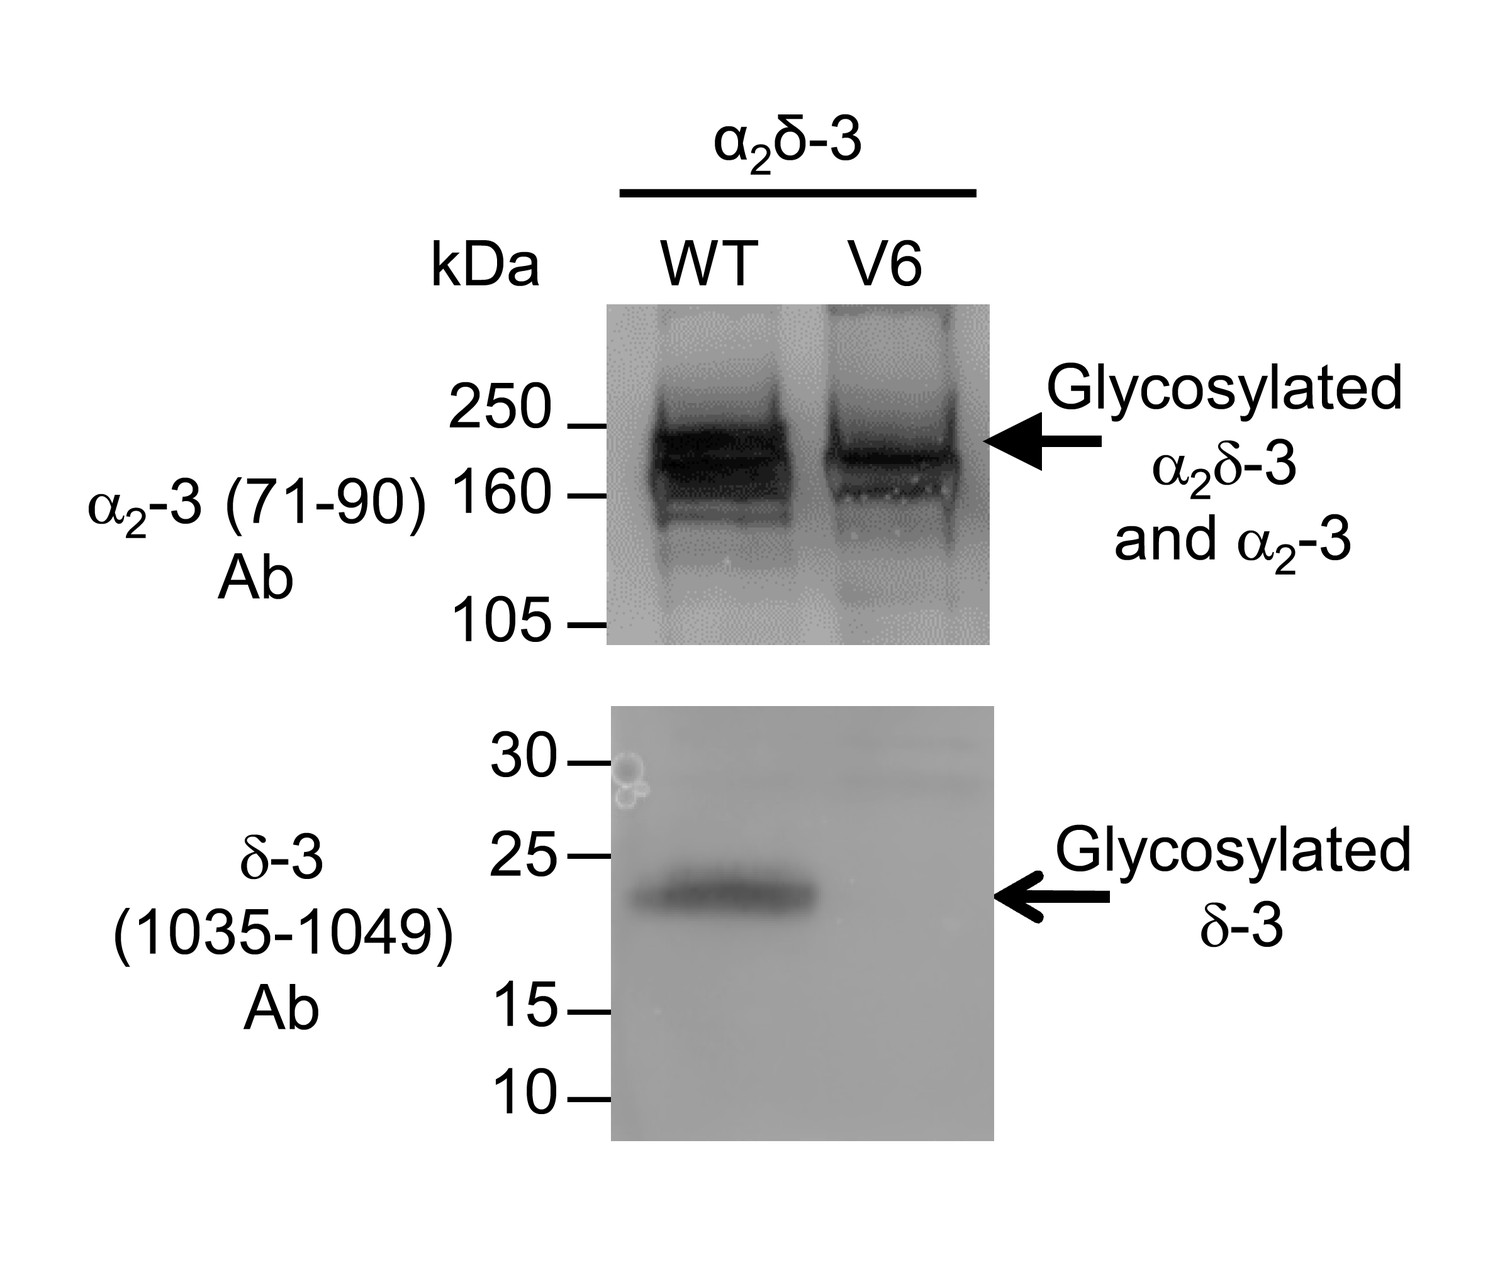
Lack of cleavage of α2(V6)δ-3.
The expression of α2δ-3 compared to α2(V6)δ-3. The constructs were expressed transiently in tsA-201 cells; peak lipid raft fractions were taken for western blotting. There was a complete loss of free δ-3 (lower panel) in α2(V6)δ-3 (lane 2), compared to WT α2δ-3 (lane 1). α2δ-3 is shown in the upper panel.
Figure 4—figure supplement 2
Effect of 3C-protease on expression and cleavage of α2(3C)δ-3.
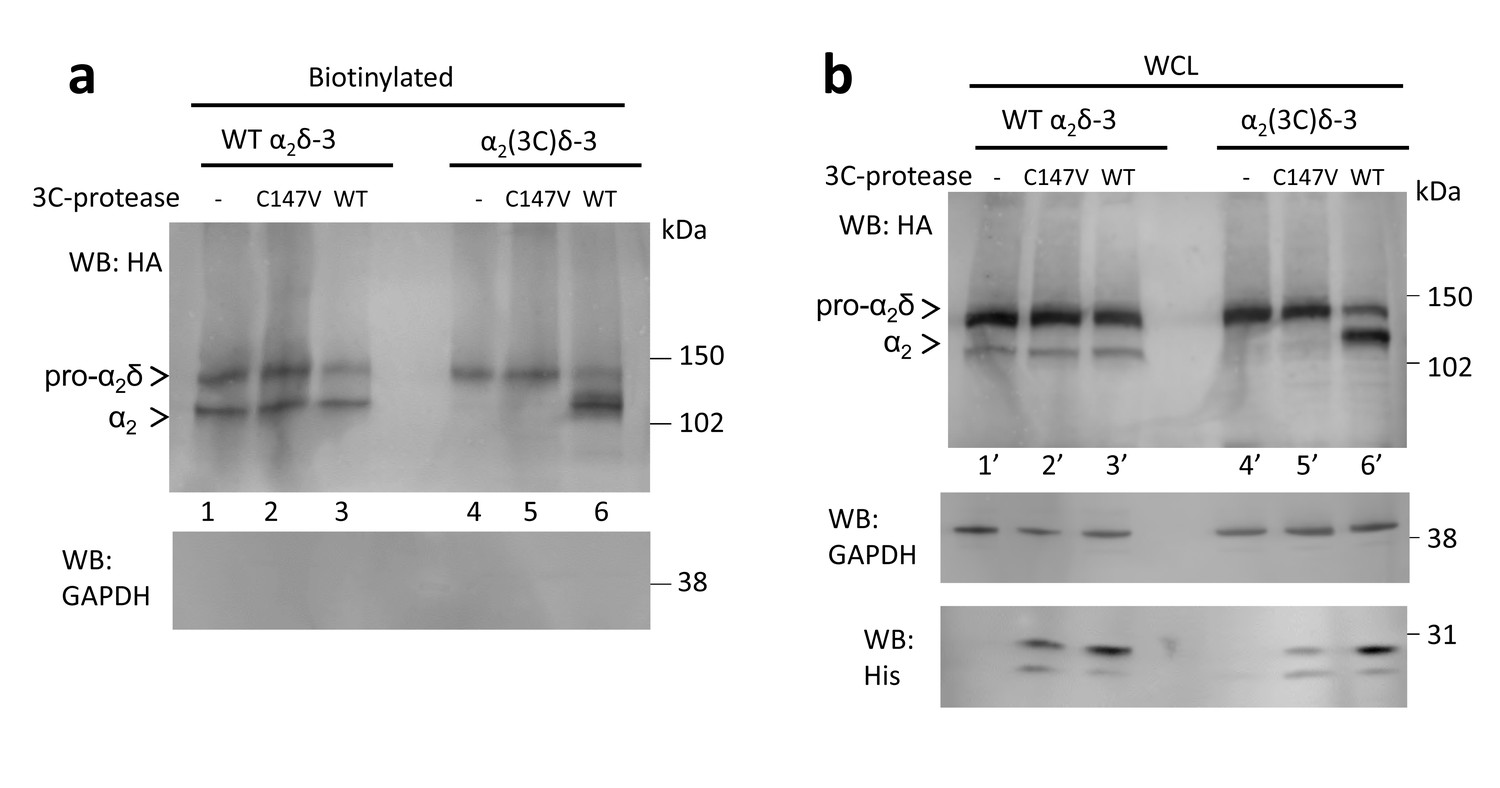
Full data from experiment shown in Figure 4d. WT α2δ-3-HA (lanes 1, 2 and 3) and α2(3C)δ-3-HA (lanes 4, 5 and 6) were expressed in tsA-201 cells, either without or with inactive (C147V, lanes 2 and 5) or WT 3C-protease (WT, lanes 3 and 6), subjected to cell surface biotinylation and streptavidin pull-down. Proteins were deglycosylated with PNGase-F. (a) shows biotinylated proteins and (b) shows WCL. The upper blot with HA Ab, shows that WT, but not inactive mutant, 3C-protease cleaved α2(3C)δ-3 (lane 6). The lower blot shows GAPDH, indicating that no intracellular proteins were biotinylated, and the bottom blot in (b) shows expression of the His-tagged 3C-proteases.
Figure 4—figure supplement 3

Lack of effect of purified 3C-protease on expression and cleavage of α2(3C)δ-3.
Incubation of cells expressing α2(3C)δ-3-HA with 3C-protease enzyme did not result in cleavage on the cell surface. Cell surface biotinylated deglycosylated α2(3C)δ-3-HA, from cells incubated without (left) or with (right) 3C-protease.
Figure 5 with 1 supplement
Effect of thrombin on the properties and function of α2δ-3 containing a thrombin proteolytic cleavage site.
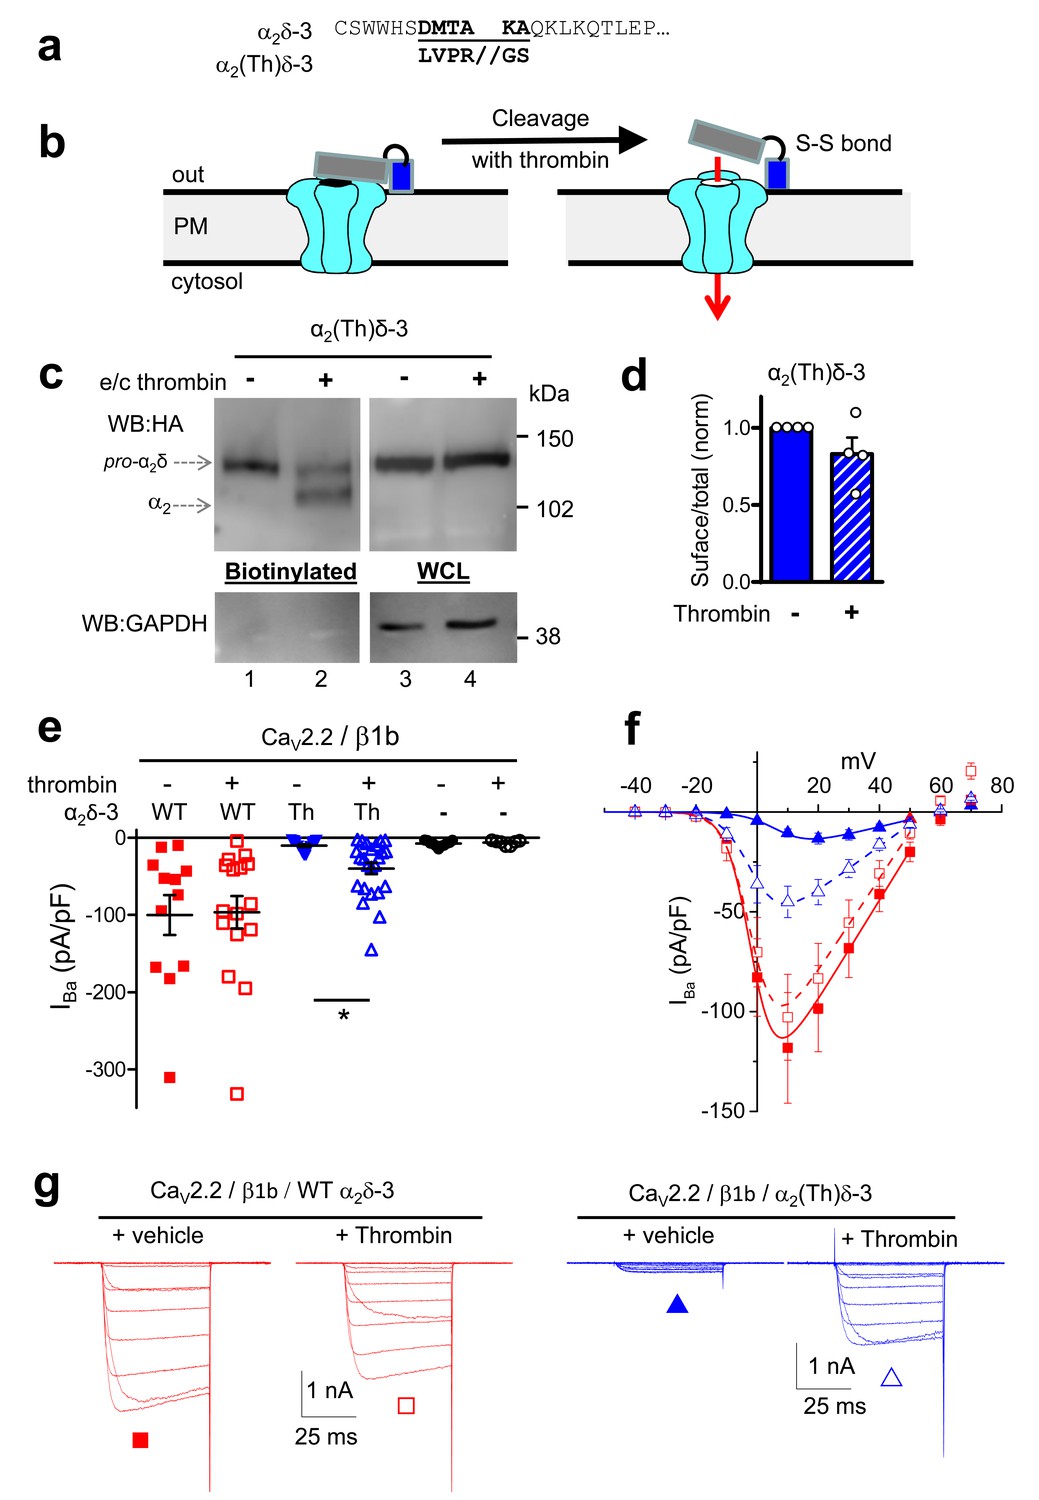
(a) Sequence at α2δ-3 cleavage site mutated to a thrombin cleavage site. (b) Cartoon of thrombin cleavage of α2δ-3 on cell-surface. (c) Cell-surface biotinylation (left panel) shows efficient cleavage of cell-surface α2(Th)δ-3-HA (lane 2), with no effect on total α2(Th)δ-3-HA in WCL (right panel, lane 4). Samples were deglycosylated prior to loading. (d) Quantification of cell surface biotinylation experiments such as those shown in (c), indicating that thrombin does not decrease the amount of α2(Th)δ-3-HA on the cell surface (hatched blue bar), normalized to vehicle application in each experiment (solid blue bar). Mean (± SEM) and individual data points for n = 4; p=0.2105, 1 sample t test. (e) Mean (± SEM) and individual data points of peak IBa at +10 mV, for CaV2.2/β1b with WT α2δ-3 (red squares), α2(Th)δ-3 (blue triangles) or no α2δ (black circles) and either no protease (closed symbols), or 60 min thrombin incubation (open symbols). The charge carrier was 2 mM Ba2+. For data without or with thrombin, respectively, n = 12, 16 for WT α2δ-3; 15, 24 for α2(Th)δ-3 and 11, 7 without α2δ, from at least 3 independent transfections. Statistical difference between thrombin and vehicle determined by Kruskal-Wallis ANOVA and Dunn’s multiple comparison post-hoc test, *p<0.05. (f) Mean (± SEM) full IV curves for the same conditions as in (e) (excluding the no α2δ data), fitted with a modified Boltzmann equation to +50 mV. Gmax values (nS/pF) were 2.80 ± 0.61 (WT α2δ-3; n = 10), 2.60 ± 0.55 (WT α2δ-3 plus thrombin, n = 15), 0.43 ± 0.08 (α2(Th)δ-3; n = 14), 1.26 ± 0.21 (α2(Th)δ-3 plus thrombin, n = 21). V50,act values (mV) were +0.44 ± 1.71 (WT α2δ-3), + 0.55 ± 1.28 (WT α2δ-3 plus thrombin), +9.34 ± 0.08 (α2(Th)δ-3), +0.87 ± 1.38 (α2(Th)δ-3 plus thrombin). (g) Example Ba2+ currents (from −50 to +60 mV) for the four conditions shown in (f).
Figure 5—figure supplement 1
Controls for cleavage of α2(Th)δ-3 by thrombin.
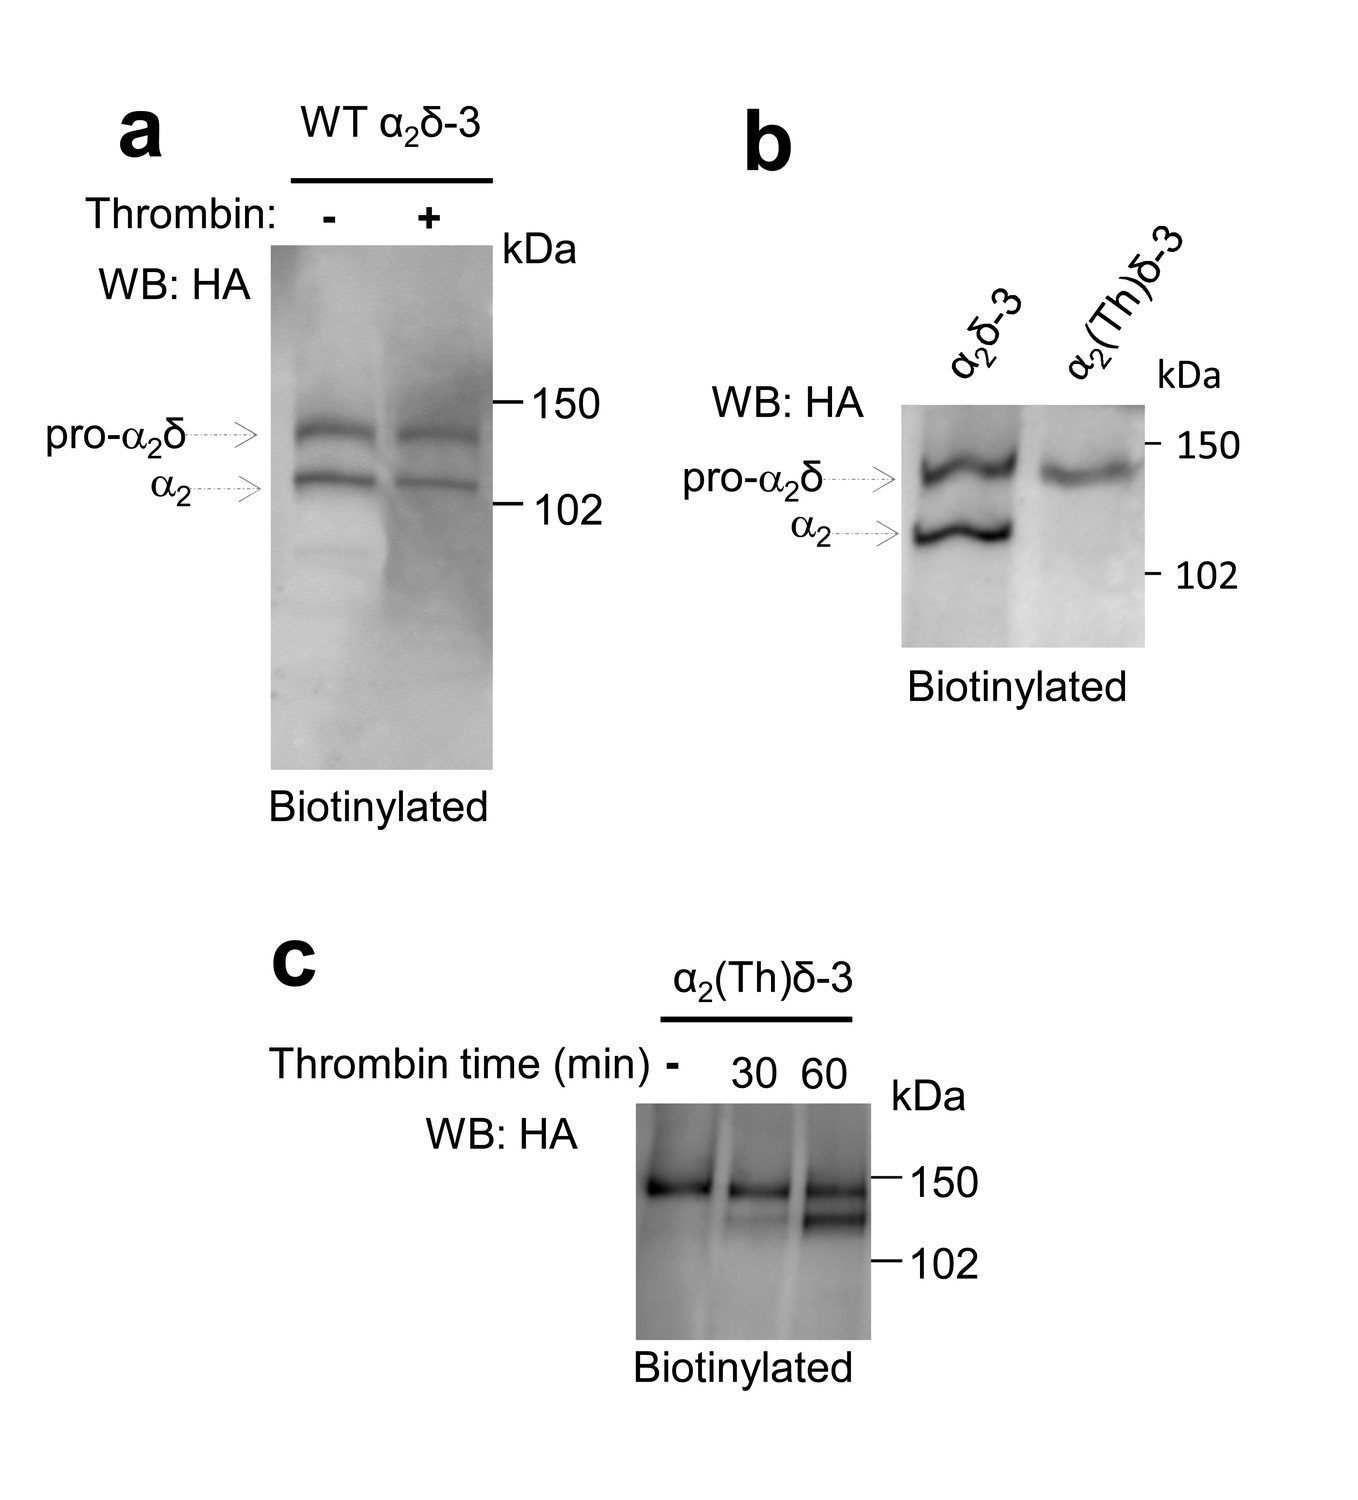
(a) Deglycosylated cell surface biotinylation for tsA-201 cells expressing WT α2δ-3-HA and incubated either with vehicle or thrombin for 60 min (lanes 1 and 2), showing WT α2δ-3 is not cleaved by thrombin. (b) Deglycosylated cell surface biotinylation for tsA-201 cells expressing WT α2δ-3-HA or α2(Th)δ-3-HA (lanes 1 and 2), showing α2(Th)δ-3 reaches cell surface. (c) Deglycosylated cell surface biotinylation for tsA-201 cells expressing α2(Th)δ-3-HA and incubated with thrombin for 0, 30 and 60 min (lanes 1–3), showing α2(Th)δ-3 is cleaved on cell surface at 60 min.
Figure 6
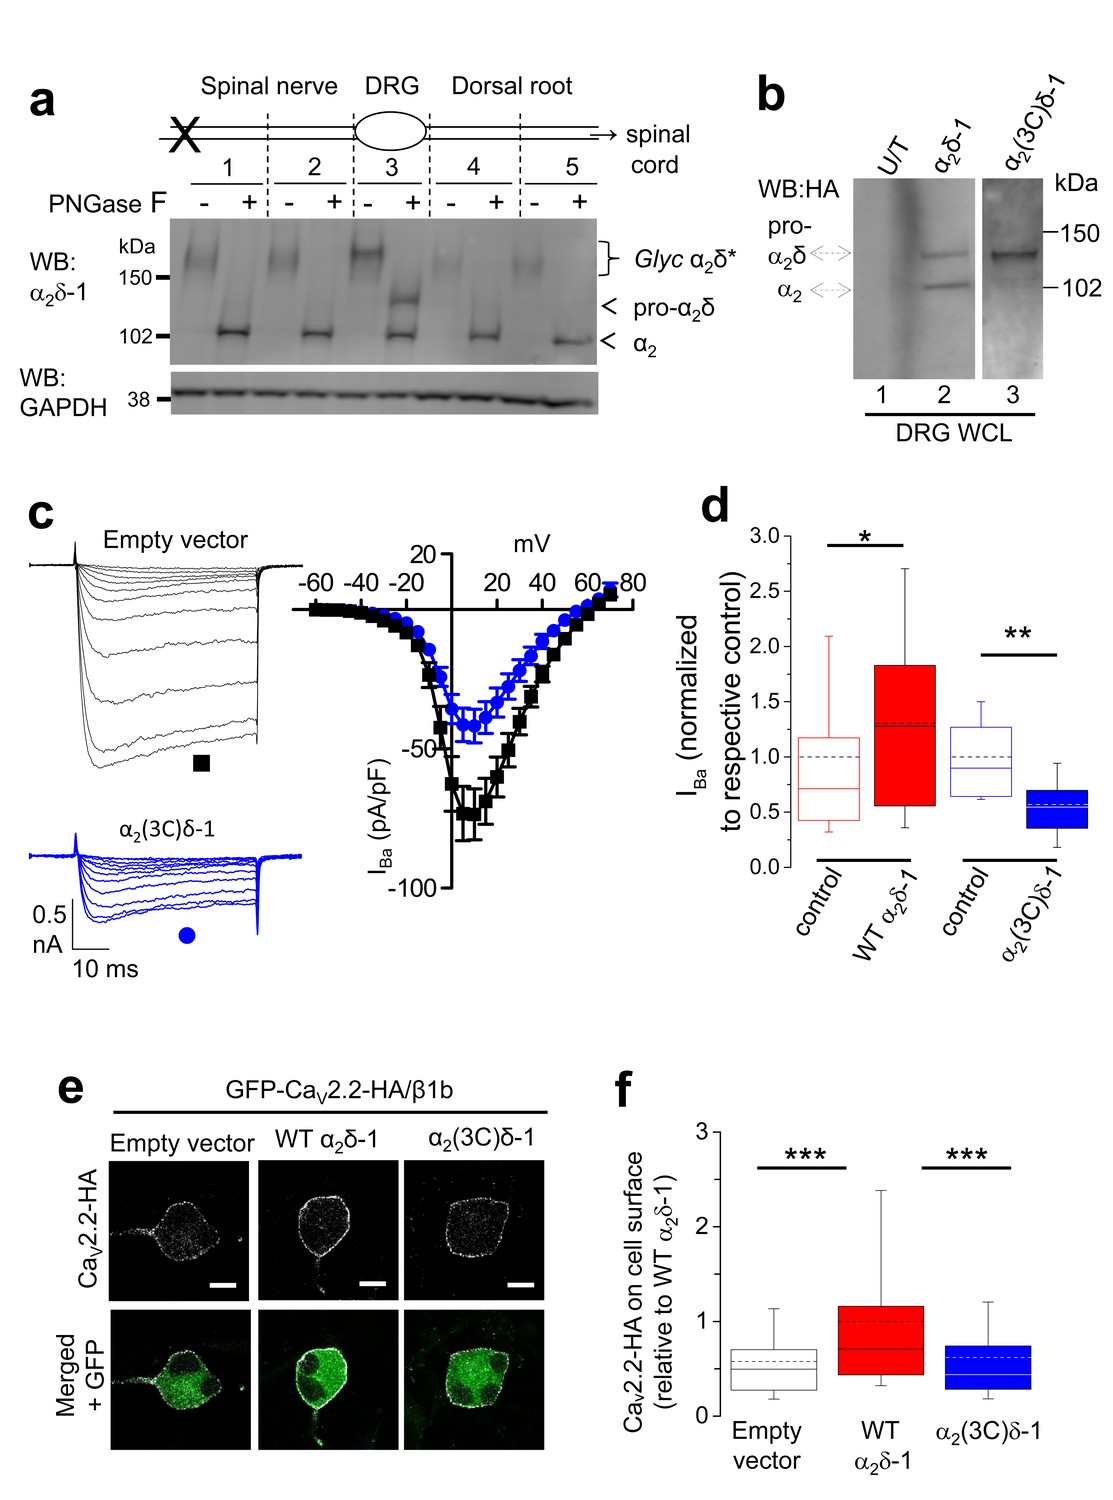
Proteolytic processing of endogenous α2δ-1 and effect of exogenous expression of α2δ-1 and α2(3C)δ-1 in DRGs.
(a) DRGs, spinal nerves and dorsal roots from rats, 4 days after SNL, were dissected and segmented according to the diagram. X marks site of ligation. Tissue was pooled from 4 rats. It was either treated or not with PNGase-F as indicated, and reduced with DTT; deglycosylation allows resolution of two α2-immunoreactive bands. Unprocessed α2δ-1 is present only in the cell body compartment (segment 3) and is distinct from processed α2-1 (indicated by arrows). Lower blot is GAPDH loading control. (b) WCL for empty vector-transfected DRGs (U/T, lane 1); WT α2δ-1-HA-transfected DRGs (lane 2); α2(3C)δ-1-HA transfected DRGs (lane 3). WB: anti-HA. (c) Left: Example traces (−45 to +5 mV steps) for control (empty vector-transfected) DRG neurons (black traces, top) and DRGs transfected with α2(3C)δ-1 (blue traces, bottom). The charge carrier is 1 mM Ba2+. The scale bars refer to all traces. Right: Mean (± SEM) IV curves for control DRG neurons (black squares, n = 12) and DRGs transfected with α2(3C)δ-1 (blue circles, n = 14), from 3 independent experiments. Gmax values were 2.20 ± 0.30 and 1.26 ± 0.14 nS/pF, respectively; p=0.0061 (Student’s t test). V50, act values were −1.5 ± 1.2 and −1.5 ± 0.7 mV, respectively. (d) Comparison of normalized peak IBa in control DRGs (open red bar, n = 55) and WT α2δ-1-transfected DRGs (closed red bar, n = 54) including data from Figure 2d in, or comparison of control DRGs (open blue bar, n = 12) with α2(3C)δ-1 transfected DRGs (closed blue bar, n = 14). Box and whisker plots. Statistical differences, Student’s t test: *, p=0.048, **p=0.0067 compared to respective control. (e) Confocal optical sections (1 µm) showing GFP-CaV2.2-HA in non-permeabilized DRG neurons (top, white), when co-transfected with β1b and either empty vector (left), WT α2δ-1 (middle) or α2(3C)δ-1 (right). GFP fluorescence is shown in the merged lower panel. Scale bars: 10 µm. (f) Box and whisker plot of cell surface HA fluorescence density as a ratio of internal GFP density for CaV2.2-HA expression in DRG somata, transfected with empty vector (open bar, n = 81), WT α2δ-1 (red bar, n = 133) or α2(3C)δ-1 (blue bar, n = 159). ***p<0.001, 1 way ANOVA and Bonferroni post hoc test.
Figure 7 with 1 supplement
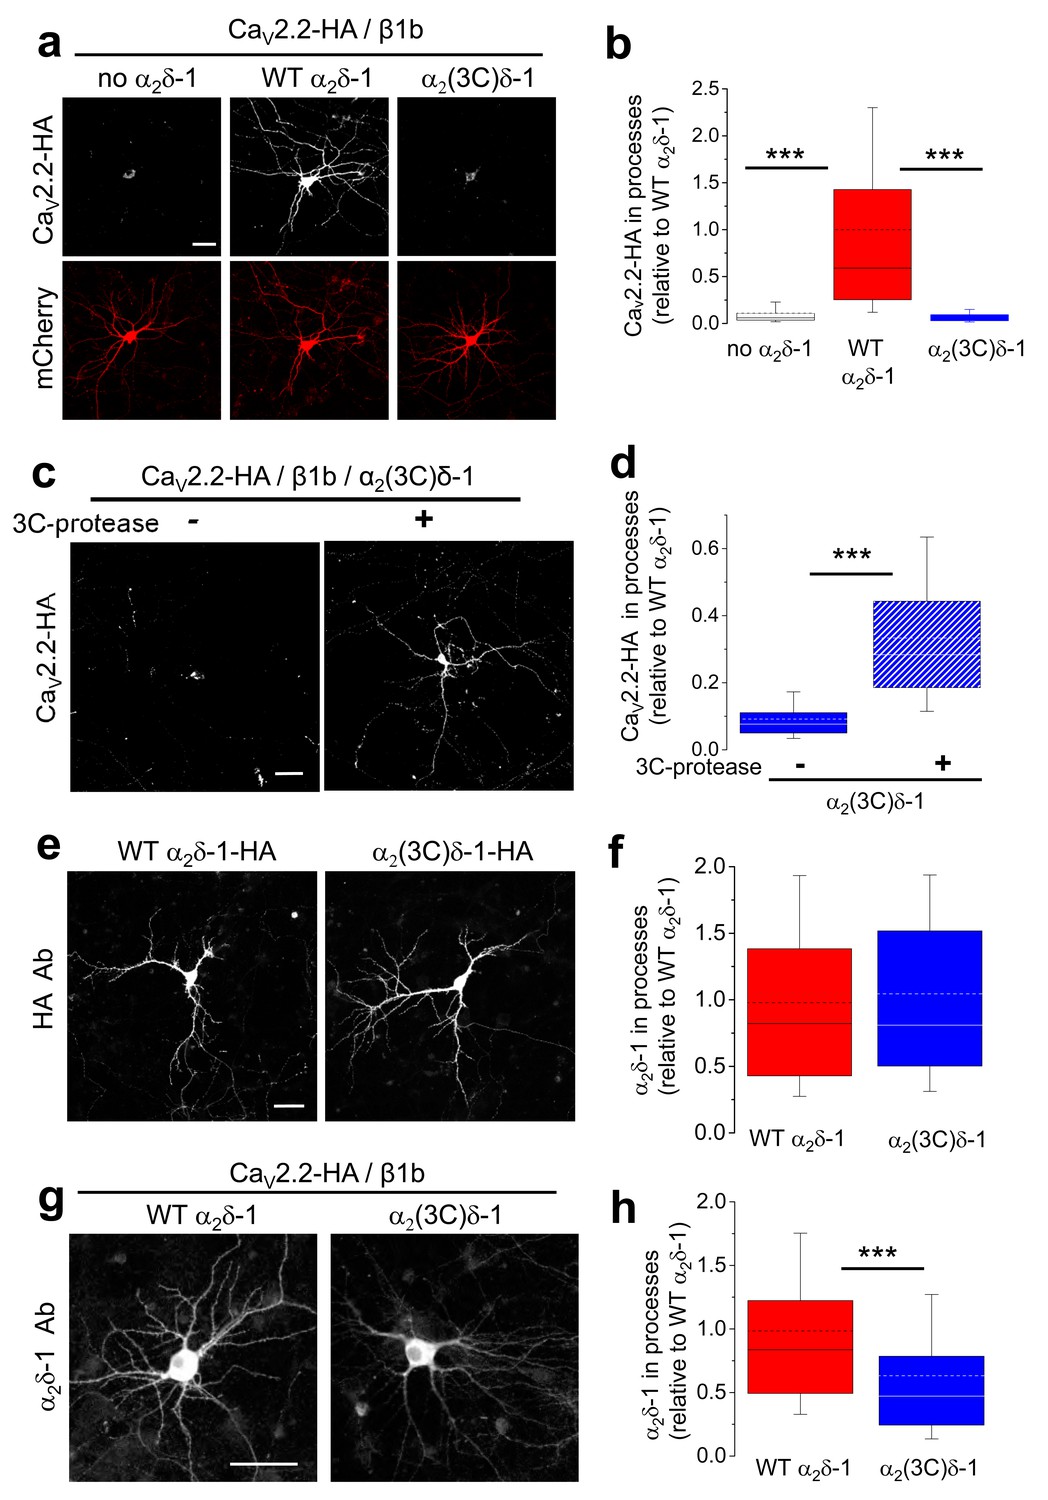
Effect of α2δ-1 and proteolytic cleavage of α2(3C)δ-1 on trafficking of CaV2.2 into hippocampal neurites.
(a) Images showing CaV2.2-HA in permeabilized hippocampal neurons (top, white), when co-transfected with β1b, mCherry (bottom, red) and either no α2δ (left), WT α2δ-1 (middle) or α2(3C)δ-1 (right). Scale bar: 50 µm applies to all images. (b) Box and whisker plots for CaV2.2-HA expression in processes without α2δ (open bar, n = 136 processes from 29 cells), with α2δ-1 (red bar, n = 147 processes from 27 cells) or with α2(3C)δ-1 (blue bar, n = 109 processes from 22 cells). ***p<0.001, 1 way ANOVA and Bonferroni post hoc test. (c) Images showing CaV2.2-HA in permeabilized hippocampal neurons (white), when co-transfected with β1b, α2(3C)δ-1 and mCherry (transfection marker, not shown), either without (left) or with (right) 3C-protease. Scale bar: 50 µm applies to both images. (d) Box and whisker plots for CaV2.2-HA expression in processes with α2(3C)δ-1, transfected without (solid blue bar, n = 191 processes), or with 3C-protease (blue hatched bar, n = 187 processes). ***p<0.001, 1 way ANOVA and Bonferroni post hoc test. (e) Images showing WT α2δ-1-HA (left) or α2(3C)δ-1-HA (right) expressed in permeabilized hippocampal neurons (white), co-transfected only with mCherry (transfection marker, not shown). Antigen retrieval was used prior to the HA Ab. Scale bar: 50 µm applies to both images. (f) Box and whisker plots for expression in the processes of WT α2δ-1-HA (red bar, n = 248 processes from 52 cells) and α2(3C)δ-1 (blue bar, n = 263 processes from 51 cells). (g) Images showing α2δ-1 in hippocampal neurons (white), when transfected with CaV2.2-HA, β1b, mCherry (transfection marker, not shown) and either WT α2δ-1 (left) or α2(3C)δ-1 (right). Antigen retrieval was used prior to the α2δ-1 mAb. Scale bar: 50 µm applies to both images. (h) Box and whisker plots for α2δ-1 expression in hippocampal processes, for WT α2δ-1 (red bar, n = 221 processes) and α2(3C)δ-1 (blue bar, n = 184 processes). ***p<0.0001, Student’s t test.
Figure 7—figure supplement 1
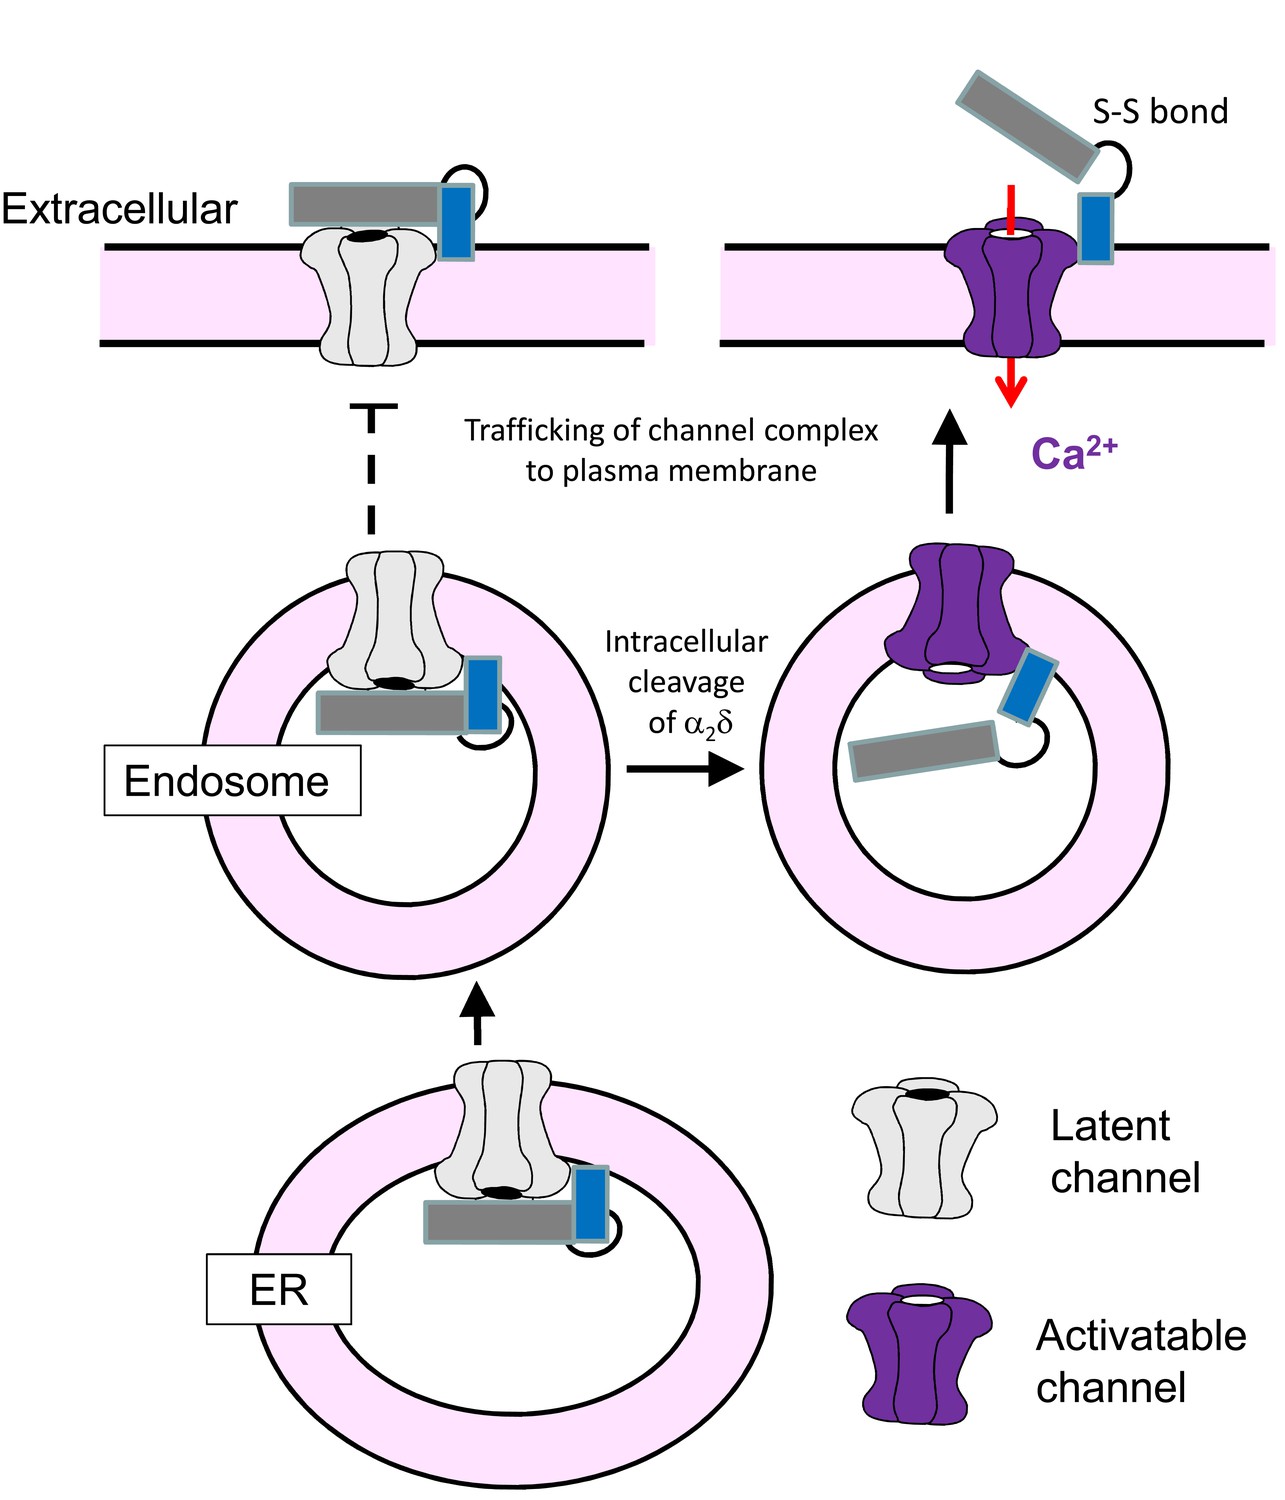
Cartoon showing processing and trafficking of α2δ in neurons.
Cartoon of the effect of proteolytic processing of α2δ (dark gray α2, blue δ) on CaV2.2 trafficking and voltage-dependent activation. The gray channel is one that cannot be activated by depolarization, whereas the purple channel is functional. The solid arrows indicate the likely trafficking pathway in neurons. The dotted lines show that trafficking of channels containing uncleaved α2δ to the plasma membrane and into processes, and extracellular proteolytic cleavage of α2δ indicates do not occur in native neurons studied here, although it is possible that this may occur in pathological conditions, for example following α2δ-1 upregulation as a result of neuropathic nerve injury in DRG neurons.
Figure 8
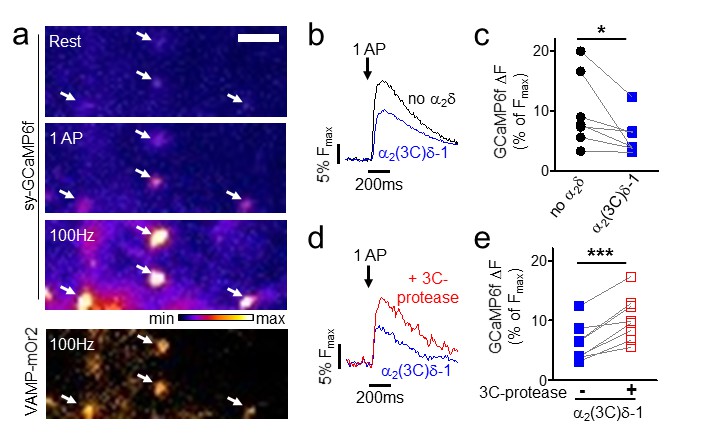
Effect of proteolytic cleavage of α2(3C)δ-1 on Ca2+ influx in presynaptic terminals of hippocampal neurons.
(a) Fluorescence changes in presynaptic terminals of hippocampal neurons expressing sy-GCaMP6f and VAMP-mOr2 in response to electrical stimulation. White arrows point to transfected boutons. Top three panels show sy-GCaMP6f fluorescence: at rest (top), after 1 AP (middle) and after 100 Hz stimulation for 1 s (bottom). The bottom panel shows VAMP-mOr2 fluorescence after 100 Hz stimulation for 1 s. Scale bar 5 µm. The pseudocolour scale is shown below the third panel. (b) Mean example traces from the same experiment of sy-GCaMP6f fluorescence changes in response to 5 single APs from individual presynaptic terminals of neurons co-transfected with either empty vector (black trace) or α2(3C)δ-1 (blue trace). (c) Sy-GCaMP6f fluorescence changes (expressed as % of Fmax) in response to 1 AP from boutons co-transfected with either empty vector (black filled circles) or α2(3C)δ-1 (blue filled squares) (n = 7 independent experiments, *p=0.049, paired t test). (d) Mean example traces of sy-GCaMP6f fluorescence changes in response to 5 single APs from presynaptic terminal of neurons co-transfected with either α2(3C)δ-1 (blue trace) or α2(3C)δ−1 + 3C-protease (red trace). (e) Sy-GCaMP6f fluorescence changes (expressed as % of Fmax) in response to 1 AP from boutons co-transfected with either α2(3C)δ-1 (blue filled squares) or α2(3C)δ−1 + 3C-protease (red open squares) (n = 8 independent experiments, ***p=0.0005, paired t test).
Additional files
-
Supplementary file 1
Summary of statistics shown for the quantitative data in the Figures.
The statistical data were obtained using Graphpad Prism 5.
- https://doi.org/10.7554/eLife.21143.023
Download links
A two-part list of links to download the article, or parts of the article, in various formats.
Downloads (link to download the article as PDF)
Open citations (links to open the citations from this article in various online reference manager services)
Cite this article (links to download the citations from this article in formats compatible with various reference manager tools)
Proteolytic maturation of α2δ represents a checkpoint for activation and neuronal trafficking of latent calcium channels
eLife 5:e21143.
https://doi.org/10.7554/eLife.21143


