Multiple selection filters ensure accurate tail-anchored membrane protein targeting
- California Institute of Technology, United States
- Howard Hughes Medical Institute, University of California, United States
- University of California, United States
Figures
Figure 1
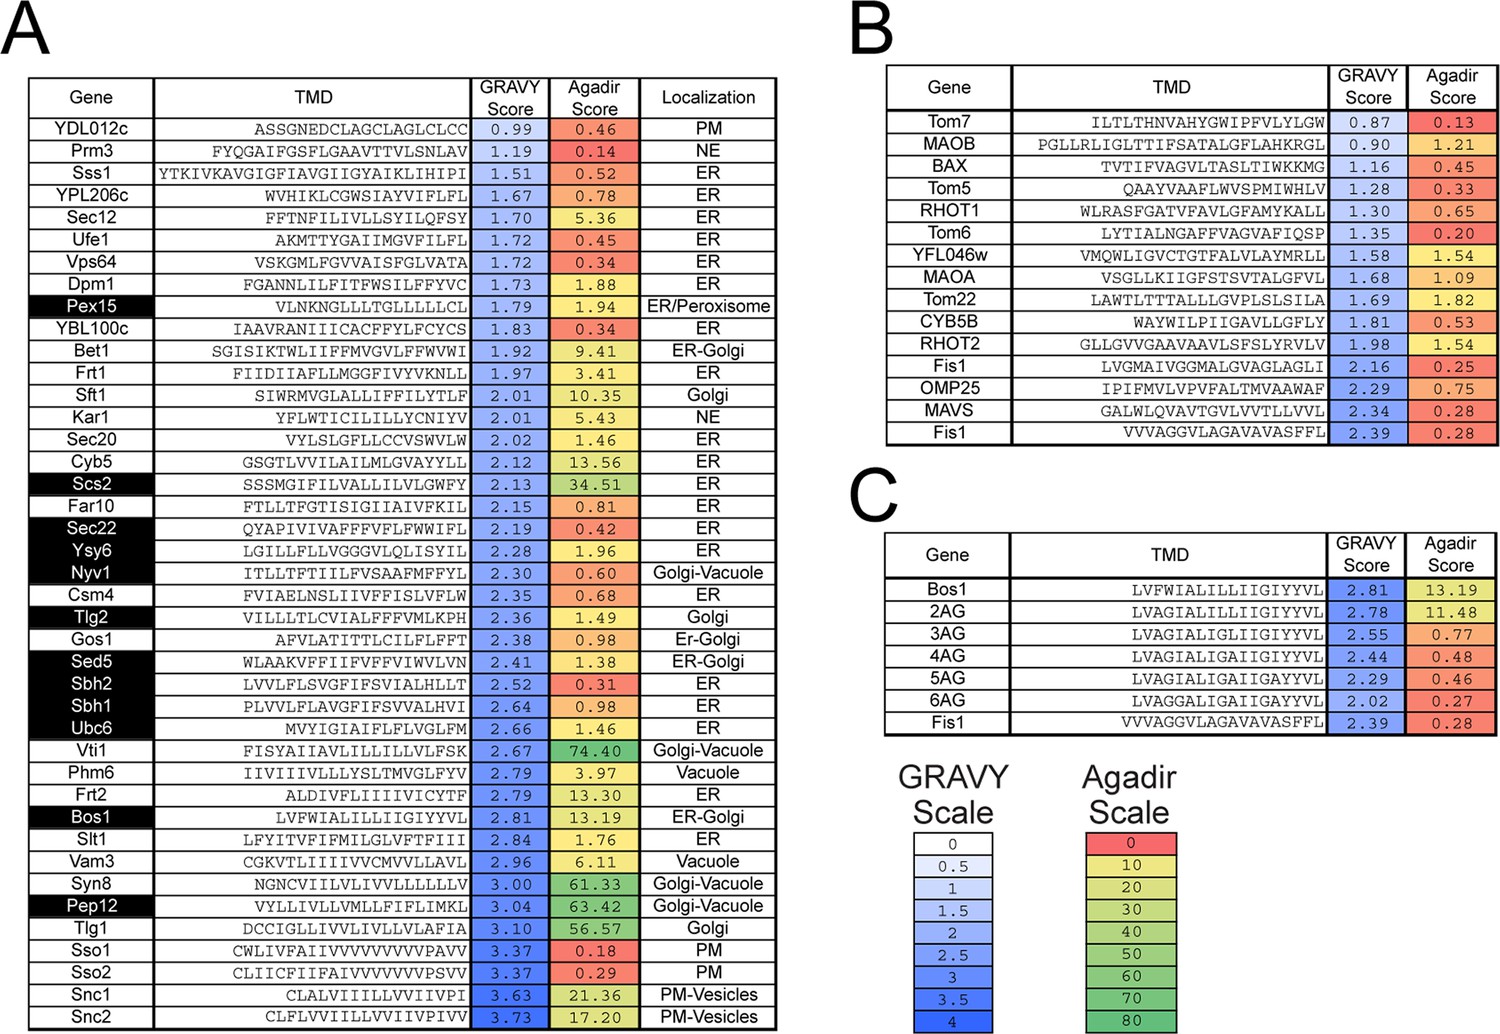
Sequences and properties of the TMDs of ER (A) and mitochondrial (B) TAs, as well as the model substrates used in this study (C).
Genes highlighted in black in panel (A) are previously established TA substrates for the GET pathway. Sequences of TMDs were obtained from UniProt (http://www.uniprot.org)(UniprotUniProt Consortium, 2015). Grand Average of Hydropathy (GRAVY) scores were calculated using the GRAVY calculator (http://www.gravy-calculator.de) and are color ramped as indicated by the scale bar. Agadir scores (% helical content) was calculated at pH 7.5, 298 K, ionic strength 0.15 M using the Agadir prediction algorithm based on helix/coil transition theory (http://agadir.crg.es) (Muñoz and Serrano, 1997), and are color ramped as indicated. We note that helix formation is highly environment-dependent and favored in apolar environments. The Agadir algorithm calculates the local helical content of the sequence in aqueous environments, and hence should be interpreted in a relative, rather than absolute sense. Abbreviations: PM, plasma membrane; NE, nuclear envelope.
Figure 2
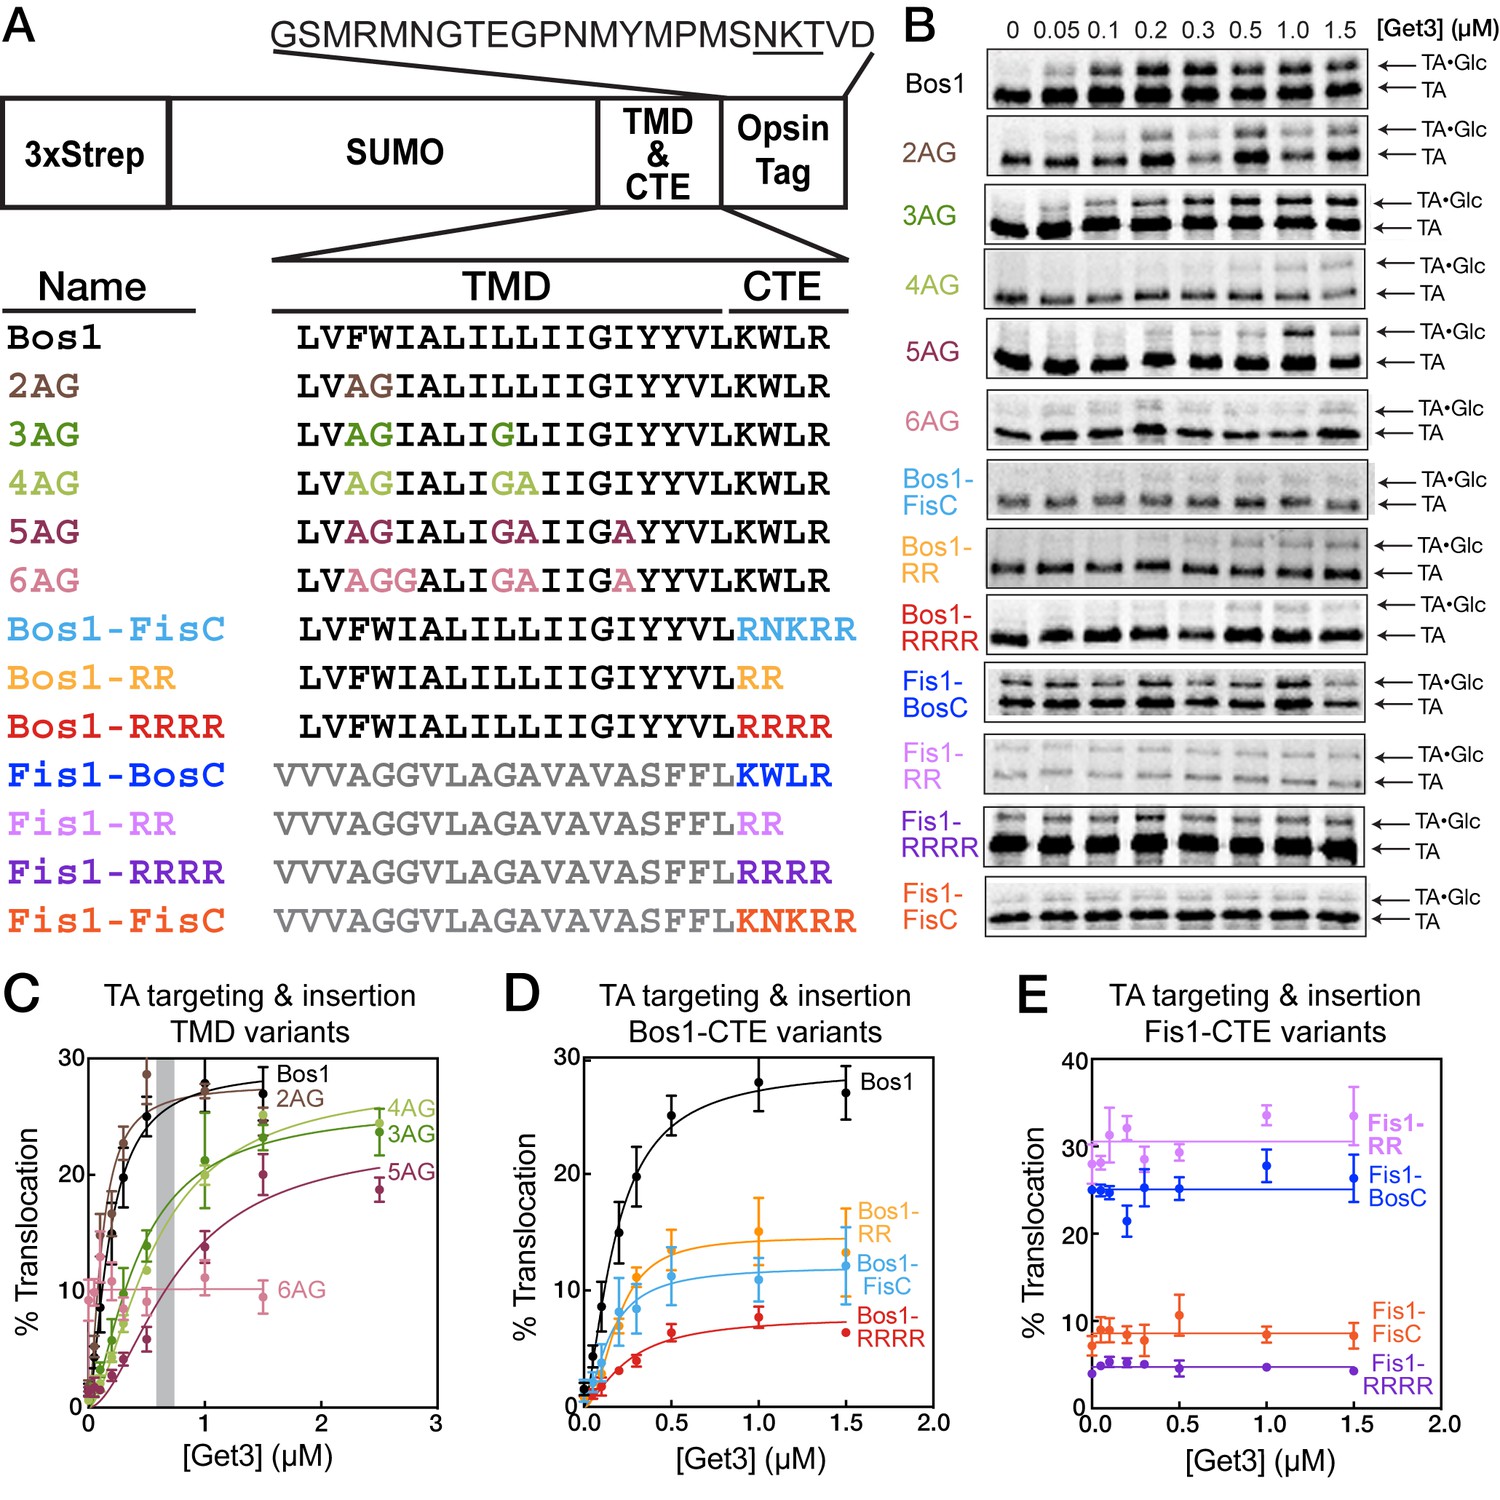
TA protein targeting and translocation into ER are sensitive to variations in both the TMD and CTE.
(A) Nomenclature and schematic of the model substrates used in this work. The oligosaccharide transferase recognition site in the opsin tag is underlined. (B) Overall targeting and translocation of model TA substrates into ER microsomes. TAs are translated in a ∆get3 yeast lysate and presented to ∆get3 microsomes in the presence of indicated concentrations of purified Get3. (C–E) Quantification of the translocation of TAs for TMD variants (C), CTE variants with Bos1-TMD (D), and CTE variants with Fis1-TMD (E). The grey bar in (C) denotes the cellular concentration of Get3 in yeast (Ghaemmaghami et al., 2003). With the exception of 6AG, the data in panels C and D were fit to Equation 1, and the derived parameters are summarized in Table 1. The data for 6AG (panel C), Fis1-BosC, Fis1-FisC, Fis1-RR, and Fis1-RRRR (panel E) were fit to horizontal lines with y = 10 ± 0.5, y = 25 ± 0.6, y = 9 ± 0.5, y = 31 ± 0.7, and y = 5 ± 0.2%, respectively. Values are reported as mean ± S.E.M, with n = 3–6.
Figure 3
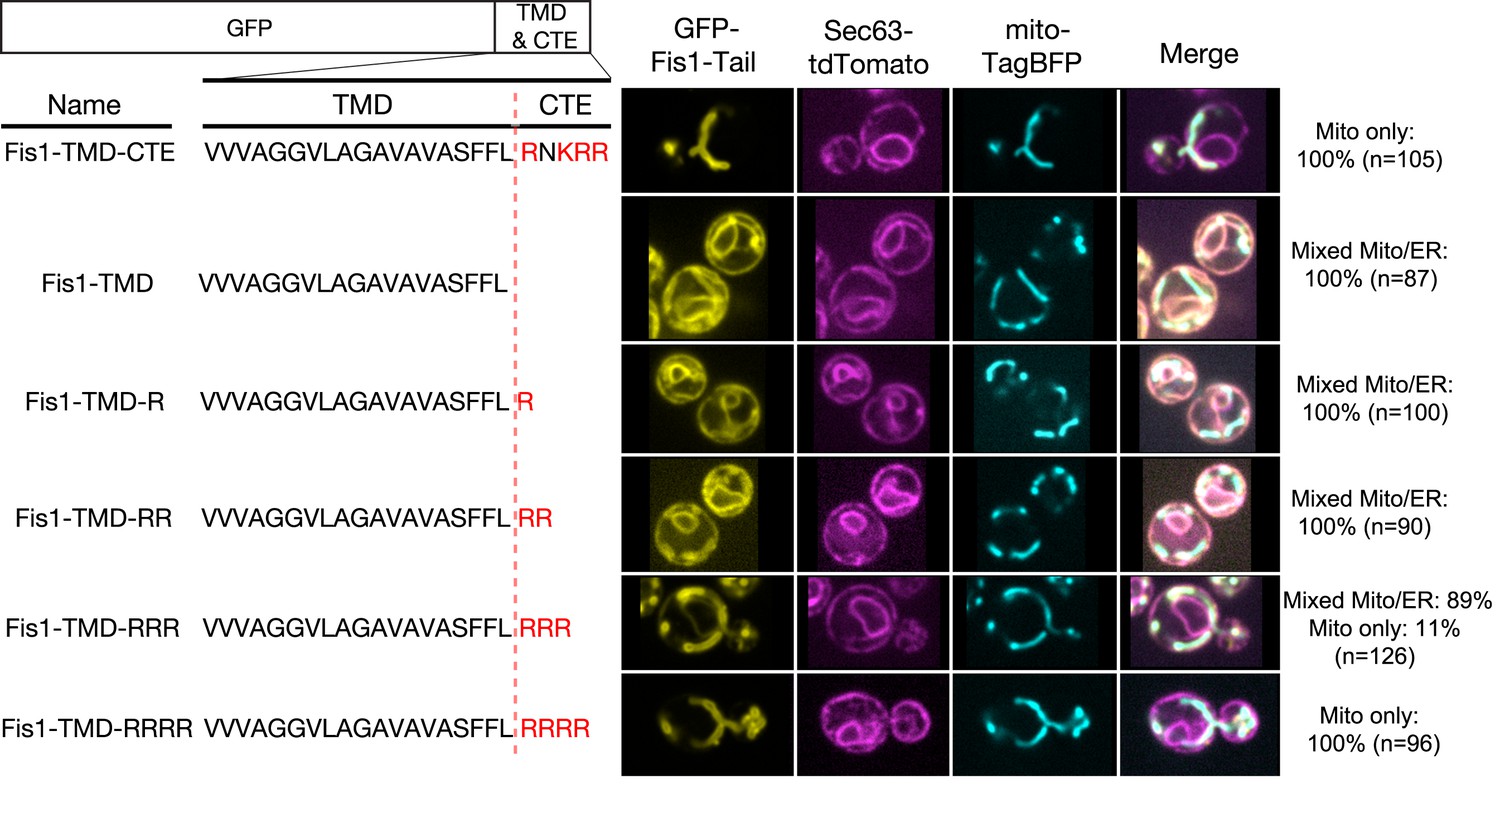
Positive charges in the CTE help reject TA proteins from ER and selectively target TAs to mitochondria.
Nomenclature and schematic of the constructs used for live-cell imaging of cells expressing GFP-tagged Fis1 tail constructs are shown on the left. Basic residues in the CTE are highlighted in red. Medial focal planes are shown on the right, with ER marked by Sec63-tdTomato and mitochondria by mitochondrially targeted TagBFP. Quantification denotes % of cells in each category (mixed Mito/ER or Mito only).
Figure 4
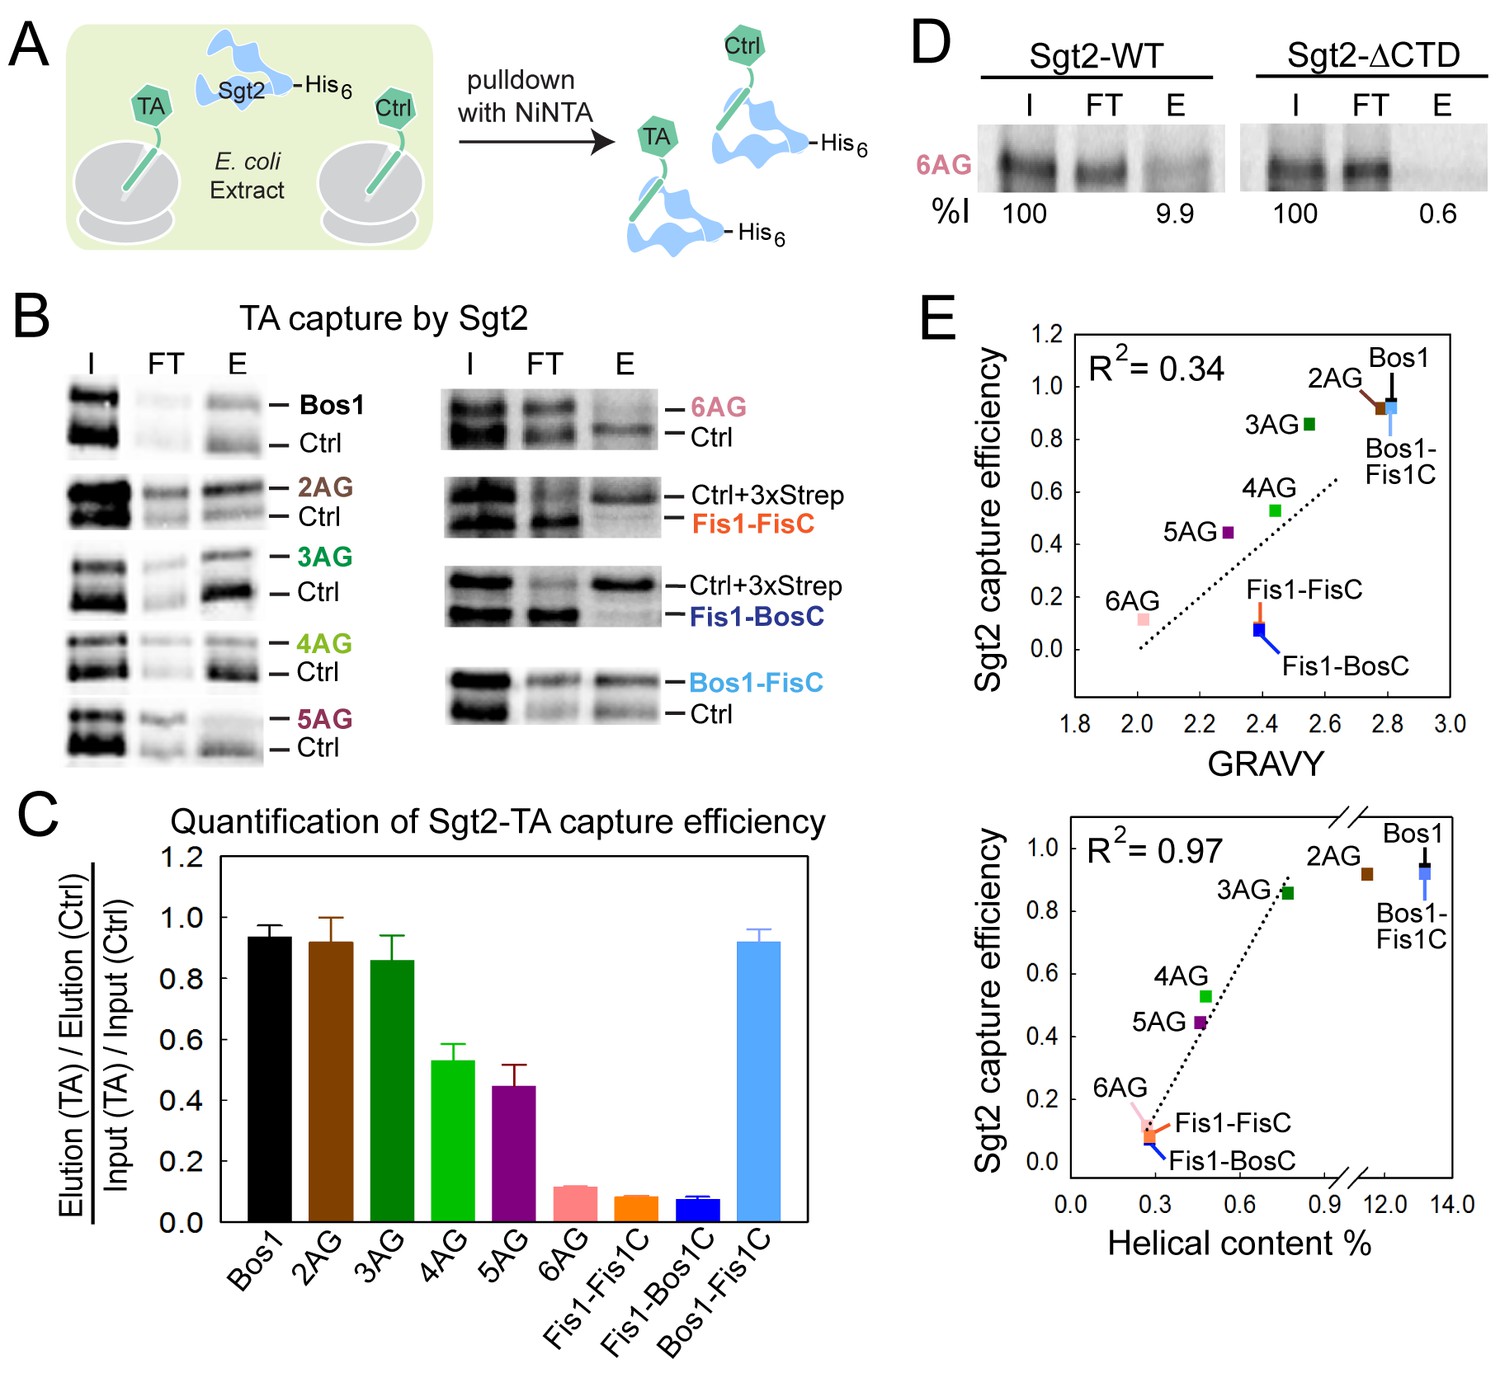
Sgt2 discriminates TAs based on features in the TMD.
(A) Schematic of the assay to measure and compare the efficiency of TA capture by Sgt2. All TAs were translated, captured, and purified in parallel with an internal control, Bos1 (Ctrl + 3xStrep) or Bos1 lacking the N-terminal 3xStrep tag (Ctrl). (B) Representative autoradiograms of 35S-methionine labeled TA substrates during affinity purification of His6-Sgt2•TA complexes. I, FT, and E denote input, flowthrough, and elution, respectively. (C) Quantification of the experiments in (B) and their repetitions. All values for the TA of interest were normalized against Ctrl or Ctrl + 3xStrep. Normalized TA capture efficiencies were reported as mean ± S.E.M, with n = 3–7. (D) Representative autoradiogram of 35S-methionine labeled 6AG during capture and purification by wildtype His6-Sgt2 (left panel) or mutant His6-Sgt2△CTD lacking the TA binding domain (right panel). Quantifications of substrate recovery in the elutions were indicated below the gels. (E) Correlation of the relative Sgt2 capture efficiencies of TA variants with the GRAVY scores (top panel) and helical content (bottom panel) of their TMDs. Substrates included in the correlation analyses are 3AG–6AG, Fis1-FisC and Fis1-BosC. The high capture efficiencies of Bos1, Bos1-FisC and 2AG (>90%) render them outside the dynamic range of this assay and were therefore not included in the correlation analysis. GRAVY scores and % helical content were from Figure 1C.
Figure 5

Labeling of TA and Get3.
(A) Scheme of TA labeling with the fluorescent amino acid Cm using amber suppression technology in E. coli lysate. (B) Autoradiogram showing amber suppression efficiency. Bos1 was translated in the presence of 35S-methionine without (lane 2) or with (lanes 3,4) an amber codon four residues N-terminal to the TMD, in the absence (lane 3) and presence (lane 4) of Cm and Cm synthetase. (C, D) Coomassie-stained SDS-PAGE gel (C) and western blot (D) of a purified Sgt2•TACm complex. Sgt2 was His6 tagged and TA was 3xStrep-tagged. (E) Location of the ybbR tag (for labeling) on the structure of Get3 (PDB: 3H84). (F) Coomassie-stained (top) and in-gel fluorescence (bottom) of Sfp-mediated conjugation of CoA-BODIPY-FL to the Get3 ybbR tag. (G) Purification of labeled ybbR-Get3. Top, coomassie-stain; bottom, in-gel fluorescence. (H) ATPase assays of wildtype and labeled ybbR-Get3. (I) Representative autoradiograms for the translocation reactions with wildtype and labeled ybbR-Get3.
Figure 6
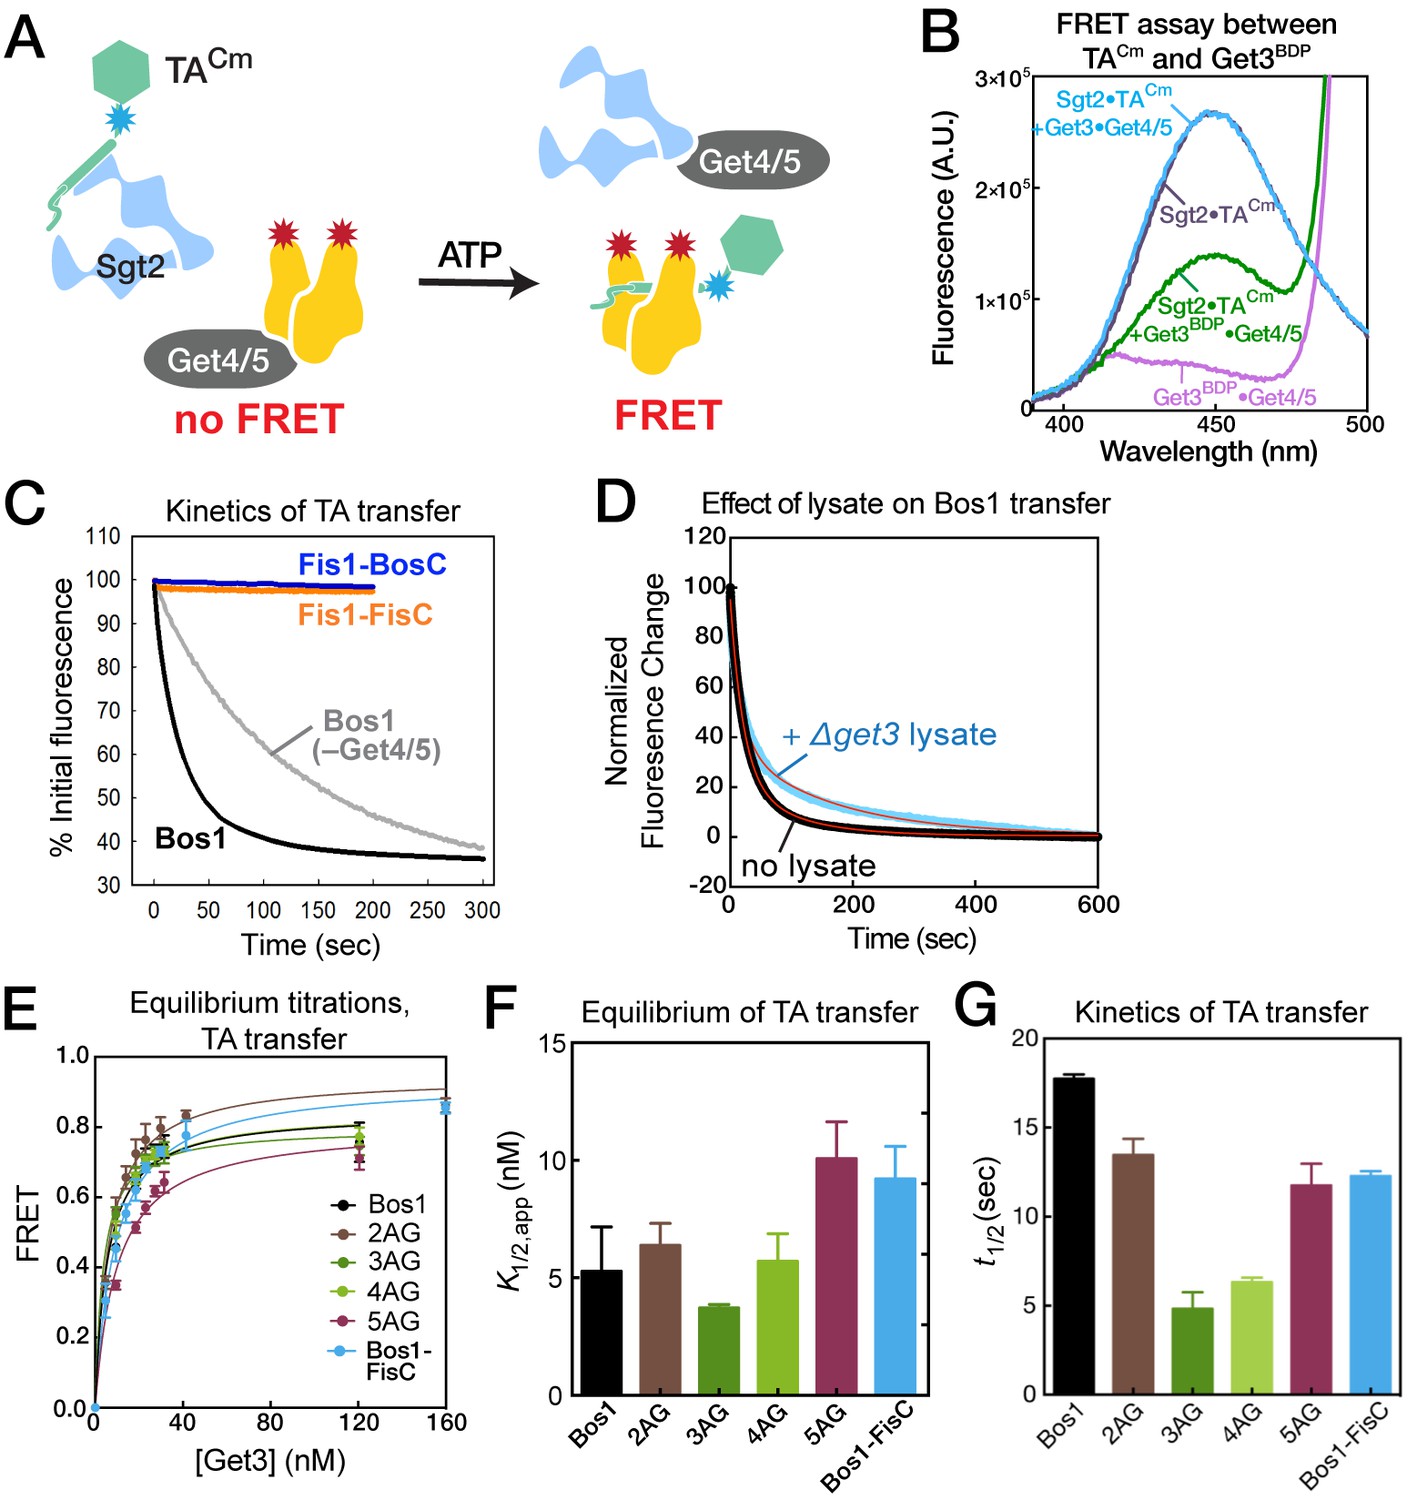
Equilibrium and kinetics of TA transfer from Sgt2 to Get3.
(A) Scheme of the TA transfer reaction and the FRET assay to monitor this transfer. Purified Sgt2•TACm complexes were presented to the Get3BDP•Get4/5 complex in the presence of ATP. Loading of TACm onto Get3BDP results in FRET between the dye pair. (B) Fluorescence emission spectra for purified Sgt2•TACm complex (purple; donor fluorescence), Sgt2•TACm incubated with unlabeled Get3, Get4/5 and ATP (blue; donor fluorescence corrected for environmental sensitivity), Get3BDP and Get4/5 (magenta; acceptor fluorescence), and Sgt2•TACm complex incubated with Get3BDP, Get4/5 and ATP (green; donor fluorescence in the presence of acceptor). (C) Representative time courses of the transfer of Bos1 with (black) and without Get4/5 (gray) present, and transfer of Fis1-FisC (orange) and Fis1-BosC (navy) with Get4/5 present. The data were fit to Equation 4, and the derived kinetic parameters are summarized in panel G and in Table 2. (D) Transfer of Bos1 from Sgt2 to Get3 in the presence (blue) and absence (black) of a ribosome depleted △get3 lysate. Red lines are fits of the data to Equation 4, and the derived values are summarized in Table 2. (E, F) Equilibrium measurements of TA transfer reactions as a function of Get3 concentration. All reactions used 50 nM Sgt2•TACm complexes supplemented to a final concentration of 150 nM Sgt2, 150 nM Get4/5, 2 mM ATP, and indicated concentrations of Get3BDP. The data in panel E were fit to Equation 3, and the values are reported in panel F and Table 2. (G) Summary of the half-times of TA transfer reactions for various TA proteins.
Figure 7
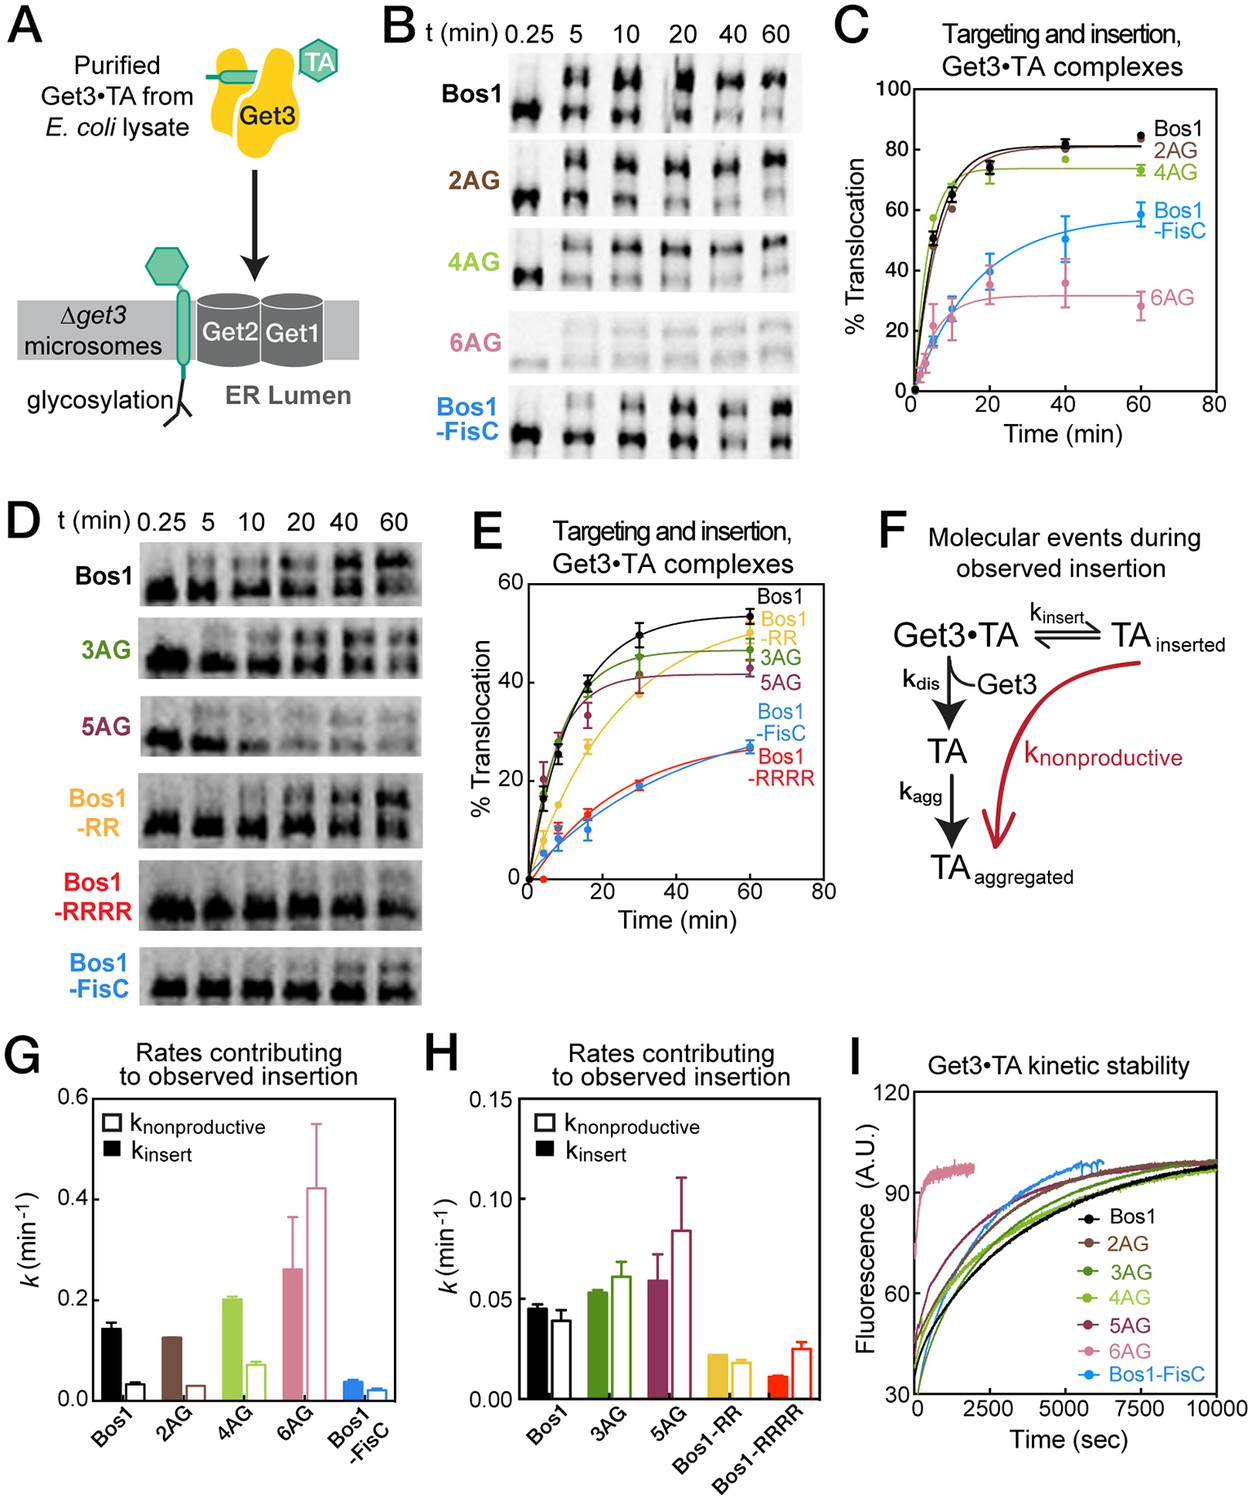
Basic residues in the CTE slow targeting and insertion of the Get3•TA complex into the ER membrane.
(A) Schematic of the reaction assayed in Figure 7. Get3•TA complexes generated and purified from E. coli lysate were presented to △get3 microsomes. Insertion was monitored by glycosylation of the opsin tag on TA substrates. (B, D) Representative autoradiograms of insertion reactions. The reactions in panels B and D used two different yRM preps. (C, E) Quantification of the insertion reactions shown in panels B and D, respectively. The data were fit to Equation 5, and the values obtained are summarized in Table 3. (F) Schematic of the molecular events during the insertion reaction. Productive TA insertion (kinsert) competes with nonproductive processes (collectively termed knonproductive), including reversal of the targeting reaction, disassembly of the Get3•TA complex (kdis) and aggregation of TA substrates (kagg). (G–H) Summary of the rate constants of competing events, defined in panel F and Equations 6–7, that contribute to the observed rate constants and efficiencies of the targeting/insertion reactions in panels C and E, respectively. See also Table 3 for a summary of the values of knonproductive and kinsert. (I) The kinetic stability of Get3•TA complexes (kdis defined in panel F) measured by pulse-chase experiments as described in the Materials and methods. The data were fit to Equation 8 and the obtained kdis values are summarized in Table 3.
Figure 8
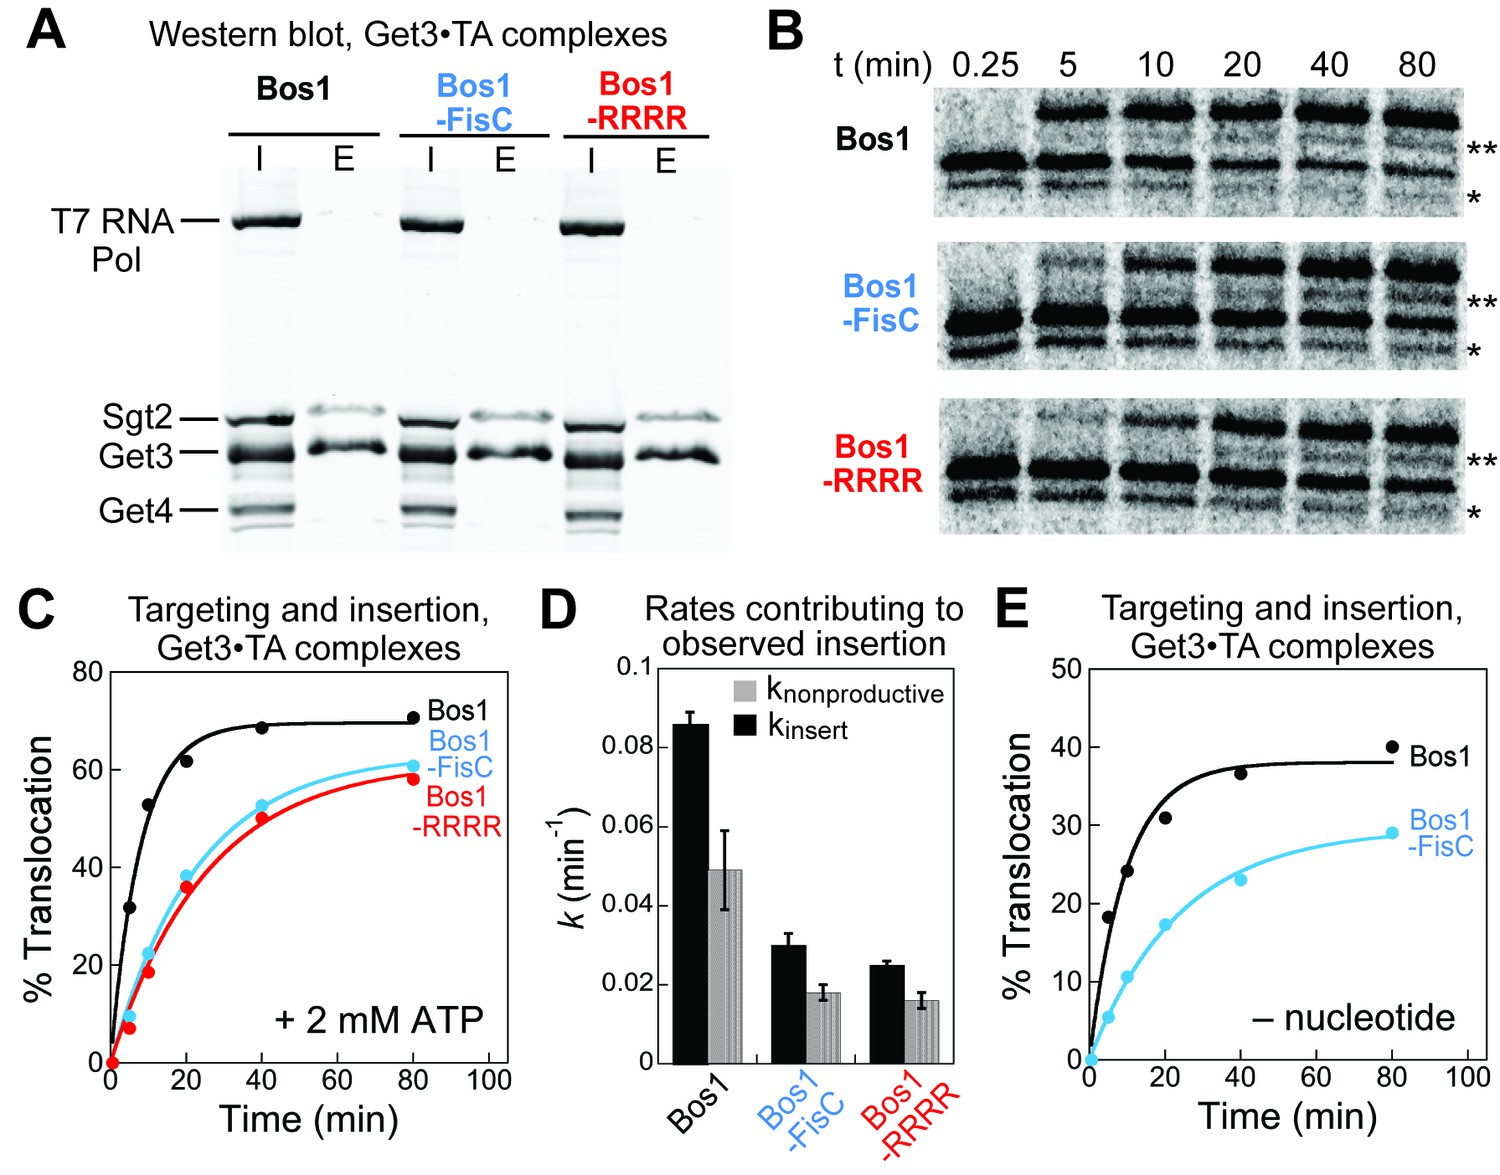
Defects of CTE variants in targeting and insertion cannot be attributed to Get4/5 or ATP hydrolysis.
(A) SDS-PAGE and western blot (against His6) analysis of purified Get3•TA complexes. Get3•TA complexes were assembled during in vitro translation in S30 extract in the presence of Sgt2, Get4/5 and Get3, and purified via the 3xStrep-tag on the TA protein as described in the Materials and methods. T7 RNA polymerase, Sgt2, Get3, and Get4 were His6-tagged. I denotes input onto the Strep-Tactin resin, E denotes elution. (B) Representative autoradiograms of insertion reactions. The asterisk (*) denotes a truncated translation product of the TA, which was inserted and glycosylated (**) with similar efficiencies as the full-length translation product. (C) Quantification of the insertion reactions in panel B. The data were fit to Equation 5, which (together with replicates) gave observed insertion rate constants (kobsd) of 0.14 ± 0.01, 0.048 ± 0.006, and 0.041 ± 0.003 min−1, and translocation end points (T) of 64 ± 8, 63 ± 1, and 61 ± 2% for Bos1, Bos1-FisC, and Bos1-RRRR, respectively. (D) Summary of the rate constants of competing molecular events, defined in Figure 7F and Equations 6–7, that contribute to the observed targeting/insertion reactions in panel C. Values represent mean ± S.E.M., with n = 2. (E) Targeting and insertion of Get3•Bos1 and Get3•Bos1-FisC complexes in the absence of nucleotides.
Figure 9

The GET pathway selects TA substrates using multiple mechanisms.
(A) Model of sequential TA selection by the GET pathway. Step 1: TAs are captured by Sgt2. TA substrates with less suboptimal TMDs (red coil) are less favorably captured. Step 2: Get4/5 mediates TA transfer from Sgt2 to ATP-bound Get3. The question mark indicates that it is unclear whether the TA transfer step selectively poses a higher barrier for substrates containing suboptimal TMDs. Step 3: after hydrolyzing ATP, the Get3•TA complex associates with the Get1/2 membrane receptors, and the latter facilitates TA insertion. TAs enriched in basic residues at the extreme C-termini (red tail) are discriminated at this step. (B–C) Free energy profiles for TA capture and insertion without (B) and with (C) Sgt2 in the GET pathway. The free energy profiles for a good substrate (Bos1) are indicated in black, for a substrate with a suboptimal TMD (5AG) are in maroon, and those for a substrate with a charged CTE (Bos1-FisC and Bos1-RRRR) are in blue. The off-pathway branch in which a TA dissociates from Get3 and aggregates is not shown for simplicity.
Tables
Table 1
Summary of kinetic parameters for TA targeting and translocation in ∆get3 lysate, derived from fits of the data in Figure 2C–D to Equation 1. Values are reported as mean ± S.E.M., with n = 3–6.
Substrate | K1/2 (µM) | Hill coefficient | Tmax (%) |
|---|---|---|---|
Bos1 | 0.18 ± 0.03 | 1.5 ± 0.3 | 29 ± 2.3 |
2AG | 0.11 ± 0.02 | 1.6 ± 0.4 | 28 ± 1.8 |
3AG | 0.42 ± 0.06 | 1.5 ± 0.2 | 26 ± 1.5 |
4AG | 0.57 ± 0.06 | 1.6 ± 0.2 | 28 ± 1.6 |
5AG | 0.76 ± 0.16 | 1.8 ± 0.4 | 23 ± 1.8 |
Bos1-FisC | 0.15 ± 0.06 | 1.6 ± 0.8 | 12 ± 2.0 |
Bos-RR | 0.19 ± 0.04 | 2.1 ± 0.8 | 15 ± 1.4 |
Bos-RRRR | 0.24 ± 0.07 | 1.5 ± 0.5 | 8.0 ± 1.1 |
Table 2
Summary of the equilibrium and kinetic parameters for TA transfer from Sgt2 to Get3, derived from the data in Figure 6. Refer to Equations 3 and 4 for definitions of the parameters. Values are reported as mean ± S.E.M., with n ≥ 2. N.D., not determined.
Substrate | K1/2 (nM) | FRET endpoint | kfast (10−3 s−1) | △Ffast | kslow (10−3 s−1) | △Fslow | t1/2 (s) |
|---|---|---|---|---|---|---|---|
Bos1 (–Get4/5) | N.D. | N.D. | 9.4 ± 0.07 | 0.76 ±0.03 | 3.0 ± 0.1 | 0.24 ±0.03 | 98 ± 8.7 |
Bos1 | 5.2 ± 1.0 | 0.84 ± 0.03 | 47 ± 0.4 | 0.75 ±0.01 | 11 ± 0.4 | 0.25 ±0.01 | 17.7 ± 0.2 |
2AG | 6.4 ± 0.5 | 0.94 ± 0.02 | 77 ± 1 | 0.62 ±0.01 | 7.0 ± 0.1 | 0.38 ±0.01 | 13.5 ± 0.5 |
3AG | 3.7 ± 0.1 | 0.80 ± 0.01 | 164 ± 2 | 0.77 ±0.01 | 17 ± 0.8 | 0.23 ±0.01 | 4.8 ± 0.5 |
4AG | 5.7 ± 0.6 | 0.84 ± 0.02 | 183 ± 9 | 0.54 ±0.01 | 33 ± 0.2 | 0.46 ±0.01 | 6.3 ± 0.1 |
5AG | 10 ± 1 | 0.80 ± 0.02 | 151 ± 9 | 0.43 ±0.01 | 23 ± 0.8 | 0.57 ±0.01 | 11.8 ± 0.7 |
Bos1FisC | 9.2 ± 0.8 | 0.93 ± 0.02 | 63 ± 0.3 | 0.83 ±0.01 | 9.0 ± 0.1 | 0.17 ±0.01 | 12.3 ± 0.2 |
Table 3
Summary of rate constants for TA targeting and insertion from the Get3•TA complex, derived from the data in Figure 7. Refer to Equations 5-8 for definitions of the parameters. The thick line separates the quantifications derived from the data in Figure 7B and D, which used two different yRM preps. Values are reported as mean ± S.E.M., with n ≥ 2. N.D., not determined.
Substrate | kobsd (min−1) | Translocation end point (%) | kinsert (min−1) | knonproductive (min−1) | kdis (min−1) |
|---|---|---|---|---|---|
Bos1 | 0.18 ± 0.02 | 81.2 ± 0.5 | 0.14 ±0.01 | 0.033 ± 0.004 | 0.018 ± 0.001 |
2AG | 0.16 ± 0.01 | 80.8 ± 0.2 | 0.13 ±0.01 | 0.030 ± 0.001 | 0.023 ± 0.001 |
4AG | 0.27 ± 0.01 | 74 ± 2 | 0.20 ±0.01 | 0.072 ± 0.006 | 0.017 ± 0.001 |
6AG | 0.70 ± 0.20 | 36 ± 4 | 0.30 ±0.10 | 0.40 ± 0.10 | 0.20 ± 0.0025 |
Bos1-FisC | 0.059 ± 0.01 | 58.4 ± 4.6 | 0.038 ±0.010 | 0.020 ± 0.003 | 0.029 ± 0.001 |
Bos1 | 0.085 ± 0.008 | 53.8 ± 2.1 | 0.045 ±0.002 | 0.039 ± 0.005 | 0.018 ± 0.001 |
3AG | 0.11 ± 0.01 | 46.7 ± 2.4 | 0.053 ±0.001 | 0.060 ± 0.008 | 0.026 ± 0.001 |
5AG | 0.14 ± 0.02 | 41.9 ± 2.3 | 0.060 ±0.010 | 0.080 ± 0.030 | 0.034 ± 0.001 |
Bos1-RR | 0.040 ± 0.002 | 54.8 ± 2.1 | 0.022 ±0.001 | 0.018 ± 0.002 | N.D. |
Bos1-RRRR | 0.036 ± 0.004 | 30.1 ± 1.7 | 0.011 ±0.001 | 0.025 ± 0.003 | N.D. |
Bos1-FisC | 0.023 ± 0.006 | 34.9 ± 1.9 | 0.009 ±0.001 | 0.020 ± 0.005 | 0.029 ± 0.001 |
Download links
A two-part list of links to download the article, or parts of the article, in various formats.
Downloads (link to download the article as PDF)
Open citations (links to open the citations from this article in various online reference manager services)
Cite this article (links to download the citations from this article in formats compatible with various reference manager tools)
Multiple selection filters ensure accurate tail-anchored membrane protein targeting
eLife 5:e21301.
https://doi.org/10.7554/eLife.21301


