Glycolysis and glutaminolysis cooperatively control T cell function by limiting metabolite supply to N-glycosylation
- University of California, United States
Figures
Figure 1 with 2 supplements

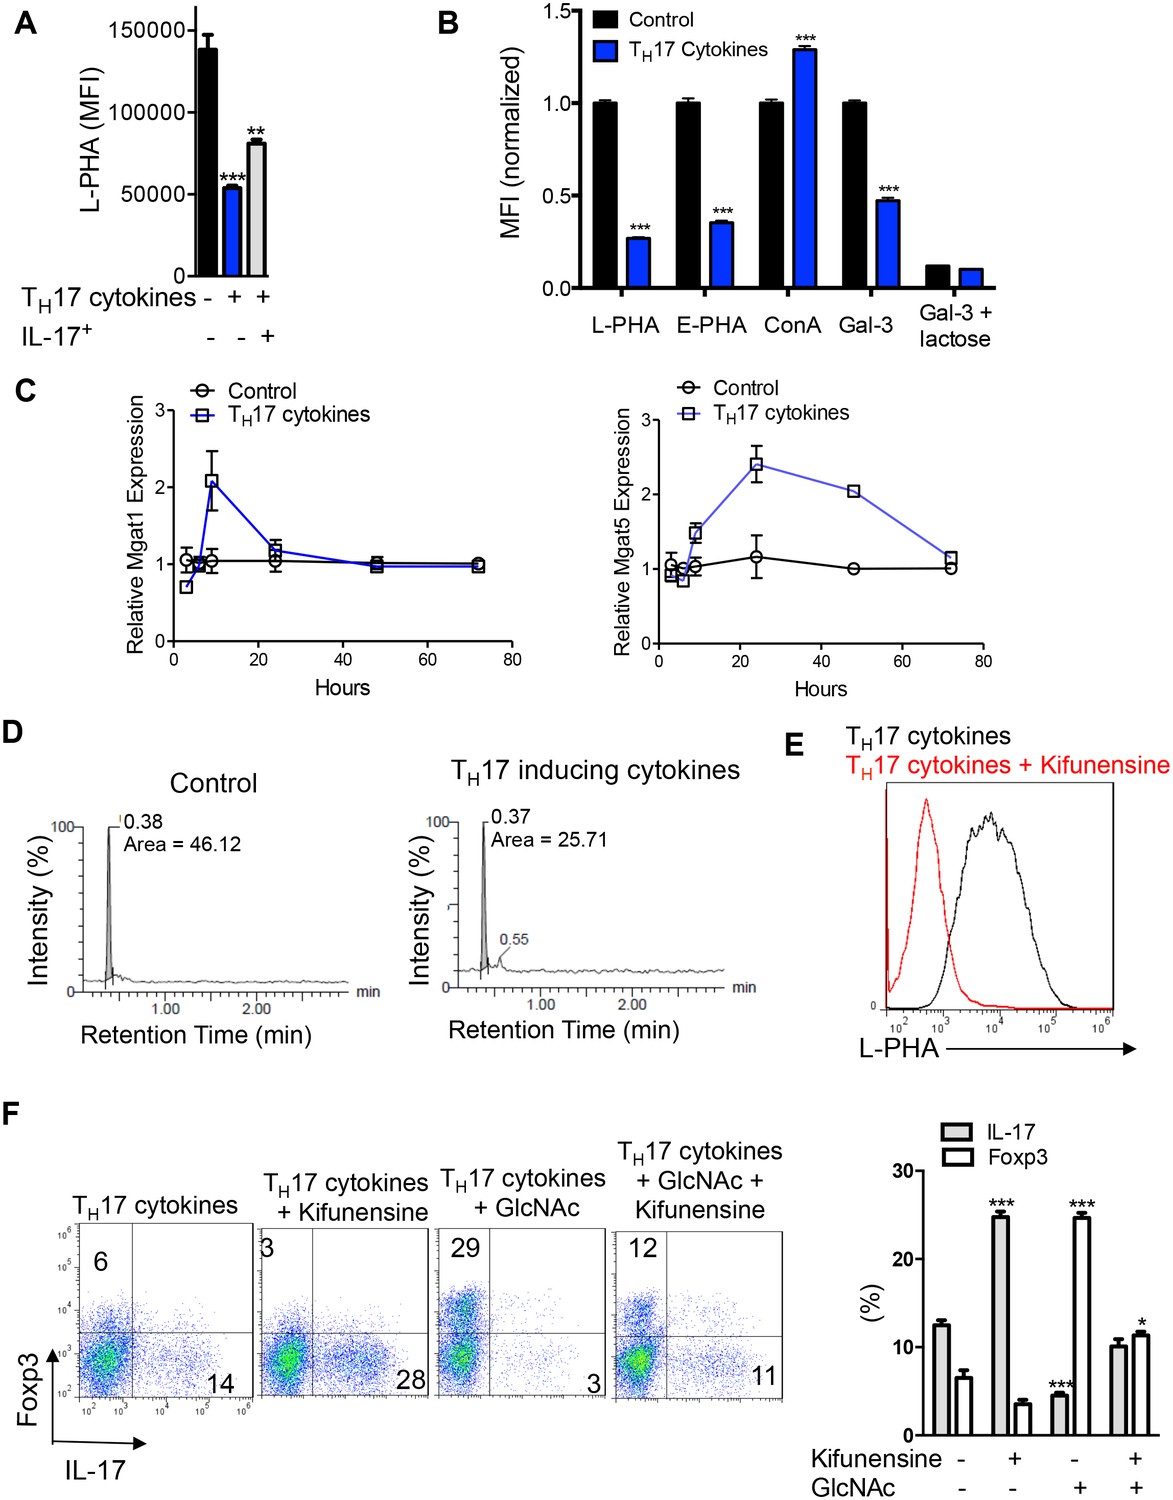
N-glycan branching controls TH17 versus iTreg cell fate.
(A) Fructose 6-phosphate and glutamine may be metabolized by glycolysis and glutaminolysis, respectively, or enter the hexosamine pathway to supply UDP-GlcNAc to the Golgi branching enzymes Mgat1, 2, 4 and 5. HK: hexokinase, GPI: glucose-6-phosphate isomerase, PFK1: phosphofructokinase1, LDH: Lactate dehydrogenase, GFPT: glutamine-fructose-6-phosphate transaminase. (B–H) Flow cytometry (B,E–H), Western blot (C) and LC-MS/MS (D) analysis of purified mouse splenic CD4+ T-cells activated with anti-CD3+anti-CD28 for 4 days (B,E–H) or 3 days (C,D) with TH17 inducing conditions (TGFβ+IL-6+IL-23) or as indicated. PFK1-L (liver), PFK1-P (platelet), PFK1-M (muscle). (G) Co-incubation with doxycycline in vitro. (H) Doxycycline treatment in vivo, with Mgat1f/ftetO-Cre+ROSArtTA cells in right panel gated on L-PHA− population. (B,E–H) gated on CD4+. (B,D–H) Unpaired two tailed t-test with Welch’s (E) and Bonferroni corrections (B,E). **p<0.01; ***p<0.001. Data are mean ± s.e.m of triplicate cultures and representative of n ≥ 3 experiments. MFI, mean fluorescence intensity.
Figure 1—figure supplement 1
N-glycan branching controls TH17 versus iTreg cell fate.
(A–F) Flow cytometry (A,B,E,F), real-time qPCR (C) and UDP-GlcNAc LC-MS/MS analysis (D) of purified mouse splenic CD4+ T-cells activated with anti-CD3+anti-CD28 under TH17 inducing conditions (TGFβ+IL-6+IL-23) for 3 days (D) or 4 days (A,B,E,F) or as indicated (C). (A) gated on CD4+IL-17A- or CD4+IL-17A+ as indicated. (B,E,F), gated on CD4. (B) Lactose (50 mM) is an inhibitor of galectin binding to branched N-glycans. (A,B,F) Unpaired two tailed t-test (B) with Bonferroni corrections (A,F). *p<0.05; **p<0.01; ***p<0.001. Data are mean ± s.e.m and n = 3. MFI, mean fluorescence intensity.
Figure 1—figure supplement 2
N-glycan branching controls TH17 versus iTreg cell fate.
(A–C) Flow cytometry of purified mouse splenic CD4+ T-cells activated with anti-CD3+anti-CD28 under TH17 inducing conditions (TGFβ+IL-6+IL-23) or as indicated for 4 days. Gated on CD4+. (C) Unpaired two tailed with Bonferroni corrections. *p<0.05; **p<0.01; ***p<0.001. Data are mean ± s.e.m and n = 3. MFI, mean fluorescence intensity.
Figure 2 with 1 supplement

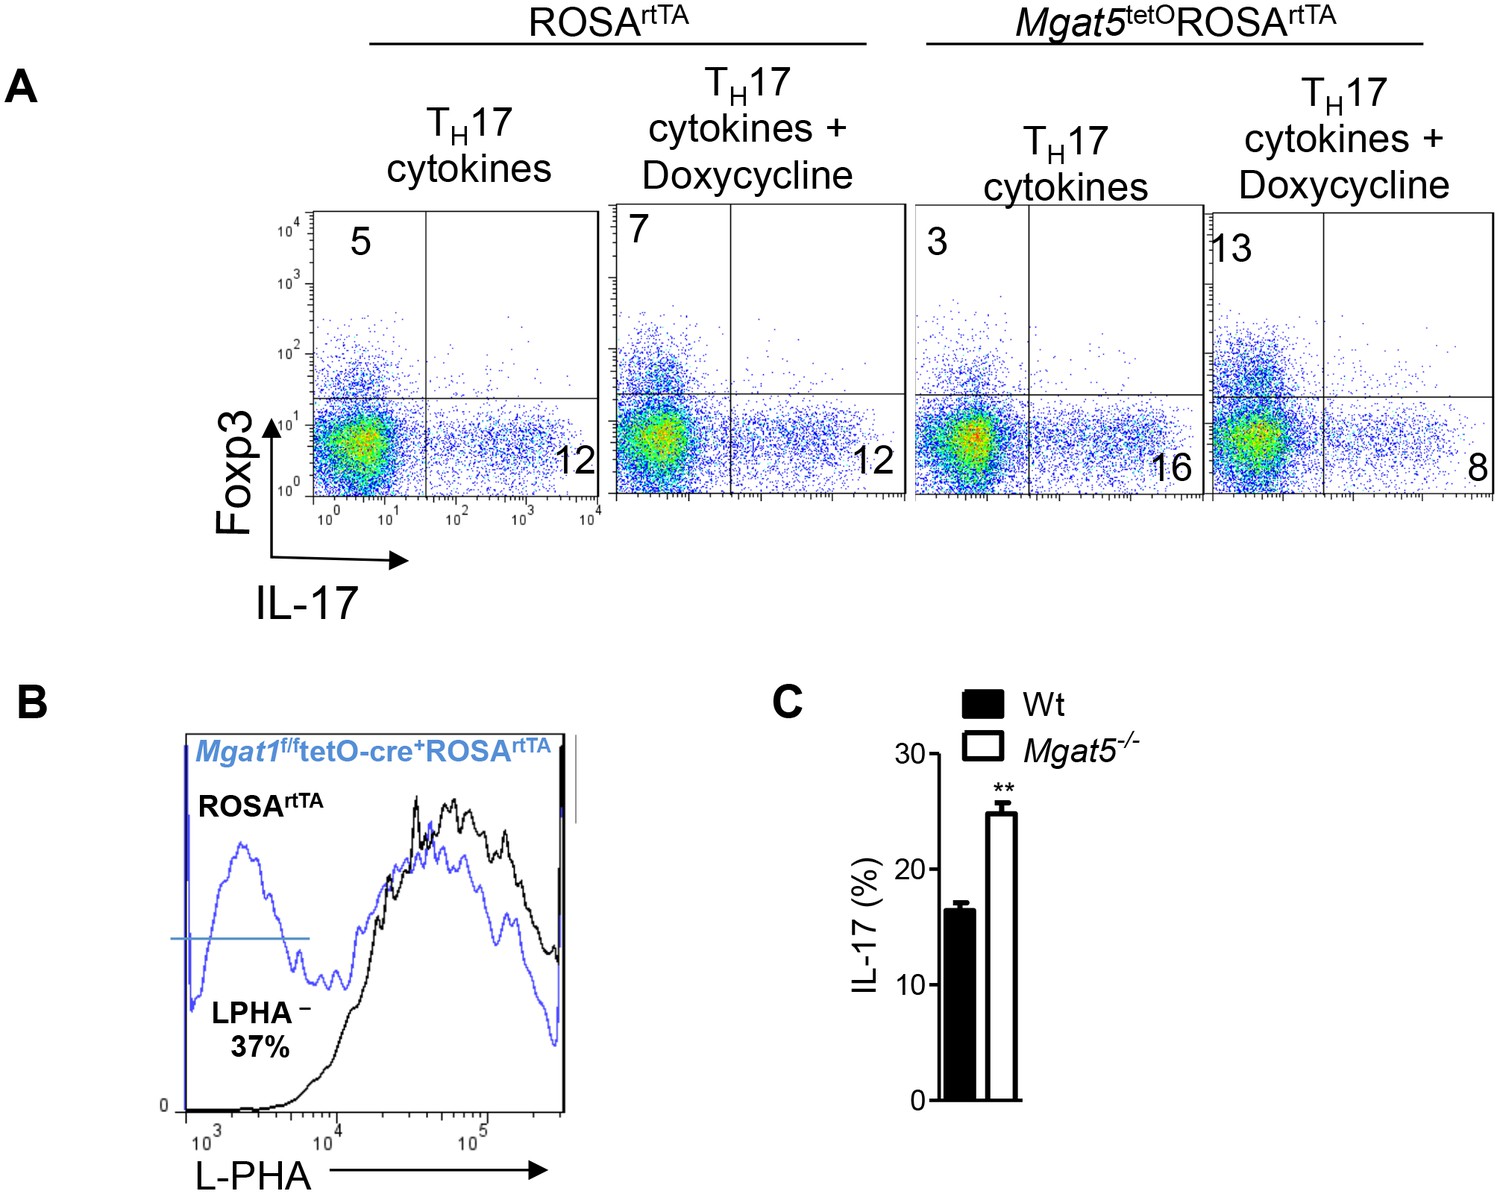
N-glycan branching controls TH17 versus iTreg cell fate via IL-2Rα (CD25).
(A–F) Flow cytometry (A–C,E,F) and Western blot (D) analysis of mouse splenic CD4+ T-cells activated with anti-CD3+anti-CD28 under TH17-inducing conditions (TGFβ+IL-6+IL-23) for 3 days (D) or 4 days (A–C,E,F); cells gated on CD4+. (A,F) Doxycycline treatment in vivo with Mgat1f/ftetO-Cre+ROSArtTA cells gated on L-PHA− population. (C) CD25 MFI in Mgat5tetOROSArtTA CD4+ T cells normalized to ROSrtTA CD4+ T cells, both treated in vitro with doxycycline. (E,F) ratio of IL-17A+ to FoxP3+ CD4+ cells. (A,B,E,F) Unpaired two-tailed t-test with Welch’s (A,E) and Bonferroni corrections (E,F). (C) Linear regression. *p<0.05; **p<0.01; ***p<0.001. Data are mean ± s.e.m of triplicate cultures and representative of n ≥ 3 experiments. MFI, mean fluorescence intensity.
Figure 2—figure supplement 1
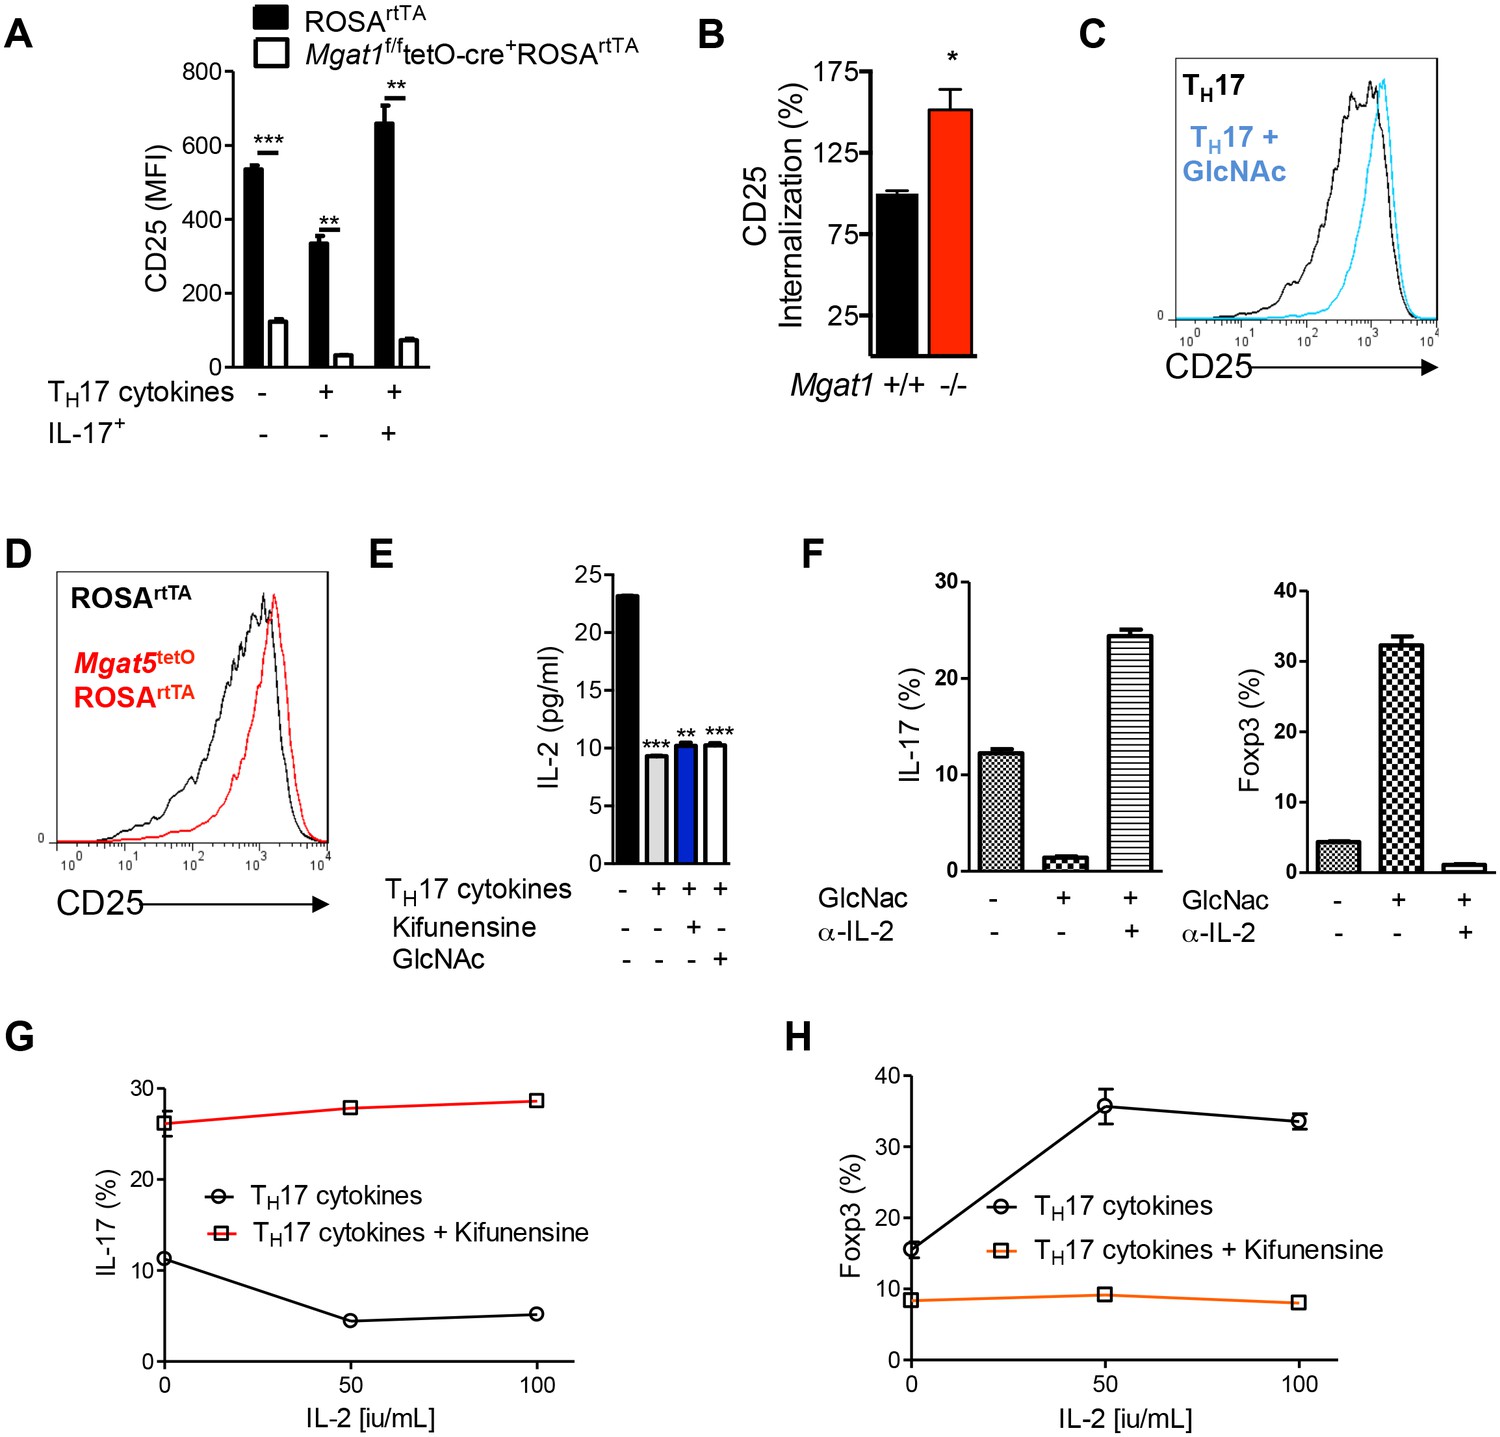
N-glycan branching controls TH17 versus iTreg cell fate via IL-2Rα (CD25).
(A–D,F–H) Flow cytometry of purified mouse splenic CD4+ T-cells activated with anti-CD3+anti-CD28 under TH17 inducing conditions (TGFβ+IL-6+IL-23) or as indicated for 4 days. (D) Co-incubation with doxycycline in vitro. (A–C,D,F–H) gated on CD4+. (A,B) Mice treated with doxycycline in vivo, Mgat1f/ftetO-Cre+ROSArtTA gated on L-PHA- cells. (A) Gated on CD4+IL-17A- or CD4+IL-17A+ as indicated. (B) Endocytosis analyzed by flow cytometry for CD25 internalization. Internalized percentage (MFI (internalized) / MFI (total) × 100%), normalized to control. (D) ELISA analysis of supernatant from purified mouse splenic CD4+ T-cells activated with anti-CD3+anti-CD28 under TH17-inducing conditions (TGFβ+IL-6+IL-23) as indicated for 4 days. (A,B,E) Unpaired two-tailed t-test with Welch’s (A) and Bonferroni corrections (E). *p<0.05; **p<0.01; ***p<0.001. Data are mean ± s.e.m and n = 3, except n = 2 for (B). MFI, mean fluorescence intensity.
Figure 3 with 1 supplement
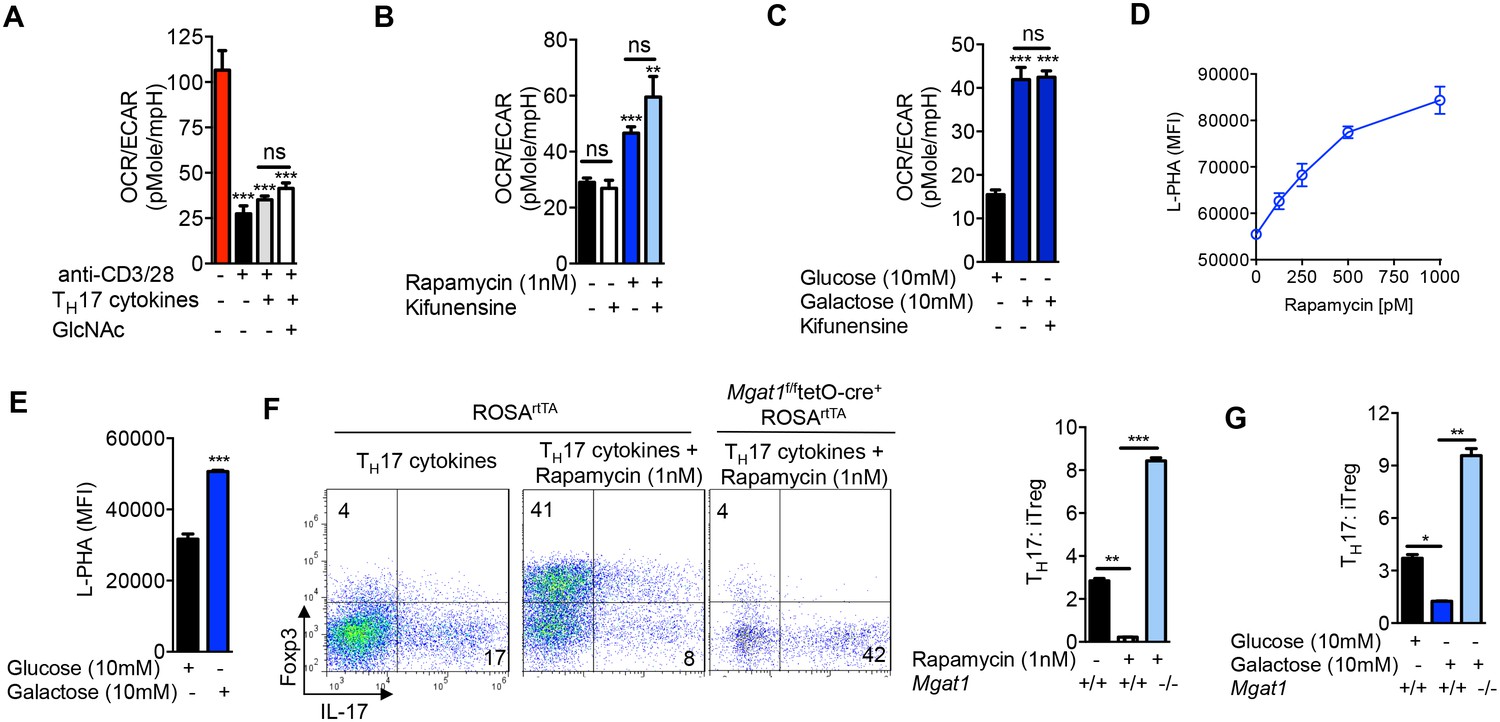
Glycolysis promotes TH17 over iTreg cell fate by inhibiting N-glycan branching.
(A–C) Ratio of the oxygen consumption rate (OCR) to the extracellular acidification rate (ECAR) of purified splenic CD4+ T cells at rest or activated with anti-CD3+anti-CD28 for 2 days with TH17 cytokines (TGFβ+IL-6+IL-23) or as indicated. (D–G) Flow cytometry analysis of purified mouse splenic CD4+ T-cells activated with anti-CD3+anti-CD28 for 4 days under TH17-inducing conditions (TGFβ+IL-6+IL-23). (F (right panel), G) ratio of IL-17A+ to Foxp3+ CD4+ T cells, with Mgat1f/ftetO-Cre+ROSArtTA cells gated on L-PHA- population. *p<0.05; **p<0.01; ***p<0.001. NS, not significant. (A–G), Unpaired two-tailed t-test with Welch's (B,C,F,G) and Bonferroni correction (A–C,F,G). Data are mean ± s.e.m and n = 3. MFI, mean fluorescence intensity.
Figure 3—figure supplement 1

Glycolysis promotes TH17 over iTreg cell fate by inhibiting N-glycan branching.
(A) Flow cytometry analysis of purified splenic CD4+ T cells activated with anti-CD3+ anti-CD28 for 2 days with TH17 cytokines and as indicated for 1 hr with 2-NBDG. (B) Oxygen Consumption Rate (OCR) and the Extracellular Acidification Rate (ECAR) of purified splenic CD4+ T cells at rest or activated with anti-CD3+anti-CD28 for 2 days with/without TH17 cytokines (TGFβ+IL-6+IL-23) as indicated. (C–G) Flow cytometry (C,D,F,G) and Western blot (E) analysis of purified mouse splenic CD4+ T-cells activated with anti-CD3+anti-CD28 under TH17-inducing conditions (TGFβ+IL-6+IL-23). Gated on CD4+ T cells. *p<0.05; **p<0.01; ***p<0.001. (A–D,F,G) Unpaired two-tailed t-test with Welch's (B–D) and Bonferroni correction (A–D). Data are mean ± s.e.m and n = 3. MFI, mean fluorescence intensity.
Figure 4 with 1 supplement
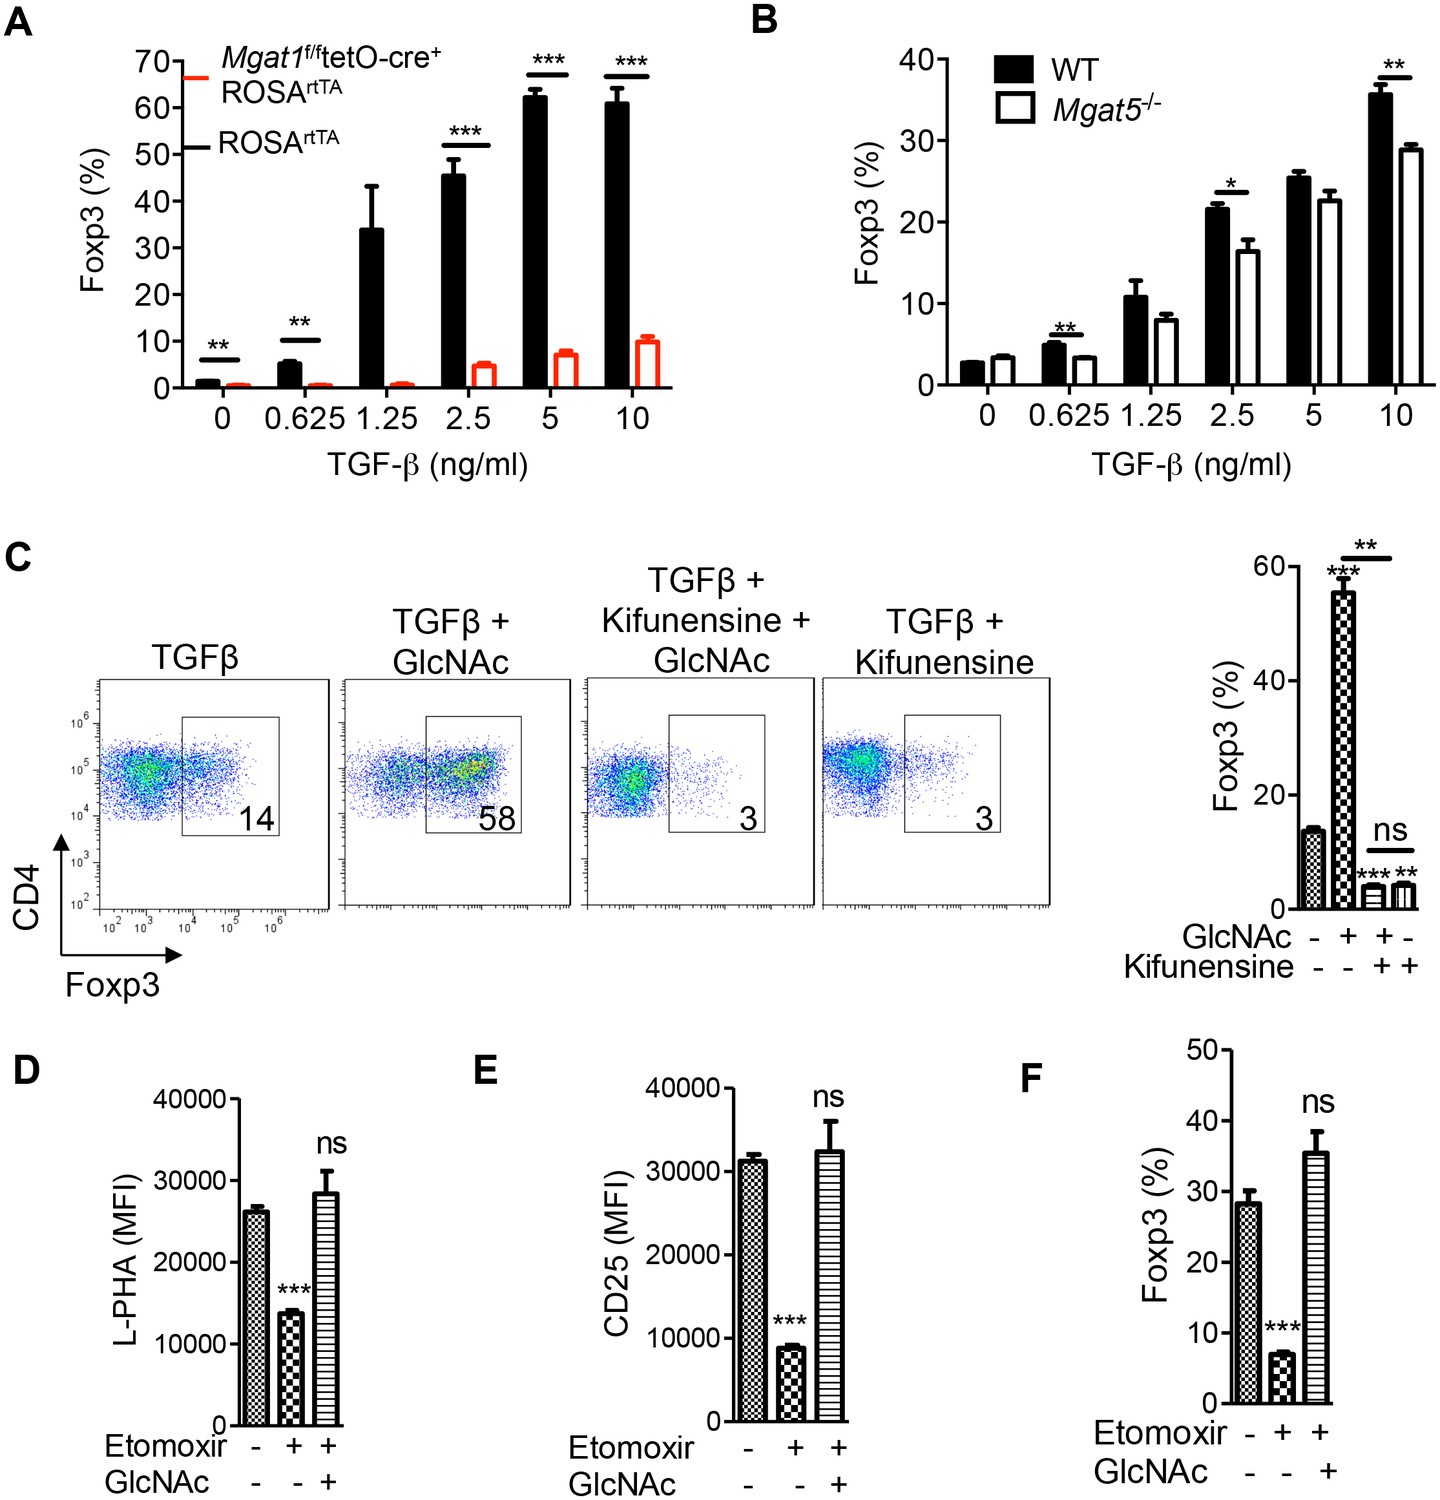
Oxidative phosphorylation promotes iTreg generation by enhancing N-glycan branching.
(A–F) Flow cytometry of purified splenic CD4+ T cells activated with anti-CD3+anti-CD28 and TGFβ1 for 4 days; gated on CD4+. (A), Mgat1f/ftetO-Cre+ROSArtTA cells gated on L-PHA- population from mice treated with doxycycline in vivo. *p<0.05; **p<0.01; ***p<0.001. (A–F) Unpaired two-tailed t-test with Bonferroni (C–F) and Welch’s (C,E,F) correction. Data are mean ± s.e.m and n = 3. MFI, mean fluorescence intensity.
Figure 4—figure supplement 1
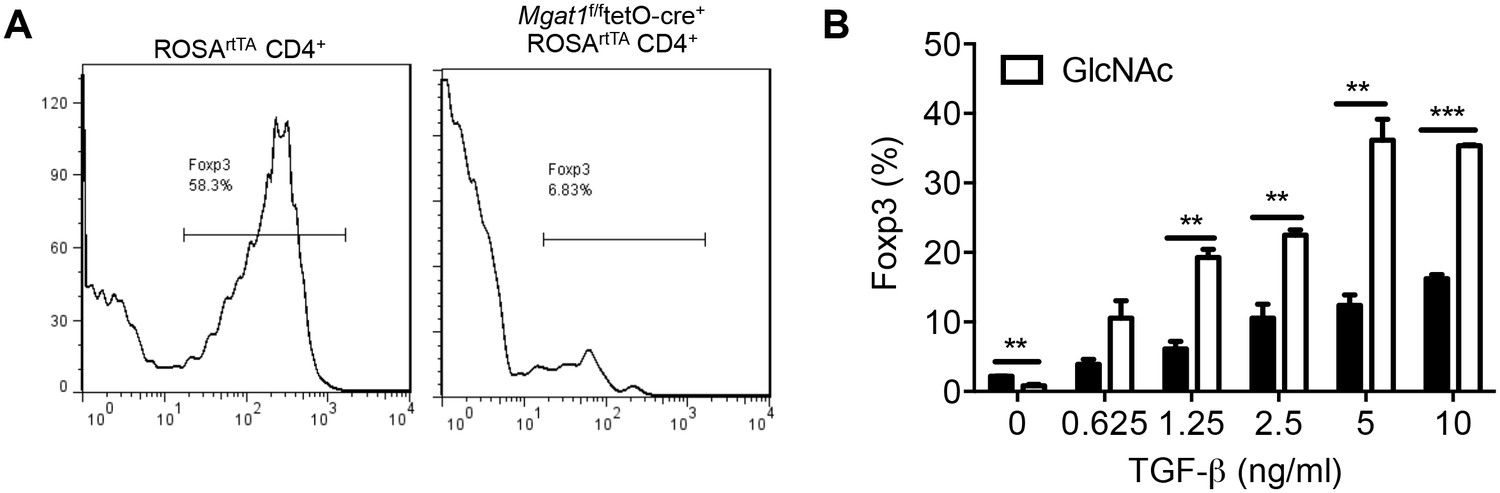
Oxidative phosphorylation promotes iTreg generation by enhancing N-glycan branching.
(A,B) Flow cytometry of purified splenic CD4+ T cells activated with anti-CD3+anti-CD28 and TGFβ1 for 4 days; gated on CD4+. (A) Mgat1f/ftetO-Cre+ROSArtTA cells gated on L-PHA- population from mice treated with doxycycline in vivo. *p<0.05; **p<0.01; ***p<0.001. (B) Unpaired two-tailed t-test; data are mean ± s.e.m. n = 3.
Figure 5 with 1 supplement

Glycolysis promotes T cell growth by inhibiting N-glycan branching.
(A–C) Flow cytometry of purified splenic CD4+ T cells activated with anti-CD3 for 3 days, gated on CD4+. (B,C) Proliferation measured by CFSE dilution. *p<0.05; **p<0.01; ***p<0.001. (A) Unpaired two-tailed t-test with Bonferroni correction. Data are mean ± s.e.m of triplicate cultures and representative of n = 3 experiments. MFI, mean fluorescence intensity.
Figure 5—figure supplement 1

Glycolysis promotes T cell growth by inhibiting N-glycan branching.
Flow cytometry of CFSE-labeled splenic CD4+ T cells activated with anti-CD3 for 3 days, gated on CD4+. n = 3.
Figure 6 with 1 supplement
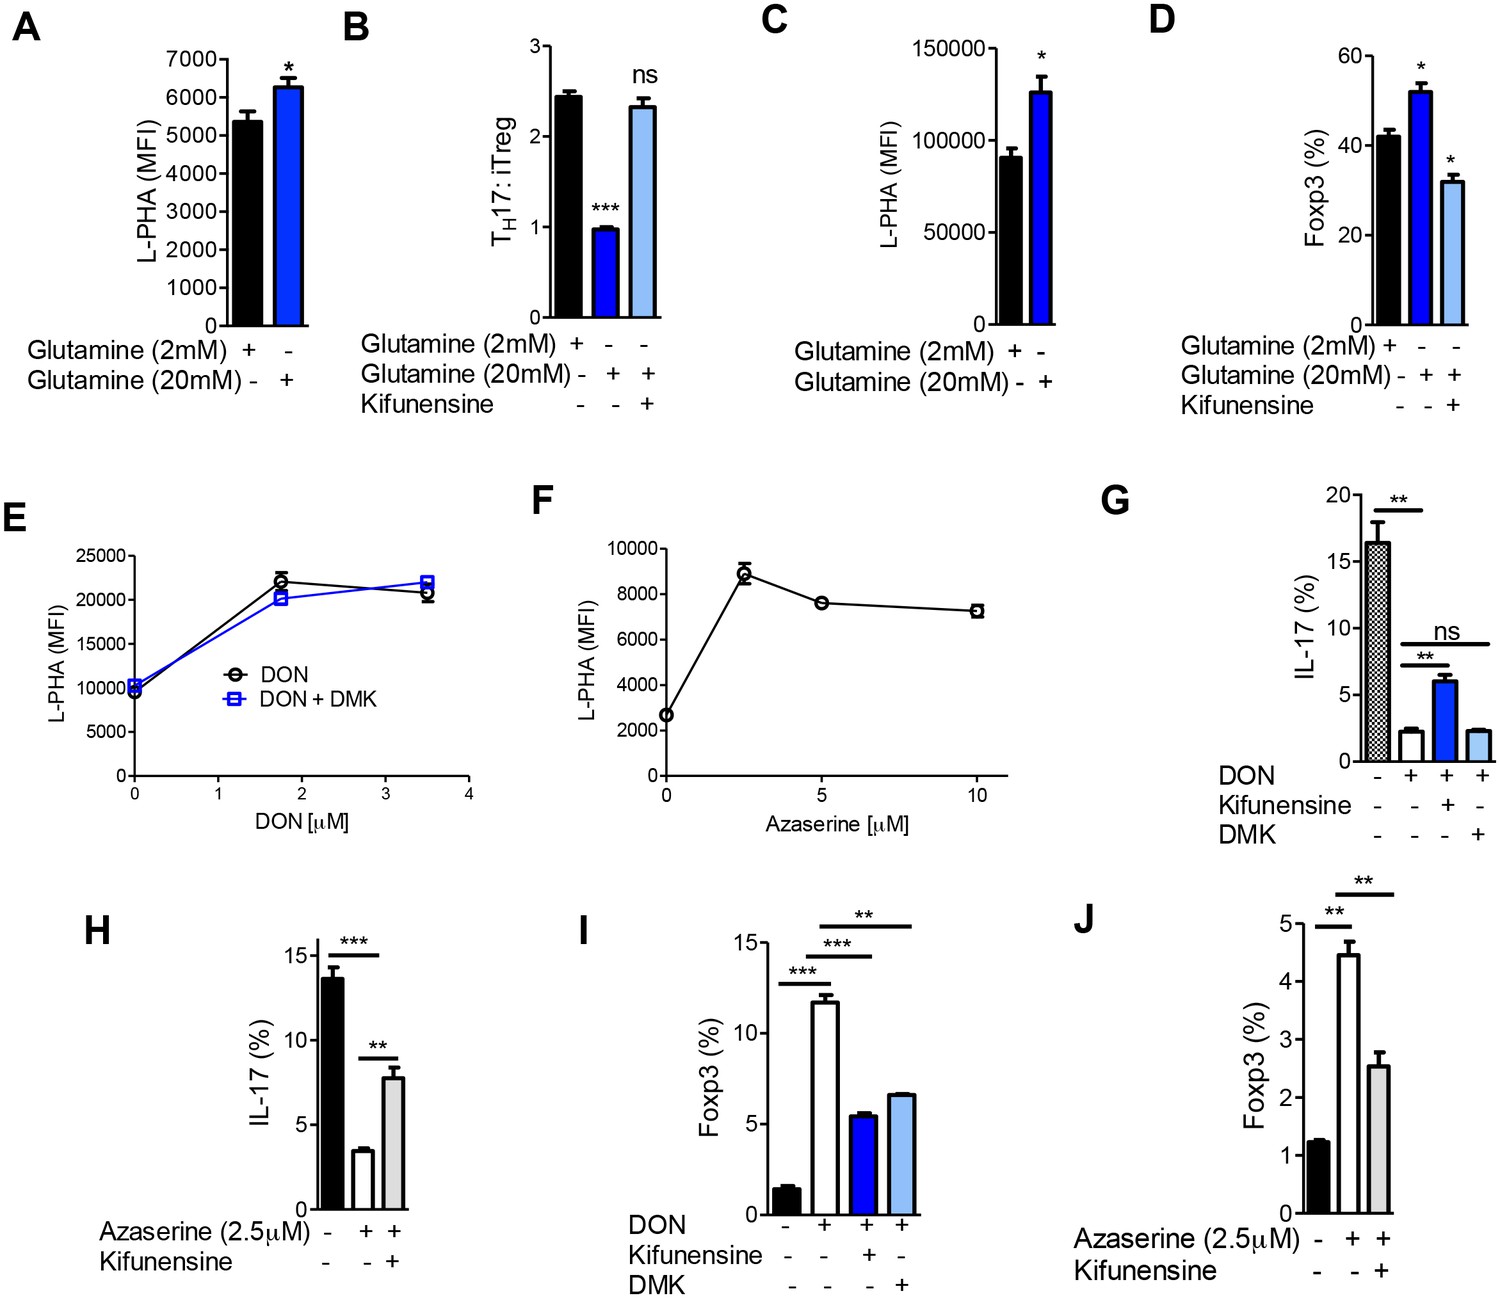
Glutaminolysis promotes TH17 over iTreg cell fate by inhibiting N-glycan branching.
(A–J) Flow cytometry of purified splenic CD4+ T cells activated with anti-CD3+anti-CD28 under TH17-inducing conditions (TGFβ+IL-6+IL-23) (A,B,E–J) or in the presence of TGFβ (C,D). Gated on CD4+. *p<0.05; **p<0.01; ***p<0.001. (A–D,G–J) Unpaired one-tailed t-test with Welch's (G,I,J) and Bonferroni (B,D,G–J) correction. Data are mean ± s.e.m and n = 3. MFI, mean fluorescence intensity.
Figure 6—figure supplement 1
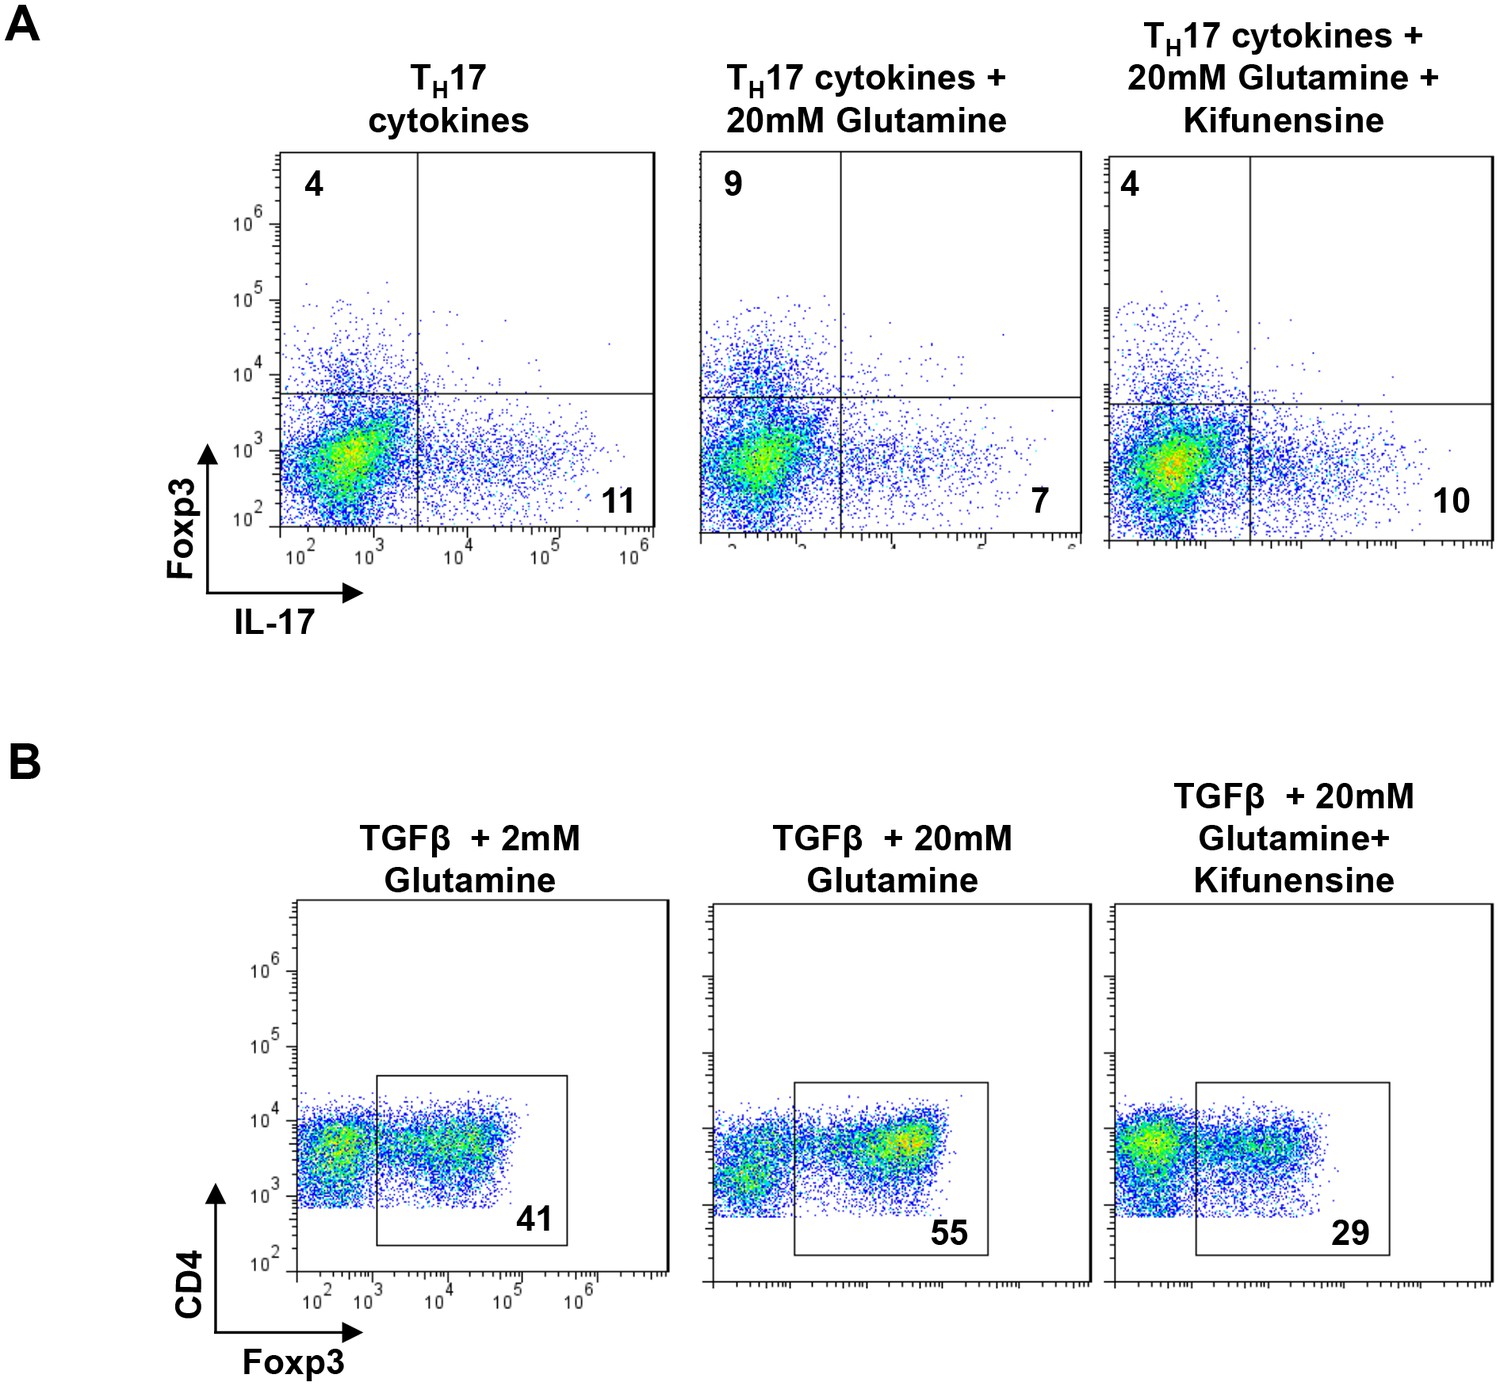
Glutaminolysis promotes TH17 over iTreg cell fate by inhibiting N-glycan branching.
(A,B) Flow cytometry of purified splenic CD4+ T cells activated with anti-CD3+anti-CD28 under TH17-inducing conditions (TGFβ+IL-6+IL-23) (A) or in the presence of TGFβ (B). Gated on CD4+. n = 3.
Download links
A two-part list of links to download the article, or parts of the article, in various formats.
Downloads (link to download the article as PDF)
Open citations (links to open the citations from this article in various online reference manager services)
Cite this article (links to download the citations from this article in formats compatible with various reference manager tools)
Glycolysis and glutaminolysis cooperatively control T cell function by limiting metabolite supply to N-glycosylation
eLife 6:e21330.
https://doi.org/10.7554/eLife.21330


