Regulation of signaling directionality revealed by 3D snapshots of a kinase:regulator complex in action
- Institut Pasteur de Montevideo, Uruguay
- Universidad de Buenos Aires, Argentina
- Institut Pasteur, France
Figures
Figure 1 with 1 supplement
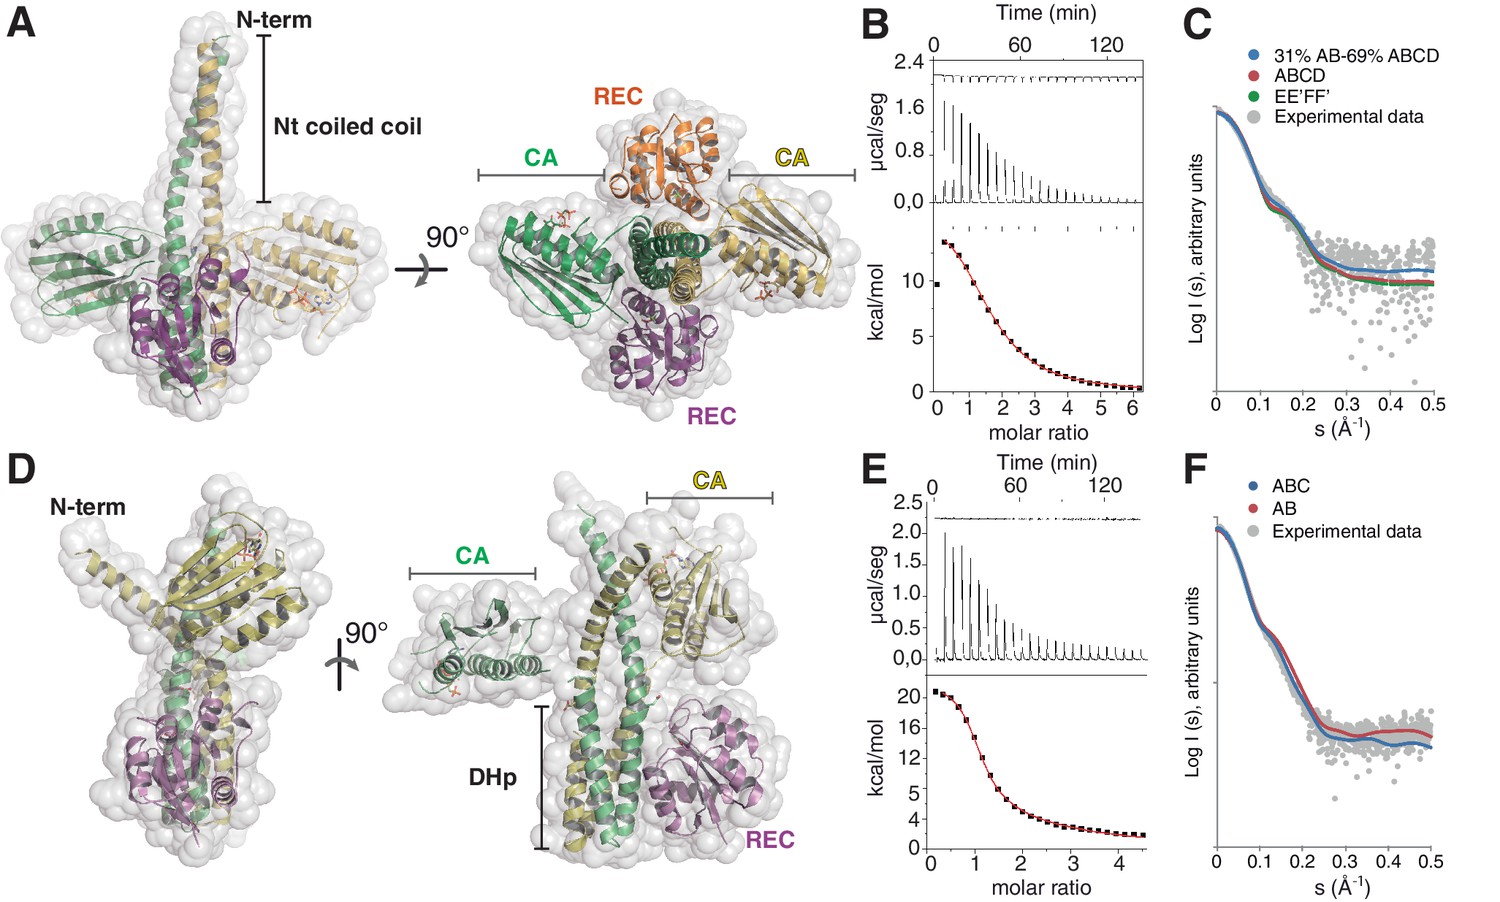
The phosphatase and the phosphotransferase complexes: crystal structures and stoichiometries in solution.
(A) Cartoon representation of the DesKCSTAB:DesR-REC (phosphatase) complex, along two orthogonal views (left and right subpanels). The two chains within the DesKCSTAB dimer are depicted in green and yellow, and the two DesR-REC molecules, in magenta and orange. Solvent exposed surfaces are shown in transparent gray. (B) Isothermal titration calorimetry (ITC) of the phosphatase DesKCH188V:DesR-REC binding reaction, top panel showing the raw heat flow data; in the bottom, integrated heat exchange as a function of RR(monomer):HK(dimer) molar ratio. ITC was performed with the mutant DesKCH188V, equivalently trapped in the phosphatase state (Albanesi et al., 2009), because DesKCSTAB was insoluble when not co-expressed with DesR-REC. (C) X ray scattering curve for the DesKCSTAB:DesR-REC complex. Experimental data are plotted as gray dots, with theoretical curves overlaid as colored lines, revealing best fitting for the AB+ABCD mixture (see Table 4). Letters distinguish protomer chains: DesKCSTAB dimers AB and EE’ (primed labels distinguish crystallographically related partners) and DesR-REC monomers C, D, F and F’. (D) Cartoon representation of the DesKCH188E:DesR-REC (phosphotransferase) complex, along two orthogonal views (left and right subpanels). Coloring scheme and solvent exposed surface displayed as in (A). (E) ITC of the DesKCH188E:DesR-REC binding reaction, details as in (B). (F) SAXS curve for the DesKCH188E:DesR-REC complex, details as in (C). Note best fitting with a one dimer DesKCH188E (chains AB) to one monomer DesR-REC (chain C) model (see Table 4).
Figure 1—figure supplement 1
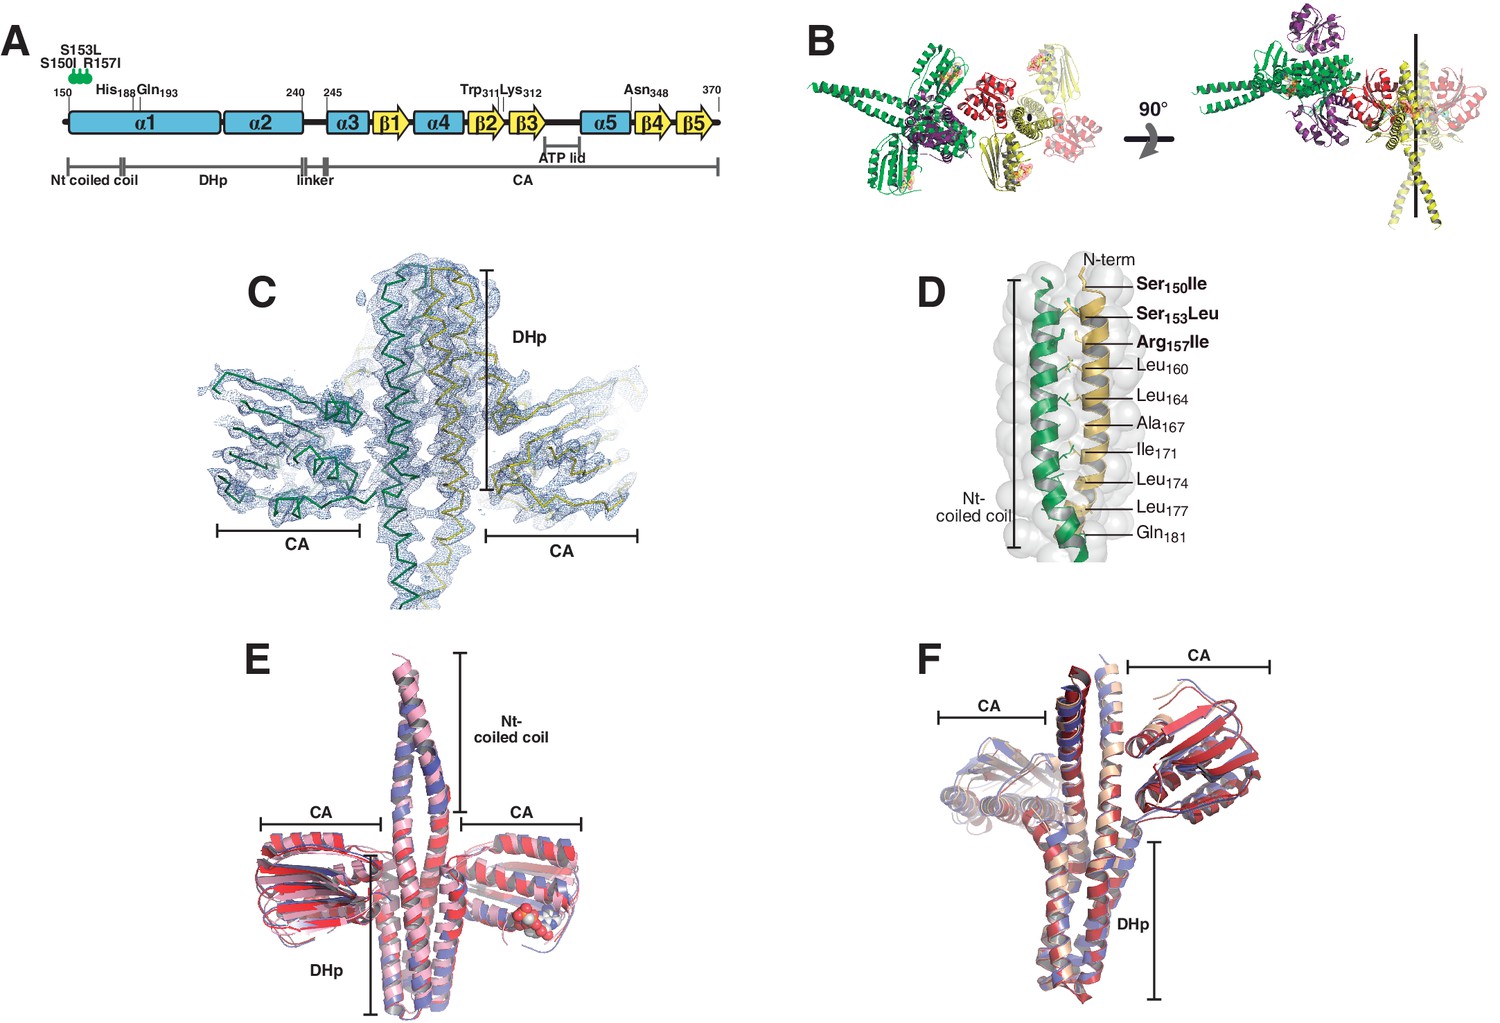
Phosphatase and phosphotransferase complexes: structural details.
(A) Schematic representation of the DesKCSTAB sequence, indicating the position of the point-mutations designed to stabilize the N-terminal coiled-coil, with secondary structure elements and domains labeled as a positional reference. (B) Crystal structure of the phosphatase complex depicting the contents of the asymmetric unit (one whole 2:2 HK:RR complex and half of a second one) and the crystallographically related moieties that complete the second complex. Solid cartoon representation is used for the ASU components, whereas the half-complex generated by the two-fold symmetry operator is highlighted in transparent colors. The two-fold axis is marked in black. Two orthogonal views are displayed (left and right panels). The N-terminal coiled-coil is formed in one of the complexes present in the asymmetric unit (in green and purple). The second complex shows two alternative conformations towards this N-terminal end, only one of which allowed for confident modeling, revealing a disrupted coiled-coil (in red and yellow). The alternate conformation appears to be forming the coiled-coil structure, but was not included given the weak electron density map. The N-terminal ends of both complexes are establishing crystal contacts with neighboring molecules, and different dehydration treatment of the crystals appear to force this alternative conformation (data not shown). Fitting analysis of the SAXS curves suggests that the closed conformation of the N-terminal end is the most abundant species in solution (see Table 4). (C) SigmaA-weighted 2mFobs-DFcalc Fourier map (blue mesh contoured at 1σ) of the refined phosphatase complex model (ribbon representation, the two protomers are depicted with different colors). The illustration shows the full complex in the ASU, the remaining half-complex is not shown. (D) Close-up of the coiled-coil region within the DHp domain as observed in the phosphatase complex. The structure is represented in cartoons, with the two protomers depicted in green and yellow, and solvent exposed surface in transparent. Special a and d positions within the coiled-coil heptad repeats are labeled. Note that the three engineered mutations of DesKCSTAB (labeled in bold) are contained within the buried core of the α1:α1 coiled-coil, stabilizing it as per design. (E) The DesKCSTAB partner (in pink) was extracted from the phosphatase complex (PDB 5IUN, this report) and superimposed onto previously reported free DesKCH188V structures trapped in the phosphatase-competent state: PDB 3EHH in red (rmsd 1.4 Å on 136 DHp Cα, 2.1 Å on 370 all Cα); and 3EHJ in blue (rmsd 1.7 Å on 154 DHp Cα, 2.5 Å on 390 all Cα). (F) The DesKCH188E partner (in pink) was extracted from the phosphotransferase complex (PDB 5IUK, this report), and superimposed onto wt P~DesKC (PDB 3GIG, in red), resulting in a root mean square deviation of ~0.8 Å (aligning all 920 atoms of the DHp domains). Free DesKCH188E (PDB 3GIF, in blue), previously reported, also reveals an identical conformation.
Figure 2 with 2 supplements
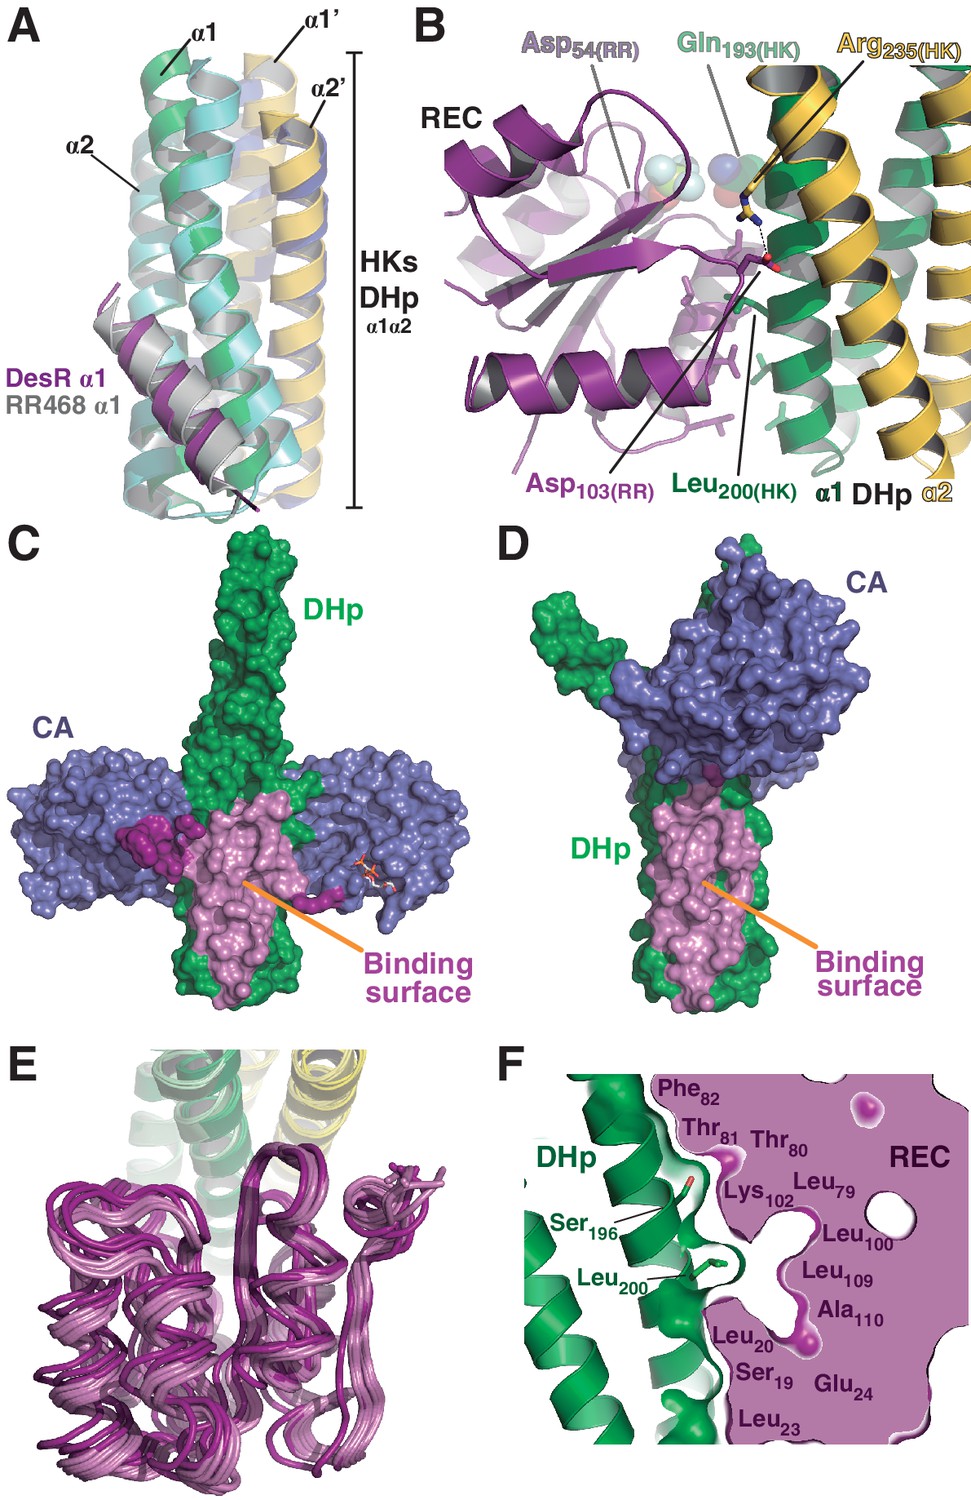
The HK:RR interface and structural variability.
(A) Structural superposition of the DesK:DesR phosphatase complex (this study, PDB 5IUN) with HK853:RR468 from Thermotoga maritima (PDB 3DGE). Only selected structural elements from both partners are shown as cartoons for clarity. The DesK:DesR phosphotransferase complex is overall similar (not shown here). DesK and DesR are illustrated with the same color code as in Figure 1. Superposed T. maritima RR468 helix α1 is shown in gray, and HK853 protomers in cyan and blue. Primed labels distinguish DHp helices from each HK protomer. (B) Close-up of the phosphatase complex DesK:DesR interface showing only a few selected interactions for clarity (see text for detailed description). Coloring scheme as in (A). Note Leu200(HK) inserted into a hydrophobic pocket of DesR, and several other hydrophobic residues completing the interface (not labeled, shown as sticks). Among the polar contacts surrounding the hydrophobic core, Arg235(HK):Asp103(RR) and Gln193(HK):BeF3--modified Asp54(RR), are highlighted. (C) Solvent accessible surface of DesKCSTAB indicating the interaction footprint (in magenta) with DesR in the phosphatase complex. DesK domains are highlighted in green (DHp) and blue (CAs); these domains participate differently in DesR interaction, depicted in light magenta (DHp) and dark magenta (CA). Note the ATP analogue (AMP-PCP, in sticks colored by atom) bound to the CA domains, visible in this view on the rightmost one. (D) Same as (C), but for the phosphotransferase complex, illustrating the DesR-binding surface of DesKCH188E. (E) The variable position of the REC(RR) domain with respect to the DHp(HK) is illustrated, superimposing the structurally invariant region of the DHp (including the nine independently refined DesK:DesR complexes). The coloring scheme is the same as in (A), with light and dark colors distinguishing phosphotransferase and phosphatase complexes, respectively. (F) The solid volume corresponds to DesR-REC, which is shown sliced to highlight its outline, revealing unfilled cavities at the protein:protein interface. The relative position of interfacing amino acids is roughly indicated with residue labels. DesK DHp helices are shown in cartoon representation, with its superposed molecular surface on top. Two key residues on the HK partner are shown as sticks.
Figure 2—figure supplement 1
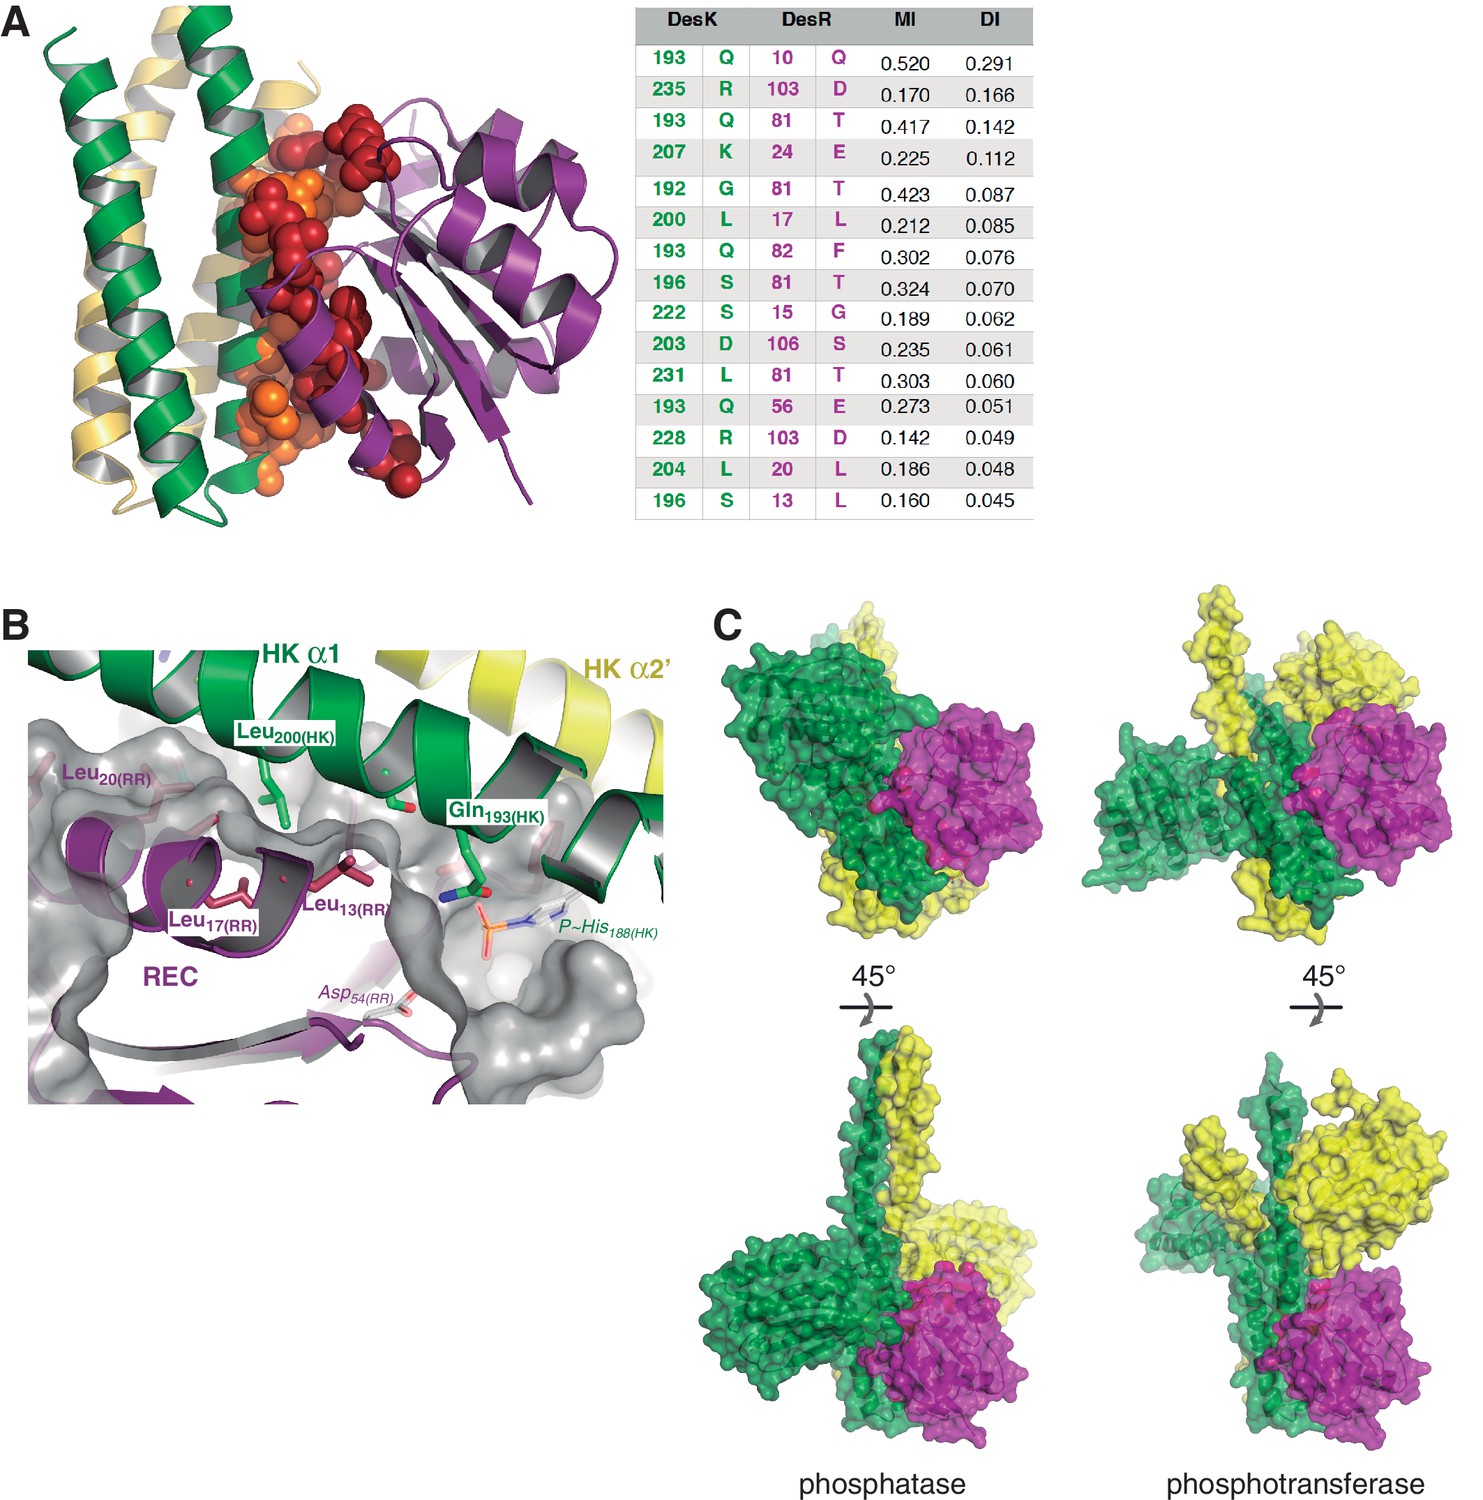
Structural details of the DesK:DesR interface.
(A) Sequence covariance among HK:RR pairs measured by direct coupling analysis. Included HK sequences belong to family HisKA_3, and RRs to family NarL/LuxR (see Materials and methods section for full details). The Table on the right, shows the actual Mutual Information (MI) and Direct Information (DI) figures ranking the highest 15 inter-protein pairs of residues (intra-protein pairs are not shown). The cartoon representation on the left, highlights those 15 pairs as spheres (colored red for DesR and orange for DesK) within the 3D structure of the DesK:DesR phosphotransferase complex shown in cartoon representation (same color scheme as Figure 2B). (B) DesK:DesR interface observed from a different perspective compared to Figure 2B, following the same color scheme. The phosphotransferase complex is shown, with the solvent-exposed surface of DesR shown in semi-transparent gray. The surface highlights the RR pocket that lodges Leu200(HK), further extended into a groove to the right of the figure. This groove ends in the reaction center, referenced by Asp54(RR) and P~His188(HK) (modeled in place after in silico substitution of Glu188(HK)). (C) Complementing Figure 2 (panels C and D), solvent-exposed surface representations of the phosphatase and phosphotransferase complexes, are shown in two orientations (top and bottom panels). The distinct interaction of DesR with the CA domains is evident.
Figure 2—figure supplement 2
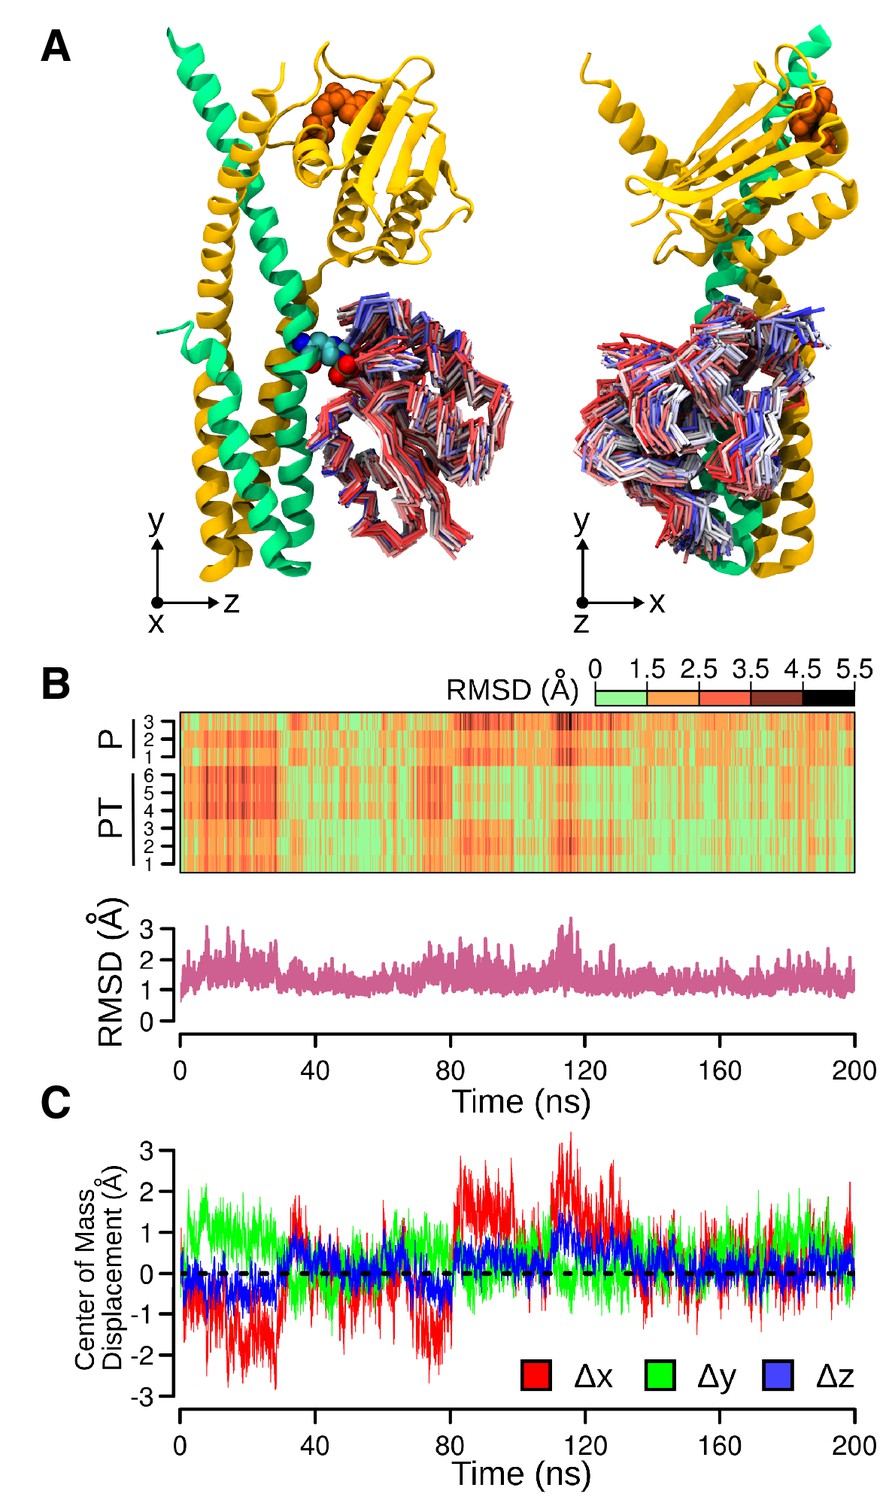
Molecular dynamics (MD) simulation of the phosphotransferase complex.
(A) Molecular representations of the movements of DesR-REC on the DesK:DesR interface. Two orthogonal views are displayed (left and right). The initial conformation of DesK's chains is represented as cartoons in green and yellow, with ATP moieties (orange) and P~His188(HK) residues (colored by atom) shown as spheres. To represent the different structures adopted by DesR-REC during the simulation, a conformation was selected every 5 ns of trajectory, and depicted as tubes. The DesR-REC coloring scheme follows a red-to-blue gradient according to the accumulated simulation time of each model. The system was previously fitted to the invariant region of DesK DHp domain (residues 190–234) and oriented according to the inertial tensor matrix of this domain (XYZ axes are shown at the bottom of each representation). (B) On top, a time-dependent (x-axis) heat-map illustrating the variation of RMSDs of DesR-REC domains of the nine independently refined DesK:DesR complexes (y-axis; P = phosphatase complex, PT = phosphotransferase complex) with respect to the crystallographic starting structure, along the MD trajectories illustrated in panel (A). The RMSDs were always calculated after fitting the MD frames to the invariant region of DesK DHp domain (residues 190–234). Bottom part, minimum RMSD values taken from the heat-map matrix on top. (C) Further quantitative analysis of panel (A), here the relative movement of the DesR-REC domain is revealed plotting its center of mass as displaced from the initial structure (after fitting to the invariant region of DesK DHp domain). The reference XYZ system of coordinates is shown in panel (A).
Figure 3 with 1 supplement
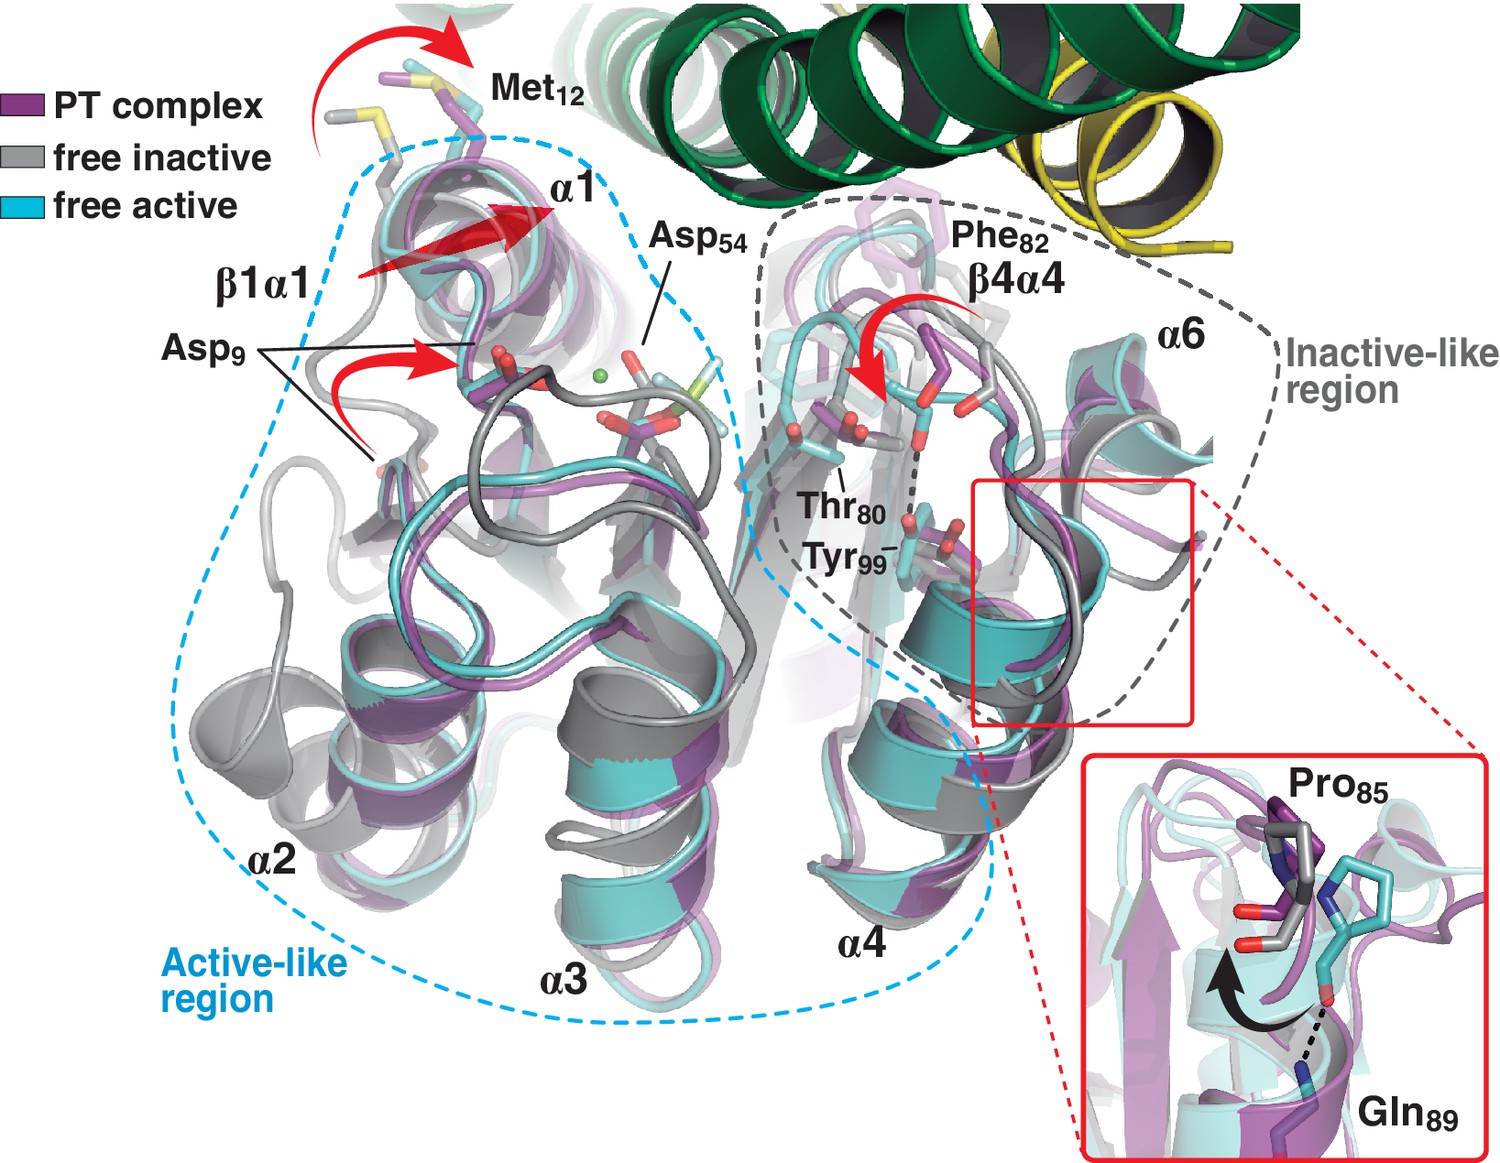
A shared RR REC domain conformation in the phosphatase and phosphotransferase complexes, has active- and inactive-like features.
The phosphotransferase complex (this study, PDB 5IUK) is shown in cartoon representation, following the same coloring scheme as in Figure 2. REC domains from reported free DesR species are shown superposed, in gray the inactive Mg2+-free RR (PDB 4LE1) and the active species in cyan (PDB 4LE0). Note that the complexed form of the regulator (in magenta) is mainly similar to the active species, including in the β1α1 loop and α1 helix (that play key roles in the structuring of the RR’s active site), even though the RR is not phosphorylated on the reactive Asp54(RR). Dashed outlines highlight the regions that most resemble each functional state. Note that the inactive-like region essentially involves the end of β4 and the β4α4 loop, which closes in as a phosphate lid in P~DesR. Phe82(RR) (shown in transparent sticks for clarity) interacts with the HK, playing a role in phosphate lid opening in both phosphatase and phosphotransferase complexes. Tyr99(RR) on strand β5 (the strand is not visible below α4), typically forming a H-bond with the main chain O of Phe82(RR) in activated RRs, is observed farther away in both DesK:DesR complexes, yet another feature of inactive states. Inset: a close-up of the N-terminal tip of helix α4 is shown. The dihedral ψ angle of Pro85(RR) is linked to the active/inactive shift of the β4α4 loop.
Figure 3—figure supplement 1
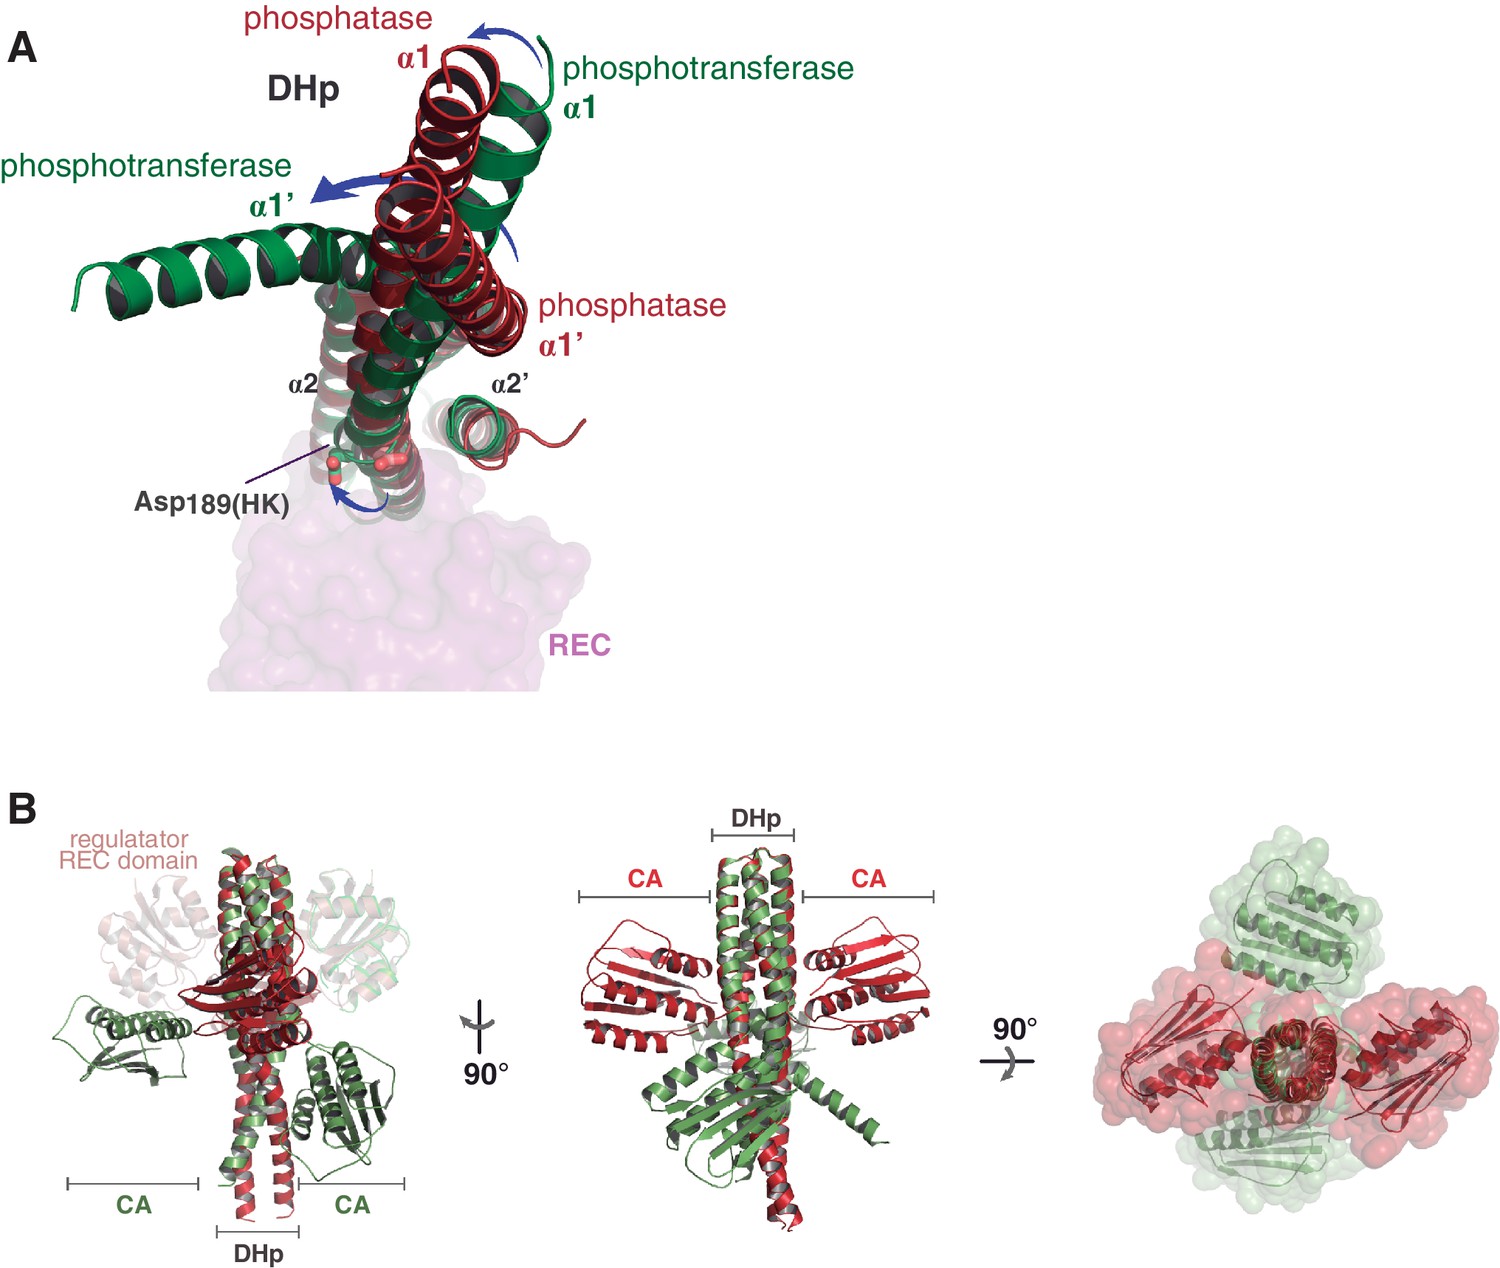
Major structural differences of the HK partner, comparing the phosphatase and phosphotransferase complexes.
(A) Structural superposition of the phosphatase (red) and phosphotransferase (green) complexes, using the invariant region of the DHp domains (residues 190–234). The DHp domains are represented as cartoons, the CA domains are not shown for clarity. The REC domain of DesR is represented in transparent surface representations (magenta), as a reference for the HK:RR interface location. (B) Same superposition and coloring scheme as in (A), except that CA domains are shown, highlighting their dramatic rearrangement in the phosphatase-phosphotransferase transition. Three orthogonal orientations are viewed in the left, central and right panels.
Figure 4 with 3 supplements
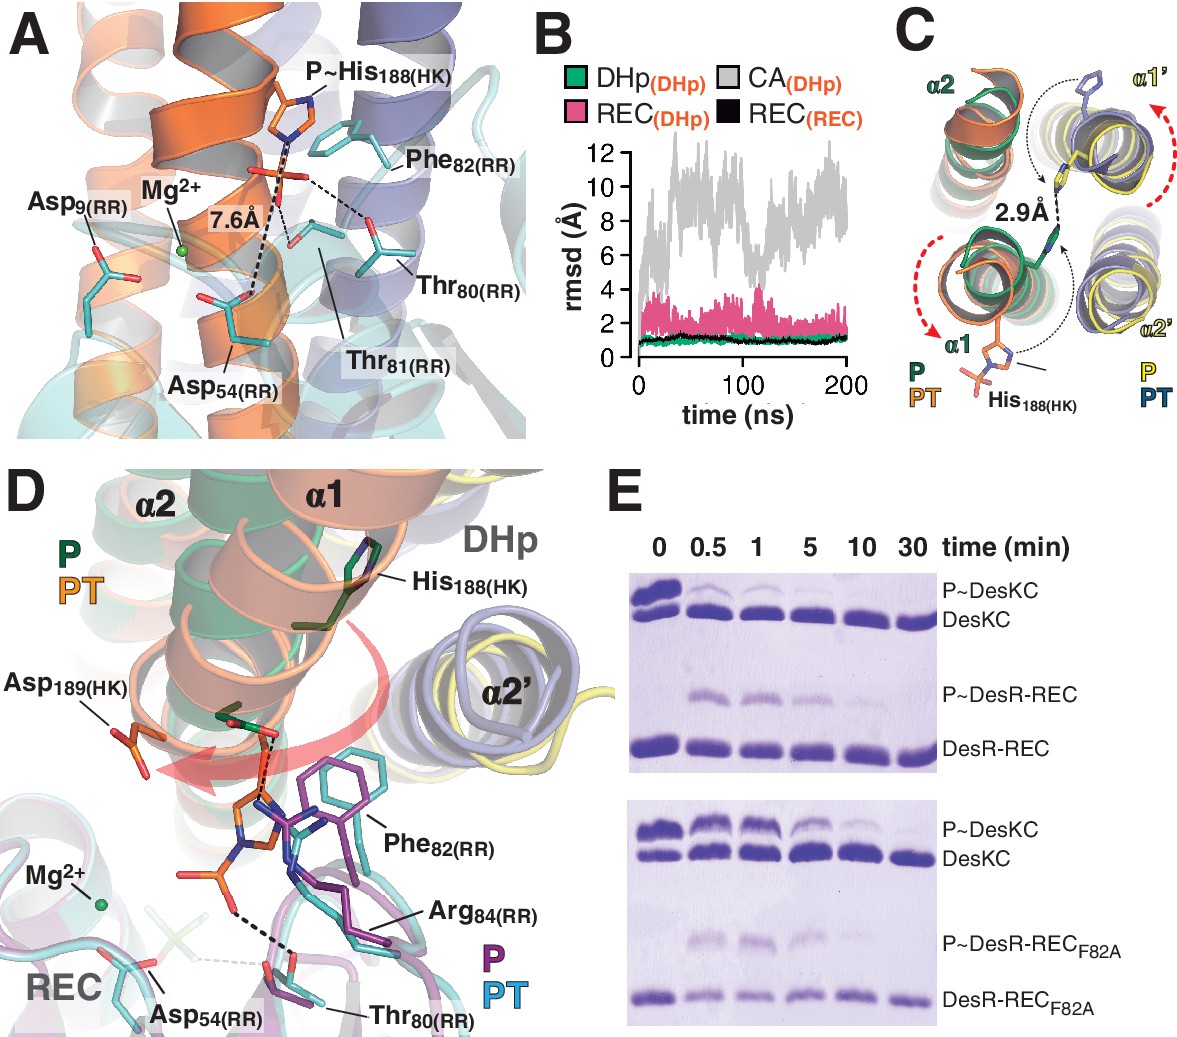
At the reaction center: the phosphatase to phosphotransferase transition.
(A) Cartoon model of the phosphotransferase reaction center prior to DesR phosphorylation (see model construction details the Materials and methods section). DesK protomers (orange and blue) and DesR (cyan, transparent for clarity) are displayed with selected key residues in sticks colored by atom. Mg2+ (green sphere) is already in place, coordinated by the two shown Asp residues and water molecules (not included). Phosphoryl moiety interactions with DesR, and the reactive Asp-His distance are indicated. (B) Evolution of the atomic coordinates of the phosphotransferase complex along molecular dynamics (MD) calculations. Selected HK or RR domains were structurally aligned (marked with orange subscripts on each curve’s label on top), to thereafter compare the evolving MD model with the initial experimental structure (calculating rmsds of chosen domains as marked in black fonts on each curve’s label on top). Resulting rmsds for all Cα atoms of chosen domains are plotted (colored curves) as a function of time. Note that the time lapse is enough to detect large CA mobility (gray curve) whereas the DHp:REC complex remains attached and stable (pink curve). (C) Cartoon illustration of the HK DHp domains of the phosphatase complex (P), with its two HK protomers in green and yellow, superposed onto the phosphotransferase (PT) in orange and blue. Residue His188(HK) (in sticks) reveals the rotational rearrangement between both states. (D) Similar phosphatase vs phosphotransferase illustration as in (C), along a different view. The RR partner is now shown (magenta for the phosphatase complex [P], cyan for the phosphotransferase [PT]). The Arg84(RR):Asp189(HK) salt bridge is disrupted in the PT complex due to the DHp rotational shift (red arrow). Note the shift of the RR β4α4 loop, including Phe82(RR), propagating toward Thr80(RR). The latter is positioned at H-bonding distance to the phosphoryl group either on the P~His or on the P~Asp residue (the BeF3- moiety in the P complex is transparent), with a shift of 1.5 Å of its side chain O atom. (E) Phosphotransfer kinetics comparing wt DesR-REC (top panel) with phosphate lid mutant DesRF82A-REC (bottom panel), revealed by Phos-tag SDS-PAGE.
Figure 4—figure supplement 1
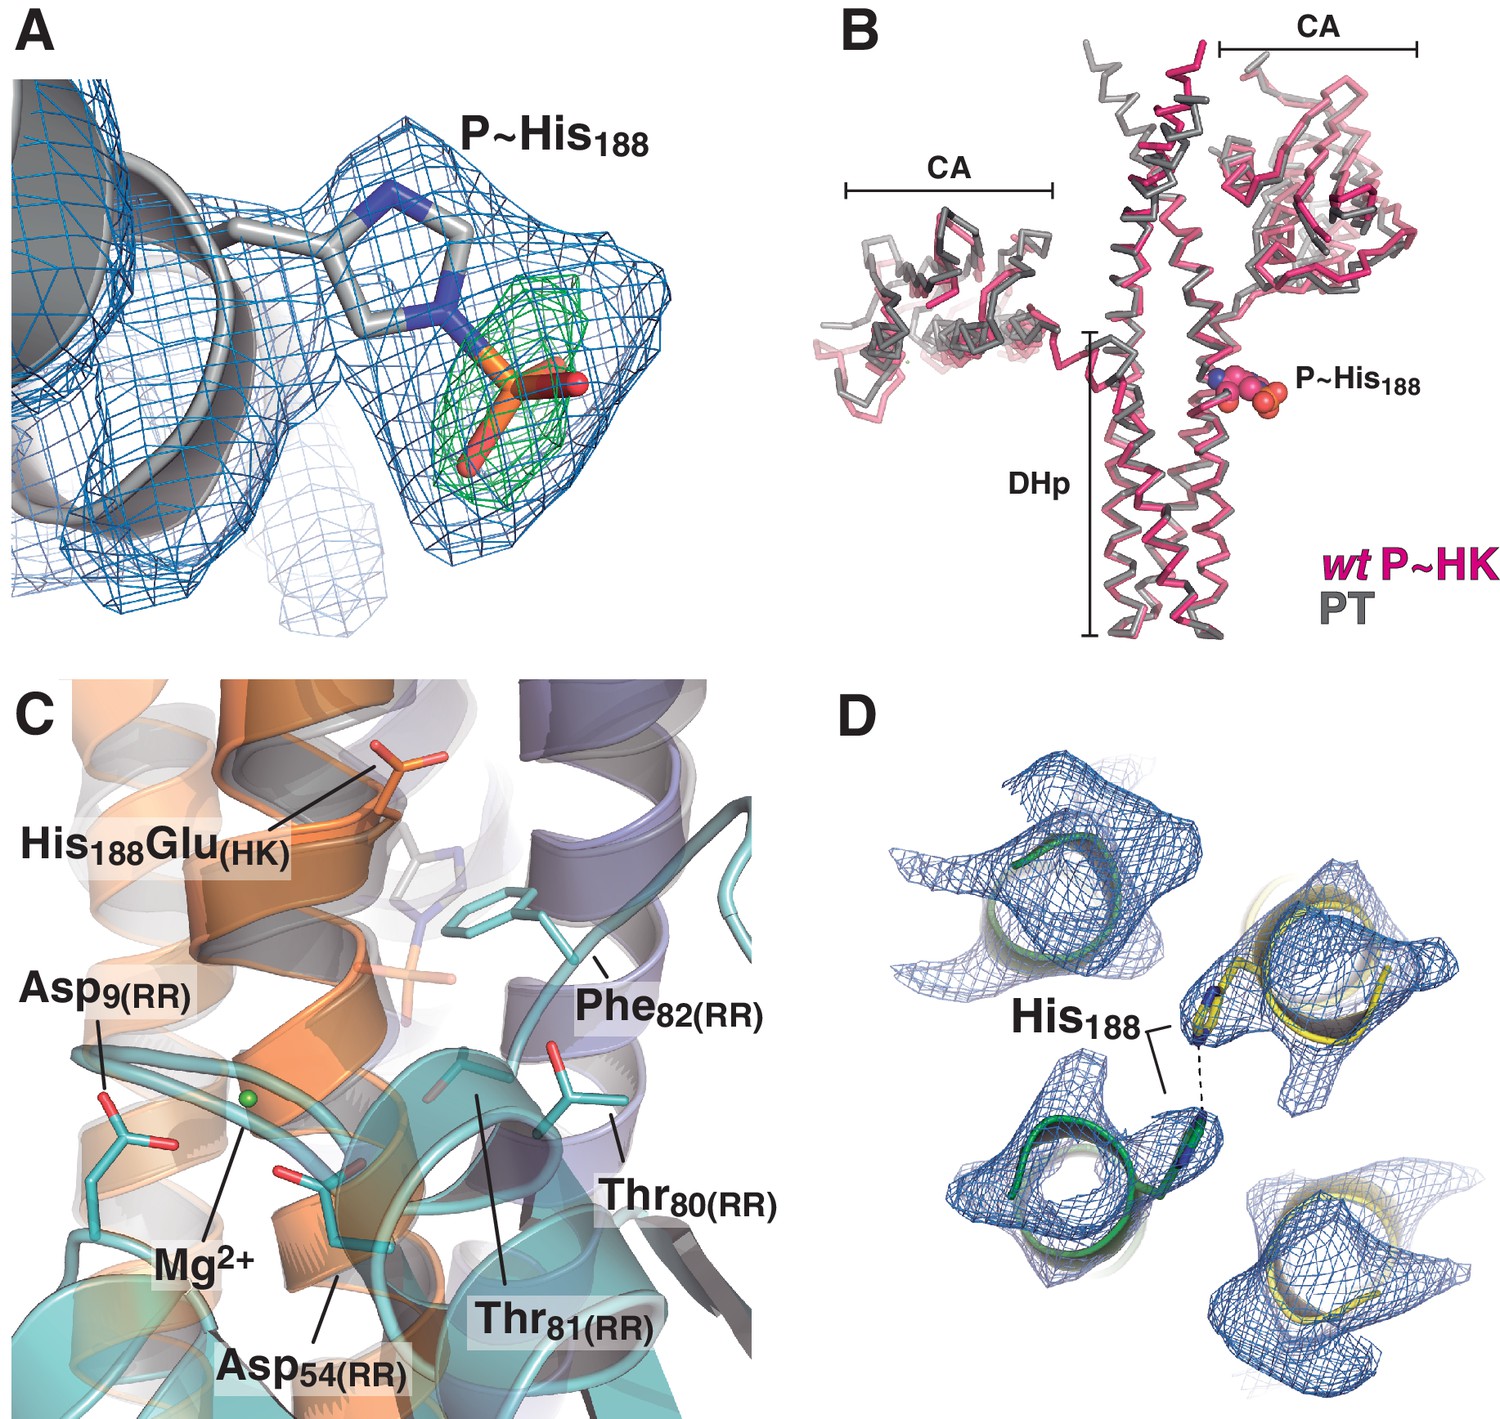
Electron density maps and structural similarity of wt P~DesKC compared to DesKCH188E in the phosphotransferase complex.
(A) Fourier maps are shown with the final wt P~DesKC refined model (cartoon representation only showing DHp helix α1, and the P~His188(HK) in sticks). Maps were calculated with sigmaA-weighted coefficients 2mFobs-DFcalc (blue mesh) and mFobs-DFcalc (green mesh), generated after convergent refinement excluding the phosphoryl moiety. The Fourier difference peak has an rmsd of 5. (B) The DesKCH188E partner (in gray) was extracted from the phosphotransferase complex (labeled PT, chains A and B from PDB 5IUK, this report), and superimposed onto wt P~DesKC (in pink, PDB 5IUM, this report) revealing high global structural similarity (see main text). The P~His188(HK) residue is highlighted in spheres as a spatial reference. (C) Same view and coloring scheme as Figure 4A, highlighting the crystal structure of the phosphotransferase complex (PDB 5IUK, this report). The RR is rendered semi-transparent to allow for better visualization of selected residues (in solid sticks). The model whereby the DesKCH188E partner (from PDB 5IUK) has been substituted by the superposed wt P~DesKC (from PDB 5IUM), is shown as a transparent cartoon. The P~His188(HK) residue is shown in transparent sticks representation. This model was minimized to adjust minor clashes (full details in Materials and methods) and thereafter used for structural analyses of the phosphotransferase reaction center (see Figure 4A). (D) Representative sigmaA-weighted 2mFobs-DFcalc Fourier map (contoured at 1σ) of the refined phosphatase complex model, centered on the DHp domain at the level of the reactive His188(HK) (shown as sticks), other residues have been excluded from the illustration for greater clarity. The DHp helices are shown as cartoons (the two HK protomers depicted in green and yellow). The HK CA domains and the associated DesR-REC domains in the complex are not shown for clarity.
Figure 4—figure supplement 2
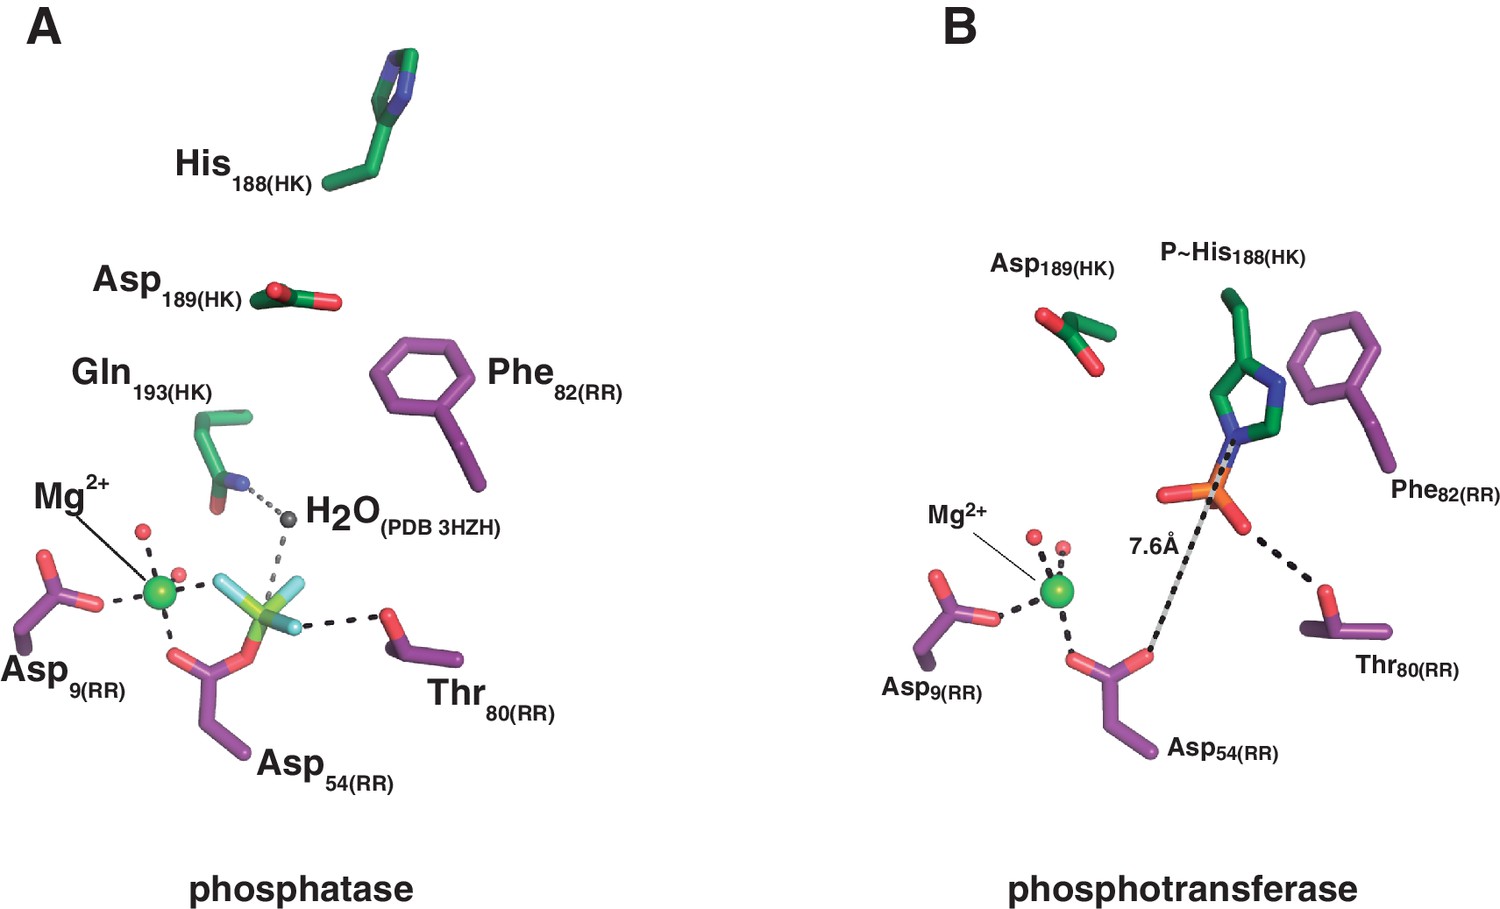
Structural details of the reaction centers.
(A) Active site for the dephosphorylation reaction, according to the phosphatase complex structure (this study, PDB 5IUN). For clarity only the relevant residues’ side chains are shown (in stick representation, with carbon atoms in green for the kinase, and purple for the regulator). The magnesium atom is shown as a green sphere within its coordination site in the regulator, with five of the six coordination bonds depicted as dashed lines: two water molecules (small red spheres), the side chain oxygens of aspartates 9 and 54, and an oxygen of the phosphoryl group bonded to the reactive Asp54(RR) (the phosphoryl group in the structure is actually a BeF3- mimicking the ortho-phosphoryl moiety, so that the Mg2+-chelating atom is fluorine, in light blue). The sixth Mg2+-coordinating atom is the main chain oxygen of Glu56(RR), not shown here for clarity. The water molecule (gray sphere) was not observed in the structure, it is here modeled after superposition of the CheX:CheY3 complex (PDB 3HZH). The figure shows the side chain nitrogen from Gln193(HK) positioning the catalytic water (this Gln rotamer was chosen according to H-bonds with Lys102(RR) and one of the Mg2+-coordinating water molecules, as observed in the structure, but the Gln193(HK) side chain could easily flip so that the amide oxygen eventually assists the catalytic water as a nucleophile to attack the phosphorus atom). The H-bond between the side chain oxygen of Thr80(RR) and the phosphoryl group is also highlighted with a dashed line, to be compared with panel (B). (B) Active site for the phosphoryl-transfer reaction, according to the phosphotransferase complex structure (this study, PDB 5IUK). Similar orientation view and coloring scheme as in panel (A). Glu188(HK) is shown here as a P~His after superposition of the wt P~DesKC structure (this study, PDB 5IUM) and substitution of the Glu188(HK) residue by the P~His188(HK) (full details in Materials and methods). Predicted distance separating the Nε2 atom on His188(HK) and the receiver oxygen on Asp54(RR) is labeled. Also highlighted with a dashed line is the expected H-bond between the phosphoryl-group on the reactive His and the side chain of the ultraconserved residue Thr80(RR). The magnesium atom (green sphere) displays a full octahedral coordination sphere, for clarity one equatorial and one axial coordination bonds are not shown here: respectively with the main chain oxygen of Glu56(RR), and with a water molecule that replaces the phosphoryl group coordination observed in panel (A).
Figure 4—figure supplement 3
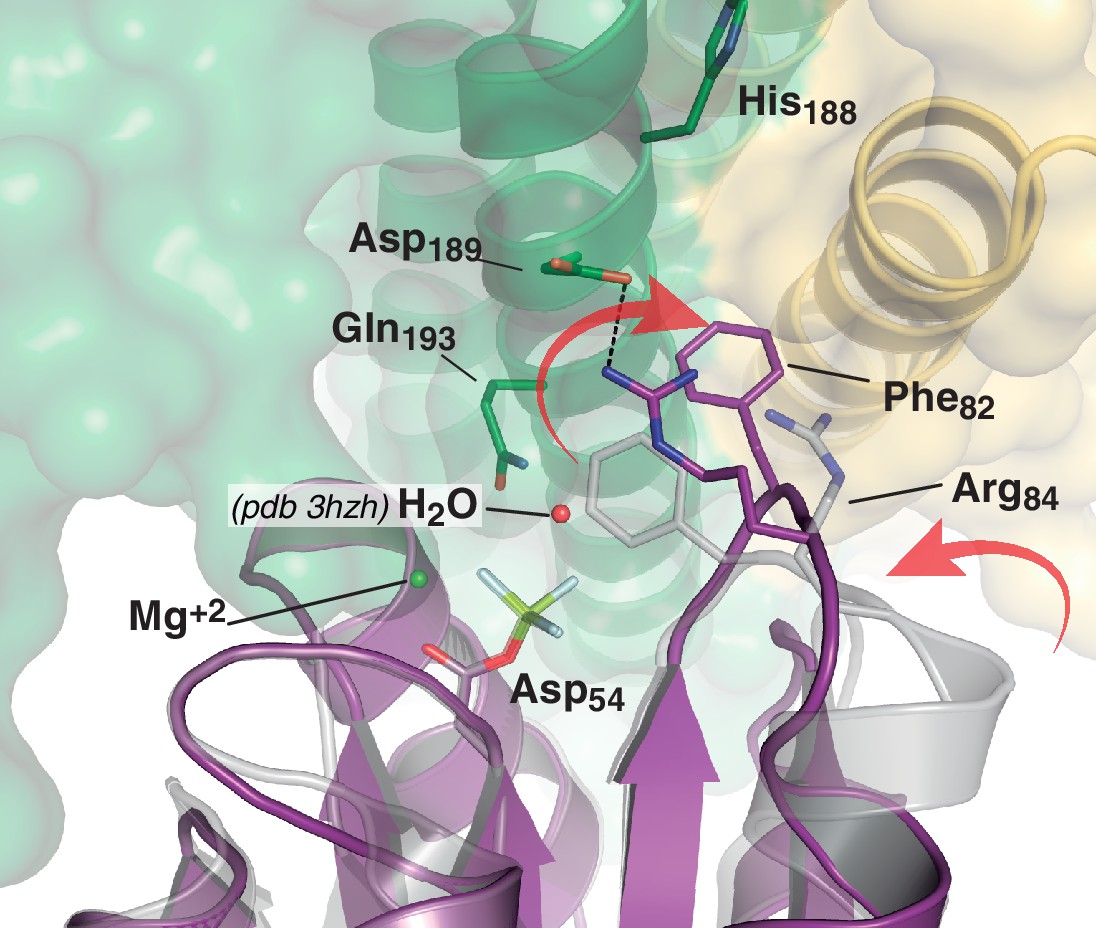
Phosphate lid opening for RR dephosphorylation.
Superposition of DesR-REC in its free active form with BeF3- (PDB 4LE0, in gray), onto the DesR-REC domain of the phosphatase complex (with DesK in green and yellow, and DesR in magenta). The solvent-exposed surface of DesK is shown in transparent representation. Red arrows indicate major conformational shifts associated with the interaction between both proteins. Such shifts result in the opening of the phosphate lid, making enough space for a water molecule to enter into the reaction center and perform the nucleophilic attack onto the P atom. The water molecule was not observed in our phosphatase complex, likely due to limited resolution; here a water molecule was modeled (red sphere) using as a template the structure of the CheX:CheY3 complex (PDB 3HZH) superimposable onto ours.
Figure 5

Dissociative phosphotransfer and asymmetric position of the divalent cation.
(A) Phosphoryl-transfer reactions were analyzed in vitro using Phos-tag SDS-PAGE. Band intensities corresponding to unphosphorylated and phosphorylated species were quantified by densitometry. Forward- and back-transfer directions were compared, with bars representing the amount of phosphotransfer in each direction, plotted as the percentage of phosphorylated DesKC with respect to its total initial amount (100%). Forward phosphotransfer (black bar) was measured by incubating pre-phosphorylated P~DesKC and DesR-REC. Back-transfer (gray bar) was assayed by incubating pre-phosphorylated P~DesR and DesKC. The standard deviation for triplicate replicas are shown as error bars. (B) Stabilization of the phosphorylated DesR species by the phosphorylation lid. The intrinsic dephosphorylation velocities of P~DesR-REC and P~DesRF82A-REC were compared using Phos-tag SDS-PAGE. One of three similar replicas is shown. (C) Structural superposition of the DesK:DesR phosphotransferase complex (colored in green:magenta) onto the B. subtilis Spo0B:Spo0F complex (PDB 2FTK, depicted in cyan:white), aligning the DesR and Spo0F REC domains. Selected key residues are labeled and numbered according to DesR's sequence. Note the strictly conserved position of the divalent cation (green sphere). The relative shift in the position of the phosphorylatable histidine (His188 in DesK corresponds to His30 in Spo0B), is highlighted by depicting the His(Nε2)-Asp(Oδ1) distances, not including the phosphoryl group for clarity. Note that besides the His shift, the overall DHp:REC binding interface is otherwise preserved. (D) Plot of His(Nε2)-Asp(Oδ1) distance vs degree of asymmetry in the position of the Mg2+ cation, comparing independently refined TCS complexes (color-labeled). The inset shows the two interatomic distances used to calculate the ratio plotted in the x-axis. Note the clustering in two groups, which discriminate complexes catalyzing reversible (yellow-to-brown range of points) vs irreversible (blue range of points) phosphotransfer reactions.
Figure 6
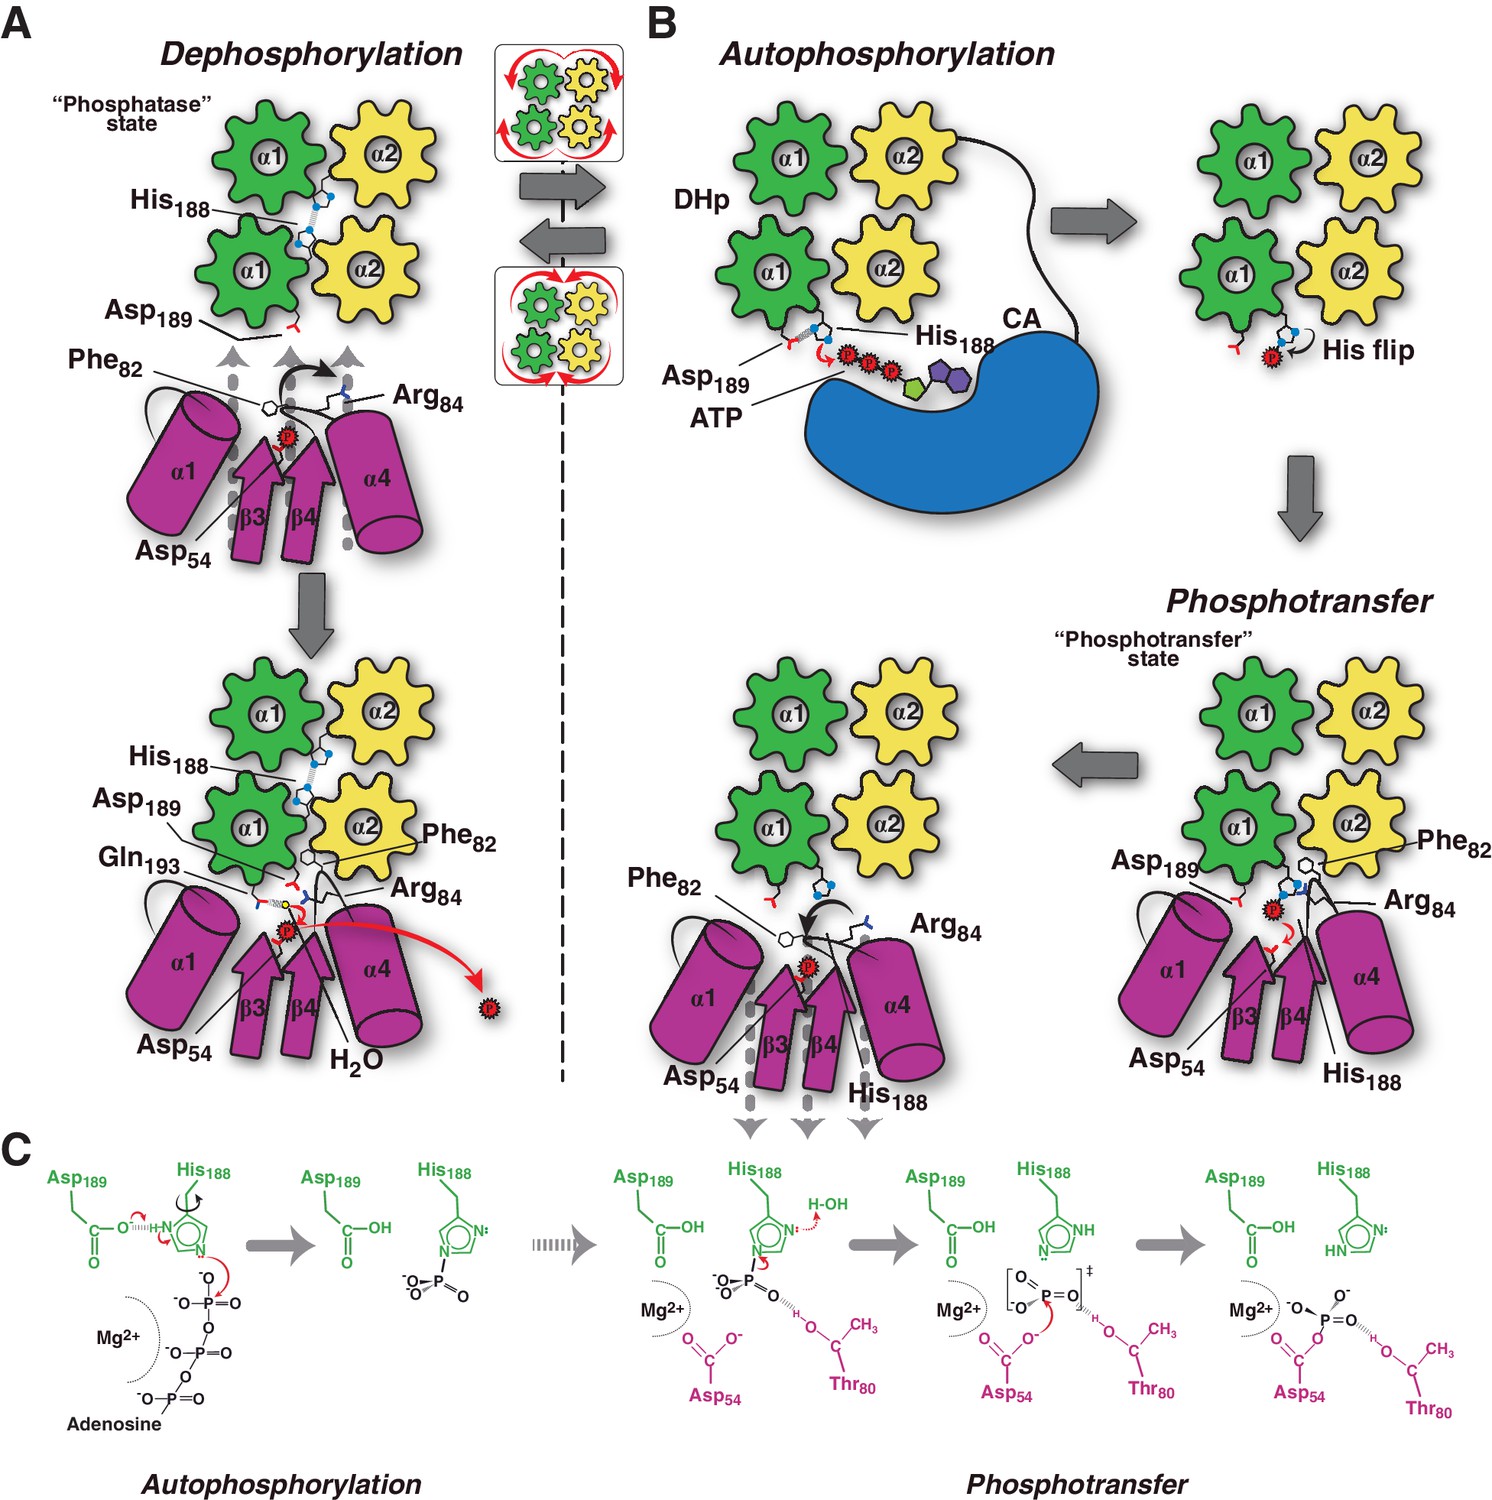
Conceptual model of TCS unidirectional signaling.
(A) P~DesR dephosphorylation catalysis is favored by the opening of the RR phosphorylation lid, via Phe82(RR) insertion into an HK hydrophobic pocket, and an ionic interaction between Asp189(HK) and Arg84(RR). The Phe82(RR) movement allows for entry of a nucleophilic water (yellow sphere) positioned by Gln193(HK). In the phosphatase state the phosphorylatable His188(HK) is buried within the DHp domain core, avoiding autophosphorylation and phosphoryl back-transfer reactions. (B) Signal-mediated pathway activation triggers the cogwheel rotation of the HK DHp α-helices, via coiled-coil disruption. The His188(HK) becomes exposed to the solvent, CA domains are released, and autophosphorylation thus enabled. Binding to unphosphorylated RR positions the P~His188(HK) into a suitable orientation for phosphoryl-transfer to occur through a loose (dissociative) nucleophilic substitution. Movement of Thr80(RR) is coupled with phosphoryl group migration, triggering RR’s phosphate lid closure and P~RR release. (C) Reaction scheme summarizing the autophosphorylation and phosphotransfer reactions. Stabilization of a protonated Nδ1 tautomer of the reactive histidine, is required in autophosphorylation. In keeping with the imidazole aromaticity, the nucleophilicity of Nε2 is thus finely regulated, allowing for phospho-acceptor/donor roles of the His.
Videos
Video 1
Animation illustrating the phosphotransferase to phosphatase transition, within the model of TCS-mediated phosphorylation and dephosphorylation of the RR component.
As an animated support to main Figure 6, the fixed ground states correspond to crystal structures, and the moving intermediates in between obtained by linearly interpolated morphing, as implemented in Pymol v 1.8.2 (Schrodinger, LLC, 2015). This animation does not include the kinase’s auto-phosphorylation step, shown at the beginning of Figure 6B. Structures of phosphorylated (‘active’) and non-phosphorylated (‘inactive’) DesR, when shown separate from the HK DesK, correspond respectively to PDB structures 4LE0 and 4LE1 (Trajtenberg et al., 2014). On the other hand, the fixed positions of P~DesK in complex with DesR (phosphotransferase state), and of DesK in complex with P~DesR (phosphatase state), correspond to the structures reported in this work (PDBs 5IUK and 5IUN, respectively). The reactive His188(HK) on DesK is depicted as spheres, as well as the active Asp54(RR) and Phe82(RR) on DesR. The rest of the proteins are rendered as cartoons. Chains A and B of DesK are colored in green and yellow, respectively. DesR is blue when not phosphorylated, and magenta once activated by phosphorylation. The P~His was modeled into DesK as explained in the text and Materials and methods. P~DesR corresponds to the phosphomimetic BeF3- bonded to Asp54(RR).
Tables
Table 1
X ray diffraction data collection and refinement statistics.
| Phosphatase complex | Phosphotransferase complex I (low [Mg2+]) | Phosphotransferase complex II (high [Mg2+]) | Phosphotransferase complex III (high [Mg2+] + BeF3-) | wt P~DesKC | |
|---|---|---|---|---|---|
| Data collection | |||||
| Space group | P3121 | P21 | P21 | P21 | P3121 |
| Cell dimensions | |||||
| a, b, c (Å) | 94.3, 94.3, 239.9 | 87.8, 114.6, 91.6 | 87.9, 115.6, 91.6 | 88.2, 116.7, 91.9 | 94.4, 94.4, 161.8 |
| α, β, γ (°) | 90, 90, 120 | 90, 116.4, 90 | 90, 116.7, 90 | 90, 117.1, 90 | 90, 90, 120 |
| Resolution (Å) | 48.35–2.79 (2.94–2.79)* | 66.70–3.2 (3.37–3.2) | 66.78–2.9 (3.06–2.9) | 38.59–3.15 (3.32–3.15) | 36.5–3.16 (3.33–3.16) |
| Unique reflections | 31510 (4385) | 26369 (3906) | 36132 (5279) | 28033 (3944) | 14829 (2109) |
| Rmeas | 0.1 (2.07) | 0.14 (0.98) | 0.13 (1.61) | 0.1 (0.57) | 0.07 (1.18) |
| Rpim | 0.03 (0.63) | 0.09 (0.62) | 0.05 (0.65) | 0.05 (0.29) | 0.03 (0.43) |
| CC1/2 | 1.00 (0.56) | 0.99 (0.55) | 0.99 (0.67) | 1.00 (0.83) | 1.00 (0.77) |
| I / σI | 15.6 (1.5) | 7.7 (1.7) | 12.5 (2.4) | 11.8 (2.7) | 23.8 (1.9) |
| Completeness (%) | 99.5 (96.7) | 97.8 (98.8) | 99.1 (99.2) | 98 (95.6) | 99.9 (99.6) |
| Redundancy | 10.8 (10.3) | 2.4 (2.4) | 5.8 (6.0) | 3.8 (3.8) | 7.2 (7.2) |
| Refinement | |||||
| Resolution (Å) | 48.35–2.79 | 66.70–3.2 | 39.27–2.9 | 38.59–3.15 | 36.5–3.16 |
| Number of refls used (N in the free set) | 31454 (1568) | 26231 (1320) | 35374 (1720) | 28015 (1361) | 14787 (791) |
| Rwork / Rfree | 0.214/0.249 | 0.187/0.24 | 0.195/0.239 | 0.19/0.231 | 0.257/0.295 |
| Number of atoms | |||||
| Protein | 7972 | 8869 | 8702 | 8709 | 3151 |
| Ligands + ions | 93 (AMP-PCP)/6 (Mg2+)/12 (MES)/12 (BeF3-)/5 (SO42-) | 124 (AMP-PCP)/4 (Mg2+)/2 (K+) | 124 (AMP-PCP)/5 (Mg2+)/2 (K+) | 124 (AMP-PCP)/6 (Mg2+)/2 (K+) | 62 (AMP-PCP)/2 (Mg2+)/6 (glycerol) |
| Water | 12 | 15 | 9 | 18 | 4 |
| B-factors (Å2) | |||||
| Wilson plot | 98.3 | 91.4 | 95.9 | 84.1 | 128.9 |
| Mean (overall) | 118.7 ‡ | 93.1 ‡ | 102.5 ‡ | 89.6 ‡ | 123.8 ‡ |
| R.m.s. deviations | |||||
| Bond lengths (Å) | 0.01 | 0.01 | 0.01 | 0.01 | 0.01 |
| Bond angles (°) | 1.2 | 1.3 | 1.25 | 1.25 | 1.3 |
| Number of residues in Ramachandran plot § (favored / outliers) | 1025/1 | 1099/3 | 1074/2 | 1073/5 | 382/4 |
| PDB ID | 5IUN | 5IUJ | 5IUK | 5IUL | 5IUM |
-
*Values in parentheses correspond to the highest-resolution shell.
-
‡ Including TLS contribution.
-
§ Calculated with Molprobity (Chen et al., 2010)
Table 2
Isothermal titration calorimetry parameters. For details on the two different titration procedures, see Materials and methods.
| HK:RR complexes | Ka (M −1) | ΔG (x103 kcal.mol−1) | ΔH (x104 kcal.mol−1) | TΔS (x104 kcal.mol−1) |
|---|---|---|---|---|
| DesKCH188V:DesR-REC | 7.7×10⁵ | −7.8 | 1.5 | 2.3 |
| 9.5×10⁴ | −6.5 | 1.4 | 2.1 | |
| DesKCH188E:DesR-REC | 1.7×10⁶ | −8.2 | 2.2 | 3.0 |
| 3.0×10⁴ | −5.9 | 2.1 | 2.7 |
Table 3
Small angle X ray scattering and derived molecular size parameters. Data derived from experiments performed by SEC-coupled SAXS. Figures for the phosphatase-trapped species DesKH188V, are to be compared with those corresponding to HK:RR species.Full details in Materials and methods.
| Protein species | I(0) | I(0) real | Rg (Guinier) | Rg (real) | Vc | MMVc (Da) | MMseq (Da) | Dmax (Å) |
|---|---|---|---|---|---|---|---|---|
| DesKCH188V | 4.47×10⁻² | 4.26×10⁻² | 31.25 | 31.21 | 442.9 | 46400 | 44780 | 100 |
| DesKCSTAB:DesR-REC | 1.16×10⁻¹ | 1.11×10⁻¹ | 31.48 | 31.42 | 494.8 | 58400 | 77110 | 103 |
| DesKCH188E:DesR-REC | 1.05×10⁻¹ | 9.76×10⁻² | 32.84 | 32.18 | 486.2 | 51800 | 61790 | 103 |
Table 4
Fitting figures (χ2) comparing alternative theoretical SAXS curves to the experimentally collected scattering data.
| Experimental Data | Structural models | χ2 |
|---|---|---|
DesKCSTAB:DesR-REC | AB+ABCD mixture | 6.1 |
| ABCD (folded coiled-coil) | 8.9 | |
| EE’FF’ (disrupted coiled-coil) | 11.6 | |
| DesKCH188E:DesR-REC | ABC | 8 |
| AB | 24.9 |
Table 5
Square matrix of all possible pair-wise structural superpositions. Superpositions were calculated using the nine independently refined DesKC:DesR-REC pairs, taken from the 1.5 complexes in the phosphatase asymmetric unit (named STAB1, STAB2 and STAB3) and the 2 complexes present in the ASU of each of the three different phosphotransferase structures (named as E188[1–6]). Below the main diagonal the structurally invariant region of DesK DHp domains (residues 190–234(HK)) were superposed, whereas above the diagonal, the DesR REC domains (residues 1–129(RR)) were superposed instead. Resulting root mean squared deviations (in Å) were calculated, for both matrix halves, between all Cα atoms of the REC domains (residues 1–129(RR)) after superposition, as indicated in each individual matrix cell. Font colors highlight the two different alignment procedures performed. The significant differences between corresponding blue- and red-colored values, indicate that the REC domains do not change within, but rather ‘slip’ with respect to the kinase DHp domain.
| STAB1 | STAB2 | STAB3 | E1881 | E1882 | E1883 | E1884 | E1885 | E1886 | |
| STAB1 | 0.229 | 0.158 | 0.414 | 0.349 | 0.442 | 0.361 | 0.344 | 0.343 | |
| STAB2 | 0.826 | 0.188 | 0.496 | 0.459 | 0.512 | 0.334 | 0.343 | 0.333 | |
| STAB3 | 1.362 | 1.917 | 0.393 | 0.343 | 0.414 | 0.292 | 0.287 | 0.277 | |
| E1881 | 1.168 | 1.133 | 1.682 | 0.275 | 0.146 | 0.305 | 0.301 | 0.301 | |
| E1882 | 0.909 | 1.140 | 1.224 | 0.584 | 0.301 | 0.351 | 0.309 | 0.341 | |
| E1883 | 1.085 | 1.110 | 1.530 | 0.233 | 0.459 | 0.346 | 0.315 | 0.313 | |
| E1884 | 1.548 | 1.140 | 2.453 | 0.893 | 1.316 | 1.040 | 0.175 | 0.117 | |
| E1885 | 1.295 | 0.978 | 2.096 | 0.593 | 0.969 | 0.716 | 0.449 | 0.140 | |
| E1886 | 1.424 | 1.058 | 2.300 | 0.770 | 1.182 | 0.905 | 0.193 | 0.306 |
Table 6
Summary of reactive His(HK)-to-Asp(RR) distances in reported TCS protein complexes.
| Group (based on distance discriminants*) | Complex partners (N° complexes per ASU†) | Distance his(Nε2)-Asp(Oδ1) (Å)‡ | Reaction coordinate distance (Å)§ | Distance ratio [Mg2+-Asp(Oδ1)/Mg2+-His(Nε2)] | Pdb (ID) | Phosphotransfer reaction direction | Remarks | |
|---|---|---|---|---|---|---|---|---|
| Phosphorelays | I | Spo0F:Spo0B¶ (4) | 5.7; 5.3; 5.1; 5.1 | 4.1; 3.8; 3.6; 3.5 | 0.82; 0.74; 0.65; 0.67 | 2FTK | P~Asp(Spo0F)→ His(Spo0B) | Spo0B bears a DHp domain |
| SLN1:YPD1** (1) | 4.9 | 3.2 | 0.67 | 2R25 | P~Asp(SLN1)→ His(YPD1) | YPD1 bears an HPt domain | ||
| AHK5:AHP1†† (1) | 6.4 | ND[8] | 0.72 | 4EUK | P~Asp(AHK5-REC)→ His(AHP1) | AHP1 bears an HPt domain | ||
| ChpT:CtrA§§ (2) | 5.9¶¶ | ND‡‡ | 0.64*** | 4QPJ | P~His(ChptA)→ Asp(CtrA) | ChpT bears a DHp domain P~Asp(CtrA)→His(ChptA) remains to be confirmed | ||
| HKs undergoing auto-phosphorylation | I | CpxA:ATP ††† (1) | 5.0‡‡‡ | 3.4 | 0.82 | 4BIW | ATP→His(CpxA) | AMP-PCP was used as non-hydrolizable ATP analogs (between phosphates β and γ there is a C atom substituting the O) |
| HK853/EnvZ chimera:ATP14 (1) | 5.3‡‡‡ | 3.6 | 0.72 | 4KP4 | ATP→His(HK853) | |||
| RR-mediated phosphorylation of imidazole | I | Imidazole:CheY¶¶¶ (2) | 5.1; 5.1 | 3.3; 3.3 | 0.71; 0.73 | 5DKF | P~AspCheY) → imidazole | In vitro engineering of a phosphorelaying system from CheY to PhoR, using imidazole as a rudimentary HPt |
| HK:RR complexes | II | HK853:RR468**** (2) | 7.6; 8.0†††† | 5.7; 6.1 †††† | 0.51; 0.48†††† | 3DGE | P~His(HK853)→ Asp(RR468) | HK:RR complex, snapshot of the phosphatase state according to the authors. |
| DesK:DesR‡‡‡‡ (2) | 7.6§§§§ | 5.8§§§§ | 0.47§§§§ | 5IUK | P~His(DesK)→ Asp(DesR) | HK:RR complex in the phosphotransferase state | ||
| CheA3:CheY6¶¶¶¶ (1) | 7.3 | ND‡‡ | 0.52***** | 3KYJ | P~His(CheA3)→ Asp(CheY6) | 3KYJ is not phosphorylated on either partner; 3KYI with P-His on CheA3 displays an unproductive P~His rotamer, otherwise confirming 3KYJ’s 3D organization |
-
* Distance between reactive His(Nε2)-Asp(Oδ1) less than or greater than 6.5Å, and distance ratio [Mg2+-Asp(Oδ1) / Mg2+-His(Nε2)] less than or greater than 0.6
-
† ASU = asymmetric unit
-
‡ Each distance corresponds to the one measured in each one of the independently refined complexes in the ASU.
-
§ Distances are reported in the same order as in the previous column, with correspondence among same individual complexes.
-
¶ Bacillus subtilis (Varughese et al.,2006)
-
** Saccharomyces cerevisiae (Zhao et al., 2008)
-
††Arabidopsis thaliana (Bauer et al., 2013)
-
‡‡ Not determined : no phosphoryl group or phosphoryl-mimetic present in the structure.
-
§§ Brucella abortus (Willett et al., 2015)
-
¶¶ Only one of the two complexes in the ASU (ChpTchainA:CtrAchainC, display the reactive His and Asp properly oriented poised for reacting. Only one distance is thus recorded.
-
*** No Mg2+ cation was actually bound on CtrA. A metal atom was modeled by superimposing the structure of RR468 with bound BeF3 (PDB 3GL9), one of the top ranking structures in multiple structural alignments with CtrA (DALI Z score 12.9, rmsd 0.8Å superimposing 98 αCs).
-
††† Escherichia coli (Mechaly et al., 2014)
-
‡‡‡ In the autophosphorylation complexes the distance is recorded between His(Nε2) and the position of the O between phosphates β and γ.
-
§§§ Thermotoga maritima (HK853) / E. coli (EnvZ) (Casino et al., 2014)
-
¶¶¶ E. coli (Page et al., 2015)
-
**** Thermotoga maritima (Casino et al., 2009)
-
†††† These distances have been calculated by superimposing the phosphorylation-mimetic structure of RR468 alone with bound BeF3 (PDB 3GL9), onto 3DGE, in order to use better estimations of the receiver Asp position as well as of the phosphorus atom.
-
‡‡‡‡B. subtilis, this report.
-
§§§§ Glu188 present in the crystal structure was substituted by wt P~His following superposition of wt phosphorylated DesKC (PDB 5IUM) onto one of the phosphotransferase DesKCH188E:DesR-REC complexes in the ASU (chains A-B:E). Distances are reported after energy minimization. See Materials and methods.
-
¶¶¶¶ Rhodobacter sphaeroides (Bell et al., 2010)
-
***** The position of Mg2+ cation was modeled using PDB 4TMY as template.
Download links
A two-part list of links to download the article, or parts of the article, in various formats.
Downloads (link to download the article as PDF)
Open citations (links to open the citations from this article in various online reference manager services)
Cite this article (links to download the citations from this article in formats compatible with various reference manager tools)
Regulation of signaling directionality revealed by 3D snapshots of a kinase:regulator complex in action
eLife 5:e21422.
https://doi.org/10.7554/eLife.21422


