Distinct mechanisms mediate speed-accuracy adjustments in cortico-subthalamic networks
- Medical Research Council Brain Network Dynamics Unit at the University of Oxford, United Kingdom
- John Radcliffe Hospital, University of Oxford, United Kingdom
- King’s College Hospital, United Kingdom
- University College London Institute of Neurology, United Kingdom
Figures
Figure 1 with 1 supplement
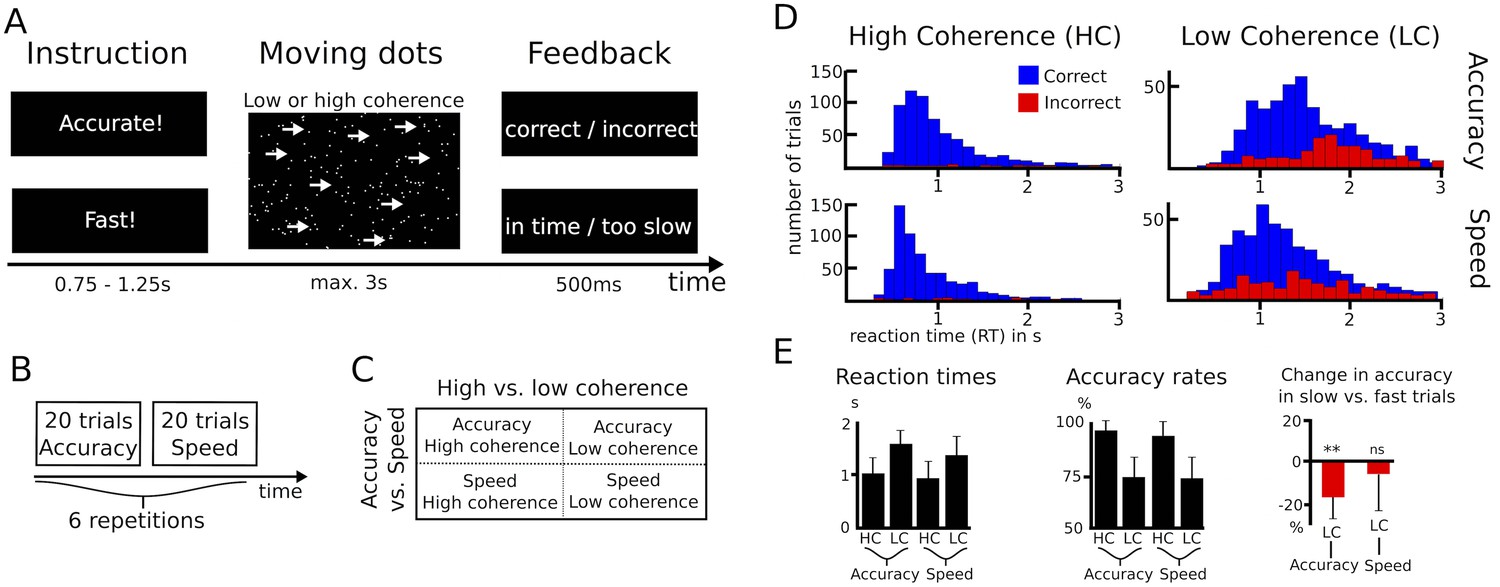
Paradigm and behavioral data.
(A–C) Overview of experimental task and the 2*2 study design. (D) Histograms of RT distributions for correct (blue) and error (red) trials for all four conditions. (E) Second level comparison of reaction times (left), accuracy rates (middle) and change in accuracy rates in slow vs. fast trials (right). HC, high coherence; LC, low coherence; ** significant at p<0.01; ns, not significant. Error bars indicate standard deviation.
Figure 1—figure supplement 1
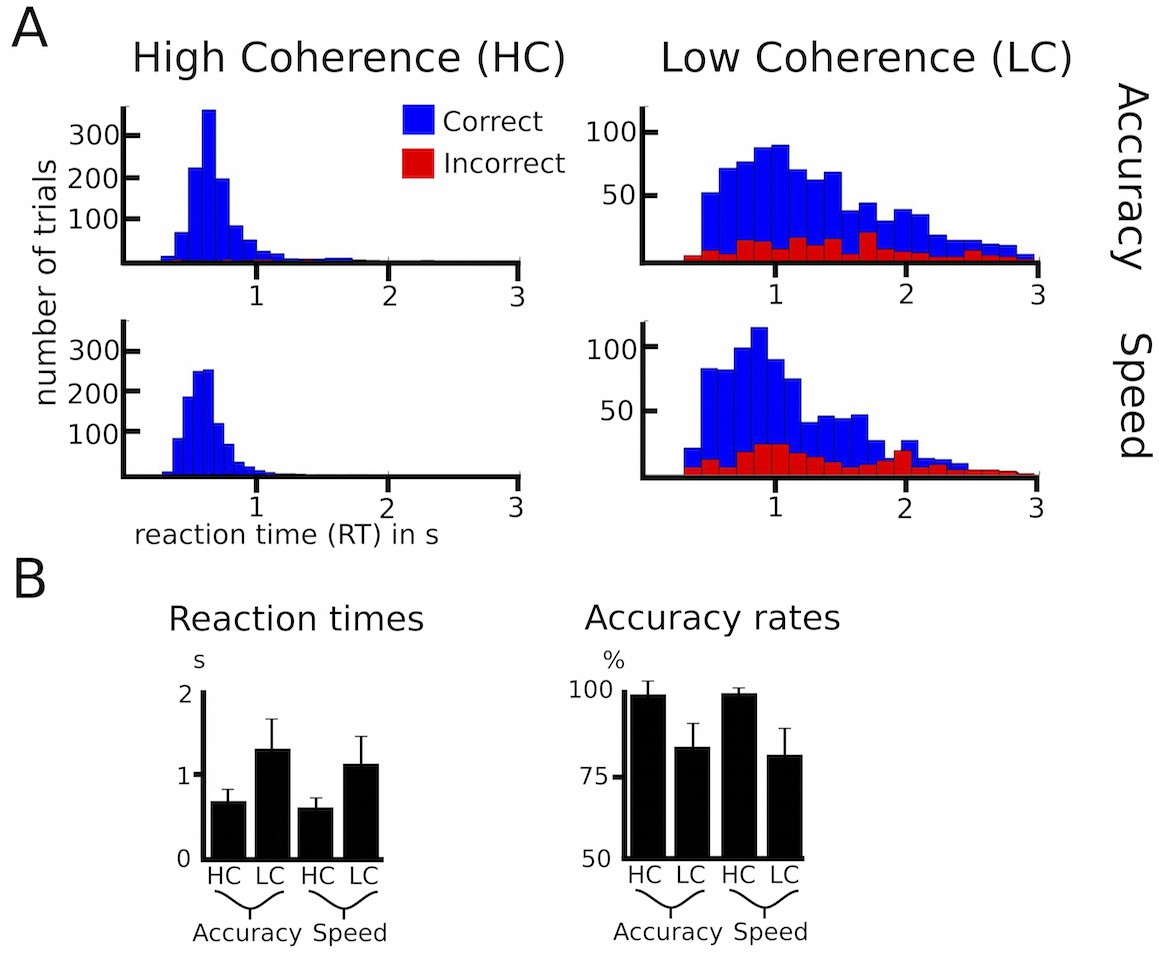
Behavioral data of healthy participants.
(A) Histograms of RT distributions for correct (blue) and error (red) trials for all four conditions. (B) Group-averaged reaction times and accuracy rates. HC, high coherence; LC, low coherence. Error bars indicate standard deviation.
Figure 2 with 1 supplement
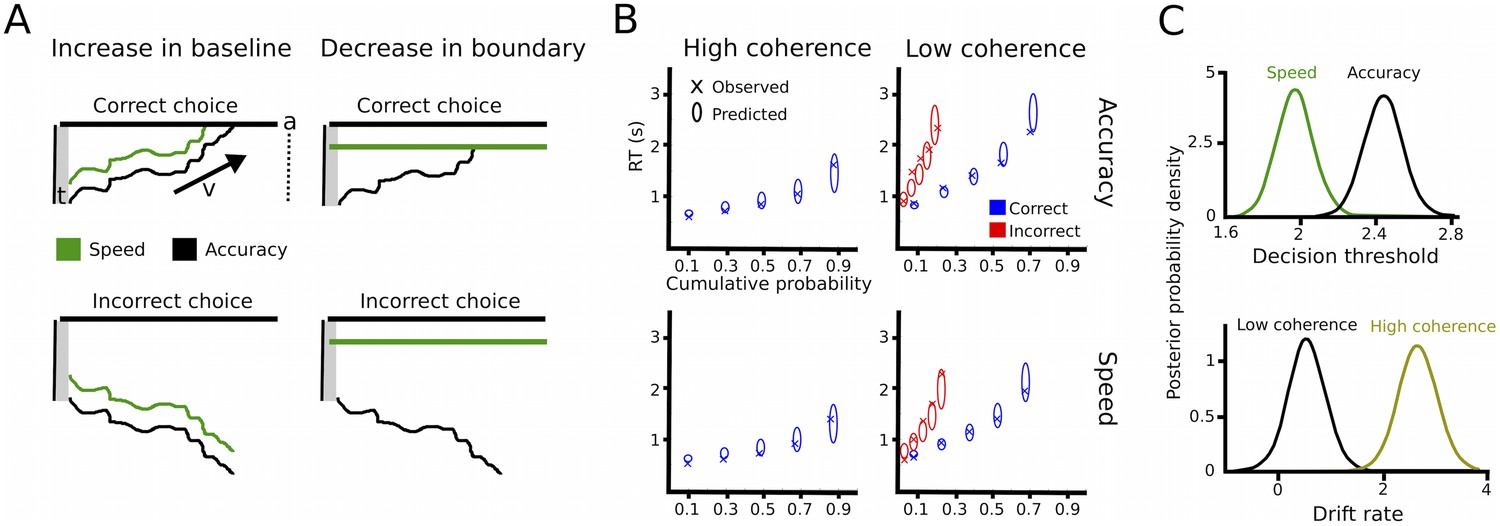
Drift diffusion modeling.
(A) Schematic illustration of DDM. t is the non-decision time, v the drift rate and a the decision threshold. The upper boundary in the upper row indicates the threshold for the correct response, while the upper boundary in the lower row reflects the threshold for the incorrect response. Emphasizing speed over accuracy is thought to decrease the distance from the starting point of evidence accumulation to the decision threshold, which can be achieved by increasing the baseline (left column) or decreasing the boundary (right column). Both mechanisms are mathematically equivalent and cannot be distinguished in the DDM framework. (B) Quantile probability plots showing the observed (x) and predicted (ellipses) RT against their cumulative probabilities (10, 30, 50, 70 and 90 percentiles). The widths of the ellipses represent uncertainty (standard deviation of the posterior predictive distribution). Blue symbols are used for correct, red symbols for incorrect trials (incorrect trials are only shown for low coherence trials). (C) Posterior probability densities for changes in decision thresholds by instruction and changes in drift rates by coherence levels. Both effects were highly significant.
Figure 2—figure supplement 1
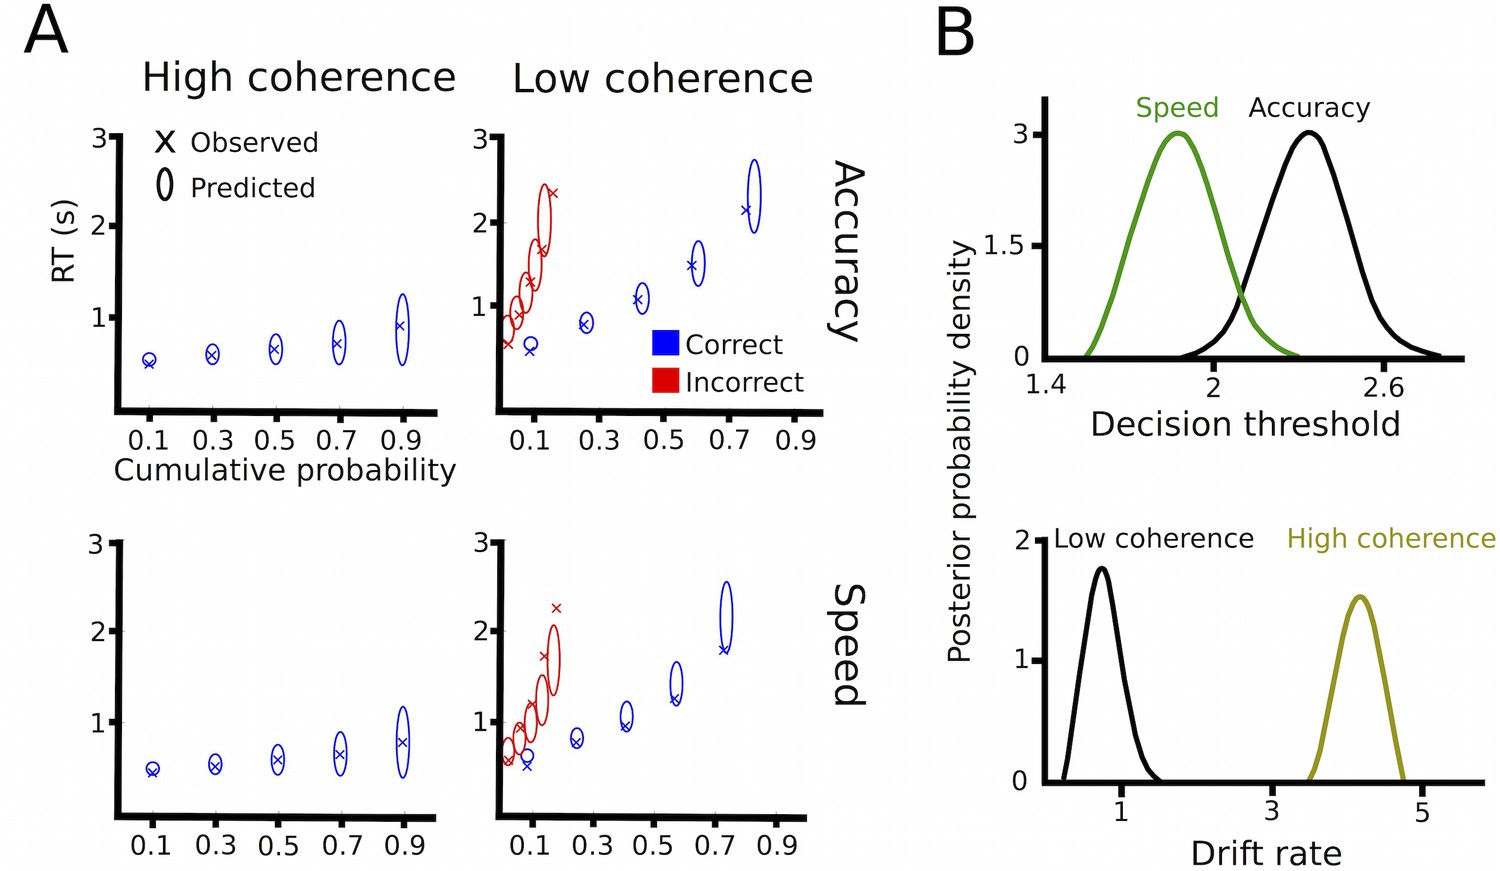
Drift diffusion modeling in healthy participants.
(A) Quantile probability plots showing the observed (x) and predicted (ellipses) RT against their cumulative probabilities (10, 30, 50, 70 and 90 percentiles). The widths of the ellipses represent uncertainty (standard deviation of the posterior predictive distribution). Blue symbols are used for correct, red symbols for incorrect trials (incorrect trials are only shown for low coherence trials). (B) Posterior probability densities for changes in decision thresholds by instruction and changes in drift rates by coherence levels.
Figure 3 with 2 supplements
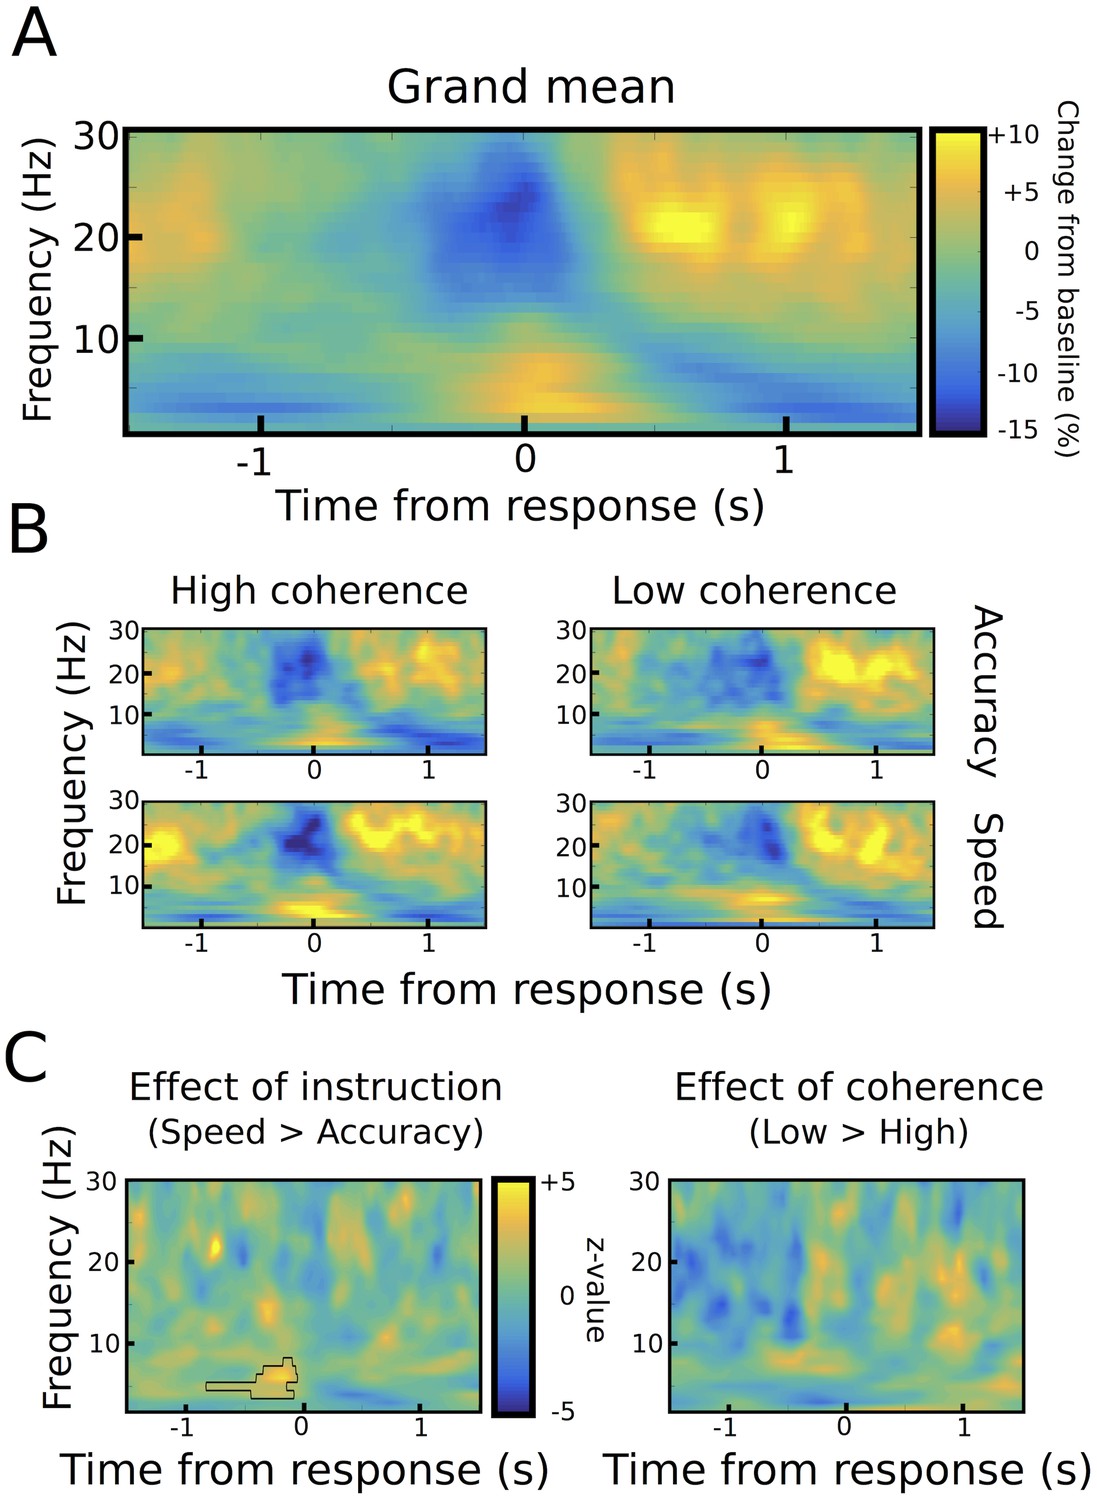
Response-aligned STN power changes.
(A) Time frequency spectrum aligned to the onset of the motor response from −1.5 to +1.5 s averaged across conditions. (B) Spectra shown separately for the four conditions. The color map is identical to A. (C) Significant differences between conditions as revealed by cluster-based permutation tests.
Figure 3—figure supplement 1
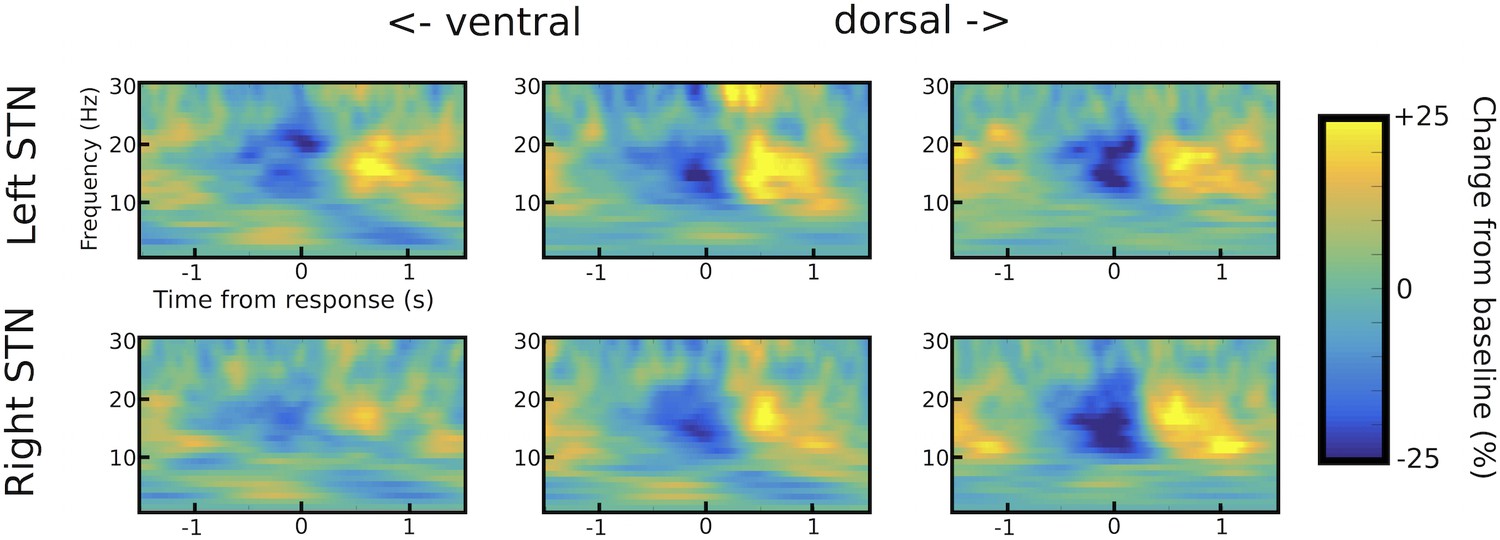
STN channel selection.
Example of channel selection for one representative patient (patient #6). Response-aligned time frequency spectra are shown for the three bipolar channels (from left to right: ventral -> middle -> dorsal) for both STNs (left STN in upper row, right STN in lower row). The channel with the strongest LFO increase was picked if (i) it was not further than two contacts away from the channel with the strongest beta modulation (only relevant for omnidirectional octopolar electrodes) and (ii) also showed a pronounced beta modulation. In this patient, the most ventral contact was chosen for left STN and the middle contact for right STN. Note that the most ventral contact of right STN also showed LFO modulation, but only very little beta modulation. Therefore, the middle contact was chosen for the right STN.
Figure 3—figure supplement 2
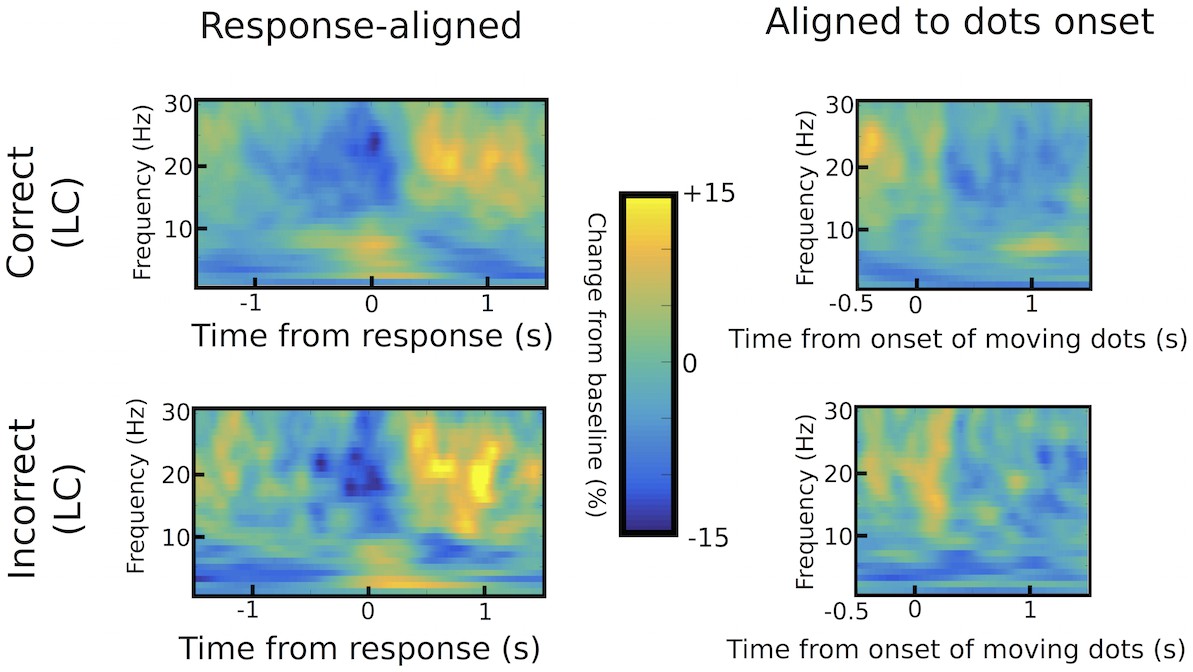
Differences in STN power between correct and incorrect trials.
Response-aligned time frequency spectra are shown in the left column, while spectra aligned to the onset of the moving dots are shown in the right column for correct (upper row) and incorrect (lower row) low coherence trials. There were no statistically significant differences between correct and incorrect responses using permutation testing (1000 permutations with p=0.05 as cluster-building and statistical threshold for cluster-based comparisons).
Figure 4
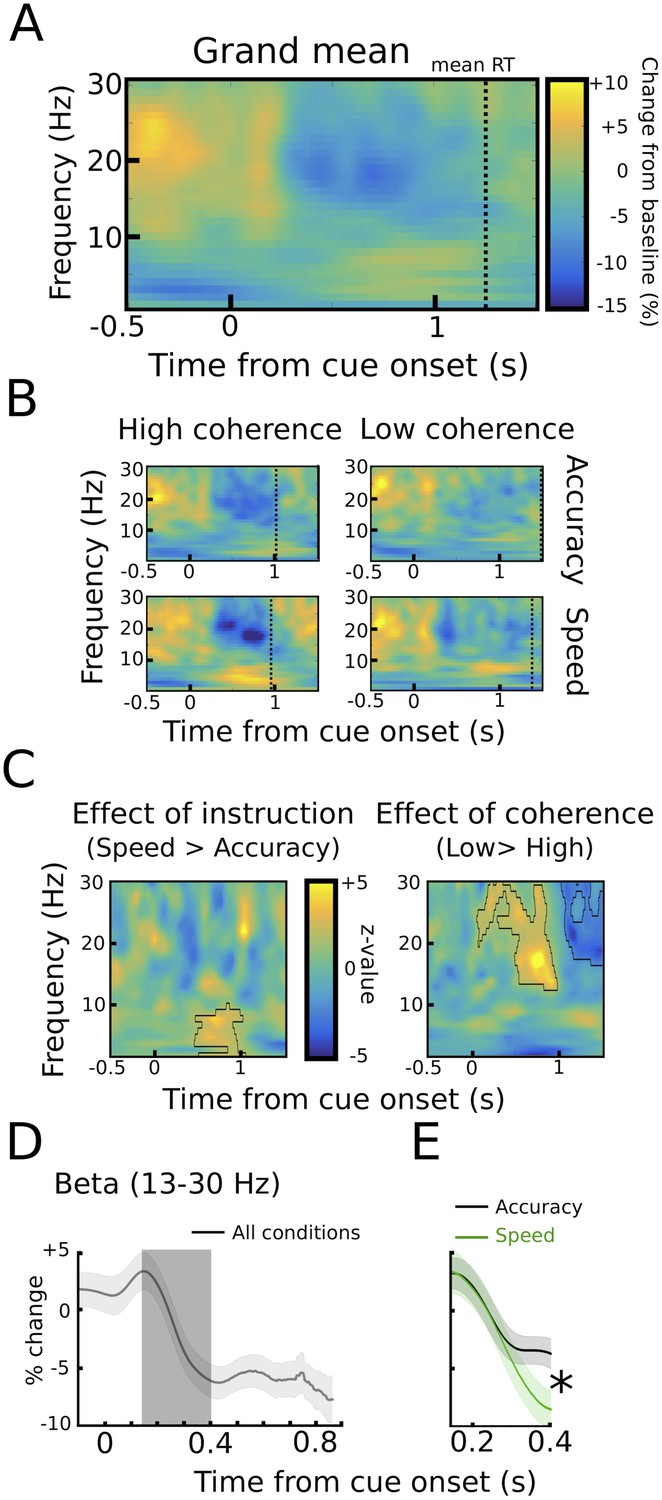
STN power changes aligned to the onset of the moving dots.
(A) Time frequency spectrum aligned to the onset of the cue from −0.5 to +1.5 s averaged across conditions. (B) Spectra shown separately for the four conditions. The color map is identical to A. (C) Significant differences between conditions as revealed by cluster-based permutation tests. (D) Cue-induced decrease in beta power (13–30 Hz) averaged across conditions. The time series of each trial was capped at the time of the response before averaging. A decrease in beta power was evident from ~150 ms to 400 ms after the onset of the moving dots. (E) This beta decrease was stronger in speed vs. accuracy instructions (but not high vs. low coherence). For D and E and solid traces represent mean, while shaded areas around the traces indicate standard error of the mean. *, significant at p<0.05.
Figure 5
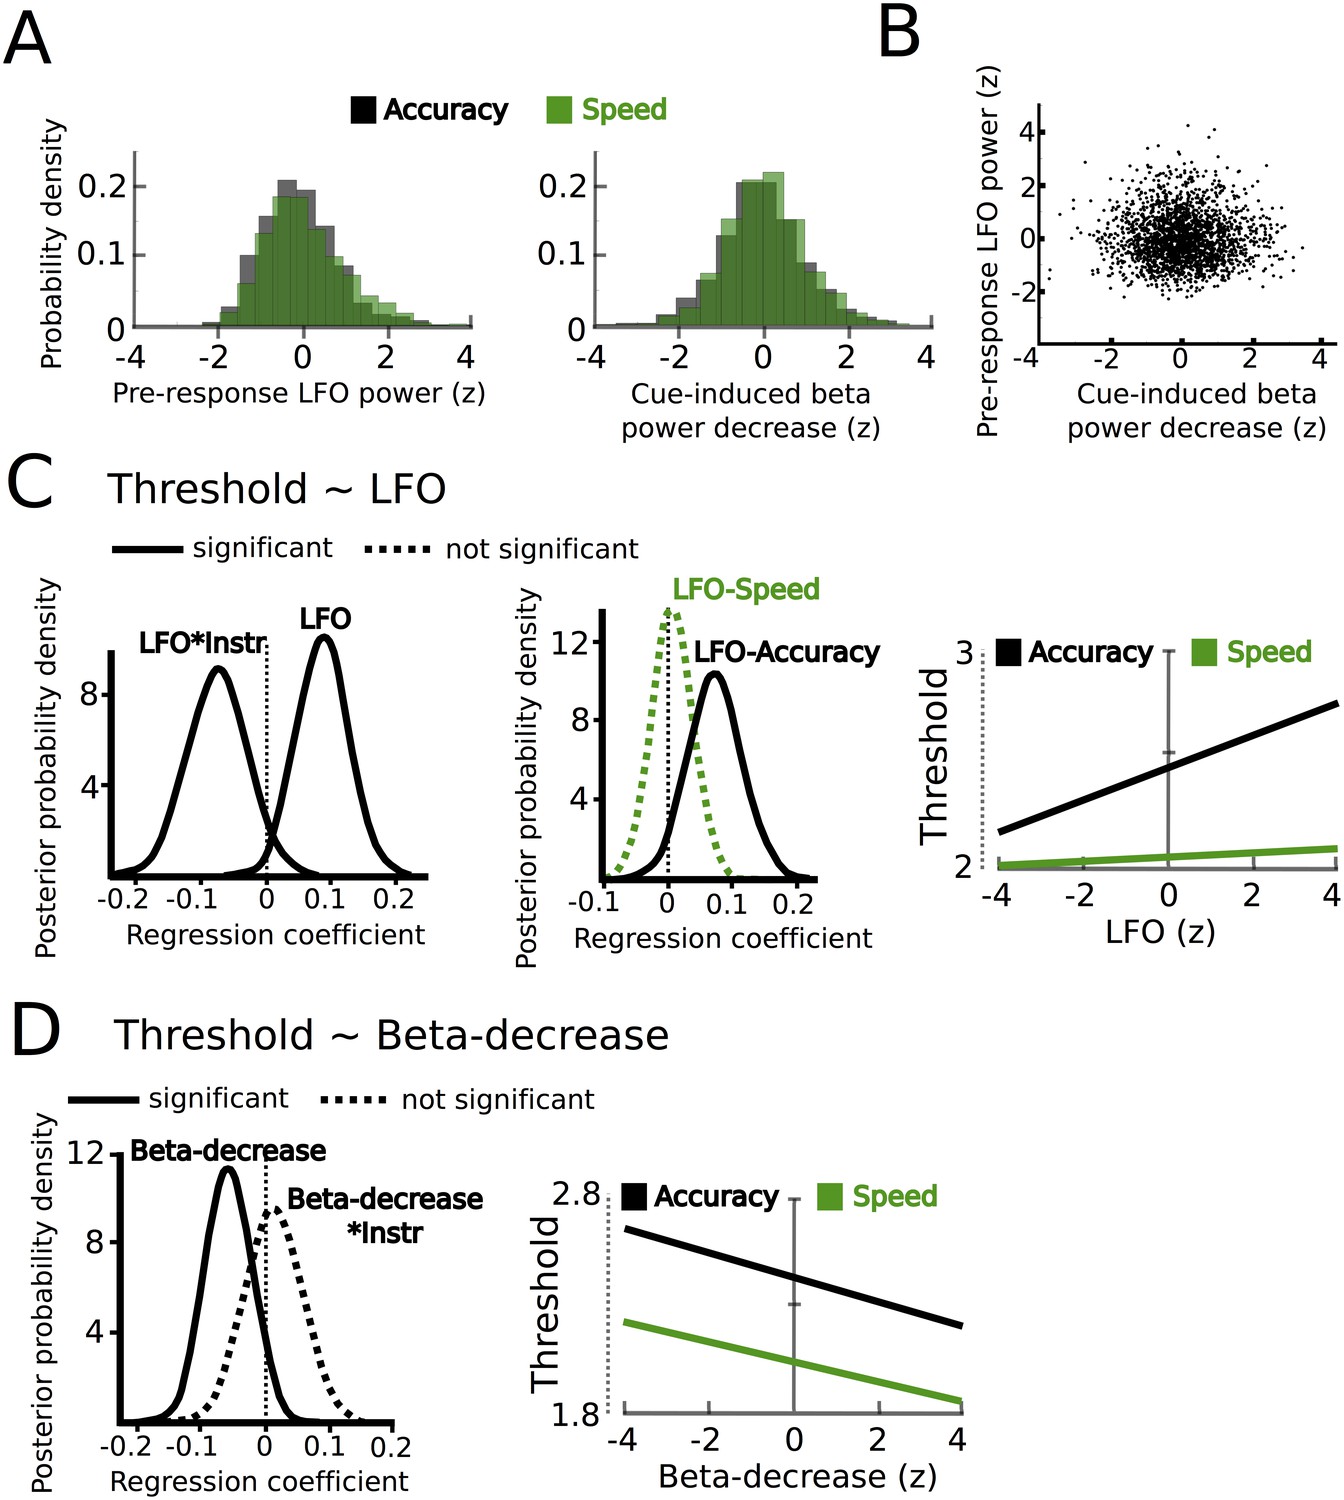
STN power changes predict adjustments of decision thresholds.
(A) Histograms of the z-scored single trial values of the increase in LFO before the response (−750 ms before the response until the response) and cue-induced decrease in beta power (150 ms to 400 ms after the cue) for all subjects combined. Black bars represent trials with accuracy instructions, green bars trials with speed instructions. (B) Scatter plot of LFO and beta power single trial values illustrating the lack of a correlation between the two. Note that the statistical test for this analysis was based on a one-sample t-test of Fisher r-to-z-transformed within-subject correlation coefficients. (C) Posterior probability density for the effect of LFO on decision thresholds (left column), and the effect of LFO on thresholds separately for speed (green) and accuracy (black) instructions (middle column), which is further illustrated in the right column. (D) Posterior probability density for the effect of the cue-induced beta decrease on decision thresholds, which is further illustrated in the right column. Solid lines indicate significant results (≥95% of posterior distribution different from zero), while dotted lines indicate non-significant results.
Figure 6
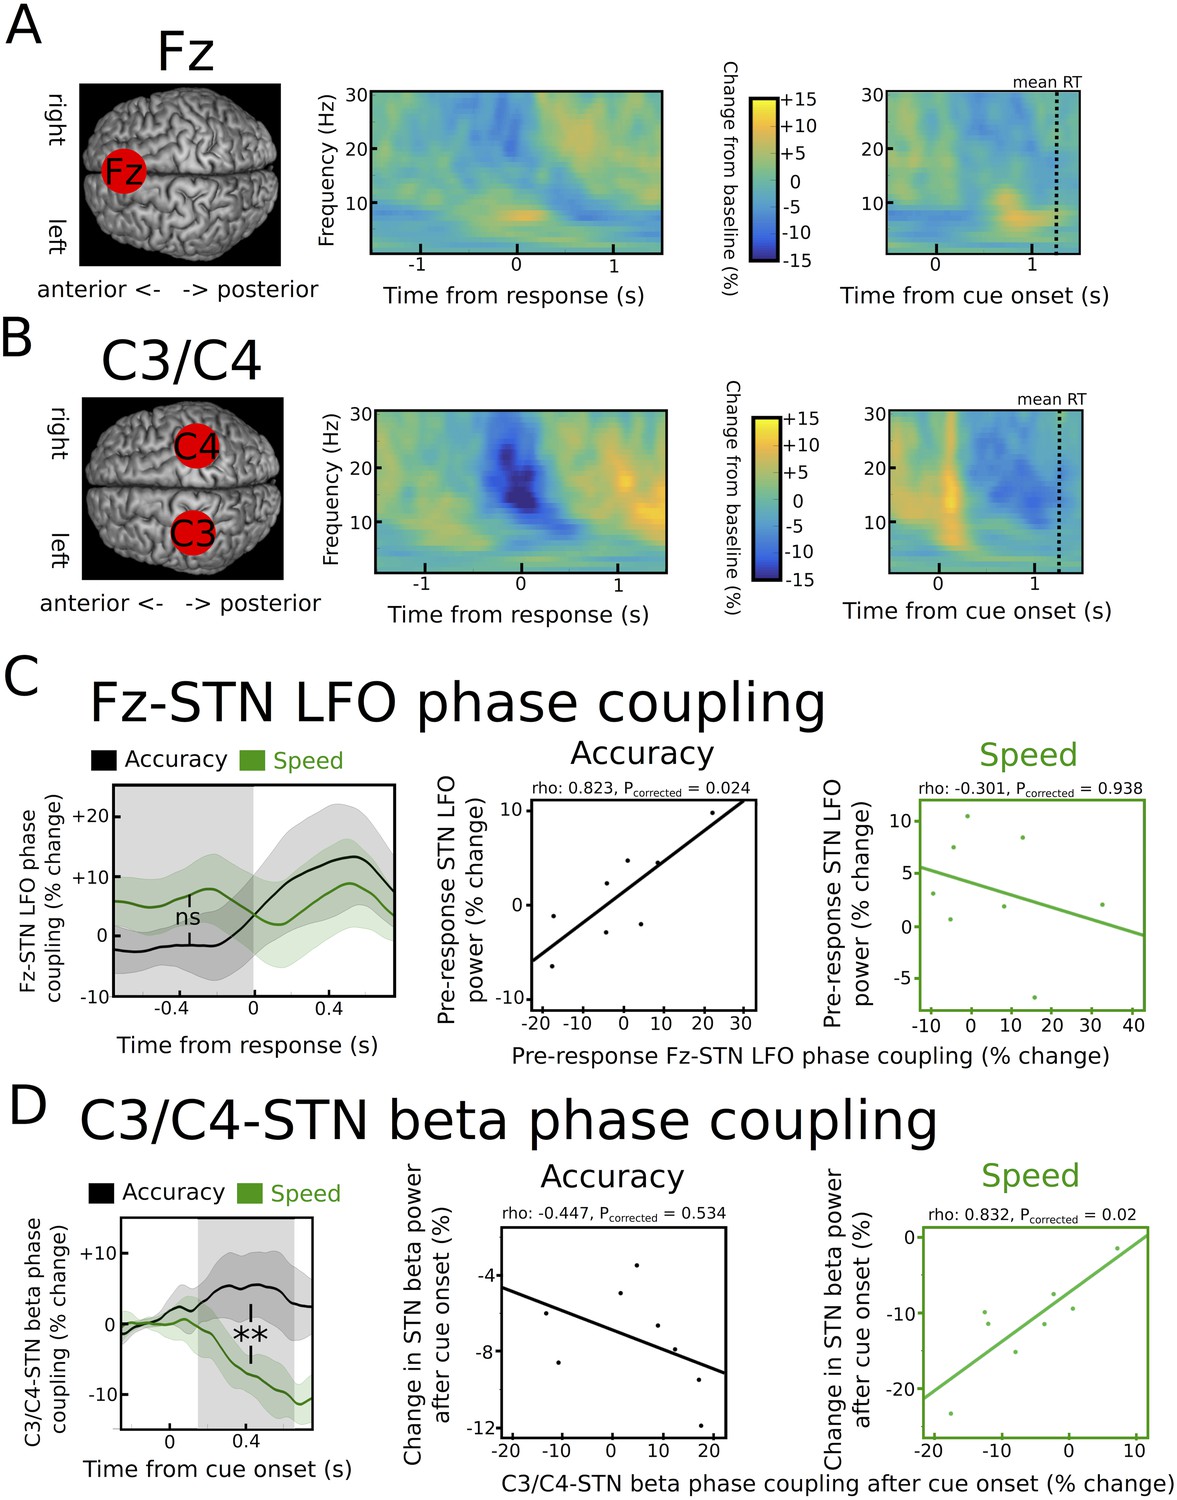
Task-related changes in cortical activity and cortico-STN connectivity.
(A) Time frequency spectrum for EEG at electrode Fz aligned to the motor response (from −1.5 to +1.5 s) and cue-onset (from −0.5 to 1.5 s) averaged across conditions. The pre-response increase in LFO was significantly stronger at Fz compared to electrode C3/C4 (p<0.05). (B) Time frequency spectrum for EEG at electrode C3/C4 aligned to the motor response (from −1.5 to +1.5 s) and cue-onset (from −0.5 to 1.5 s) averaged across conditions. The cue-induced beta decrease was significantly stronger at C3/C4 compared to Fz (p<0.001). (C) Inter-site phase clustering (ISPC) between LFO at Fz and STN. The left column shows ISPC separately for speed (green) and accuracy instructions (black). In C and D, the shaded rectangles indicate the time windows of interest, which were based on the analysis of STN power changes. Solid traces represent mean and shaded areas around the traces indicate standard error of the mean. The middle and right columns show correlation analyses between Fz-STN LFO ISPC and STN LFO power changes for accuracy and speed instructions, respectively. Each observation corresponds to one patient (n = 8). (D) Same as C, but for C3/C4-STN ISPC in the beta band. **, significant at p<0.01; ns, not significant.
Additional files
-
Supplementary file 1
Clinical specifications.
Age and disease duration are given in years. UPDRS-III: Unified Parkinson’s disease rating scale part III.
- https://doi.org/10.7554/eLife.21481.013
Download links
A two-part list of links to download the article, or parts of the article, in various formats.
Downloads (link to download the article as PDF)
Open citations (links to open the citations from this article in various online reference manager services)
Cite this article (links to download the citations from this article in formats compatible with various reference manager tools)
Distinct mechanisms mediate speed-accuracy adjustments in cortico-subthalamic networks
eLife 6:e21481.
https://doi.org/10.7554/eLife.21481


