Loss of Dnmt3a and Dnmt3b does not affect epidermal homeostasis but promotes squamous transformation through PPAR-γ
- Institute for Research in Biomedicine (IRB Barcelona), The Barcelona Institute of Science and Technology, Spain
- Centre for Genomic Regulation, The Barcelona Institute of Science and Technology, Spain
- Universitat Pompeu Fabra, Spain
- Catalan Institution for Research and Advanced Studies (ICREA), Spain
Figures
Figure 1 with 1 supplement

Dnmt3a loss shortens the onset of carcinogen-induced skin neoplasia, and increases tumor burden.
(A) Representative pictures of wild-type and Dnmt3a-cKO animals after 5 months of treatment with DMBA/TPA. Graph in panel A represents the percentage of animals WT (n = 6) or Dnmt3a-cKO (n = 6) that entered into anagen after 2 weeks of treatment of DMBA/TPA, p=0.02, Chi-Square test. (B) Time of appearance, expressed in percentages of skin tumors on wild-type or Dnmt3a-cKO animals, p=0.005. (C) Number of skin tumors after 3 or 6 months of DMBA/TPA treatment, p=0.001 and p=0.0007. (D) Representative images (hematoxylin/eosin staining) of different subtypes of skin tumors. (E) Histopathological analysis of the different subsets of skin tumors that appeared after DMBA/TPA treatment of wild-type or Dnmt3a-cKO animals.
-
Figure 1—source data 1
Data related to Figure 1B and Figure 1C.
Data showing the days from the DMBA/TPA treatment to the appearance of the first tumors in each wild type and Dnmt3a-cKO mouse (Figure 1B). Data showing the number of tumors counted on the backskin of the wild type and Dnmt3a-cKO after three or 6 months of DMBA/TPA treatment.
- https://doi.org/10.7554/eLife.21697.004
Figure 1—figure supplement 1

Dnmt3a is highly expressed in the basal cells of the interfollicular epidermis (IFE), and in the bulge of hair follicles in young mice.
(A–B) Immunofluorescence staining for Dnmt3a, Keratin 14 and Nuclei of wild type back skin (A) and tail skin (B) isolated at different ages. (C) Fpkm values of the Dnmts from RNA-seq data performed in wild type interfollicular epidermal stem cells (IFE, n = 4) and hair follicle stem cells (Bulge, n = 3) FACS sorted after 6 weeks of DMBA/TPA treatment (D) Immunofluorescence staining for Dnmt3a and keratin 14 of the back skin from wild-type or Dnmt3a-cKO animals. (E) Representative images (hematoxylin/eosin staining) of the back skin from wild-type and Dnmt3a-cKO littermates at different ages. (F) Representative Images of one wild type and one Dnmt3a-cKO littermate (both females) age of five weeks.
Figure 2 with 6 supplements
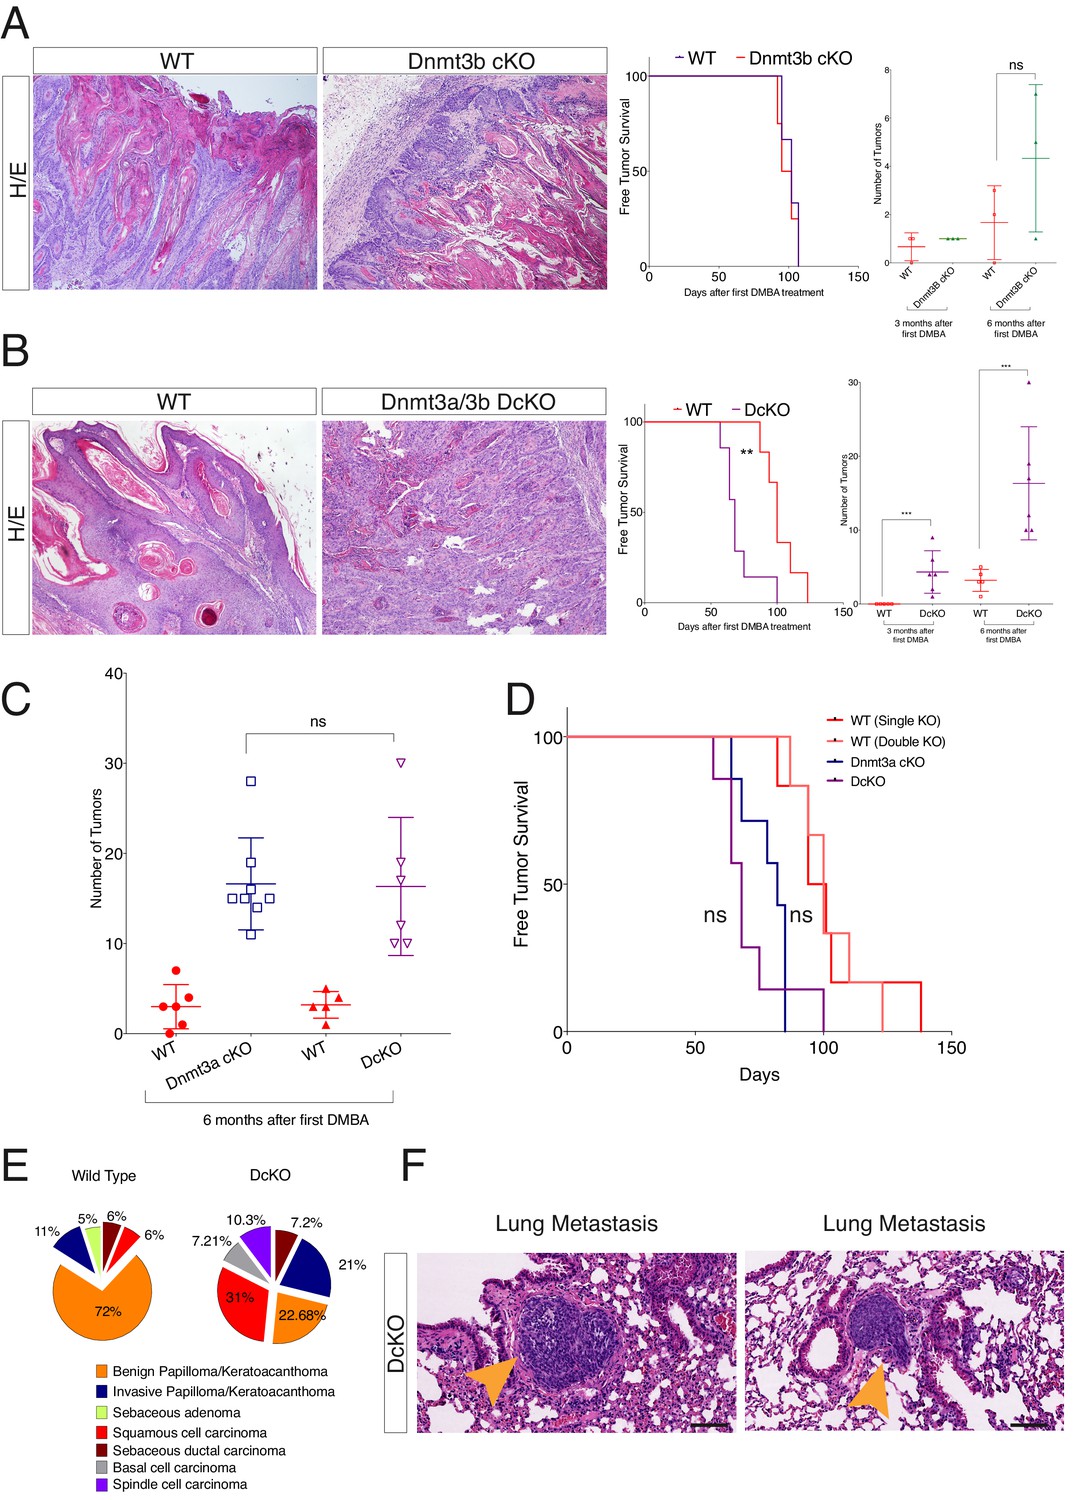
Dnmt3a and Dnmt3b double cKO animals develop more aggressive tumors than wild-type, Dnmt3a-cKO and Dnmt3b-cKO mice.
(A) Left, representative images (hematoxylin/eosin staining) of skin tumors isolated from wild type and Dnmt3b-cKO littermates after 6 months of DMBA/TPA treatment. Right, time of appearance of tumors shown as percentages in wild-type and Dnmt3b-cKO animals, and number of skin tumors after 3 or 6 months of DMBA/TPA treatment. (B) Left, representative images (hematoxylin/eosin staining) of skin tumors isolated from wild type and Dnmt3a/Dnmt3b DcKO littermates after 6 months of DMBA/TPA treatment. Right, time of appearance of tumors represented as percentages in wild-type and Dnmt3a/Dnmt3b DcKO animals, and number of skin tumors after 3 or 6 months of treatment with DMBA/TPA. (C–D) Number of tumors (left) and time of appearance (right) expressed as percentages, in wild type, Dnmt3a-cKO and DcKO animals after 6 months of DMBA/TPA treatment. (E) Histopathological analysis of the different subsets of skin tumors that appeared after DMBA/TPA treatment of wild type or DcKO animals. (F) Representative images of metastatic nodules identified only in a percentage (33%) of the lungs of DcKO animals, scale bar = 100 μm.
Figure 2—figure supplement 1
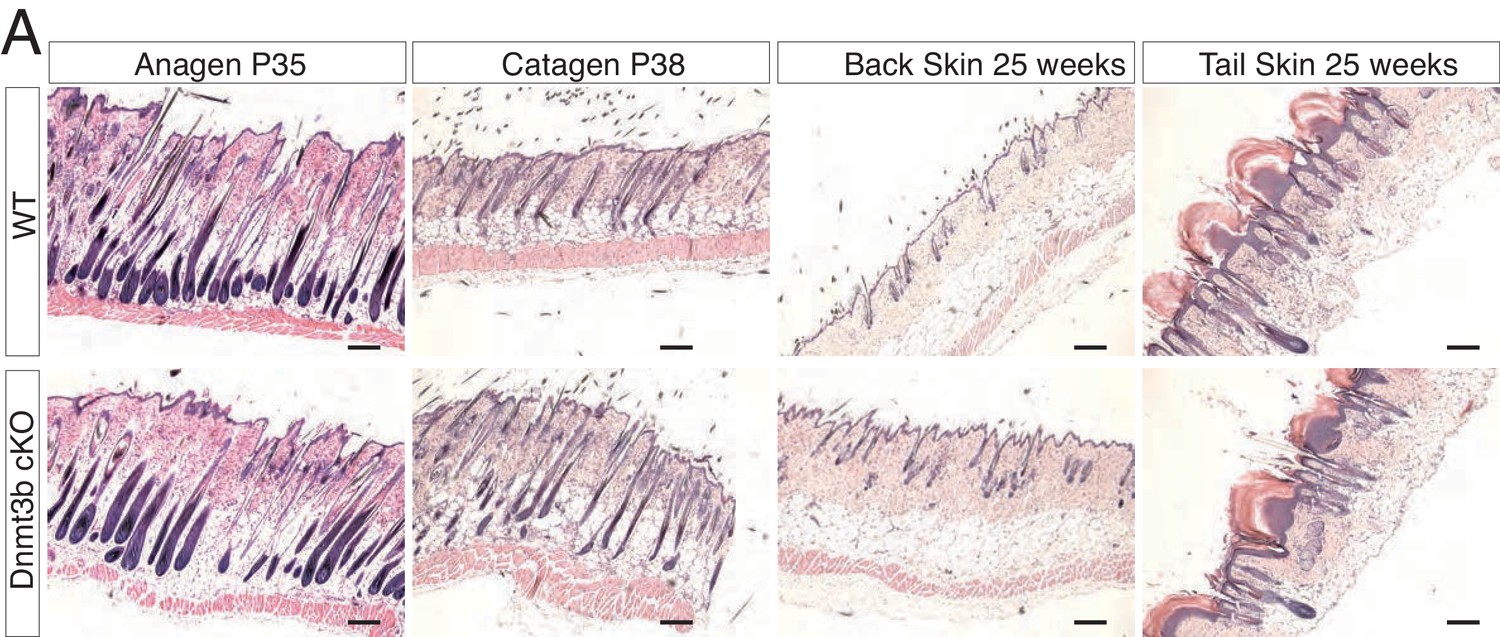
Deletion of Dnmt3b does not affect epidermal and hair follicle homeostasis.
Representative images (hematoxylin/eosin staining) of back skin and tail skin from wild type and Dnmt3b-cKO littermates at different ages.
Figure 2—figure supplement 2
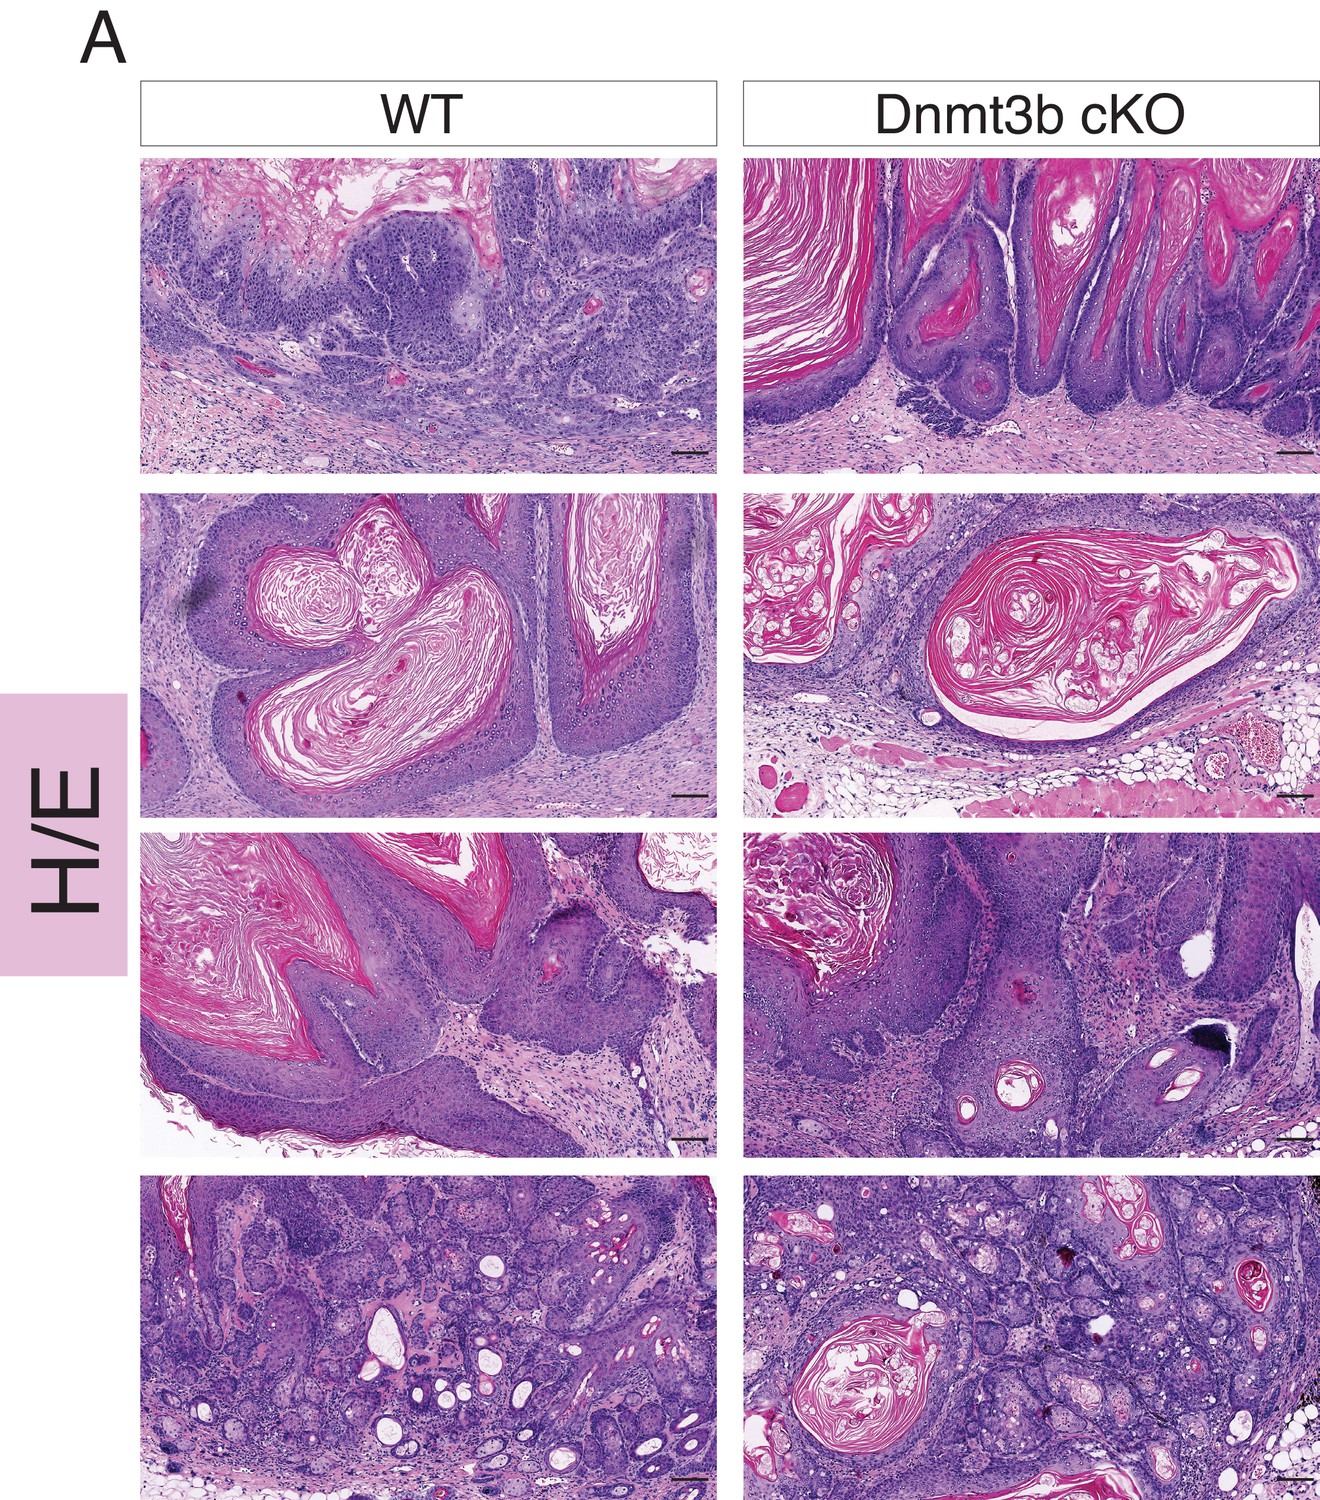
Dnmt3b-KO and wild-type skin tumors are histologically indistinguishable.
Representative images (hematoxylin/eosin staining) of different skin tumors isolated from wild type and Dnmt3b-cKO after 6 months of DMBA/TPA treatment.
Figure 2—figure supplement 3
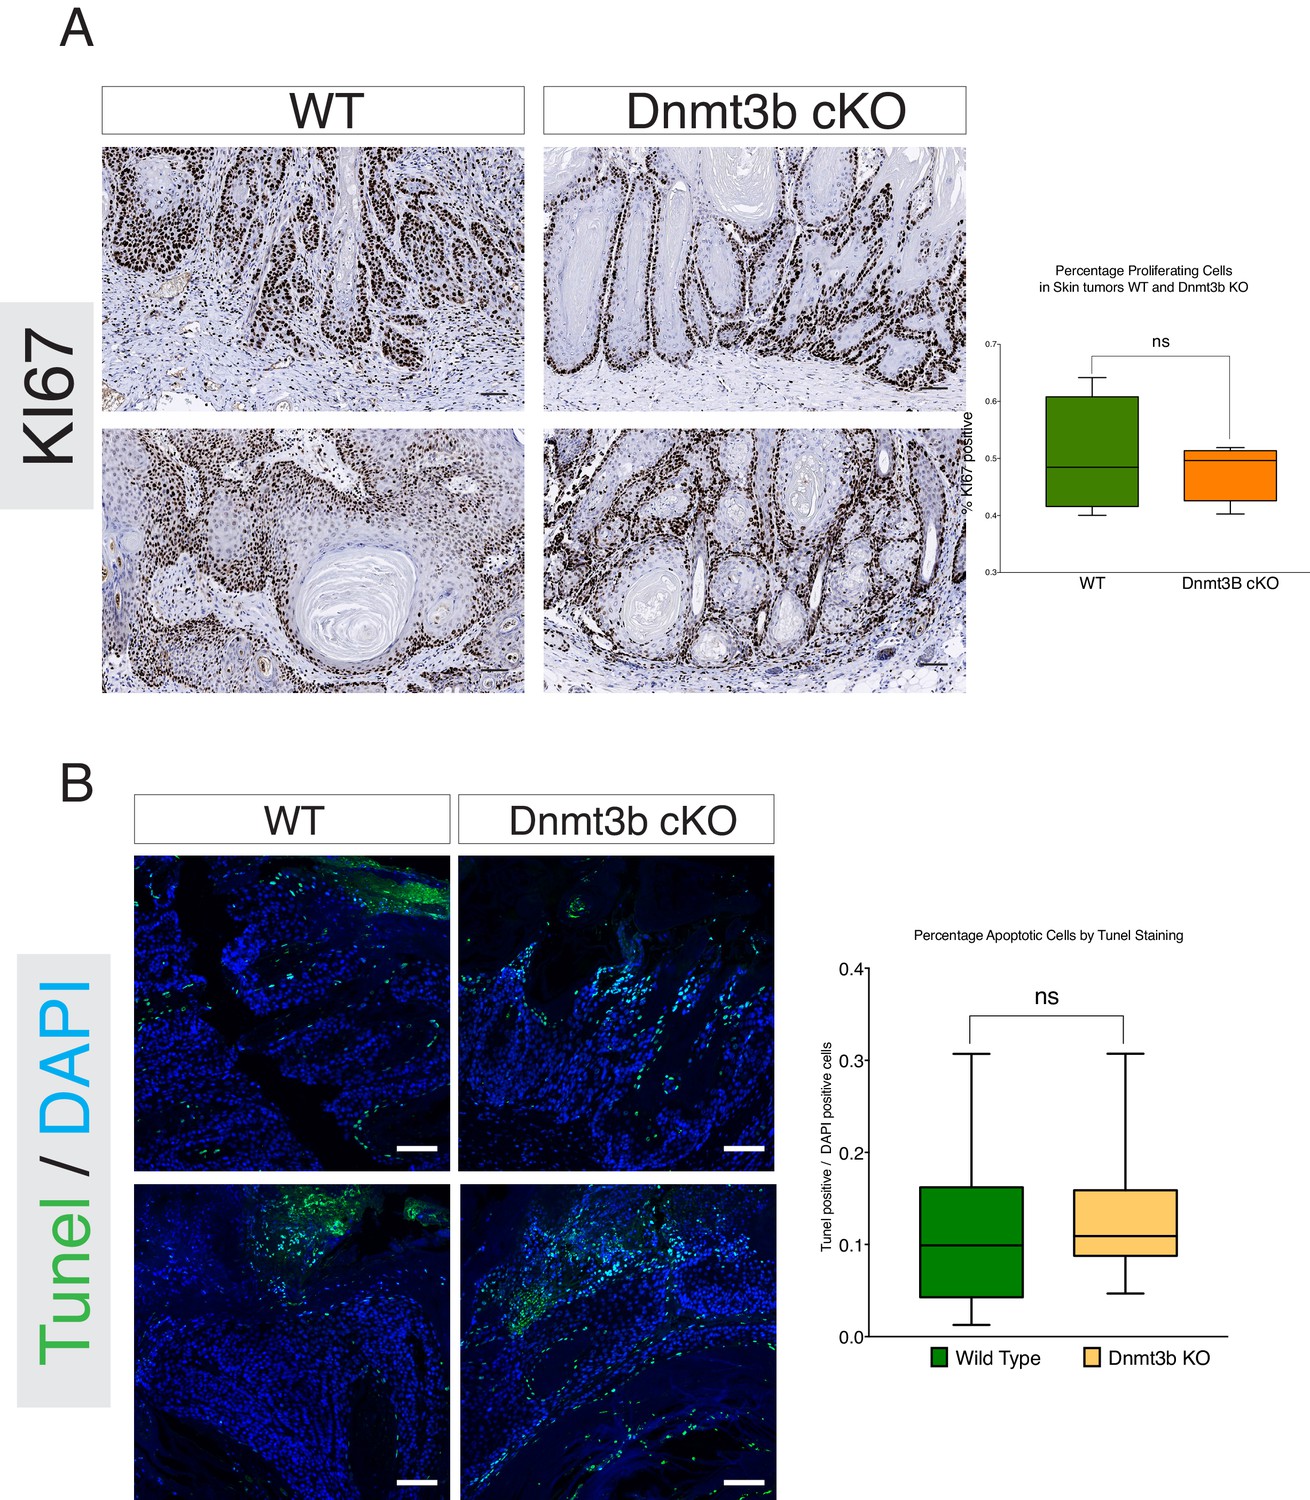
Dnmt3b-KO tumors do not show changes in proliferation or apoptosis compared to their wild-type counterparts.
(A) Left- Representative images of immunohistochemistry staining against the cell proliferation marker KI67 in skin tumors isolated from wild type and Dnmt3b-cKO after 6 months of DMBA/TPA treatment. Right- Quantification of KI67 staining in wild type (n = 5) and Dnmt3b-KO (n = 5) skin tumors using the TMarker software. (B) Left-Representative images of TUNEL staining to detect apoptosis in skin tumors isolated from wild type and Dnmt3b-cKO after 6 months of DMBA/TPA treatment. Right-Quantification of Tunel staining in wild type (n = 5) and Dnmt3b-KO (n = 5) skin tumors using the TMarker software. Unpaired T-Test was used for statistics.
Figure 2—figure supplement 4
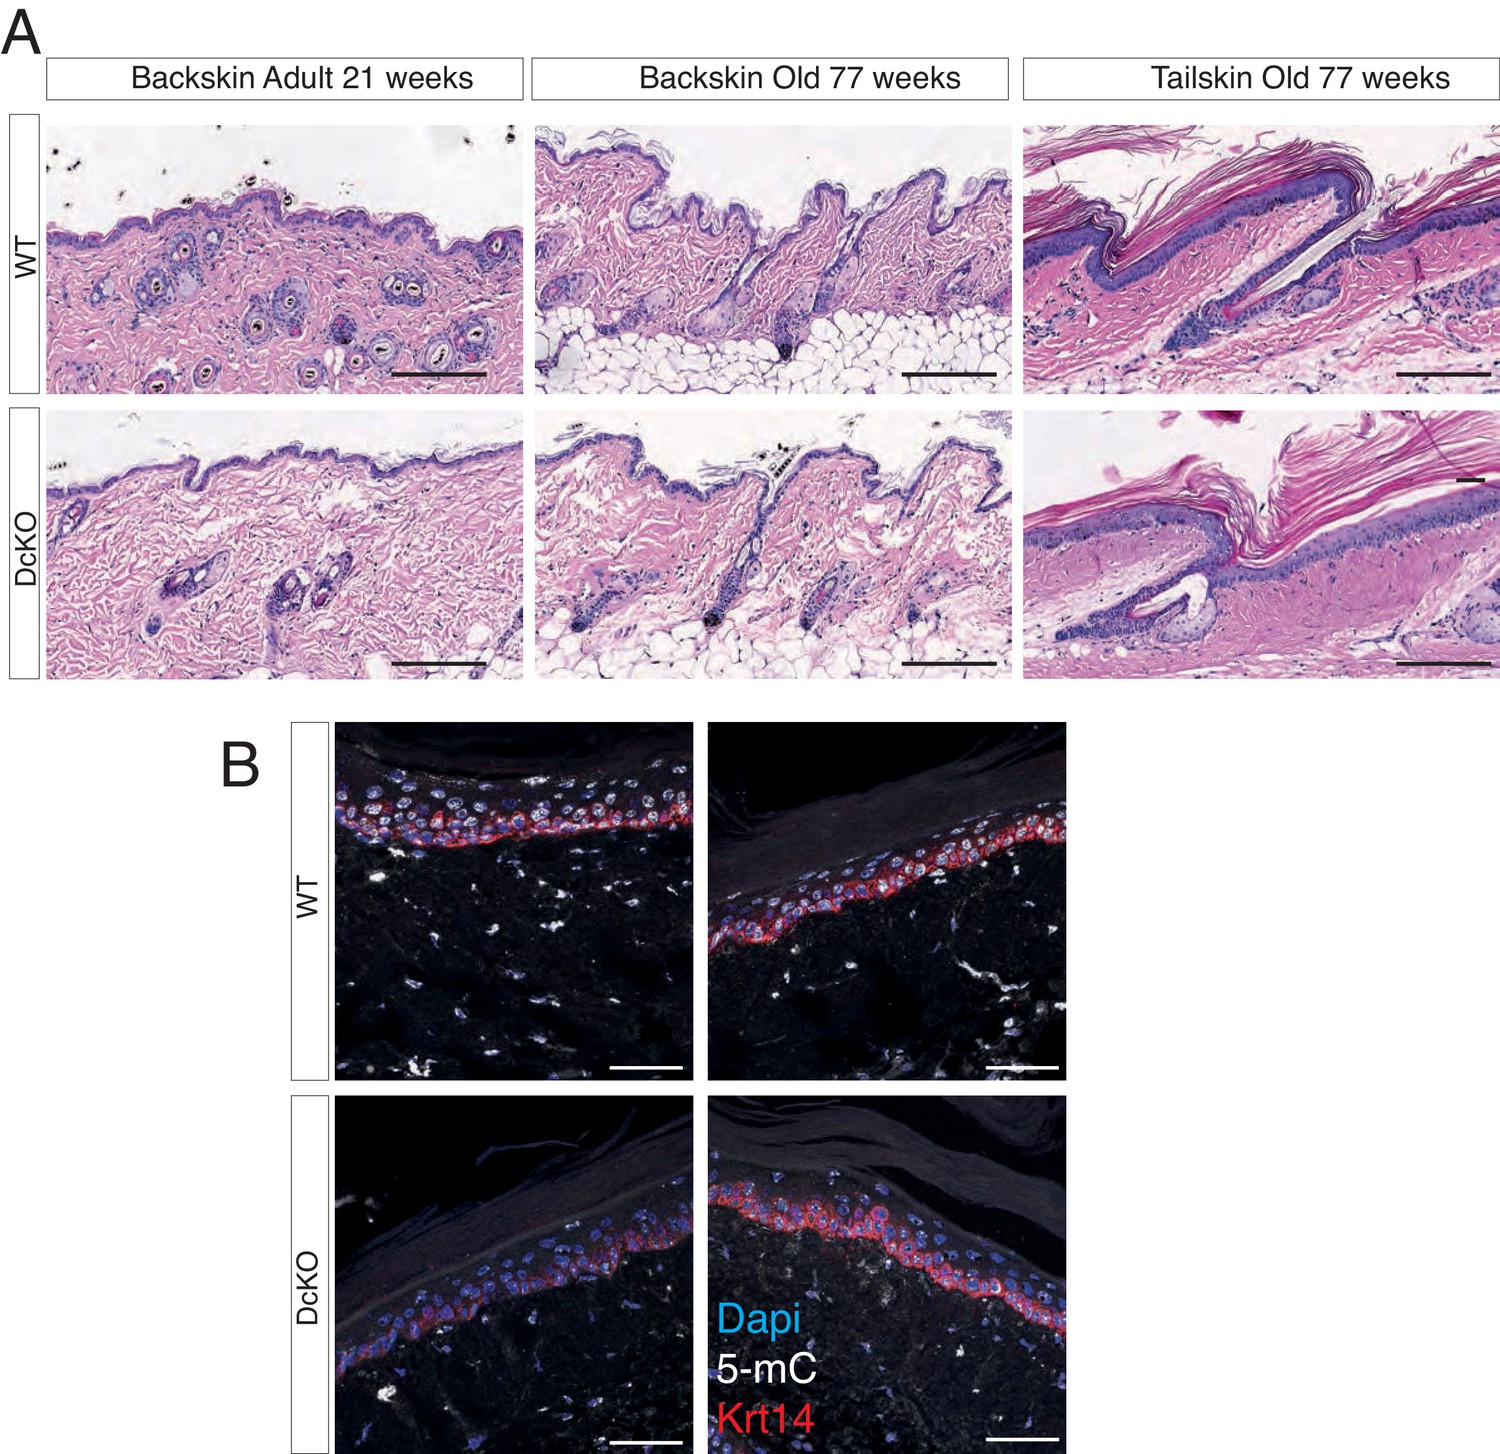
The combined deletion of Dnmt3a and Dnmt3b does not affect epidermal homeostasis.
(A) Representative images (hematoxylin/eosin staining) of back skin and tail skin from adult and aged wild type and DcKO littermates. (B) Immunofluorescence staining for 5-methylcytosine and Keratin 14 in aged (over 70 weeks old) wild type and DcKO littermates.
Figure 2—figure supplement 5
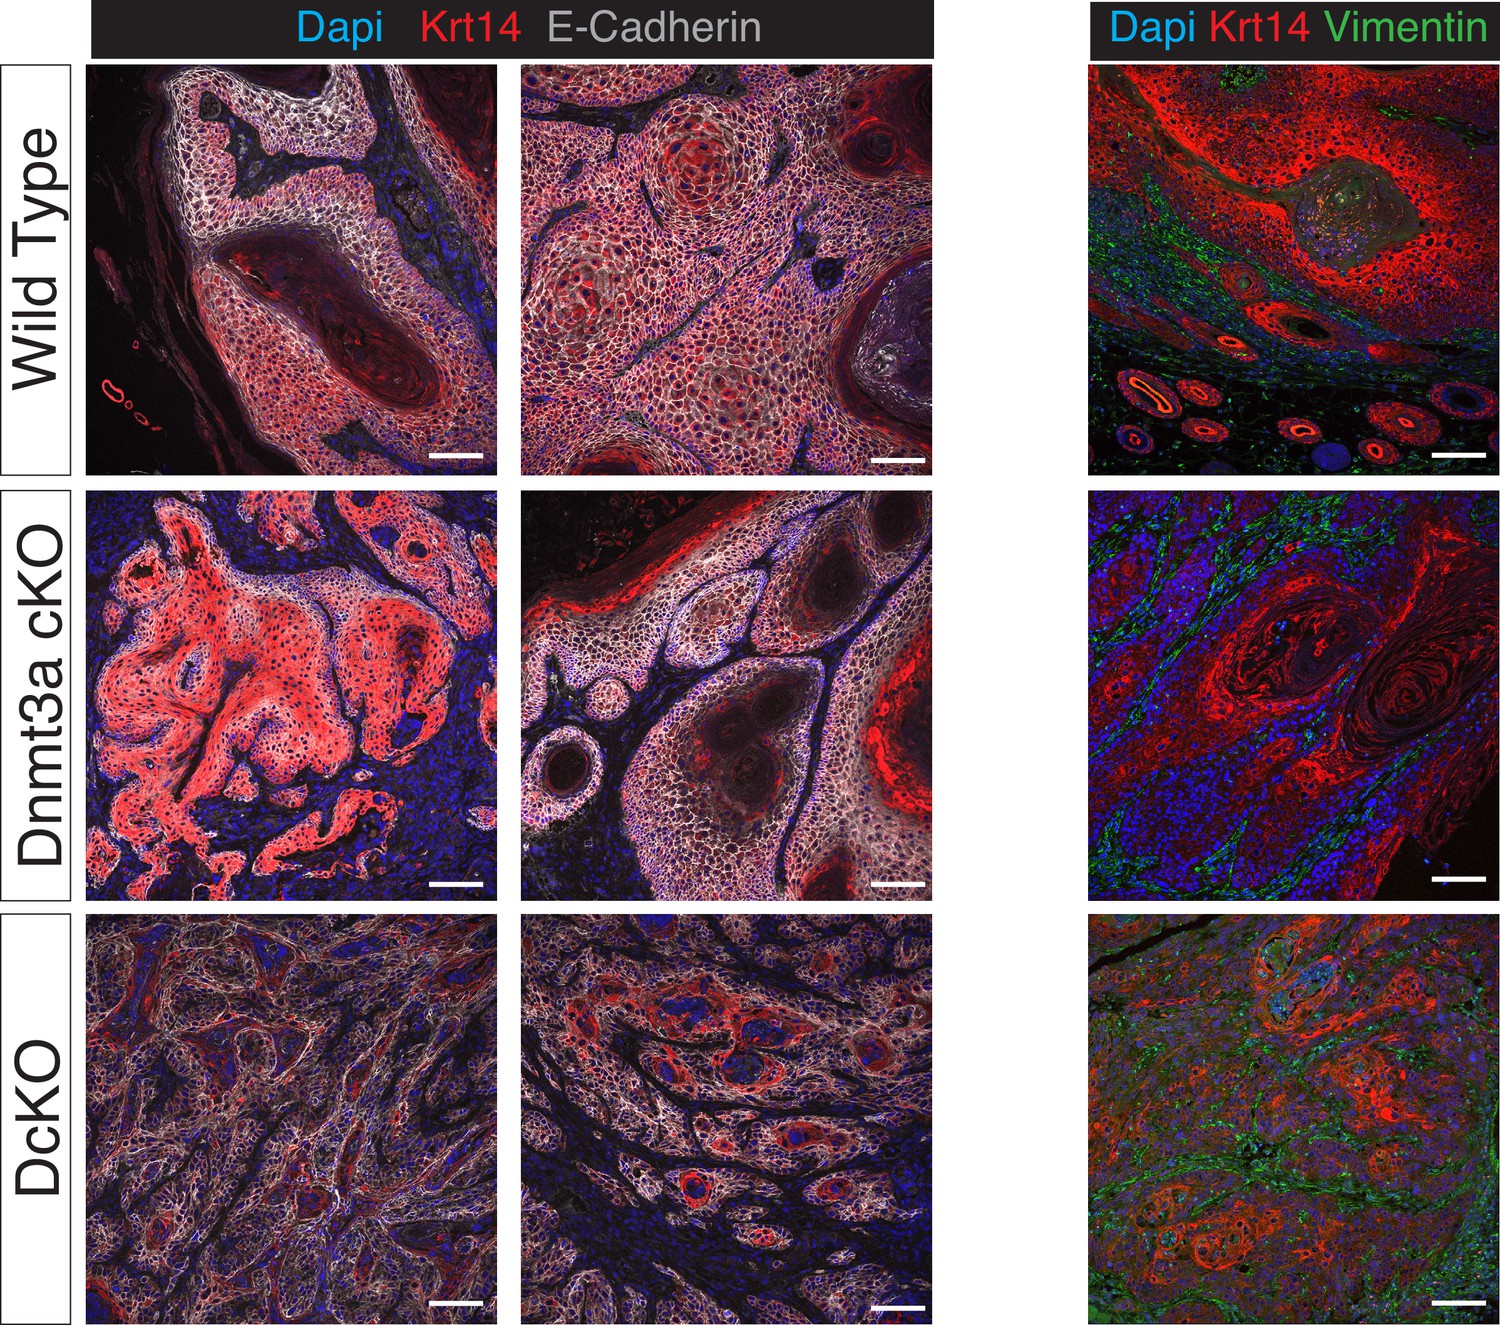
Squamous cell carcinomas in Dnmt3a/Dnmt3b double KO mice express lower levels of epithelial markers compared to wilt-type tumors.
(A) Representative confocal images for E-Cadherin, Keratin 14 and DAPI in wild type, single Dnmt3a KO and double Dnmt3a/Dnmt3b KO squamous cell carcinomas. (B) Representative confocal images for Vimentin, Keratin 14 and DAPI in wild type, single Dnmt3a-cKO and double Dnmt3a/Dnmt3b cKO squamous cell carcinomas.
Figure 2—figure supplement 6
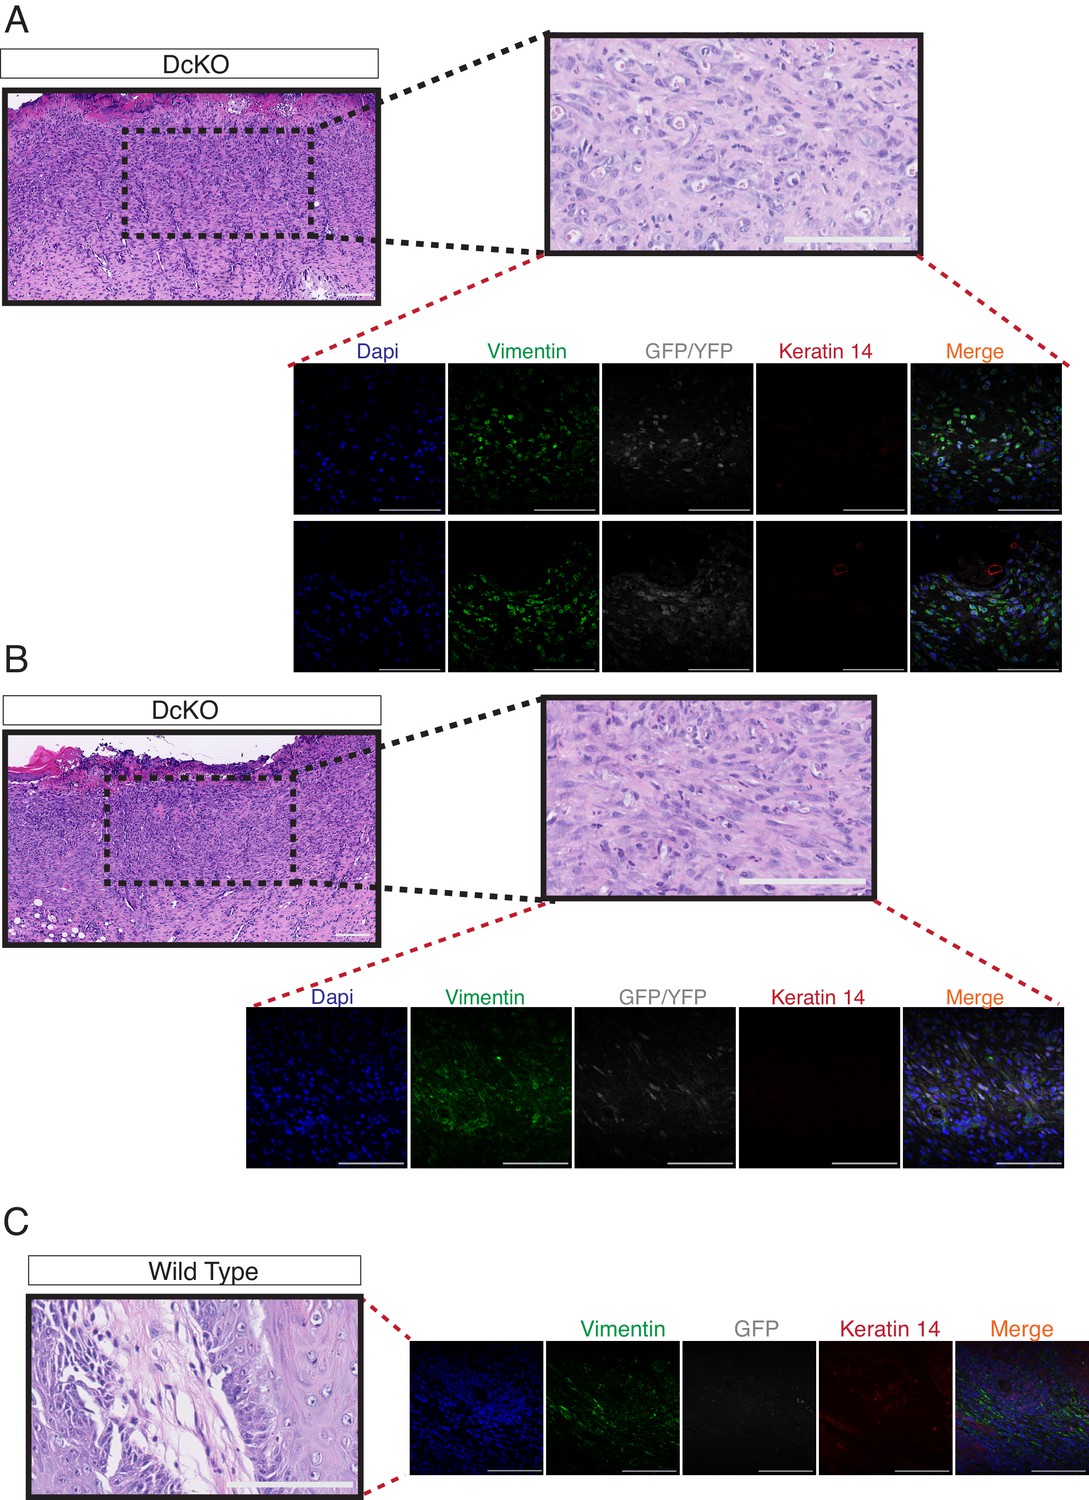
The combined deletion of Dnmt3a and Dnmt3b favors the development of skin tumors with features of spindle cell carcinomas.
(A–B) Hematoxylin/eosin staining and confocal images of two different spindle cell carcinomas developed in two DcKO animals. Representative images of immunofluorescence staining to detect the expression of Vimentin, YFP and Keratin14. (C) Hematoxylin/eosin staining and confocal images of the stroma of a squamous cell carcinoma developed by a wild-type animal showing the absence of expression of Vimentin in the epithelial compartment of the tumor. Immunofluorescence staining shown correspond to Vimentin (green), YFP (grey), and Keratin14 (red).
Figure 3 with 4 supplements
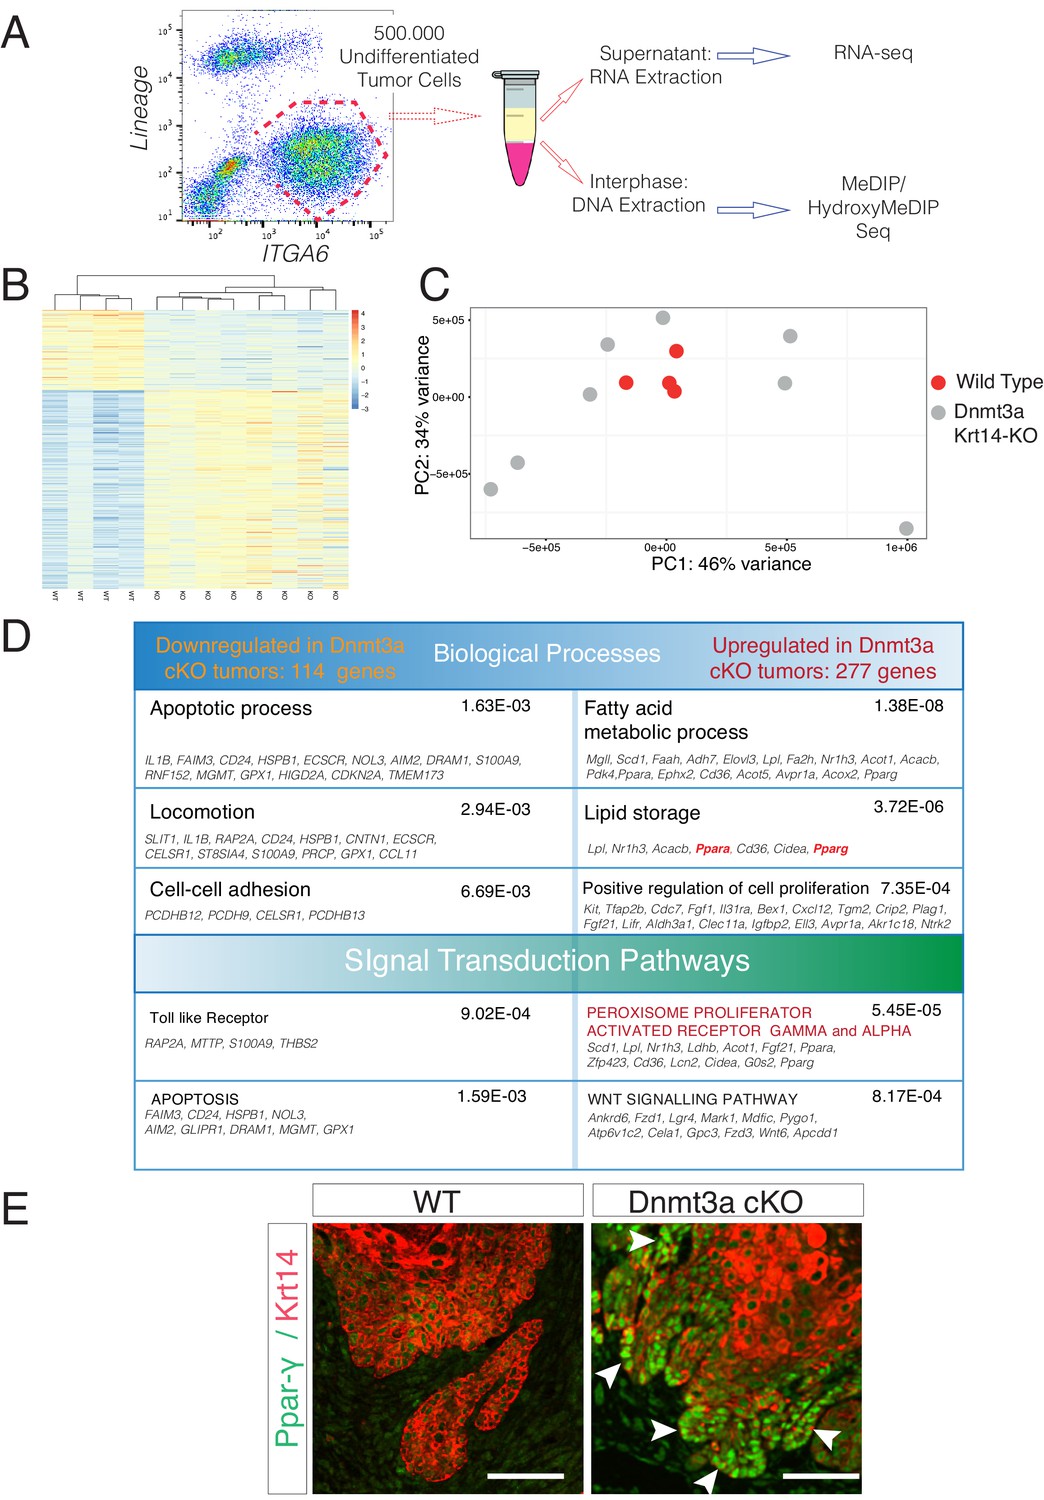
Deletion of Dnmt3a results in increased tumor heterogeneity, and upregulation of genes related to lipid metabolism.
(A) Schematic representation of FACS sorting strategy to isolate both RNA and DNA from Itga6pos cells within the tumors. (B) Heatmaps representing gene expression (rlog transformed values) of the 391 differentially expressed genes between wild type and Dnmt3a-cKO sorted tumor cells. (C) Two-dimensional principal-component analysis (PCA) of RNA-seq samples from wild-type (n = 4) and Dnmt3a-cKO (n = 8) Itga6bright sorted tumor cells. (D) Gene ontology analysis using Genomatix Online Software of the 114 downregulated and 277 upregulated genes in Dnmt3a-cKO tumors, divided by biological processes and over-represented signal transduction pathways. (E) Immunofluorescence staining for Krt14 and PPAR-γ of skin tumors from wildtype and Dnmt3a-cKO animals.
Figure 3—figure supplement 1
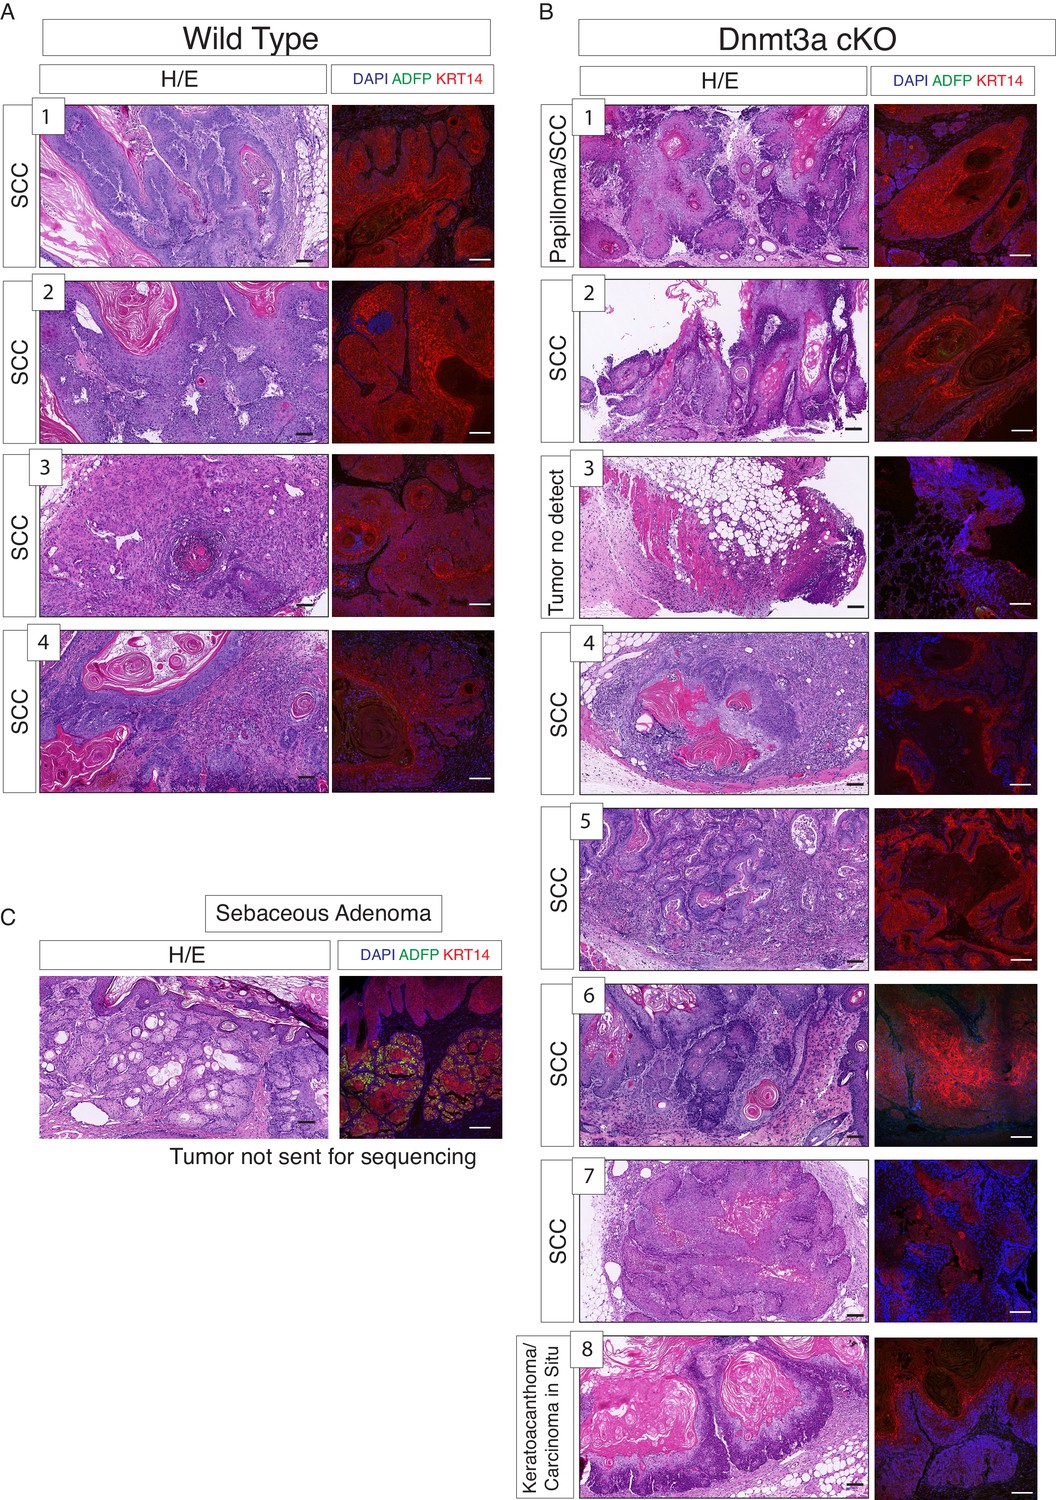
RNA samples submitted for sequencing were obtained from tumors scored predominantly as squamous cell carcinomas in wild-type and Dnmt3a-cKO mice.
(A) Hematoxylin/eosin staining from the four wild-type tumors used for RNA-seq. (B) Hematoxylin/eosin staining from the eight Dnmt3a-cKO tumors analyzed for RNA-seq. In A and B, immunofluorescence staining shown correspond to DAPI, ADFP (to ensure that no sebaceous adenomas were collected), and Krt14. (C) Representative hematoxylin/eosin staining and immunofluorescence of DAPI, ADFP and Krt14, of sebaceous adenomas eliminated from the RNA-seq study. Scale bar is 100 μm.
Figure 3—figure supplement 2

Loss of Dnmt3a results in a reduction of apoptosis in skin tumors.
(A) Representative images for TUNEL staining to detect apoptotic cells in skin tumors isolated from wild type and Dnmt3a-cKO animals. The right graph shows the quantification of the Tunel staining in wild type (n = 12) and Dnmt3a-cKO (n = 17) tumors. (B) Representative images for active Caspase-3 staining to visualize apoptotic cells in skin tumors isolated from wild-type and Dnmt3a-cKO animals. The right panel shows the quantification of the staining in wild-type (n = 6) and Dnmt3a-cKO (n = 6) tumors. Scale bar is 100 μm.
-
Figure 3—figure supplement 2—Source Data 1
Data related to Figure 3—figure supplement 2A–B.
Number of apoptotic cells (expressed in percentage of TUNEL or CASPASE-3 positive cells/DAPI positive cells) in wild-type and Dnmt3a-cKO tumors.
- https://doi.org/10.7554/eLife.21697.016
Figure 3—figure supplement 3

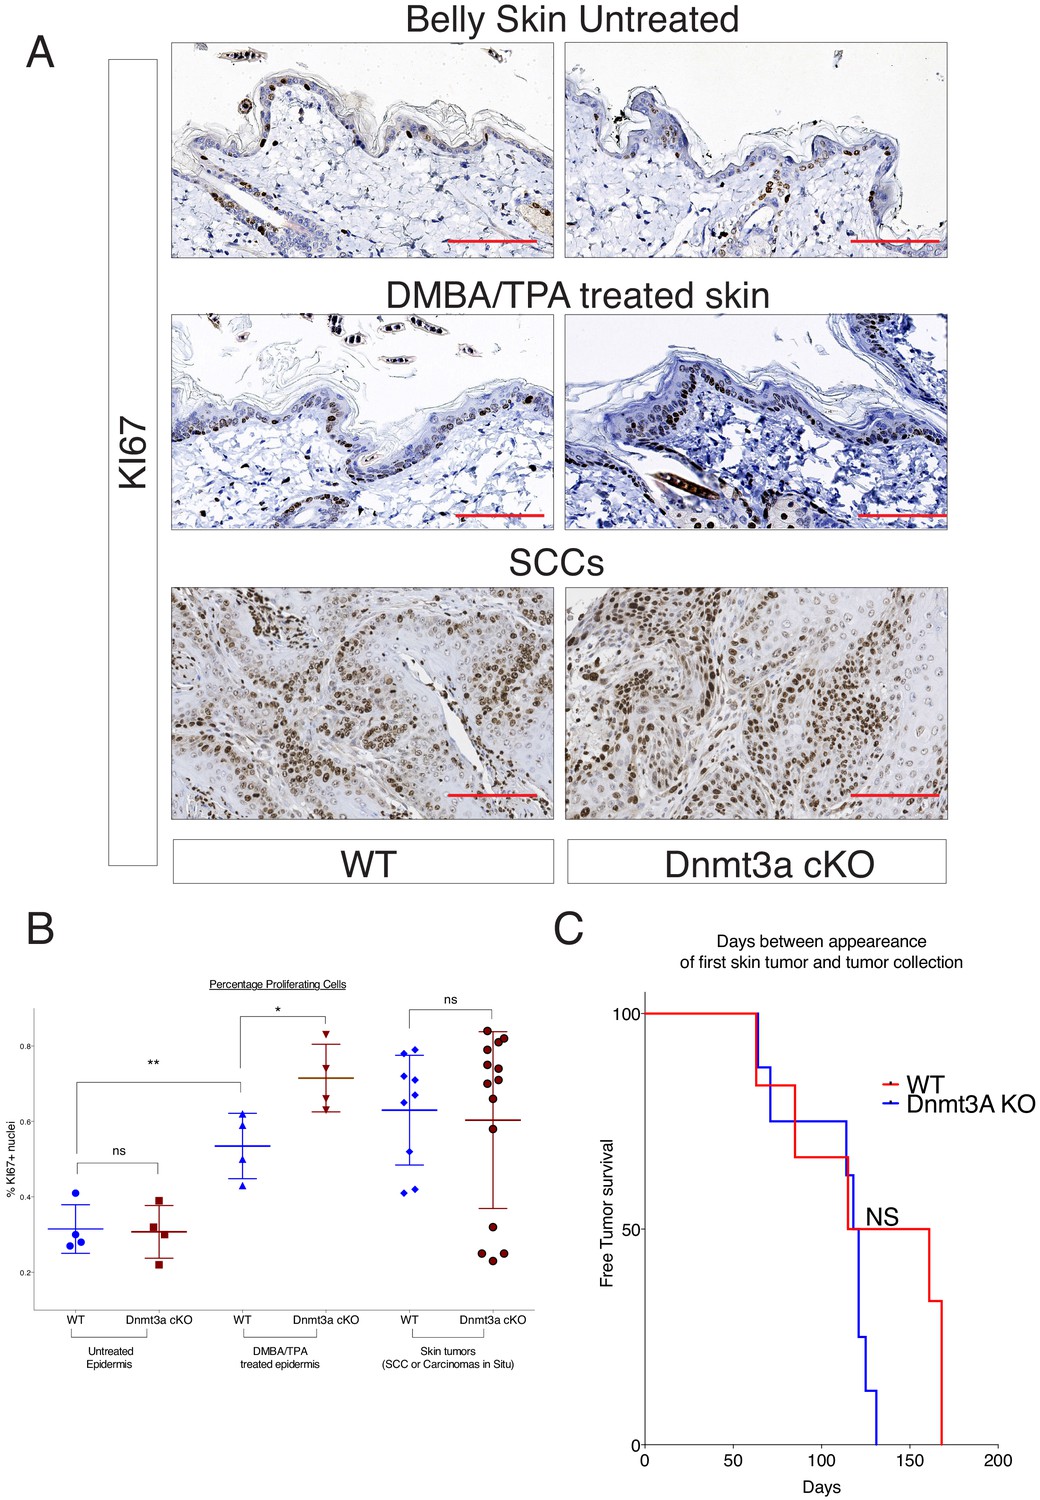
DMBA/TPA treatment induces an increase in cellular cell proliferation in Dnmt3a-cKO animals.
(A) Representative images of KI67 staining in treated or untreated back skin, and in skin tumors, of Dnmt3a-cKO and wild-type littermates. (B) Quantification of KI67 staining using the TMarker software, showing the percentages of KI67-positive cells in the different conditions studied and normalized to the proliferation in the interfollicular epidermis of wild-type mice. Scale bar is 100 μm.
Figure 3—figure supplement 4
Dnmt3a-KO tumors express high levels of PPAR-γ.
(A) CPM (Count per Million Read) values of the mRNA encoding for PPAR-γ obtained from the RNA-sequencing of the 12 tumors studied. (B) Representative immunofluorescence staining for DAPI, PPAR-γ and Krt14 in all the 12 tumors used for the RNA-sequencing experiment. Scale bar is 100 μm.
-
Figure 3—figure supplement 4—Source Data 1
Data related to Figure 3—figure supplement 4B.
Number of proliferative cells (expressed as the percentage of KI67+/all nuclei) in the untreated epidermis, DMBA-treated epidermis, and in the tumors, from wild-type and Dnmt3a-cKO mice.
- https://doi.org/10.7554/eLife.21697.019
Figure 4 with 1 supplement
Dnmt3a binds a subset of enhancers in tumor cells.
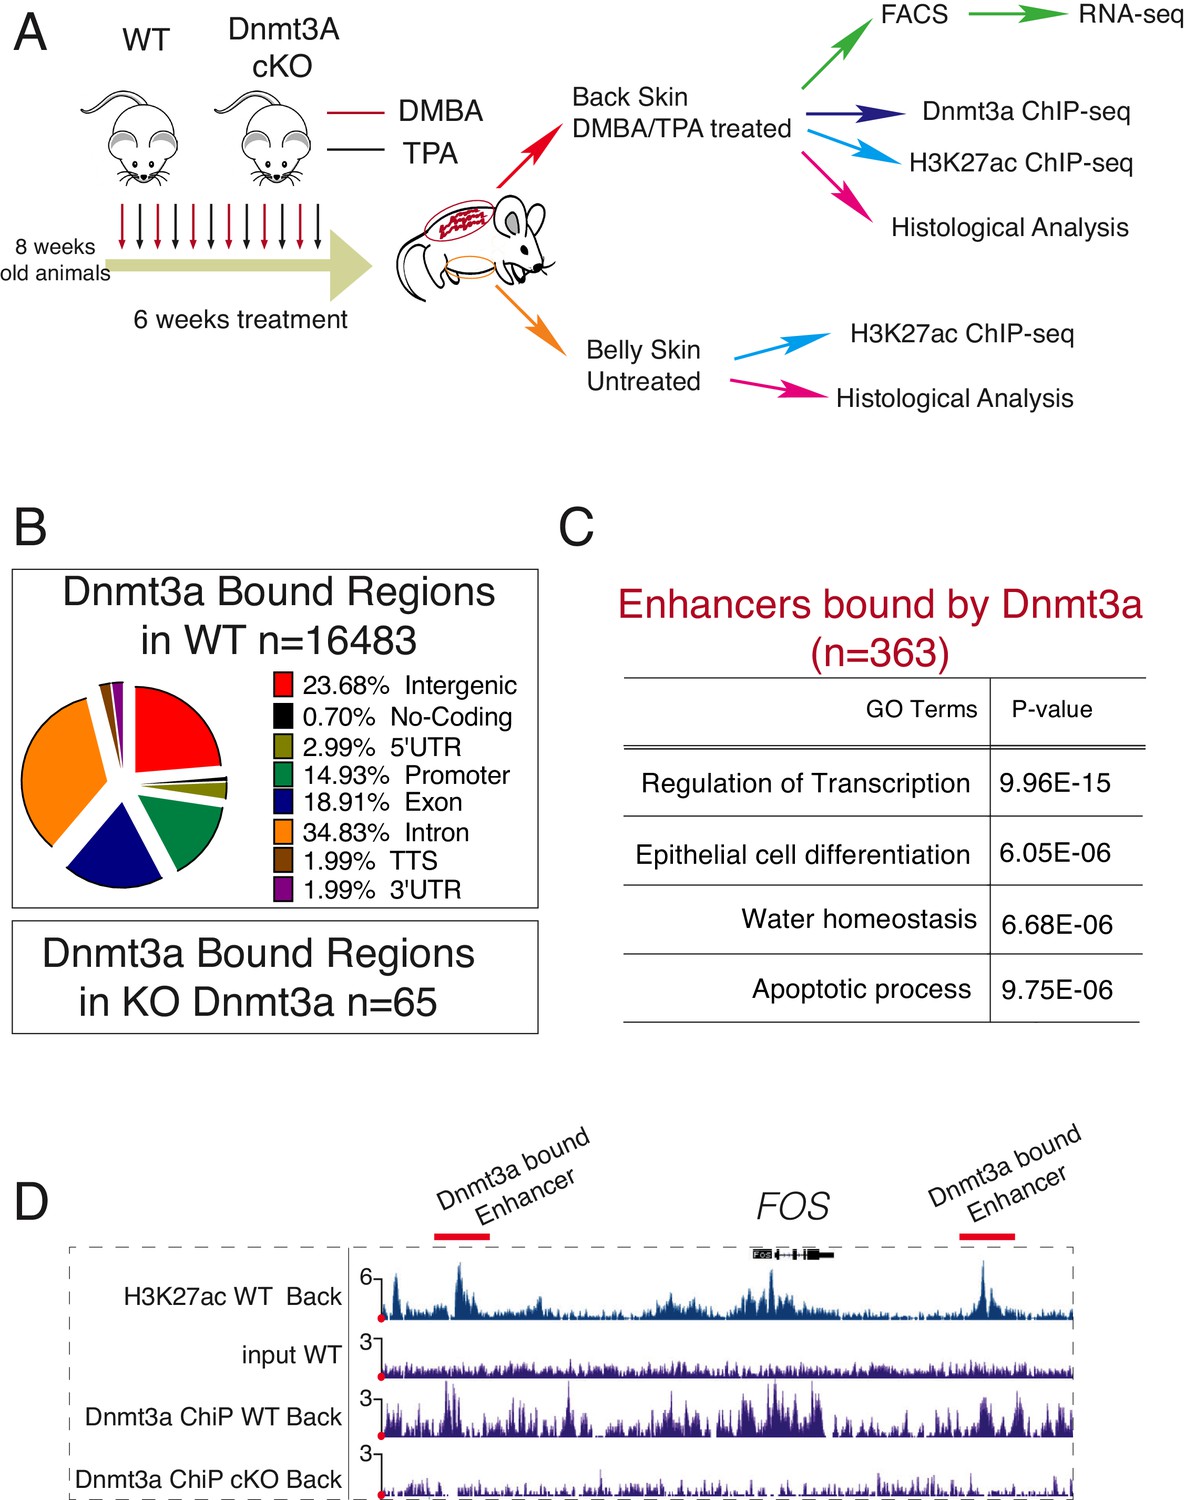
(A) Schematic representation of a short treatment of DMBA/TPA in wild-type and Dnmt3a-cKO animals. (B) Genomic localizations of Dnmt3a determined by ChIP-seq of Dnmt3a in epidermal cells isolated from wild-type animals after 6 weeks of DMBA/TPA treatment. (C) Gene ontology analysis of the 363 H3K27ac-enriched regions (located at least 4 kb away from the TSS) also bound by Dnmt3a in isolated epidermis from wild-type animals after 6 weeks of DMBA/TPA. (D) Screenshot of enhancers bound by Dnmt3a in DMBA/TPA-treated skin in the FOS locus. All tracks are normalized to the number of mapped reads.
Figure 4—figure supplement 1
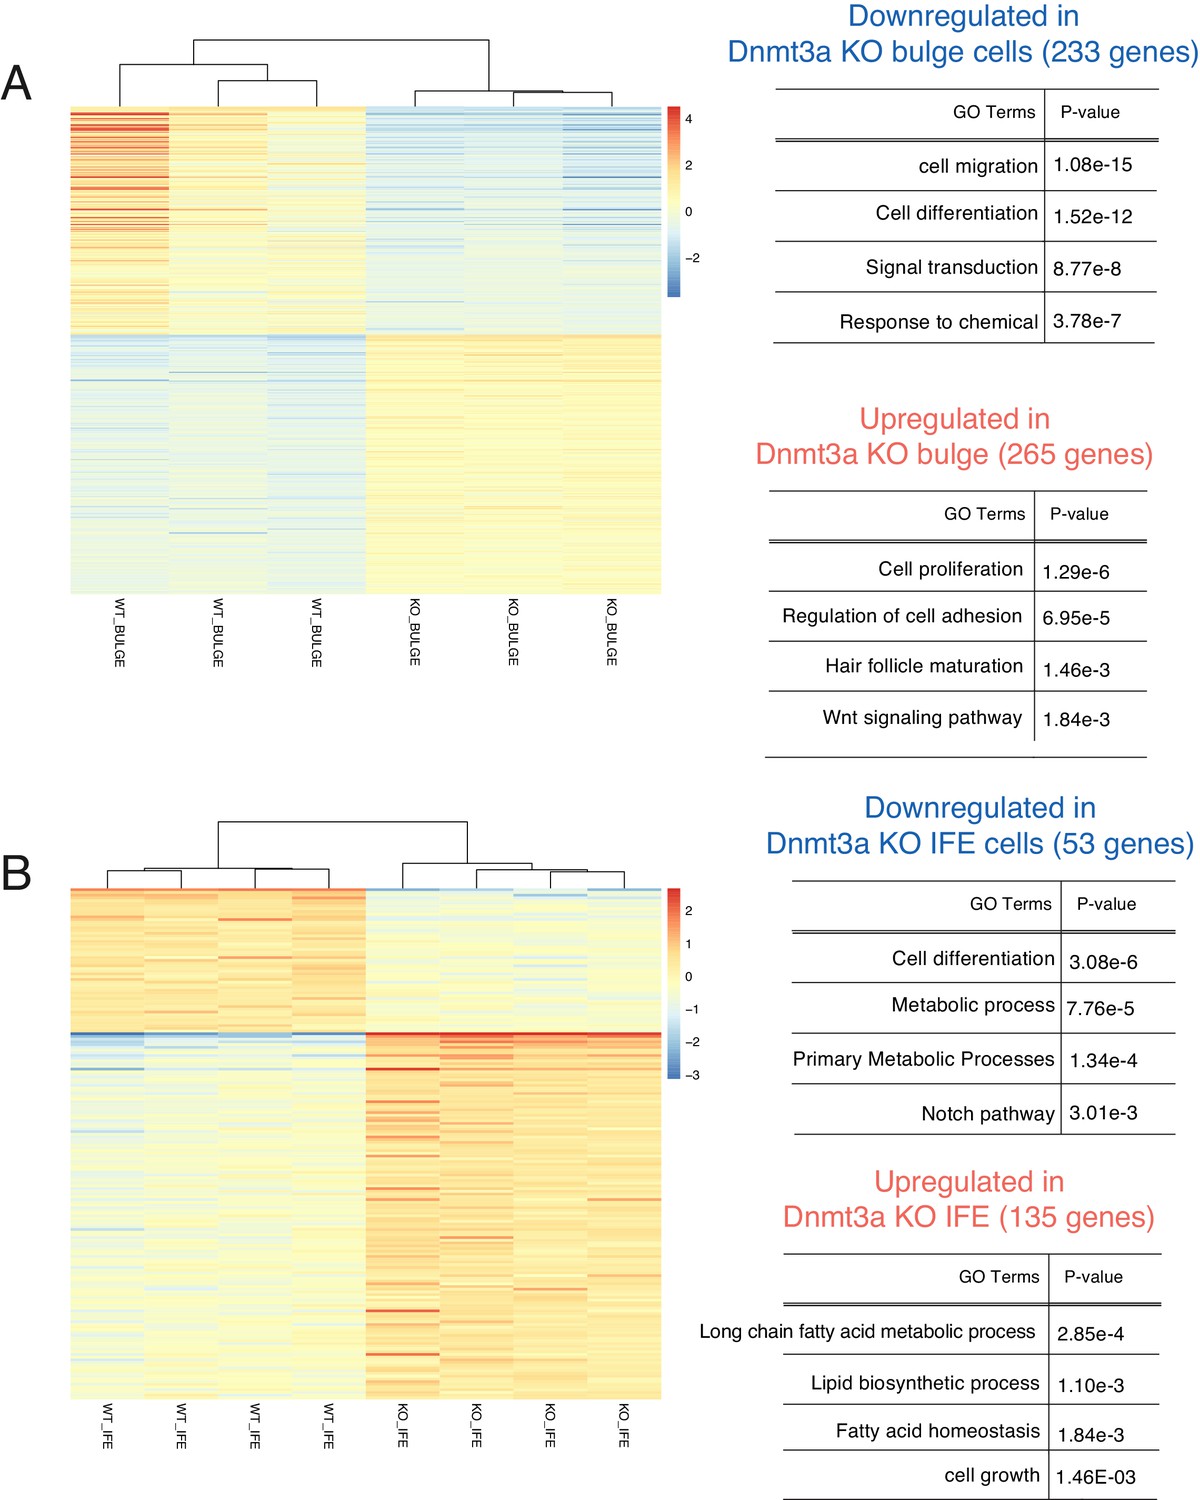
Deletion of Dnmt3a alters the expression of genes involved in proliferation, lipid metabolism, epidermal differentiation, and Wnt signaling, after 6 weeks of DMBA/TPA treatment.
(A) Left panel, heatmaps representing gene expression (rlog transformed values) of the 498 genes in sorted bulge hair follicle stem cells (Bulge) (Itga6bright/CD34pos) that were differentially expressed between wild-type (n = 3) and Dnmt3a-cKO (n = 3). Right panel, gene ontology analysis of the 498 differentially expressed genes up- or downregulated in Dnmt3a-cKO mice as compared to their wild-type littermates. (B) Left panel, heatmaps representing gene expression (rlog transformed values) of the 188 differential expressed genes between wild type (n = 4) and Dnmt3a-cKO (n = 4) sorted interfollicular epidermal (IFE) basal cells (Itga6bright/CD34neg). Right panel, gene ontology analysis of the 188 differentially expressed genes that were up- or downregulated in Dnmt3a-cKO mice as compared to their wild-type littermates.
Figure 5 with 1 supplement
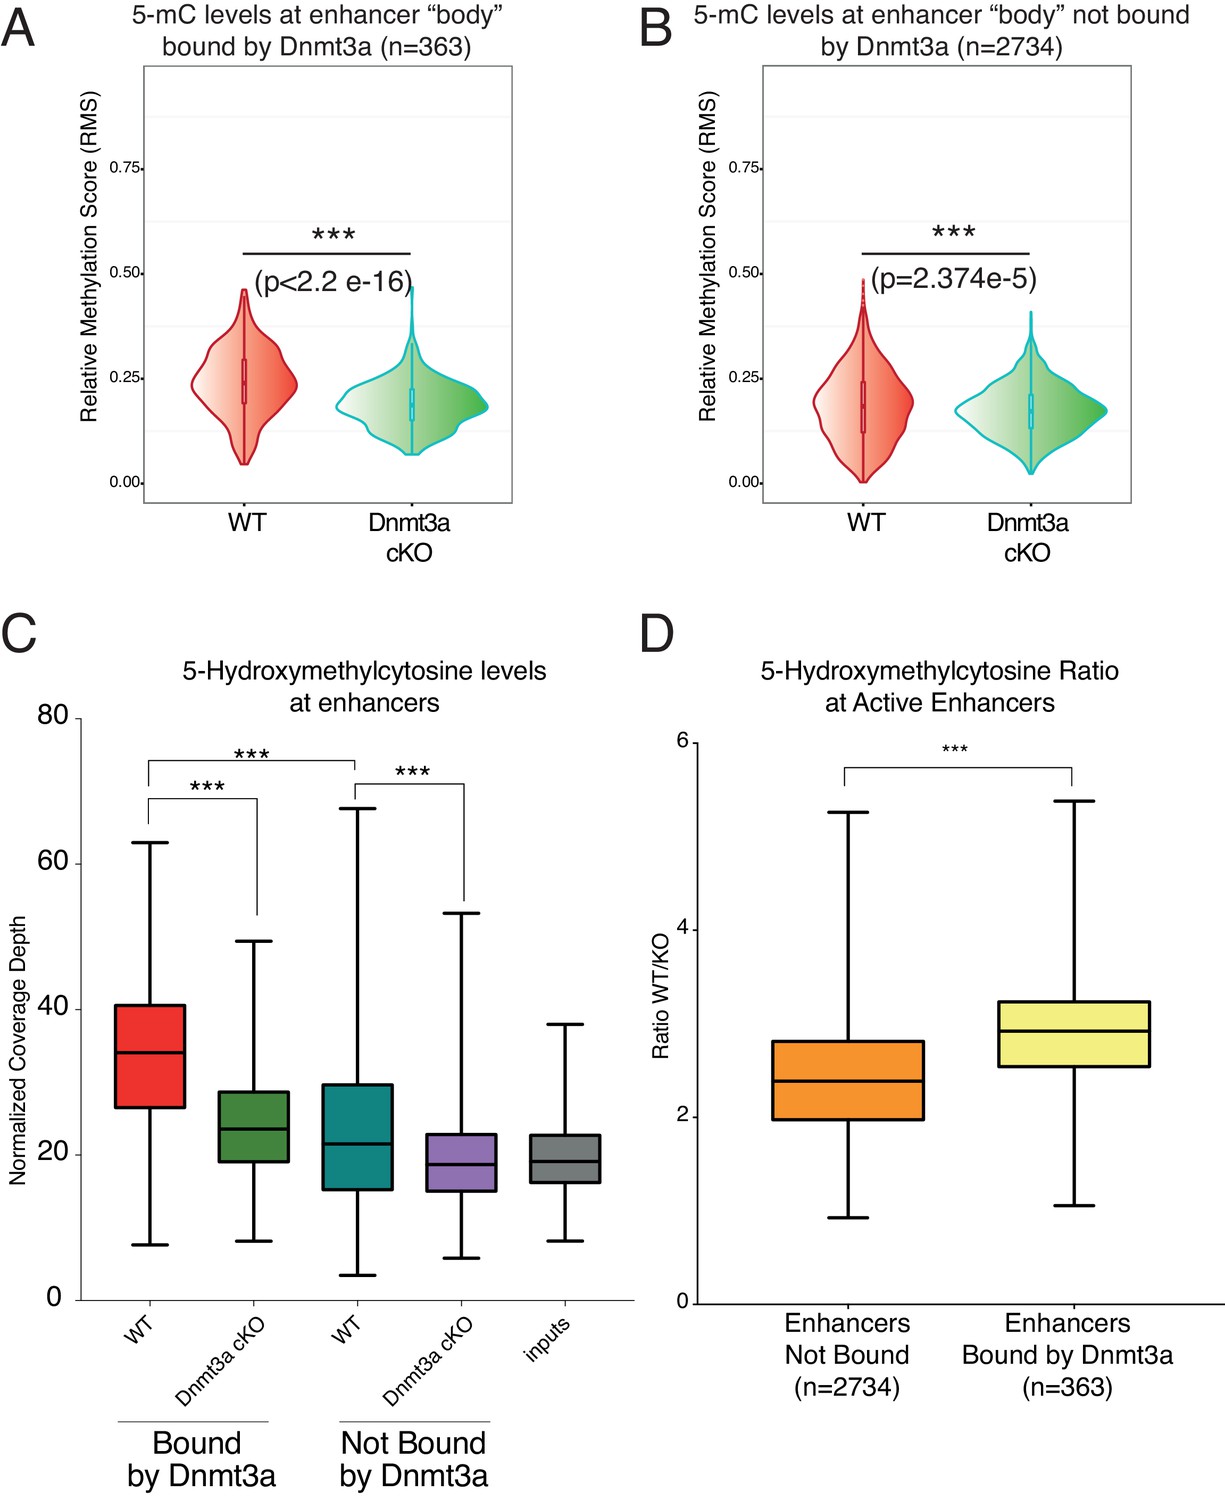
Depletion of Dnmt3a leads to loss of DNA methylation and hydroxymethylation around its target enhancers.
(A) Relative methylation score (CpG count) measured around 363 enhancers bound by Dnmt3a (–5 kb, +5 kb) from independent biological replicates of FACS sorted tumor cells from wild type (n = 2) and Dnmt3a-cKO (n = 2) (p<2.2 × 10⁻¹⁶). (B) Relative methylation score (CpG count) measured around 2734 enhancers not bound by Dnmt3a (–5 kb, +5 kb) from independent biological replicates of FACS-sorted tumor cells from wild-type (n = 2) and Dnmt3a-cKO (n = 2) animals (p=2.374e−5). (C) Global levels of 5-hmC at enhancer center (–2Kb, + 2 Kb) were quantified using HOMER software in independent biological replicates of FACS sorted tumor cells from wild-type (n = 2) and Dnmt3a-cKO (n = 2) mice at enhancers bound or not by Dnmt3a. (D) Ratio between the 5-hmC levels at enhancers bound or not by Dnmt3a in wild-type and Dnmt3a-cKO tumor cells.
Figure 5—figure supplement 1
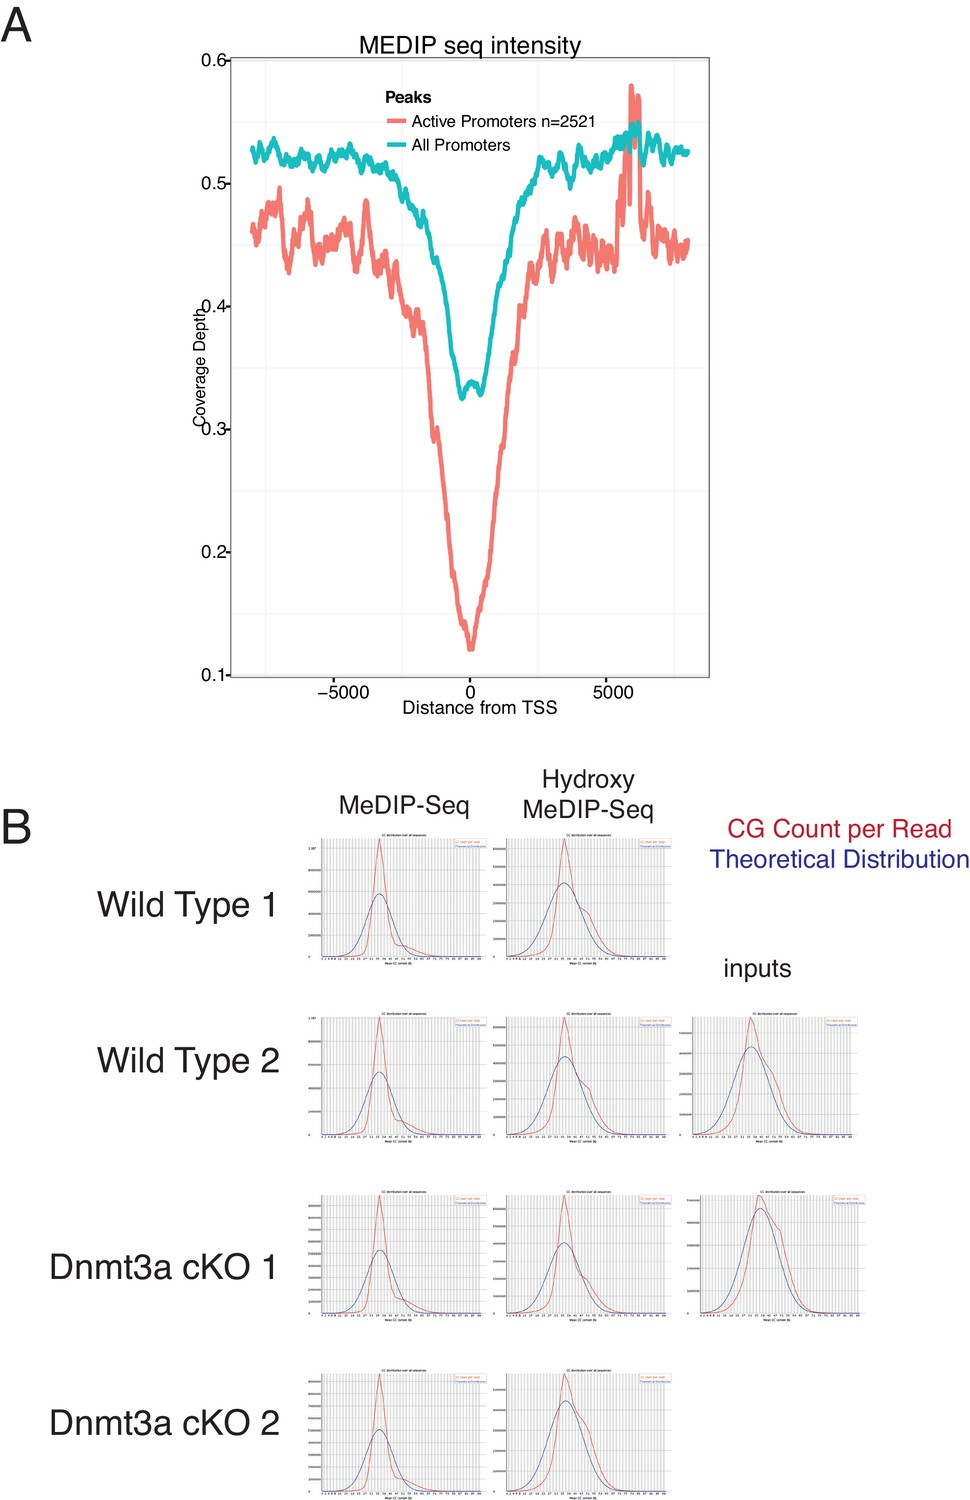
MeDIP-seq and hMeDIP-seq analysis from sorted tumor cells.
(A) CpG count reads versus theoretical distribution in MeDIP and hMeDIP samples from wild type and Dnmt3a-cKO tumors. (B) MeDIP-seq signals around active and non-active TSSs in wild-type Itga6bright tumor cells.
Figure 6
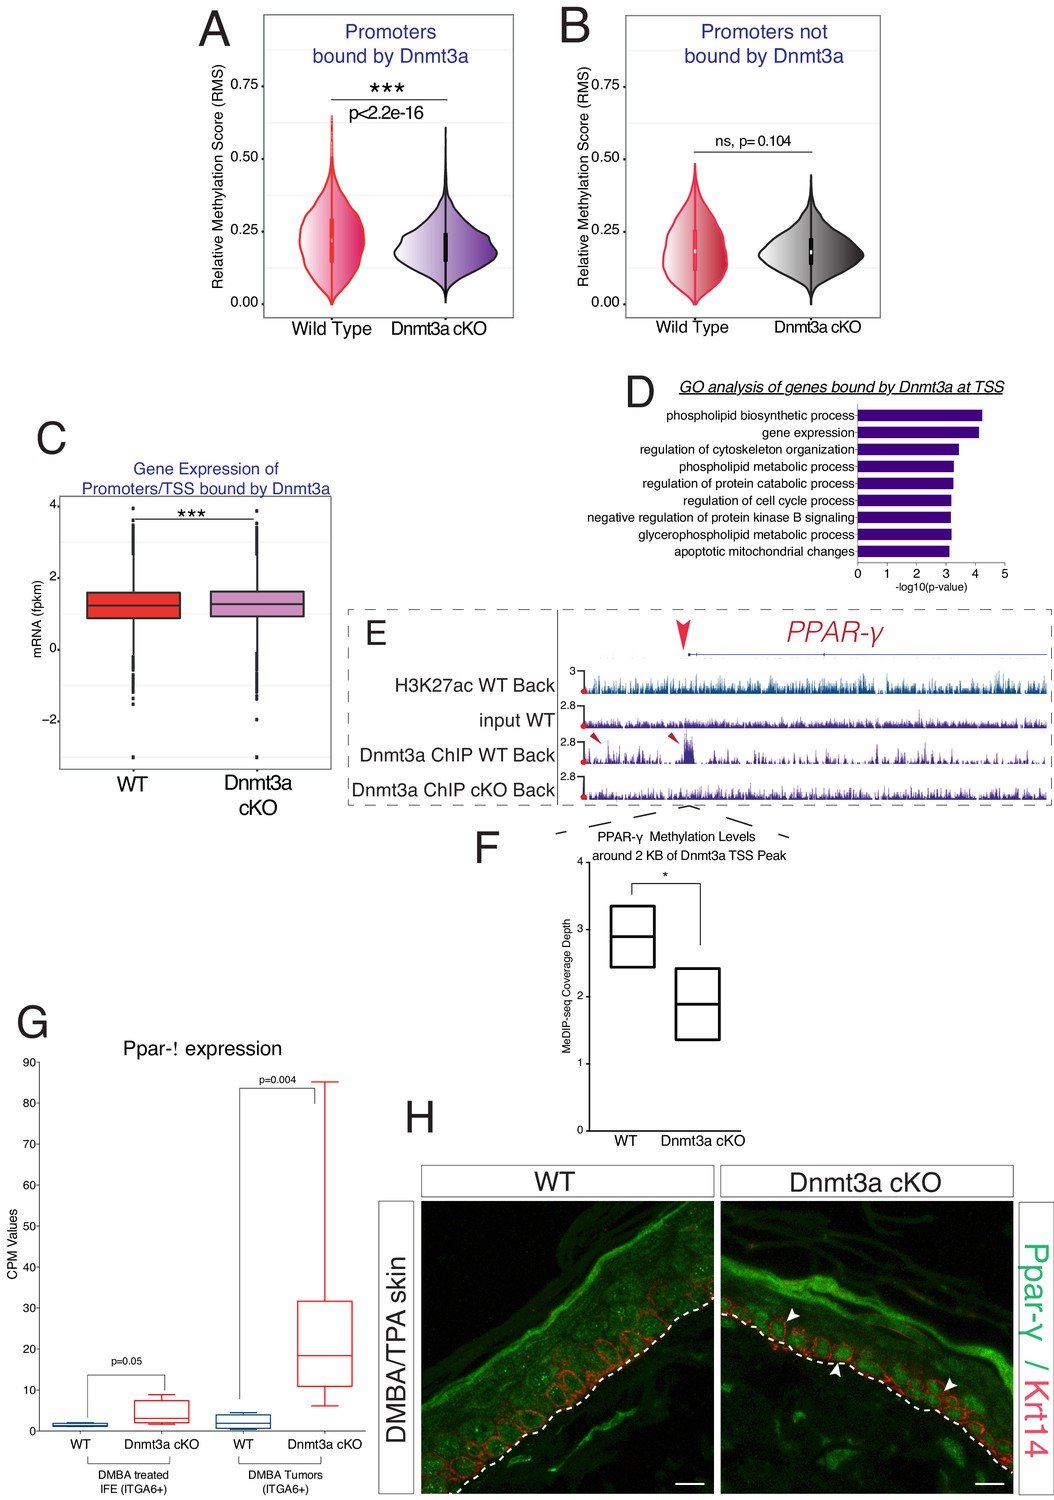
Dnmt3a binds and methylates a subset of promoters of genes involved in lipid metabolism in DMBA/TPA-treated epidermal cells.
(A) Relative methylation score (CpG count) measured around active and silenced promoters bound by Dnmt3a (–5 kb, +5 kb) from independent biological replicates of FACS-sorted tumor cells from wild type (n = 2) and Dnmt3a-cKO (n = 2) animals. (B) Relative methylation score (CpG count) measured around promoters not bound by Dnmt3a (–5 kb, +5 kb) from independent biological replicates of FACS-sorted tumor cells from wild-type (n = 2) and Dnmt3a-cKO (n = 2) animals (p=0.104). (C) CPM (Counts por Million) values of genes bound at the TSS by Dnmt3a in DMBA skin tumors from wild-type or Dnmt3a-cKO animals. (D) Gene ontology analysis, using Enrichr online software, of the 3521 genes bound at their promoter by Dnmt3a. (E) Screenshot of PPAR-γ gene, with all tracks normalized. (F) Normalized methylation score measured around TSS of Ppar-γ (–1 kb to +1 kb) bound by Dnmt3a. (G) CPM (Counts por Million) values of PPAR-γ measured by RNA-seq in sorted Itga6bright cells from DMBA/TPA-treated IFE and from DMBA skin tumors in wild-type and Dnmt3a-cKO mice. (H) Immunofluorescence staining for Krt14 and PPAR-γ of DMBA/TPA-treated skin and skin tumors from wild-type and Dnmt3a-cKO animals.
-
Figure 6—source data 1
Data related to Figure 6G.
RNA-sequencing CPM values (Counts por Million Reads) of Pparg expression in the DMBA/TPA epidermis and in the tumors from wild-type and Dnmt3a-cKO mice.
- https://doi.org/10.7554/eLife.21697.025
Figure 7 with 1 supplement
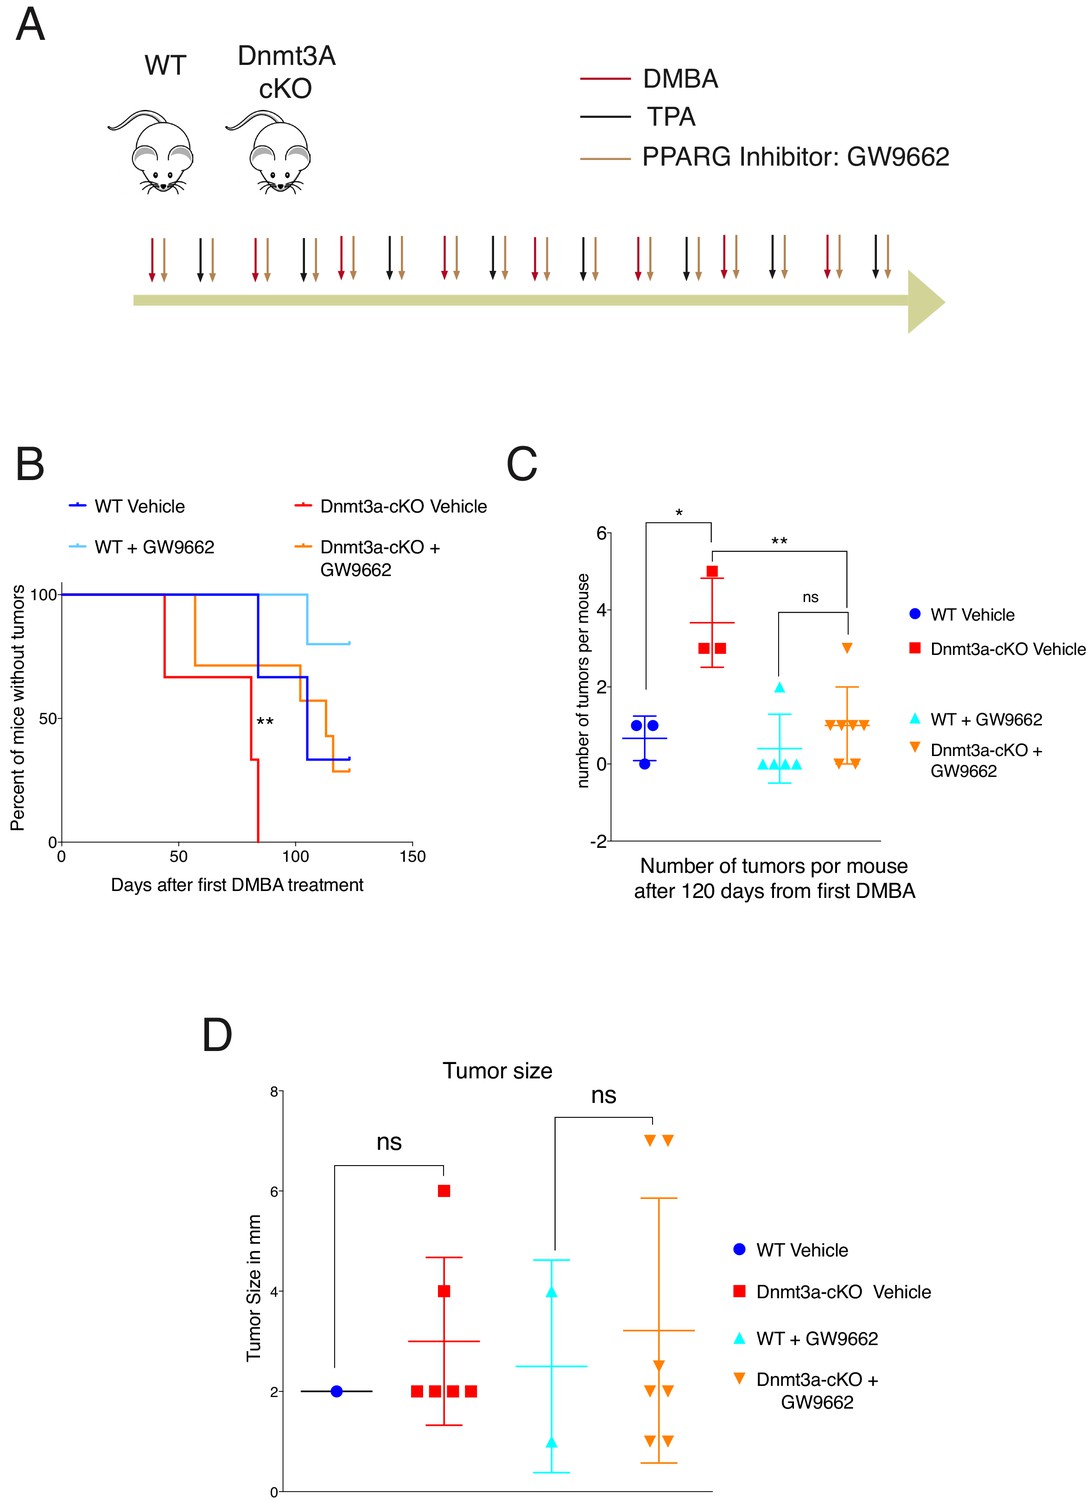
PPAR-γ inhibition revert the tumor initiation phenotype of the Dnmt3a-cKO.
(A) Schematic representation of the DMBA/TPA orthotopic treatment together PPAR-γ inhibitor (Sigma GW9662) treatment onto wild-type and Dnmt3a-cKO animals. (B) Time of appearance, expressed in percentages of skin tumors on wild-type or Dnmt3a-cKO animals (vehicle and GW9662 treated): p=0.008, Chi-Square Test. (C) Number of skin tumors after 3 months of DMBA/TPA treatment plus GW9662 treatment, p=0.007 (Unpaired T-Test). (D) Tumors sizes expressed in millimeters (mm) after 3 months of DMBA/TPA plus GW9662 treatment.
-
Figure 7—source data 1
Data related to Figure 7C.
Data showing the number of tumors counted on the backskin of the wild-type and Dnmt3a-cKO mice after 120 days of DMBA/TPA plus vehicle or plus GW9662 (PPAR-G inhibitor).
- https://doi.org/10.7554/eLife.21697.027
Figure 7—figure supplement 1
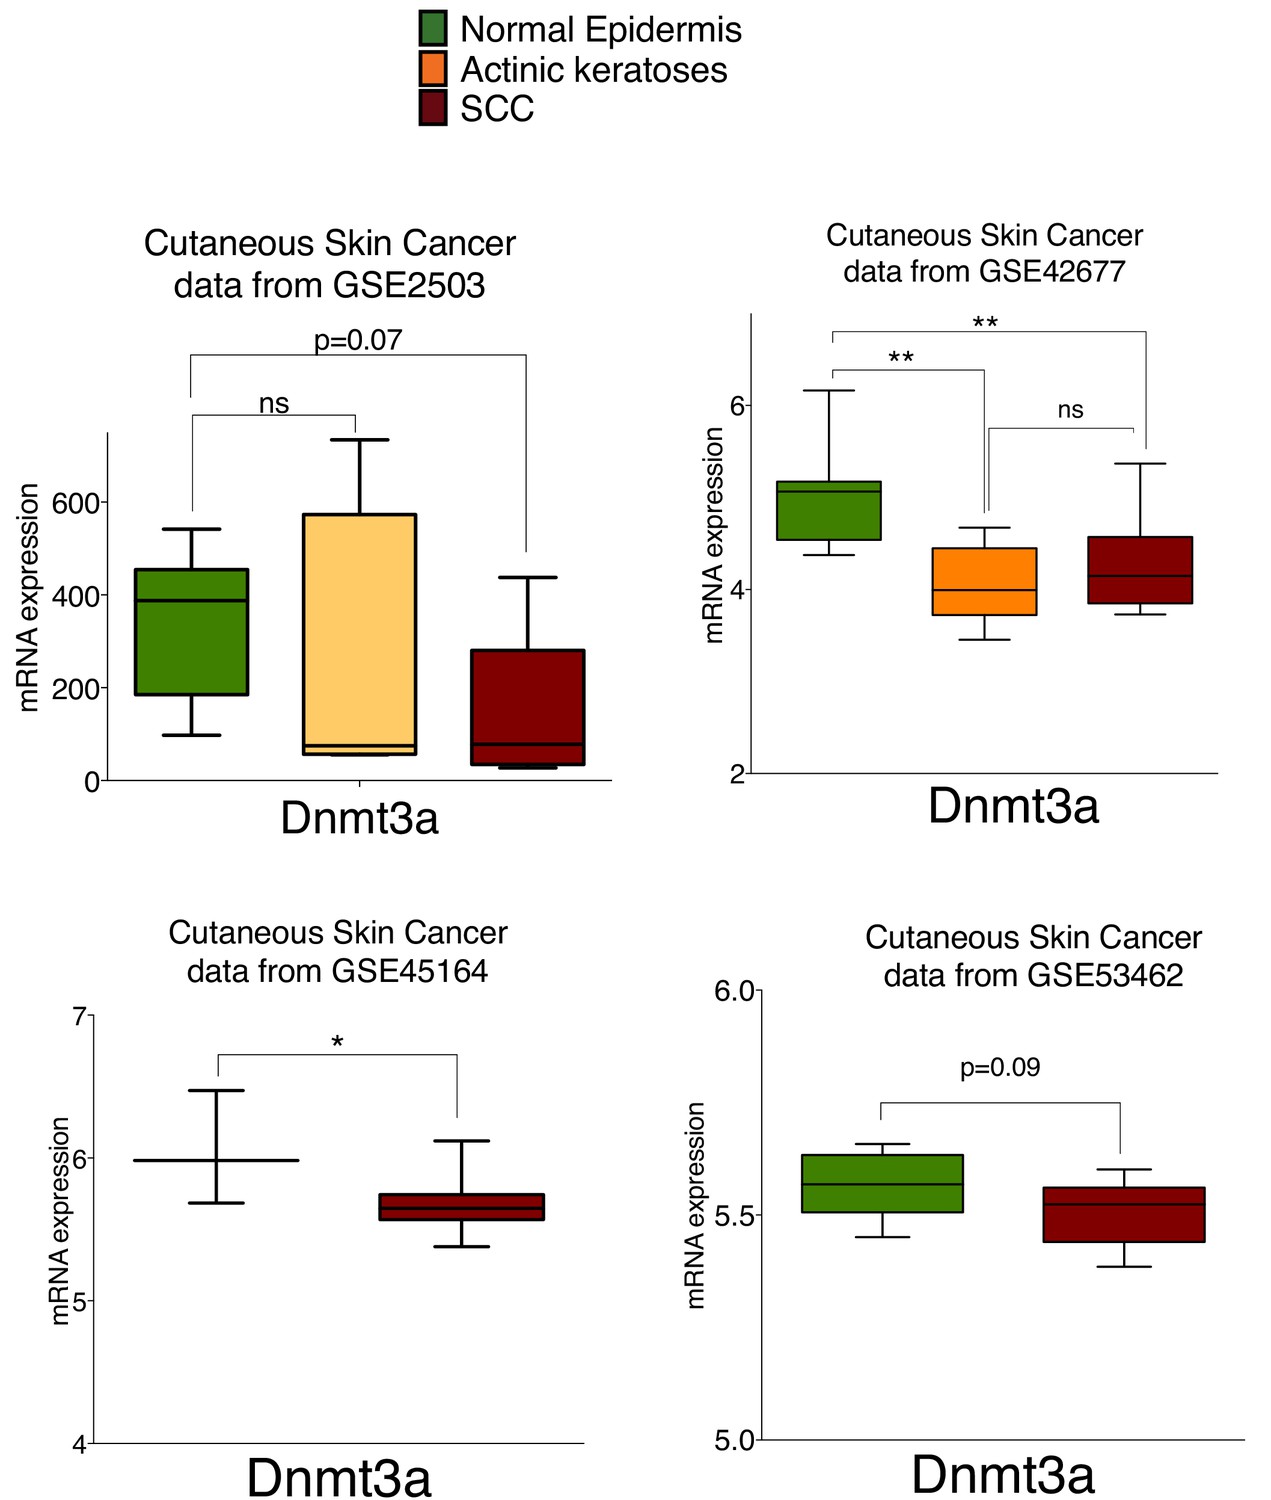
The mRNA of Dnmt3a is downregulated in human cutaneous squamous cell carcinomas compared to normal human epidermis.
MRNA expression of Dnmt3a in human healthy epidermis compared to actinic keratoses and Squamous Cell Carcinomas (SCC) quantified using GEO2R platform of the published databases (GSE2503, GSE42677, GSE45164, and GSE53462). Unpaired parametric T-Test was used for statistics.
-
Figure 7—figure supplement 1—source data 1
Data related to Figure 7—figure supplement 1.
Dnmt3a mRNA expression obtained using the online platform GEO2R from four published datasets of human healthy epidermis, actinic keratosis and squamous cell carcinomas samples.
- https://doi.org/10.7554/eLife.21697.029
Author response image 1
Author response image 2
Author response image 3

Author response image 4
Author response image 5
Author response image 6

Author response image 7
Author response image 8

Additional files
-
Supplementary file 1
This file contains information related to Figure 3.
It shows the fold change difference of all RefSeq genes between Dnmt3a-cKO and wild type tumors in integrin alpha6-purified tumor cells. Please note that the negative values represent the genes that are expressed at higher levels in the Dnmt3a-cKO tumor cells.
- https://doi.org/10.7554/eLife.21697.030
-
Supplementary file 2
This file contains information related to Figure 4 and Figure 4—figure supplement 1.
It shows the FPKM (Fragments Per Kilobase of transcript per Million mapped reads) values of all RefSeq genes obtained by RNA-sequencing in bulge cells (integrin alpha6bright/CD34+, BULGE) and interfollicular epidermis basal cells (integrin alpha6bright/CD34-, IFE) purified cells from Dnmt3a-cKO and wild type epidermis after 6 weeks of DMBA/TPA treatment.
- https://doi.org/10.7554/eLife.21697.031
-
Supplementary file 3
This file contains information related to Figure 4, Figure 5 and Figure 6.
Spreadsheet1 contains the genomic coordinates and the related annotations of the Chip-Seq peaks of Dnmt3a in precancerous epidermis (after 6 weeks of DMBA/TPA treatment). Spreadsheet2 contains the list of genes bound at their promoter by Dnmt3a in precancerous epidermis. Spreadsheet3 contains the genomic coordinates of the active enhancers not bound by Dnmt3a in precancerous epidermis. Spreadsheet4 contains the genomic coordinates of the promoters not bound by Dnmt3a in precancerous epidermis. Spreadsheet5 contains the genomic coordinates of the active enhancers bound by Dnmt3a in precancerous epidermis.
- https://doi.org/10.7554/eLife.21697.032
Download links
A two-part list of links to download the article, or parts of the article, in various formats.
Downloads (link to download the article as PDF)
Open citations (links to open the citations from this article in various online reference manager services)
Cite this article (links to download the citations from this article in formats compatible with various reference manager tools)
Loss of Dnmt3a and Dnmt3b does not affect epidermal homeostasis but promotes squamous transformation through PPAR-γ
eLife 6:e21697.
https://doi.org/10.7554/eLife.21697


