Lipid droplet biology and evolution illuminated by the characterization of a novel perilipin in teleost fish
- Wayne State University School of Medicine, United States
- University of Oregon, United States
Figures
Figure 1 with 2 supplements
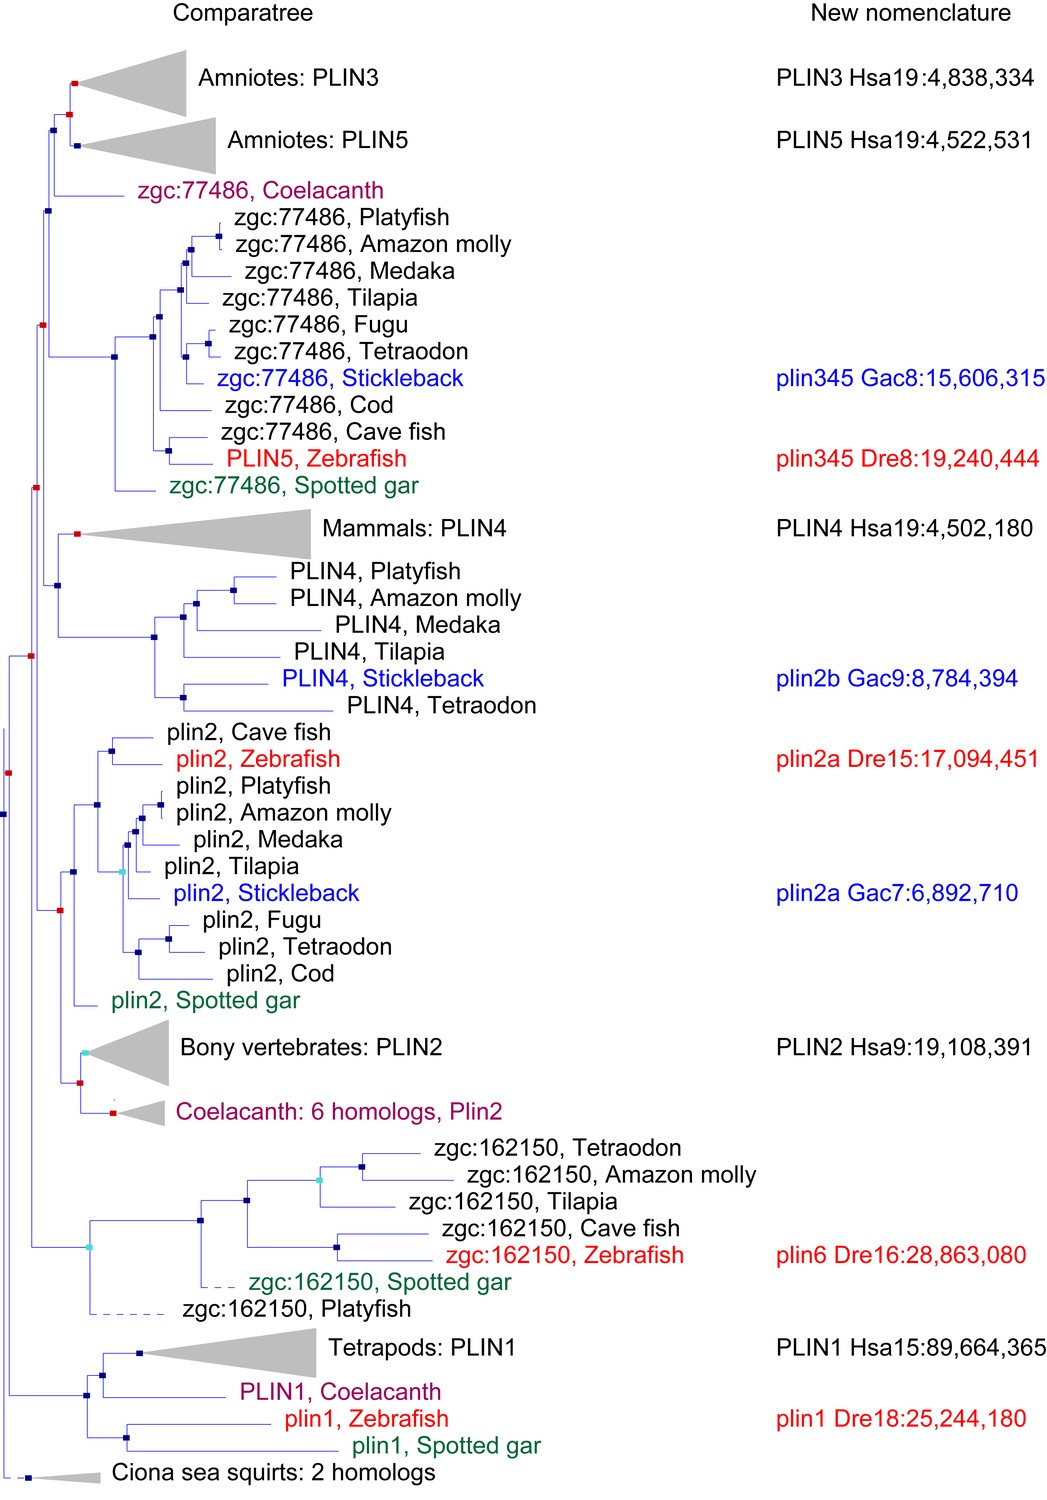
A phylogenetic analysis of Plin-family genes using EsemblCompara Gene Trees (Vilella et al., 2009; Flicek et al., 2013).
Large clades are collapsed, rayfin fish are shown in detail. Original nomenclature is that of Ensembl with new names assigned for genes of zebrafish and stickleback, along with chromosome locations, to better reflect the historical origins when taking conserved syntenies into account. Source: ENSGT00500000044795.
Figure 1—figure supplement 1

Conserved syntenies for the gene Ensembl calls plin4 in percomorph fish (stickleback gene ENSGACG00000017870), which should be renamed as plin2b.
(A, D) The region of human (Homo sapiens) chromosome 9 (Hsa9) containing PLIN2. (B) The region of stickleback linkage group 7 (Gac7) containing plin2a. (C) The region of Gac9 containing plin2b. Compara Gene Tree analysis suggested that stickleback (Gasterosteus aculeatus) has an ortholog (ENSGACG00000017870) of the human PLIN4 gene. Given the absence of a PLIN4 ortholog in non-mammalian lobefins, we examined this conclusion in more detail by performing conserved synteny analysis using the Synteny Database (Catchen et al., 2009, 2011b). Analysis showed that the chromosome segment containing ENSGACG00000017870 shares conserved syntenies with the region of Hsa9 that contains PLIN2, not the region on Hsa19 that contains PLIN4. Further analysis showed that the region of Gac9 that contains ENSGACG00000017870 shares many paralogs with the region of Gac7 that contains what Ensembl calls plin2 (ENSGACG00000019638), for example, ‘LGI(2of2) and LGI(1of2), CCDC145(2of2) and CCDC145(1of2), MYOZ2(1of2) and MYOZ2(2of2)' and others. We conclude that these two chromosome segments originated in the teleost genome duplication (TGD) event (Amores and Force, 1998; Postlethwait et al., 1999; Taylor et al., 2003; Jaillon et al., 2004a) and that the percomorph clade labeled ‘PLIN4’ by Compara Gene Tree is actually a TGD duplicate of human PLIN2. Under this interpretation, ancestral teleosts had plin2a and plin2b genes and that plin2b was lost in ostariophysans, including zebrafish and blind cavefish (Asyanax mexicanum).
Figure 1—figure supplement 2
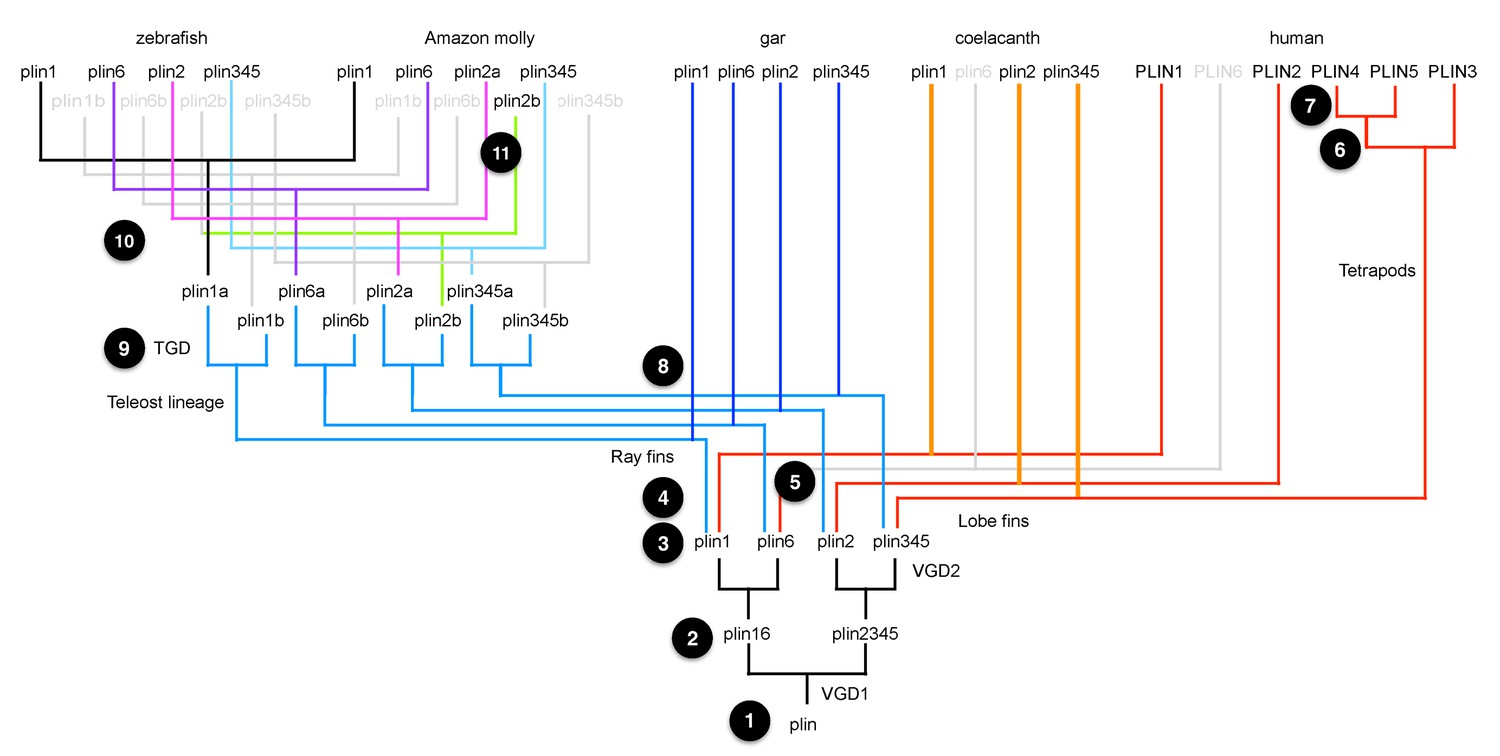
A model for the origin of plin genes that fits available data.
Today’s bony vertebrate plin genes come from a single gene in an ancient chordate ancestor (Step 1). VGD1 (the first round of vertebrate genome duplication) produced two genes: the precursor to plin1 + plin6, and the precursor to plin2 + plin3/4/5 (Step 2). VGD2 (the second round of vertebrate genome duplication) produced four genes, plin1, plin6, plin2 and the precursor plin3/4/5 (Step 3). After VGD2, the lineage of ray fin fish, including gar and teleosts, diverged from the lineage of lobe fin fish, including coelacanth and tetrapods (Step 4), and plin6 apparently disappeared in stem lobe fins (Step 5). Before the divergence of birds and mammals, the ancestor of Plin3/4/5 duplicated to make tandem copies of Plin3 and the precursor to PLIN4/5 (Step 6). After the divergence of lineages leading to birds and mammals, the PLIN4/5 precursor duplicated in the human lineage to make tandem duplicate genes PLIN4 and PLIN5 (Step 7). Along the ray fin branch of bony vertebrates, the teleost lineage diverged from the gar lineage (Step 8) and then the TGD (teleost genome duplication) event produced copies of the four original VGD2 ohnologs, making eight plin family genes (Step 9). The ‘b’ copies of plin1, plin6, and plin3/4/5 were lost before the divergence of ostariophysans (including zebrafish) from percomorphs (including Amazon molly; Step 10). In contrast, both ‘a’ and ‘b’ copies of plin2 were retained in Amazon molly and some other percomorphs, but lost in the zebrafish lineage (Step 11).
Figure 2 with 3 supplements
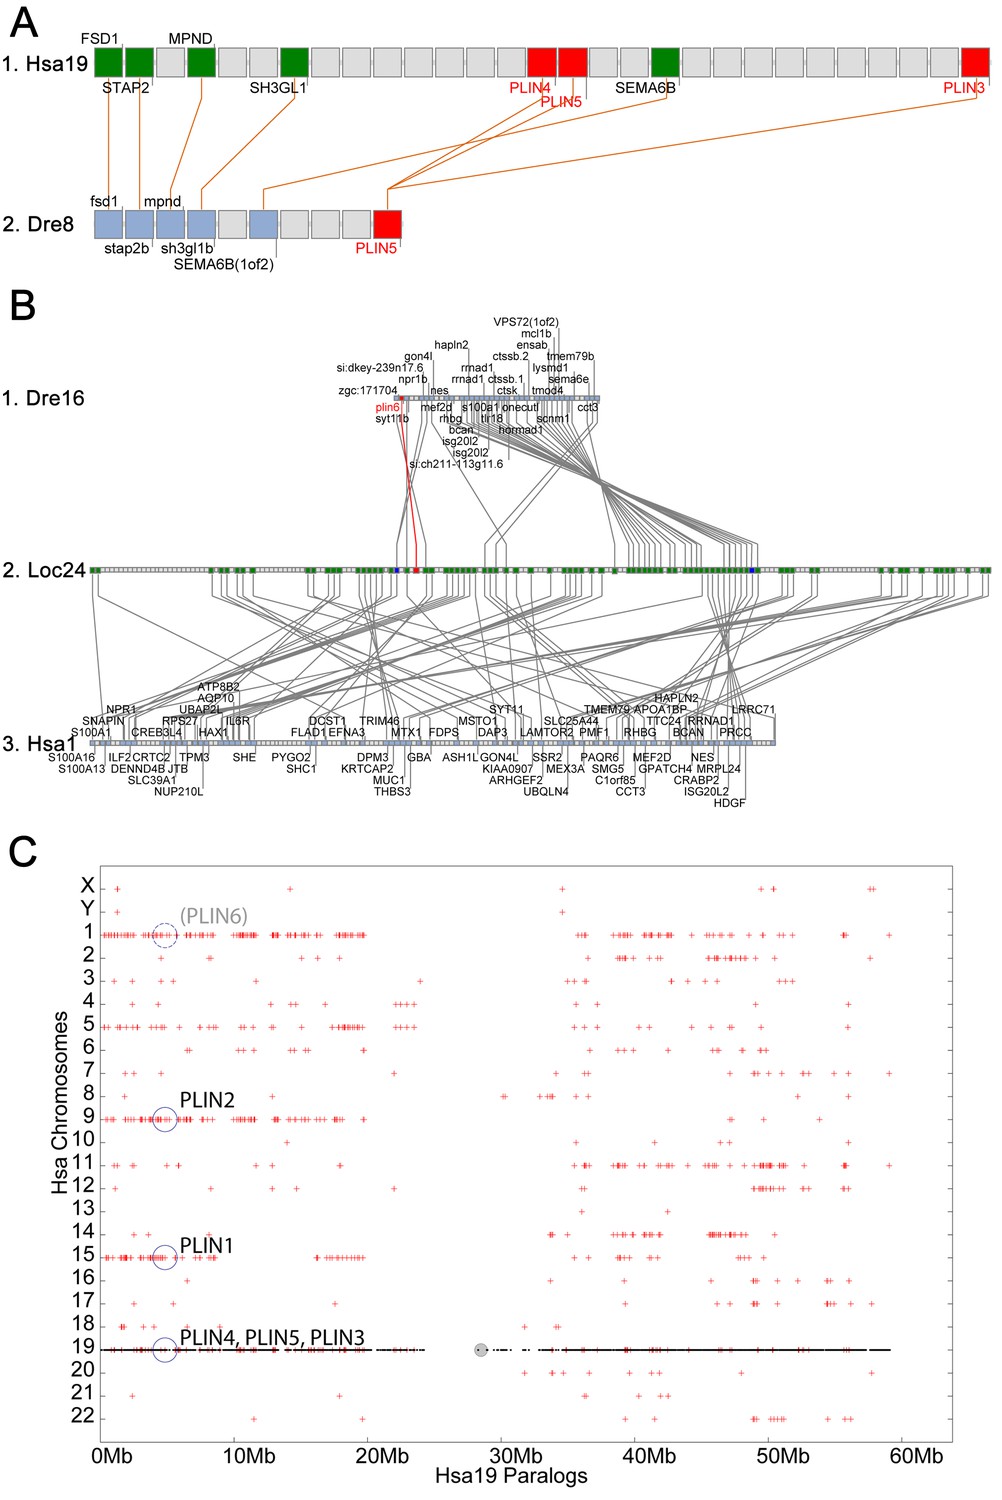
Conserved syntenies for PLIN3/4/5 in human and zebrafish and plin6 in zebrafish, gar, and human.
(A) Conserved synteny analysis shows that the chromosome segment containing zebrafish ‘PLIN5’ (Dre8) is orthologous to the human chromosome segment containing PLIN4, PLIN5, and PLIN3 (Hsa19). (B) The zebrafish plin6 lies on chromosome Dre16 (Amores et al., 2011), which shares conserved syntenies with a portion of gar linkage group Loc24 that includes the gar plin6 (Amores and Force, 1998). This portion of the gar genome is orthologous to a region on human chromosome Hsa1 (C), but chromosome inversions distort the mapping of the human chromosome to the gar genome (follow grey lines from B to C) and no PLIN-related gene appears. (C) Dotplot analysis showing paralogs of Hsa19 genes on the other 22 human chromosomes directly above their position on Hsa19 (Catchen et al., 2009, 2011b). The region of Hsa1 that is predicted to be orthologous to the plin6-containing region of zebrafish and gar is circled. It is in the portion of Hsa1 predicted to be paralogous to the regions of Hsa9, Hsa15, and Hsa19 that contain the PLIN2, PLIN1, and PLIN4-PLIN5-PLIN3 loci, respectively.
Figure 2—figure supplement 1
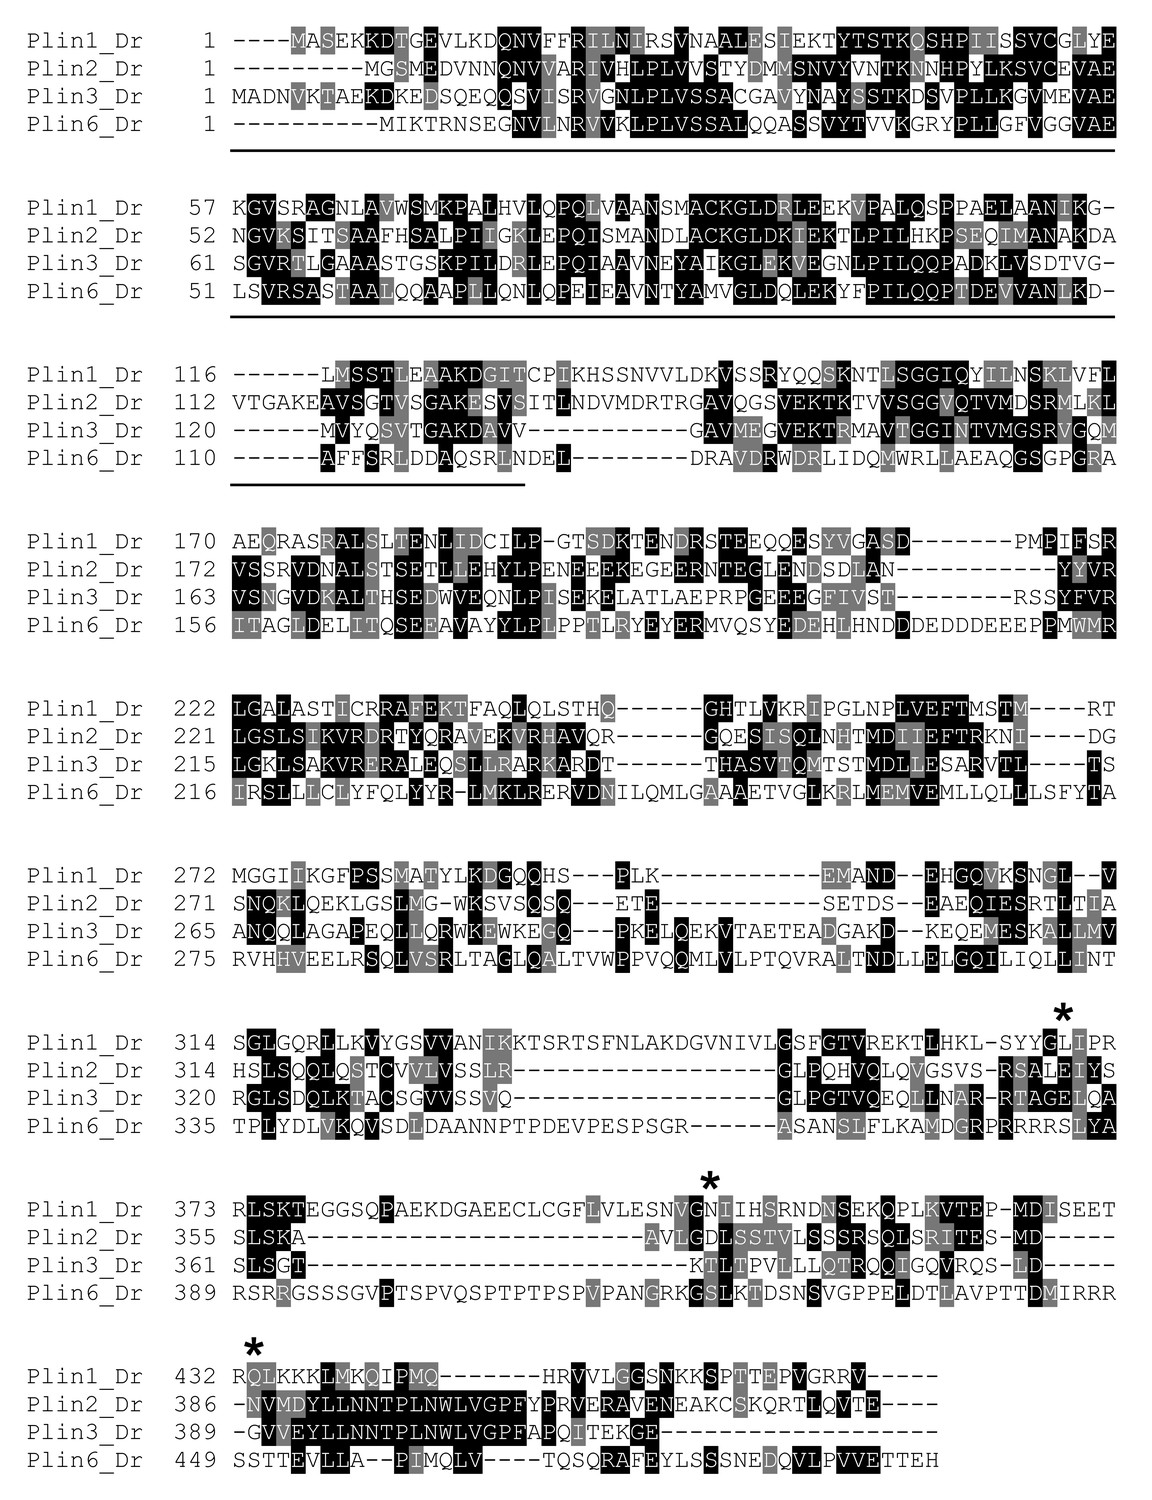
Protein sequence comparison of zebrafish Plin paralogs.
Zebrafish Plin sequences (Dr) were aligned using CLUSTAL W. Boxshade 3.2 was used to generate the shading of identical (black) and conserved (grey) residues. The location of the PAT domain in the N-terminus is underlined. Plin3/4/5 is listed as ‘Plin3.’ Asterisks indicate PKA sites in Plin6.
Figure 2—figure supplement 2
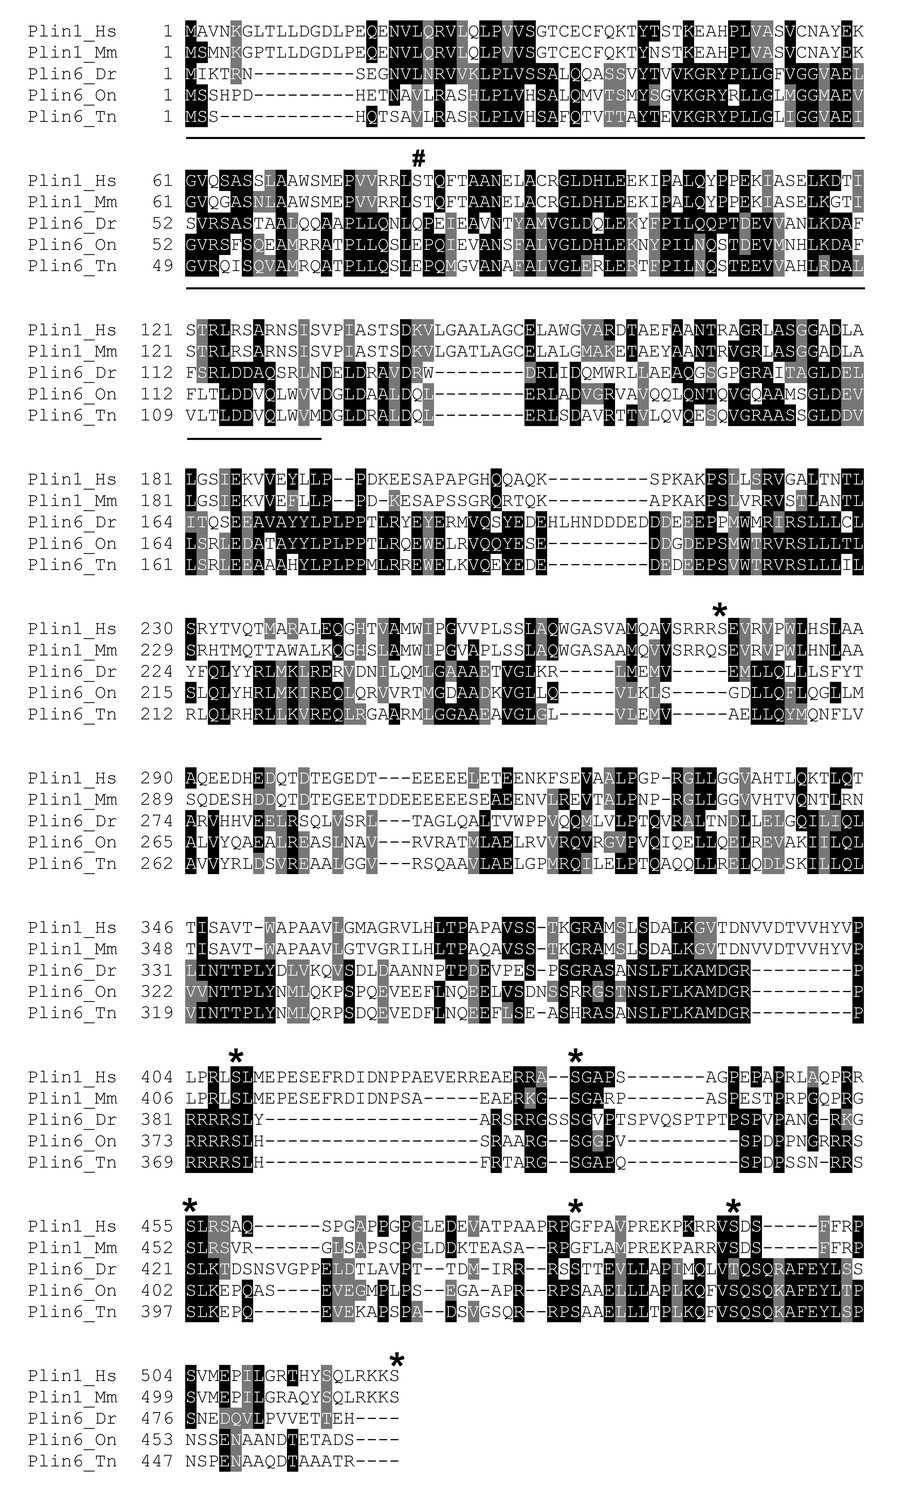
Protein sequence comparison of Plin1 and Plin6 in selected mammals and teleosts.
Sequences were aligned using CLUSTAL OMEGA. Boxshade 3.2 was used to generate the shading of identical (black) and conserved (grey) residues. Species include human (Hs), mouse (Mm), zebrafish (Dr), tilapia (On), and pufferfish (Tn). The location of the PAT domain in the N-terminus is underlined. PKA sites are marked with an asterisk.
Figure 2—figure supplement 3
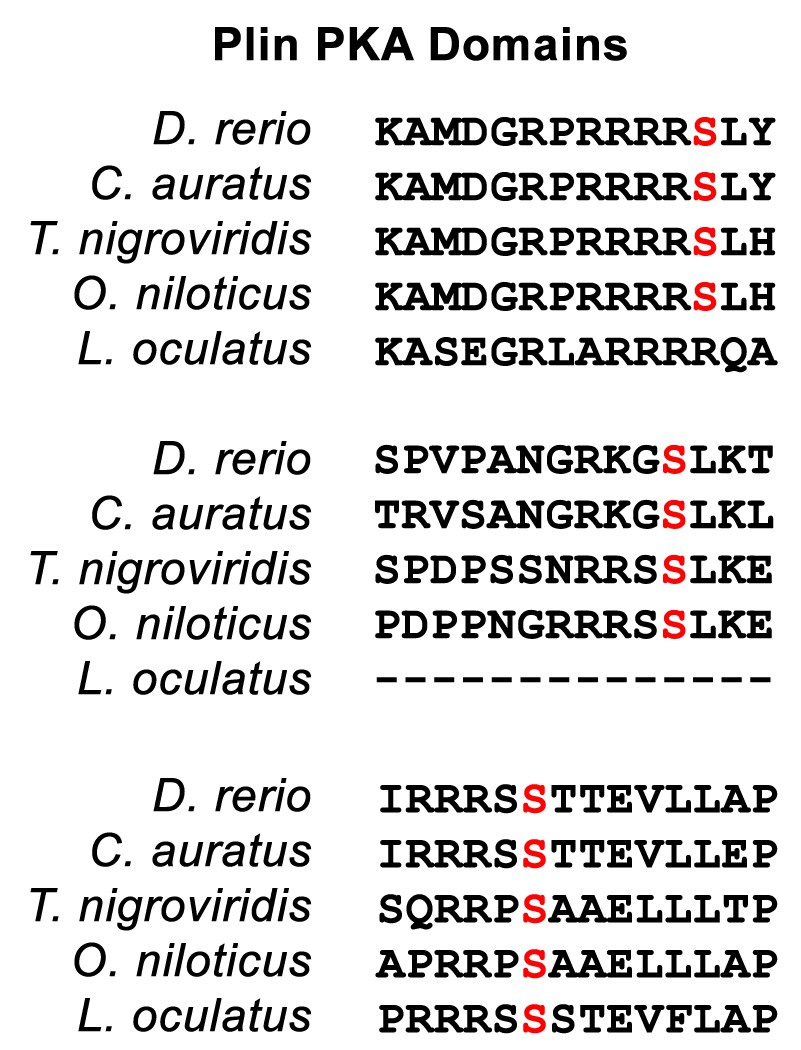
Representation of the conservation of the three conserved PKA sites found in the C-terminus of zebrafish Plin6 (D. rerio).
All three PKA sites (red S) are conserved in pufferfish (T. nigroviridis), tilapia (O. niloticus), medaka (O. latipes), and goldfish (C. auratus). The final PKA site is conserved in the spotted gar (L. oculatus).
Figure 3 with 1 supplement
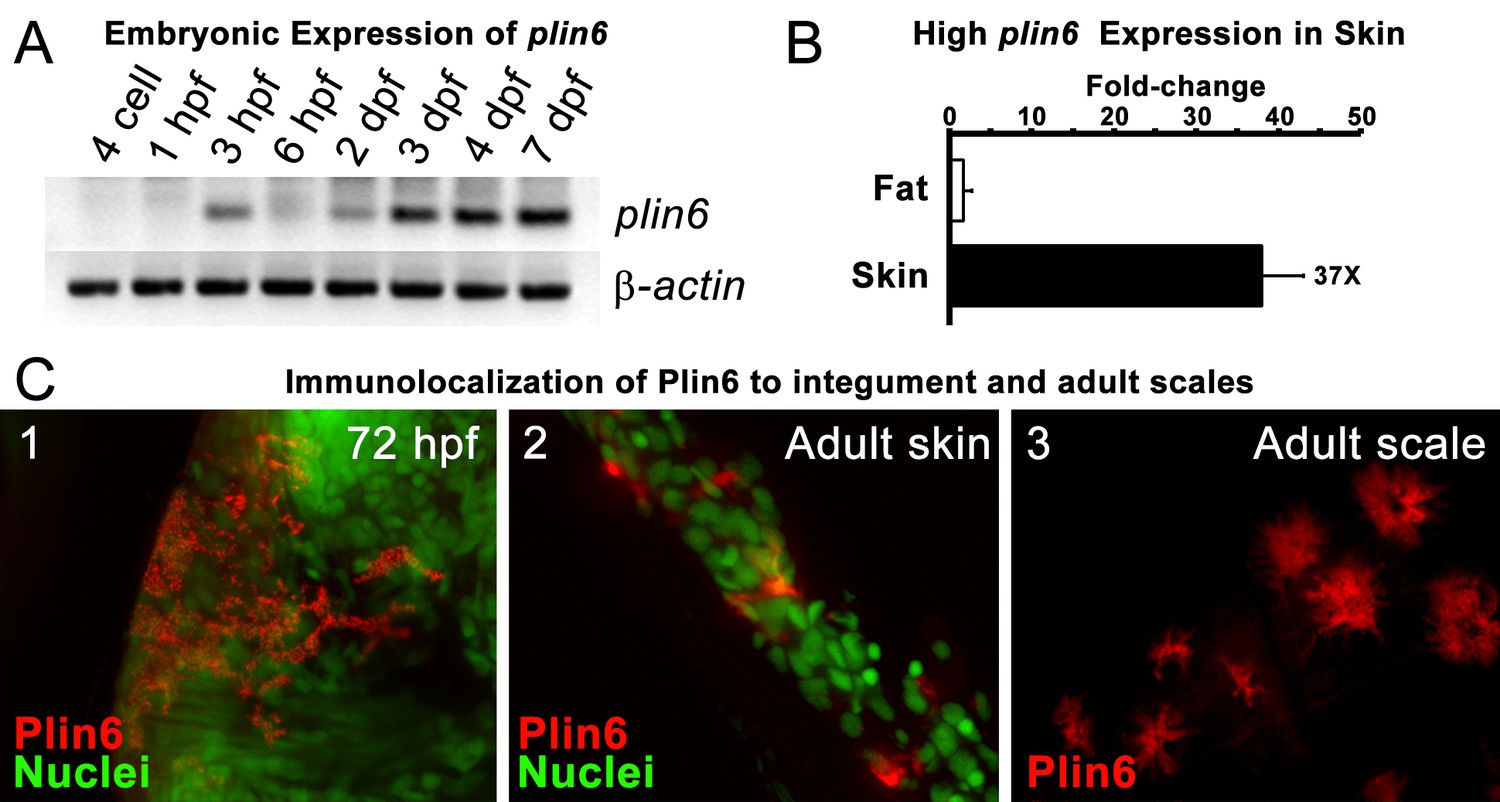
Plin6 is expressed in early zebrafish development and in adult skin.
(A) Transcripts of plin6 were detected at various stages of early zebrafish development. Hours post-fertilization (hpf); days post-fertilization (dpf). (B) Graph depicting expression levels of plin6 in the isolated fat and skin as detected by real-time PCR. Expression of plin6 in skin is 28x more than in fat. (C) Immunolocalization of Plin6 to the integument in wholemount embryos at 72 hpf (C1), in sectioned adult skin (C2), and in isolated whole scales (C3). The stellate expression of Plin6 in adult scales is consistent with the morphology of xanthophores located within the scale.
Figure 3—figure supplement 1
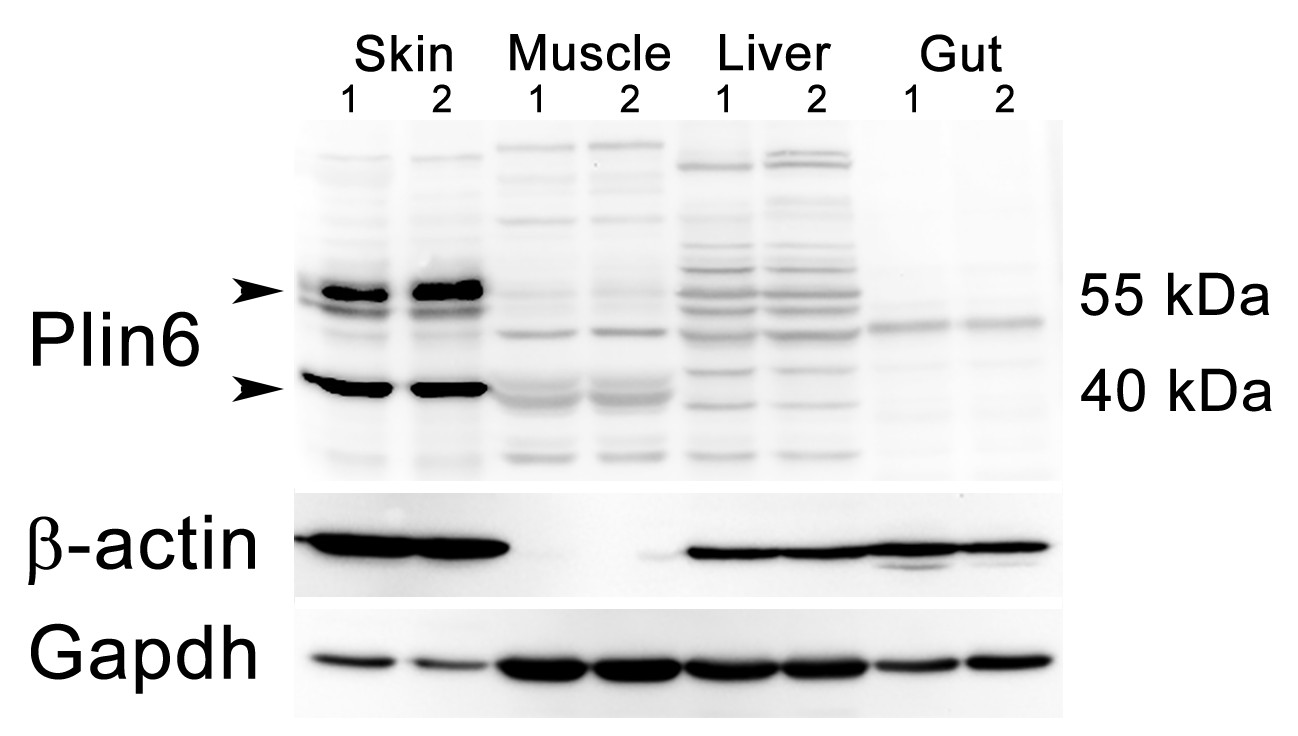
Plin6 expression in tissue samples from skin, muscle, liver, and gut.
Plin6 expression is shown in two independent samples from each tissue. The full-length Plin6 (55 kDa) and the immunoreactive degradation product of Plin6 (40 kDa) is found only in skin tissue. Background bands are abundant in liver and muscle tissue, but do not correspond to the molecular weight of Plin6. The blot was stripped and probed for β-actin, to serve as a loading control. However, since β-actin is not expressed in muscle tissue, the blot was again stripped and probed for Gapdh.
Figure 4 with 1 supplement
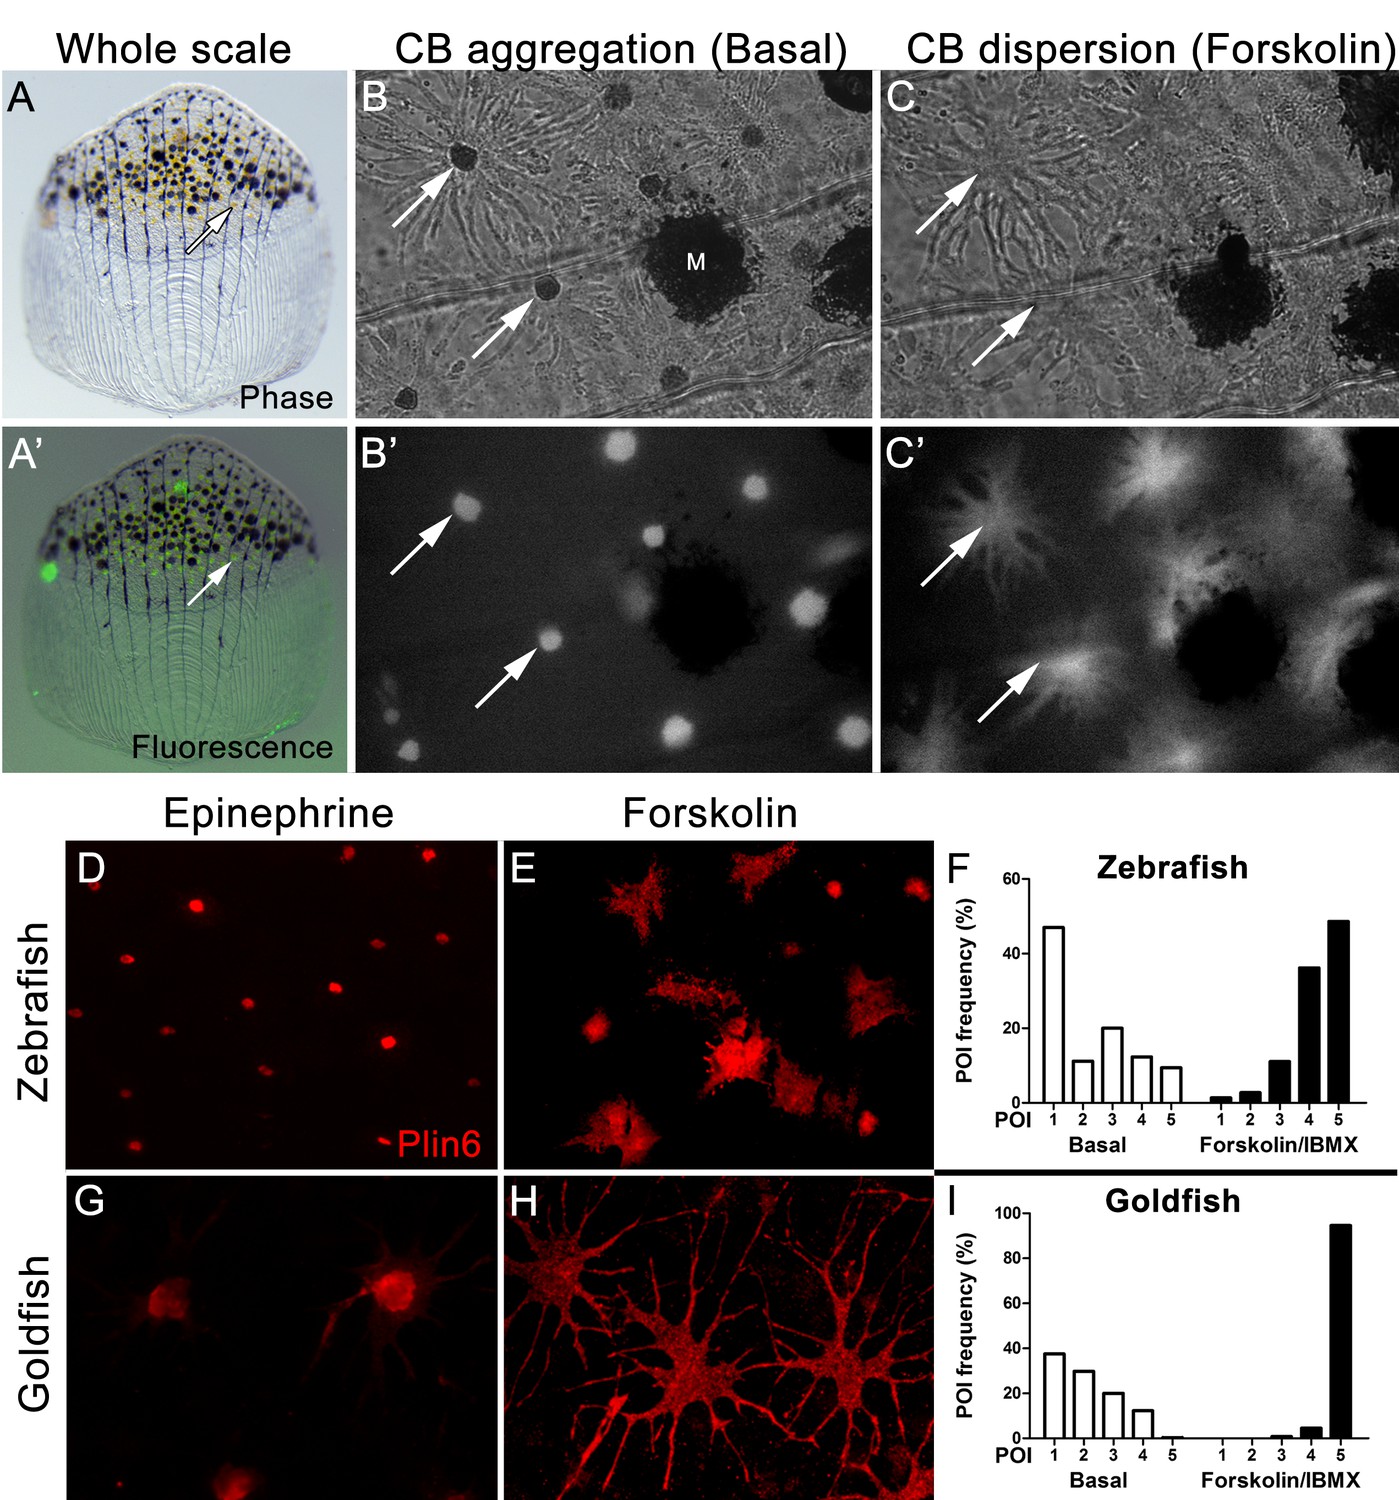
Carotenoid pigment aggregation and dispersion in adult zebrafish xanthophores correlates to Plin6 expression.
(A) An isolated scale containing melanophores (black) and xanthophores (gold, arrow). (A’) Fluorescent and brightfield overlay showing xanthophore auto-fluorescence (the two large fluorescent spots are auto-fluorescent debris). (B) Higher magnification image showing many star-shaped xanthophores (arrows) in a basal state of pigment aggregation. A few melanophores (M) can also be visualized. (B’) The fluorescence image of B showing the auto-fluorescence in xanthophores. (C) Following a 1 hr incubation in forskolin, pigment is dispersed. (C’) The fluorescence image shows the pigment dispersion. (D–E) Plin6 is immunolocalized to xanthophores in isolated scales from zebrafish in both aggregated (D; Epinephrine) and dispersed states (E; Forskolin). (F) Quantification of the percentage of xanthophores at each Pigmentary Organelle Index (POI) normalized to 100% (p<0.0001). (G–H) Plin6 is immunolocalized to xanthophores in isolated scales from goldfish in both aggregated (G) and dispersed states (H). (I) Quantification of the percentage of xanthophores at each Pigmentary Organelle Index (POI) normalized to 100% (p<0.0001).
-
Figure 4—source data 1
Relative frequency distribution of Pigment Organelle Index under basal conditions and after treatment with forskolin/IBMX in Zebrafish (Figure 4F).
- https://doi.org/10.7554/eLife.21771.012
-
Figure 4—source data 2
Relative frequency distribution of Pigment Organelle Index under basal conditions and after treatment with forskolin/IBMX in Goldfish (Figure 4G).
- https://doi.org/10.7554/eLife.21771.013
Figure 4—figure supplement 1

Thin section transmission electron microscopy (TSTEM) of zebrafish and goldfish xanthophores.
(A) A zebrafish xanthophore with aggregated CB (Ag). (B) TSTEM of a zebrafish xanthophore following forskolin-IBMX treatment shows clusters of dispersed CD (white arrowheads) and individual CD (black arrowhead). (C) TSTEM of a goldfish xanthophore with aggregated DB (Ag). (D) TSTEM of a goldfish xanthophore following forskolin-IBMX treatment shows clusters of dispersed CD (white arrowheads).
Figure 5
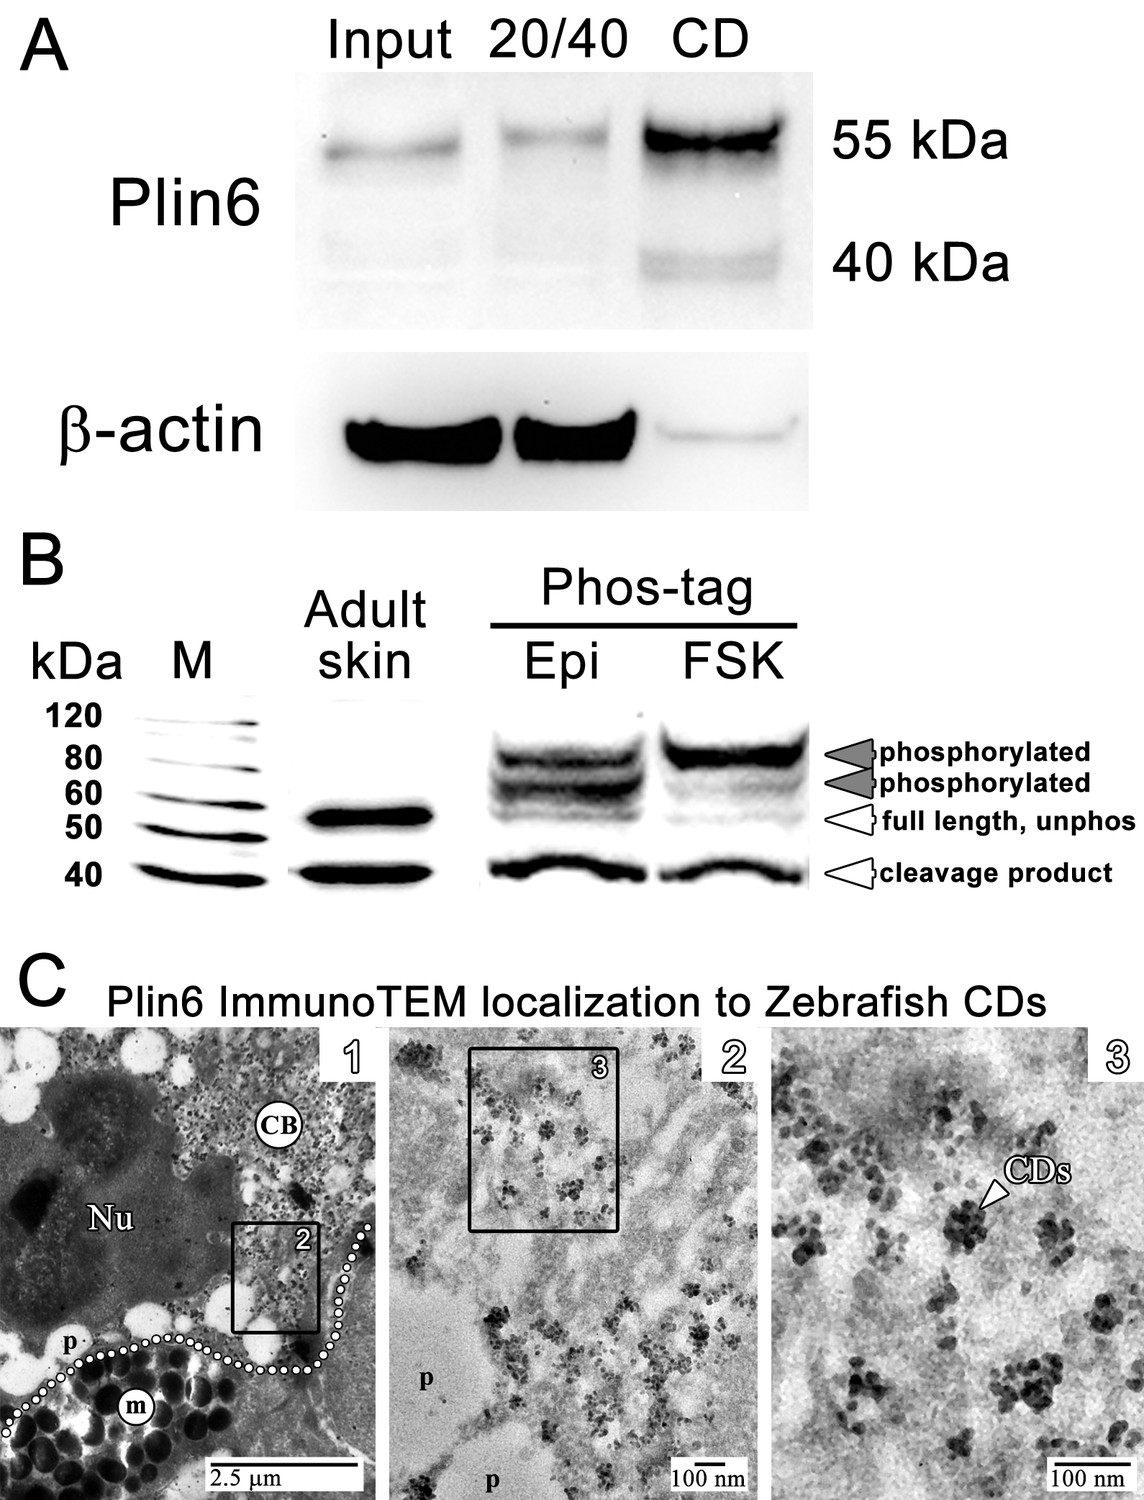
Plin6 is localized to carotenoid droplets and is phosphorylated under conditions that disperse pigment.
(A) Western blot analysis of Plin6 expression from three fractions of skin homogenate separated by a sucrose gradient; total protein homogenate in 40% sucrose prior to centrifugation (Input), the protein fraction at the interface of the 20% and 40% sucrose layers following centrifugation (20/40), and the purified CD fraction that floated above the 20% sucrose following centrifugation (CD). (B) Western blot analysis of Plin6 expression from untreated skin (adult skin), and from scales treated with epinephrine (Epi) or forskolin-IBMX (FSK) to inhibit or stimulate PKA activity, respectively. Proteins from treated scales were resolved using polyacrylamide gels containing Phos-tag, which retards the electrophoretic mobility of phosphorylated proteins. Plin6 is largely unphosphorylated (Unphos, white arrowheads) under conditions that promote aggregation (Epi) and highly phosphorylated (Phos, grey arrowheads) under conditions that promote dispersion (FSK). (C) Plin6 immunoTEM in zebrafish scales. (C-1) A dotted white line demarks the rough boundary between a xanthophore (top) and melanophore (bottom). The carotenoid body (CB) with clusters of CD puncta is located in a field adjacent to the nucleus (Nu) of the xanthophore. Pterinosomes (p) within the xanthophore are also present, as well as a field of melanosomes (m) within the adjacent melanophore. (C-2) Higher magnification of the boxed inset shown in C-1. (C-3) Higher magnification of the boxed inset shown in C-2 show Plin6 immunoreactivity targeted to clusters of CDs (arrowhead).
Figure 6 with 2 supplements
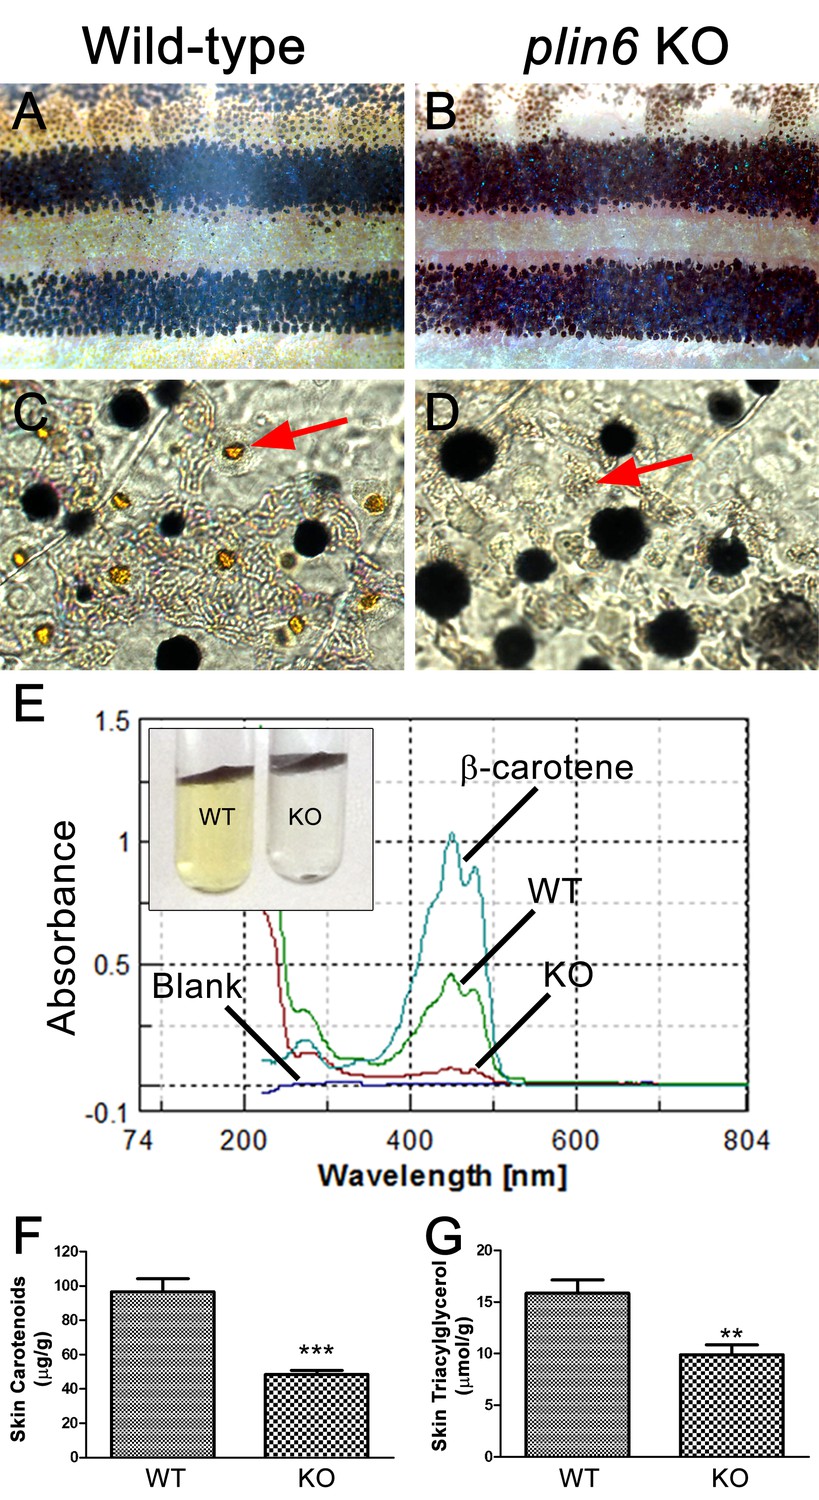
Reduced carotenoid concentration in plin6 knockout zebrafish.
Brightfield images of the flank and isolated scales from adult wild-type (A, C) and plin6 mutants (B, D) show a reduction in yellow carotenoid pigmentation in mutant tissue (red arrows in C, D). (E) Extraction of carotenoid pigment from wild-type and plin6 mutant integument (inset) and the corresponding absorbances of carotenoids from a β-carotene standard, wild-type skin (WT), and plin6 mutant skin (KO). (F) Quantification of skin carotenoid levels from wild-type (WT) and plin6 mutant skin (KO). N = 4; *** = p<0.001. (G) Quantification of skin triacylglycerol levels from wild-type (WT) and plin6 mutant skin carotenoid droplets (KO). N = 3; ** = p<0.02.
-
Figure 6—source data 1
Skin carotenoid content of wild type and plin6 knockout fish (Figure 6F).
- https://doi.org/10.7554/eLife.21771.017
-
Figure 6—source data 2
Skin triacylglycerol content of wild type and plin6 knockout fish (Figure 6G).
- https://doi.org/10.7554/eLife.21771.018
Figure 6—figure supplement 1
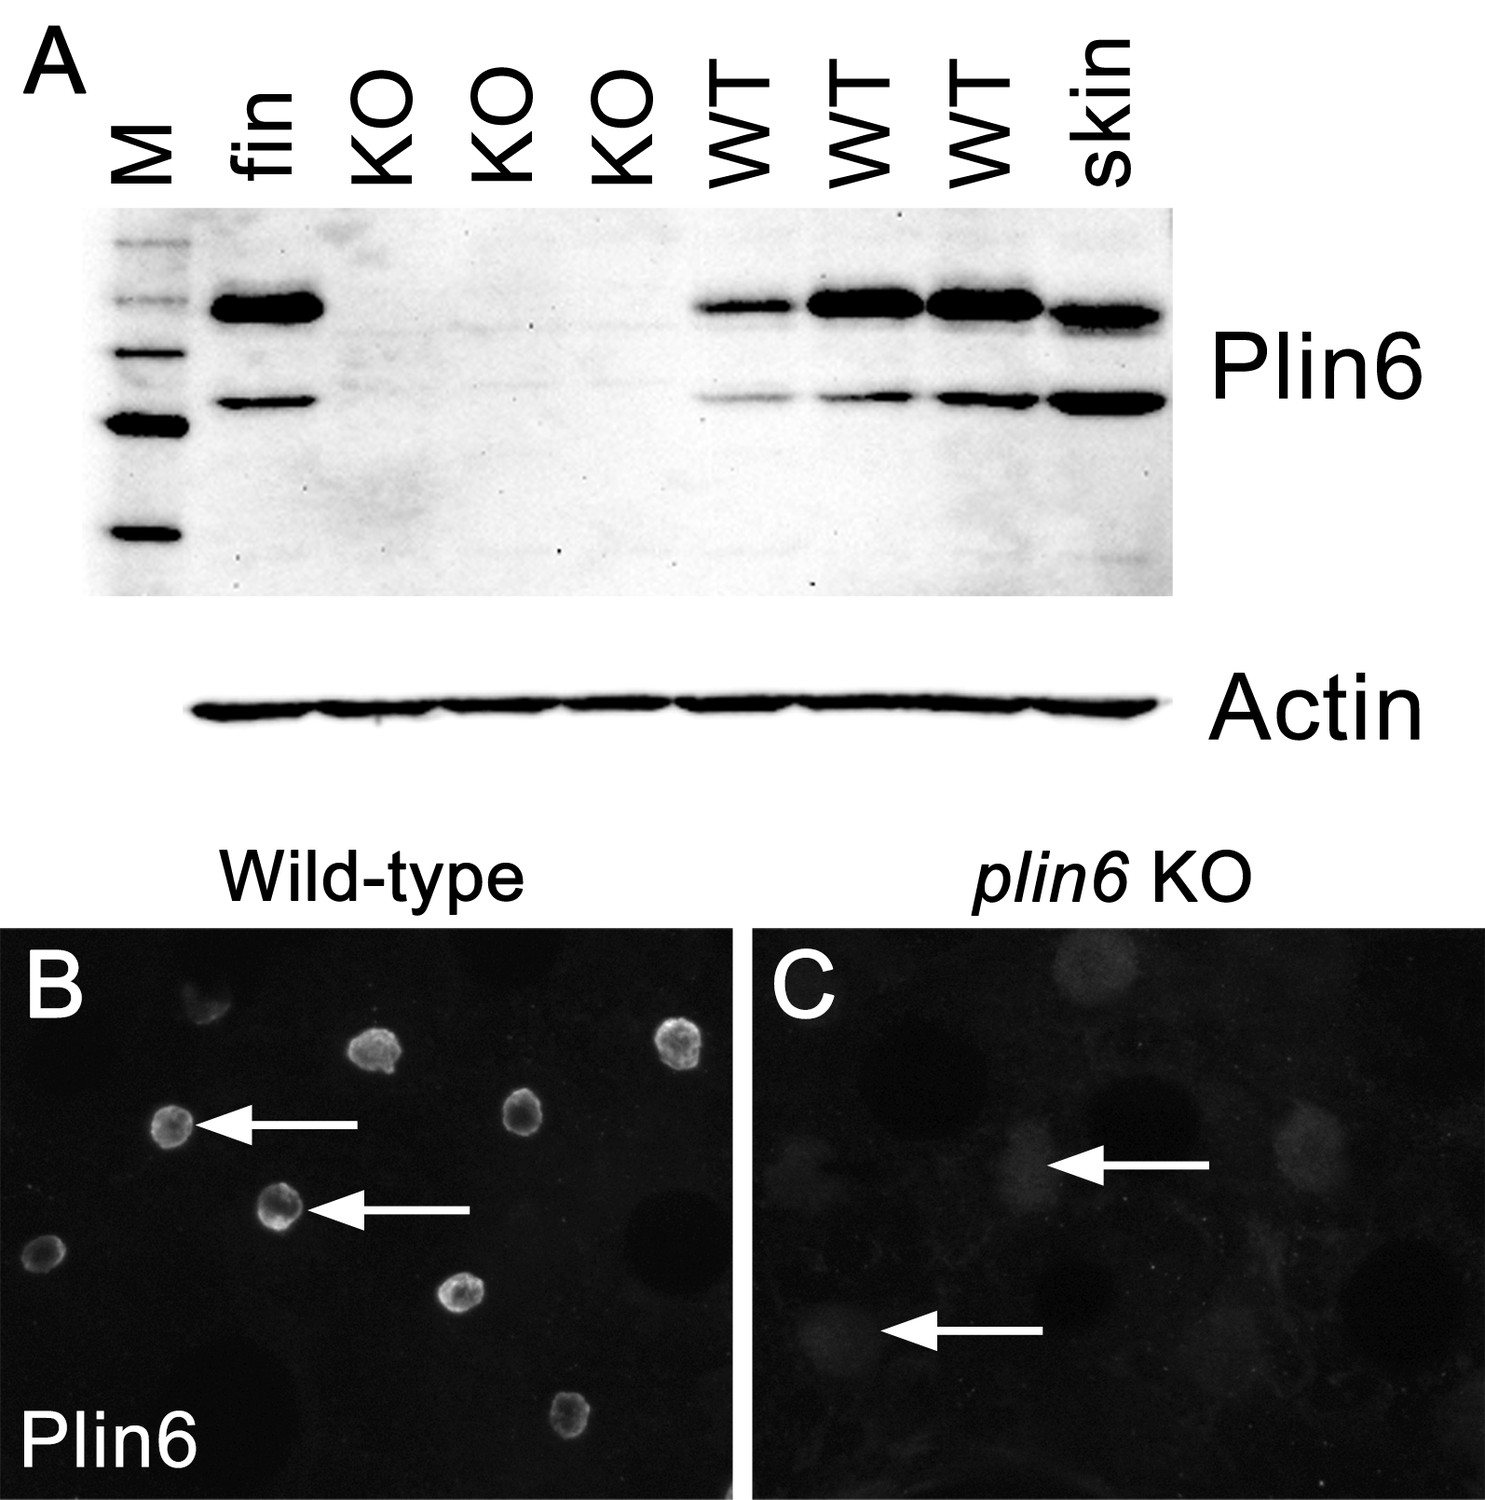
The absence of Plin6 expression in plin6 mutants.
(A) Western blot analysis of Plin6 expression in whole skin homogenates comparing three plin6 homozygotes to their wild-type siblings. Homogenates of tail fin and whole skin taken from other wild-type stocks are used as positive controls for Plin6 expression and β-actin is used as a loading control. (B–C) Plin6 immunolocalization to CB in xanthophores from isolated wild-type (B) and plin6 mutant scales (C) shows an absence of immunolocalized Plin6 in mutant scales.
Figure 6—figure supplement 2
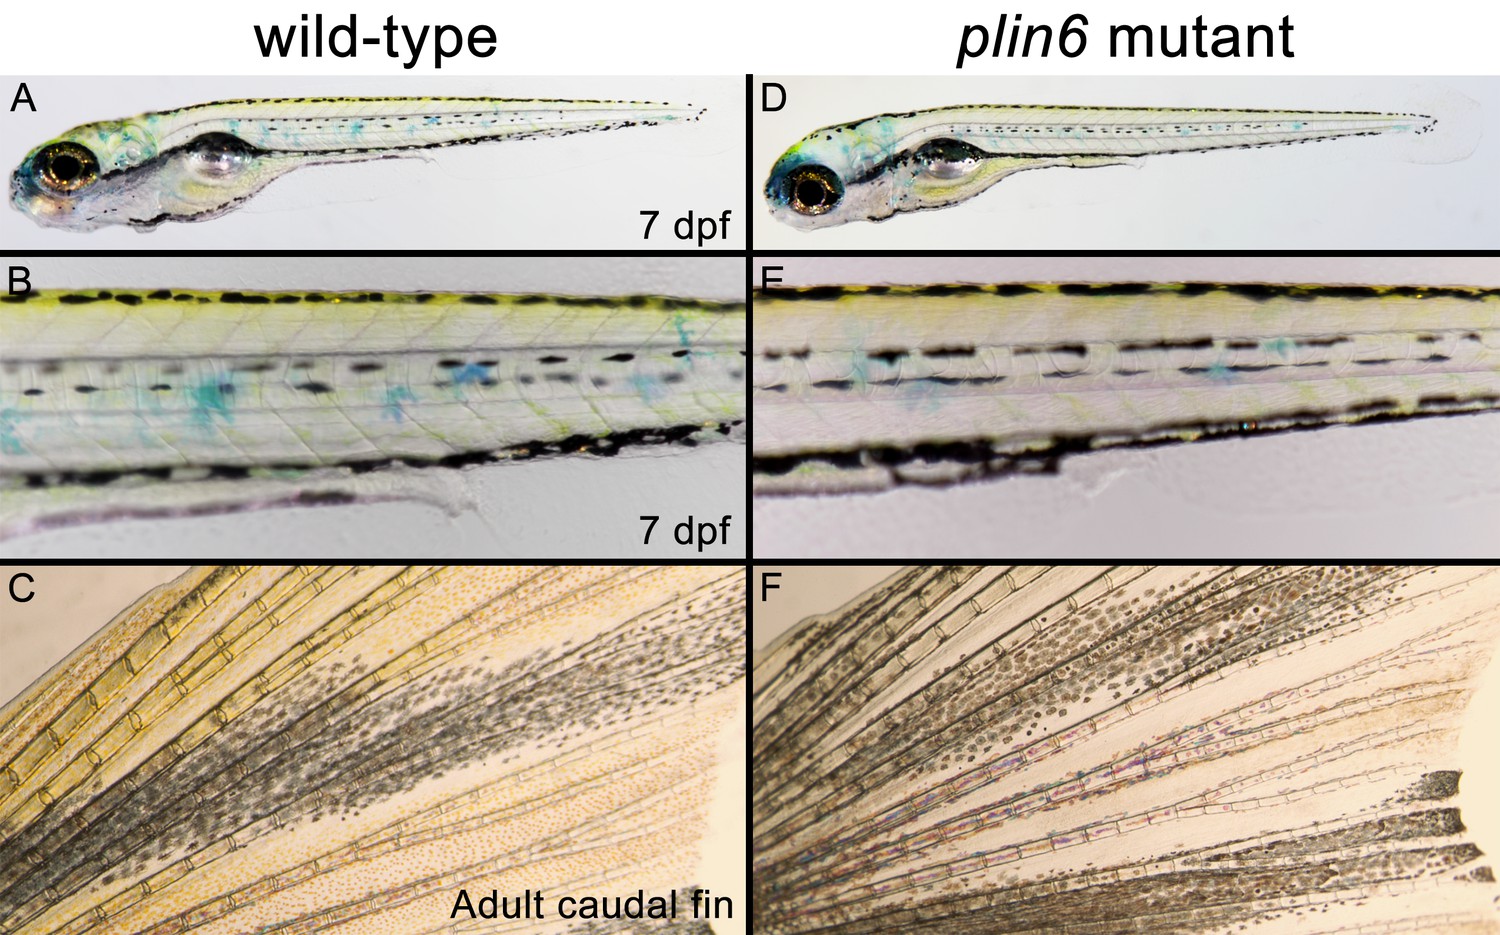
Developing and adult plin6 mutant fish show no obvious defects.
Wild-type (A–C) and plin6 mutant fish (D–F) are shown. At seven dpf, no discernable defects are observed in plin6 mutants, including the normal development of the melanophore stripe patterning, eye development, swim bladder formation, heart development, and body axis development (all commonly observed developmental defects in fish). Xanthophores are also present (yellow). Some surface xanthophores take up the methylene blue present in the embryo media. Adult caudal fins (C, F) show normal fin morphology in plin6 mutants. A slight reduction of carotenoid (yellow) pigmentation can now be observed in the mutants.
Figure 7
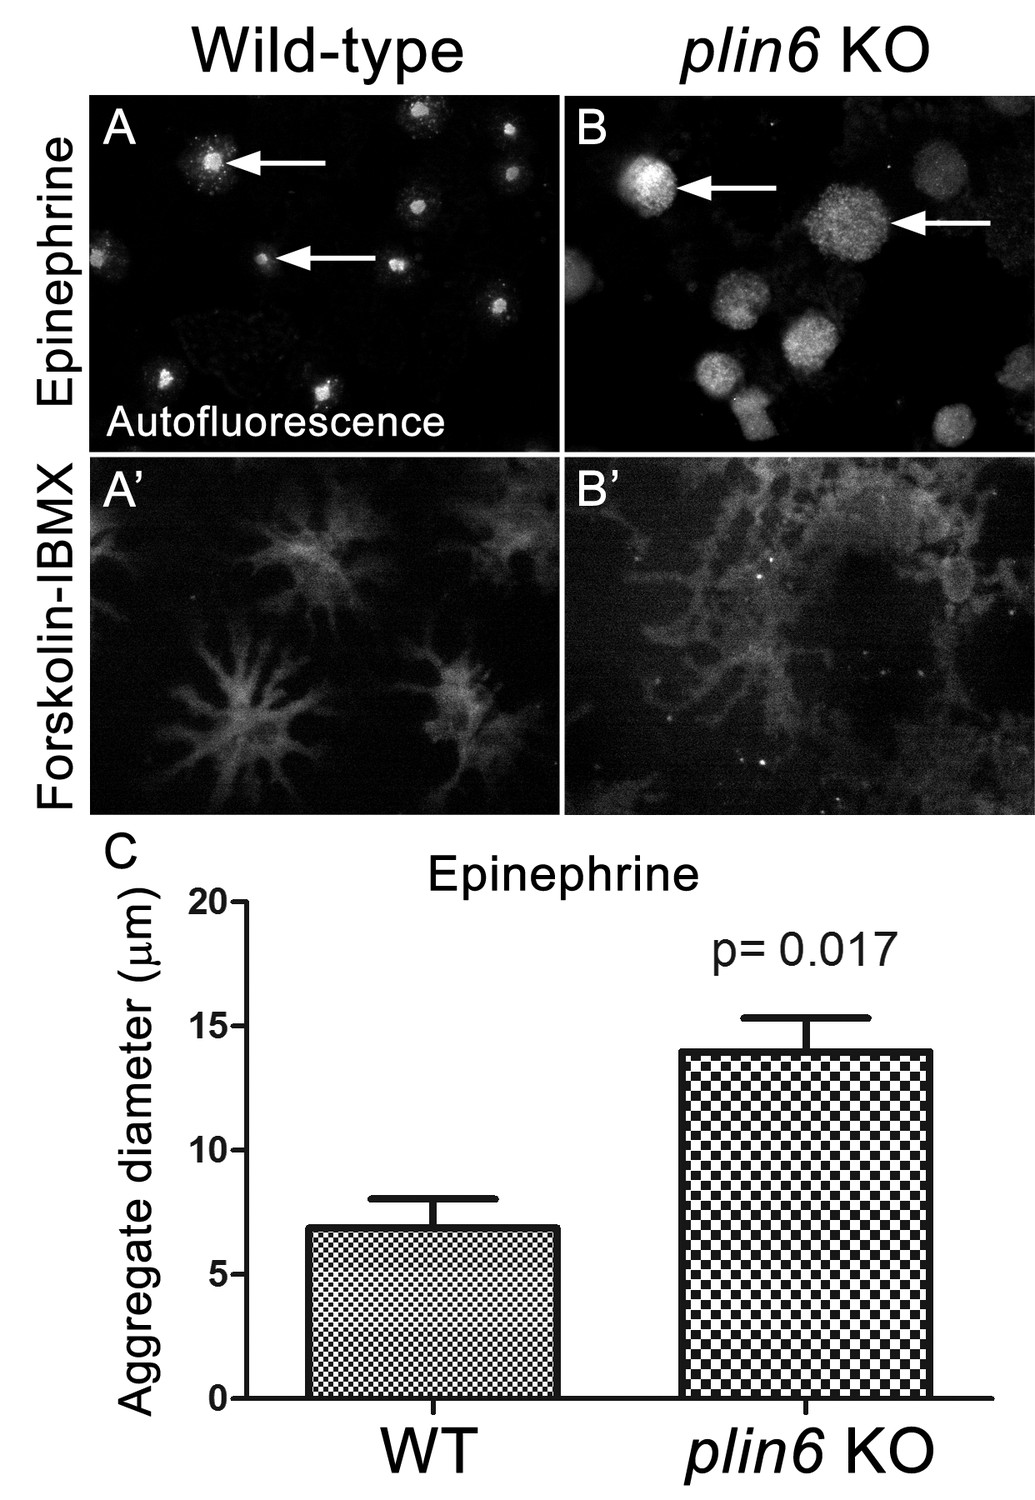
Loss of Plin6 function impairs CB aggregation in adult zebrafish xanthophores.
(A–A’) An isolated scale from a wild-type animal showing xanthophore carotenoid body auto-fluorescence. 1 hr incubation in Epinephrine (A) or forskolin-IBMX (A’) induced CB aggregation and dispersion, respectively. (B–B’) An isolated scale from a plin6 mutant animal showing xanthophore carotenoid body auto-fluorescence. 1 hr incubation in Epinephrine (B) failed to induce tight CB aggregation (arrows). However, incubation in forskolin-IBMX (B’) induced CB dispersion. (E) Quantification of the aggregate diameter of wild-type and plin6 mutant xanthophores from measurements of Epinephrine-treated scales (N = 3; p=0.017).
-
Figure 7—source data 1
Carotenoid body diameters of wild type and plin6 knockout fish following epinephrine-induced aggregation (Figure 7C).
- https://doi.org/10.7554/eLife.21771.022
Figure 8
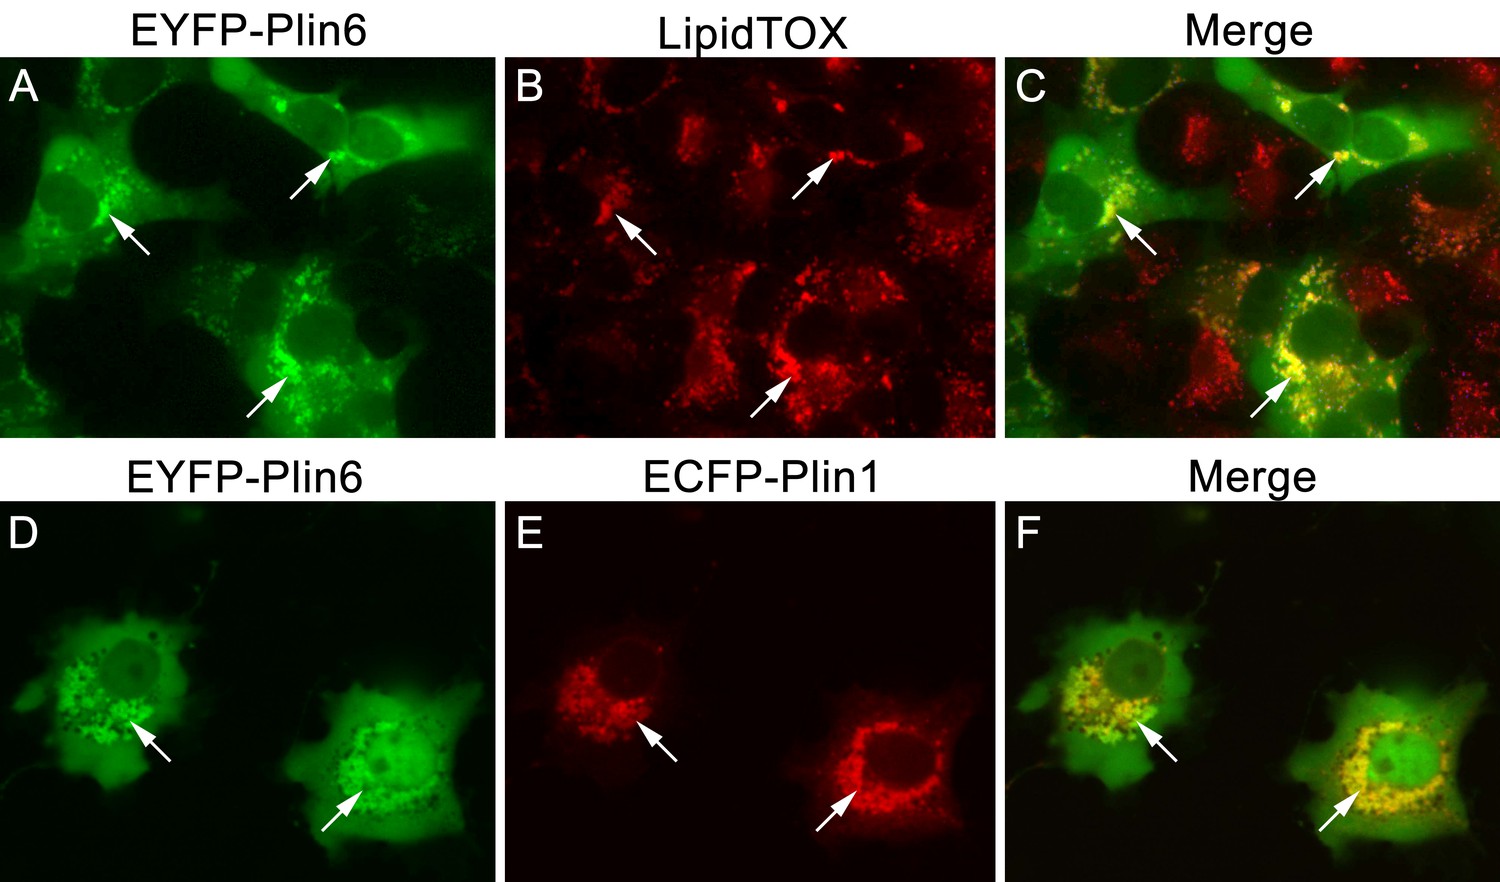
CD and LD are analogous structures.
(A) Expression of EYFP-Plin6 fusion protein in COS7 cells that have been induced to create lipid droplets. Strong expression is observed near the nuclei (arrows). (B) Lipidtox staining of intracellular lipid droplets (arrows). (C) Overlay of A and B, showing co-labeling of EYFP-Plin6 fusion and LipidTOX stained lipid droplets (arrows). (D) Expression of EYFP-Plin6 fusion protein in COS7 cells (arrows). (E) Mouse Plin1-ECFP fusion expression in the same cells shown in panel A (arrows). (F) Overlay of panels A and B, showing co-expression of zebrafish EYFP-Plin6 and mouse Plin1-ECFP (arrows).
Download links
A two-part list of links to download the article, or parts of the article, in various formats.
Downloads (link to download the article as PDF)
Open citations (links to open the citations from this article in various online reference manager services)
Cite this article (links to download the citations from this article in formats compatible with various reference manager tools)
Lipid droplet biology and evolution illuminated by the characterization of a novel perilipin in teleost fish
eLife 6:e21771.
https://doi.org/10.7554/eLife.21771


