Olfactory receptor accessory proteins play crucial roles in receptor function and gene choice
- Duke University Medical Center, United States
- Graduate School of Agricultural and Life Sciences, The University of Tokyo, Japan
- Boston University, United States
- Tokyo University of Agriculture and Technology, Japan
- Biogen Inc, United States
- Duke Institute for Brain Sciences, United States
Figures
Figure 1
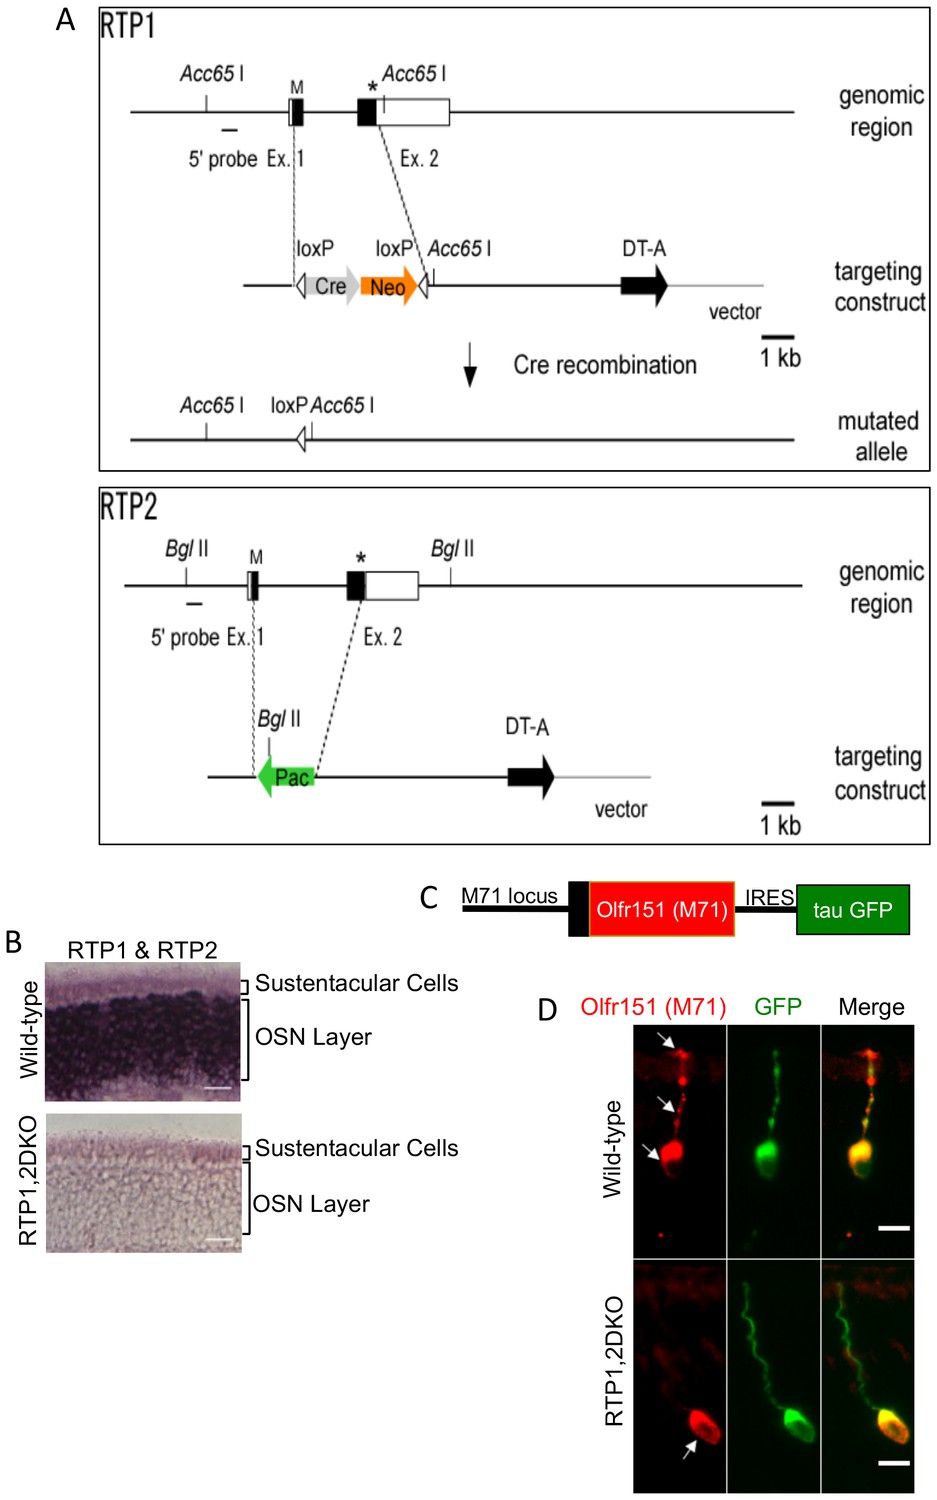
Deletion of RTP1 and RTP2 causes defects in the OE.
(A) Strategy for knocking out RTP1 and RTP2 in series. (B) RNA in situ hybridization with probes specific to RTP1 and RTP2 in both wild-type and RTP1,2DKO mice showing that the knock out mice do not express either of these proteins. Scale bar = 50 μm. (C) Schematic depiction of M71-IRES-tau GFP. (D) Antibody against M71 (red) stains the dendrite in the wild-type OE (top) but not the RTP1,2DKO OE. On the other hand, the antibody against GFP shown in green stains the entire neuron from RTP1,2DKO;M71-IRES-tauGFP mice, which shows that M71 positive OSNs have dendrites.
Figure 2 with 1 supplement
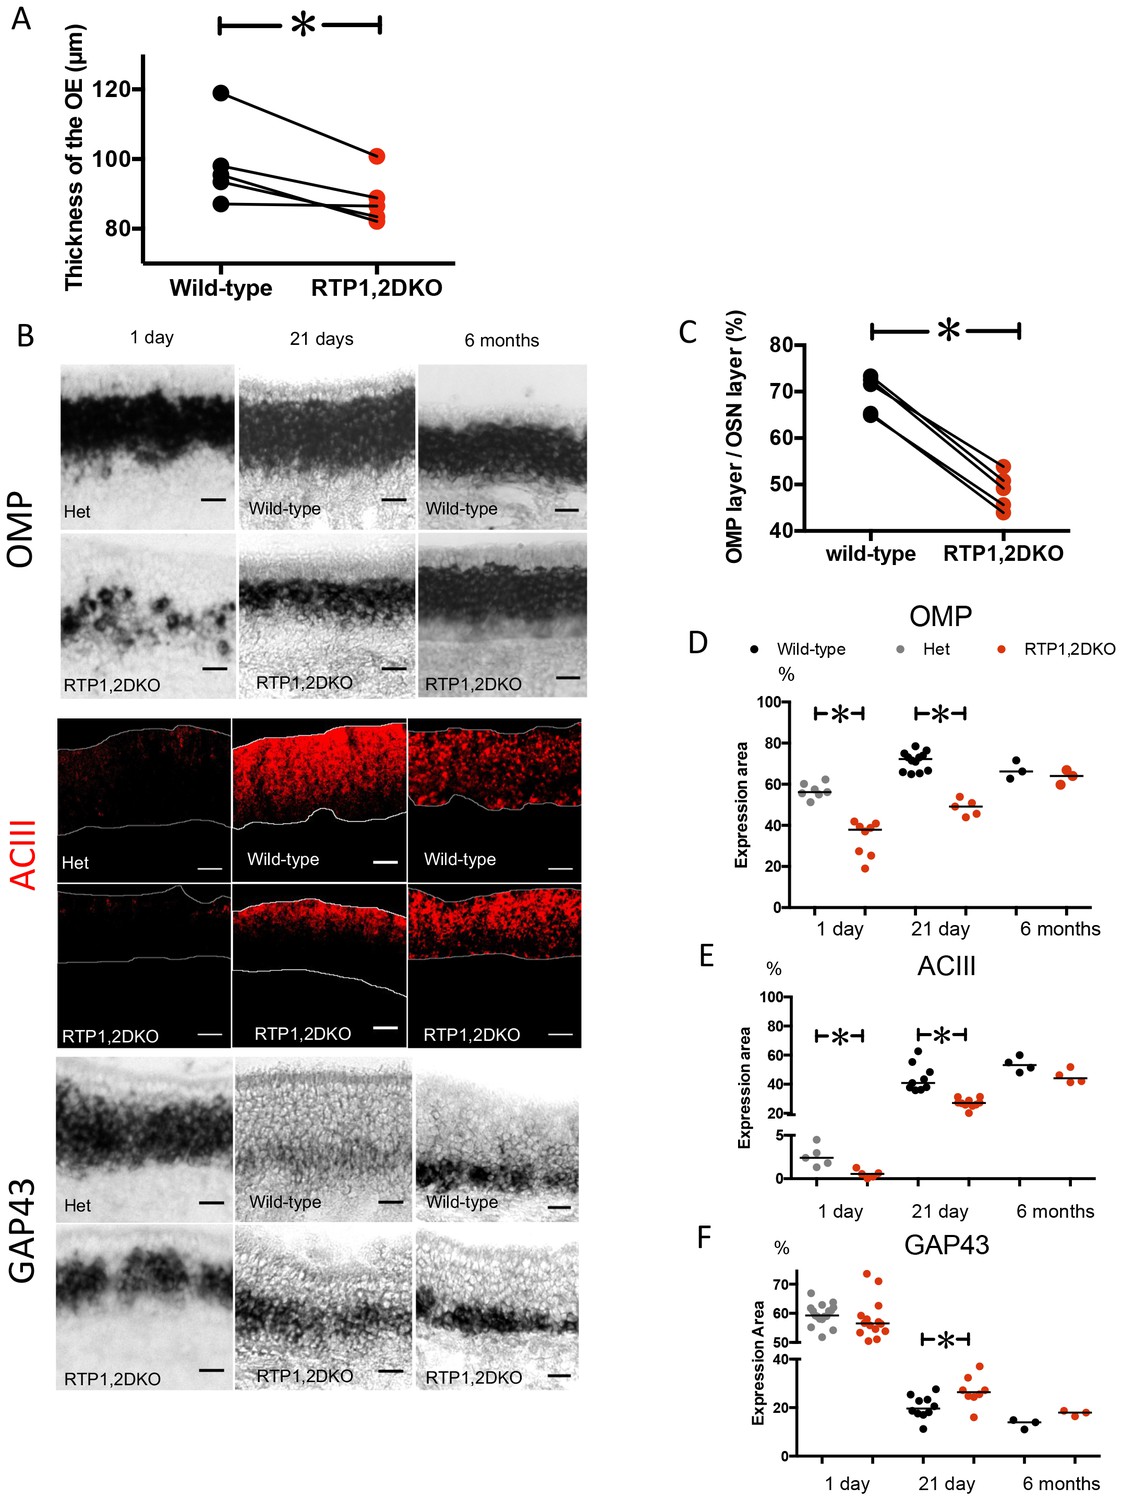
RTP1,2DKO mice have fewer mature sensory neurons.
(A) Paired comparison of the thickness of the OE measured at five matched positions (see methods) between RTP1,2DKO and their wild-type littermate. (p=0.02, paired student t test). (B) RNA in situ hybridization against OMP (top), GAP43 (bottom) and IHC against ACIII (middle) at 1 day, 21 days and 6 months old. Scale bar = 25 μm. (C) Quantification of the percent area occupied by OMP RNA in situ hybridization signal from matched positions in the OE. Pair wise student t test shows a significant reduction in the area occupied by OMP staining in RTP1,2DKO. Error bars indicate SEM, p<0.0001, Paired student t test. (D) Comparison of percent area occupied by OMP between RTP1,2DKO and their het/wild-type littermates at different ages showing that RTP1,2DKO has fewer mature OSNs at 1 day (p=0.0003 Mann Whitney U test) and 21 day (p=0.0003 Mann Whitney U test) but there is no difference at 6 months (p=0.7, Mann Whitney U test). (E) Quantification of the area occupied by ACIII staining between RTP1,2DKO and their control genotype (hetetrozygous or wild-type) littermates at different ages showing that RTP1,2DKO has fewer mature OSNs at 1 day (p=0.0079 Mann Whitney U test) and 21 day (p<0.0001 Mann Whitney U test) but there is no significant difference at 6 months (p=0.1143, Mann Whitney U test). (F) Quantification of the area occupied by GAP43 staining between RTP1,2DKO and their het or wild-type littermates at different ages showing that RTP1,2DKO has more immature neurons at 21 day (p=0.0343 Mann Whitney U test).
-
Figure 2—source data 1
OE thickness and percent area occupied by the OMP layer, ACIII layer and GAP43 layer in the wild-type and RTP1,2DKO.
- https://doi.org/10.7554/eLife.21895.005
Figure 2—figure supplement 1
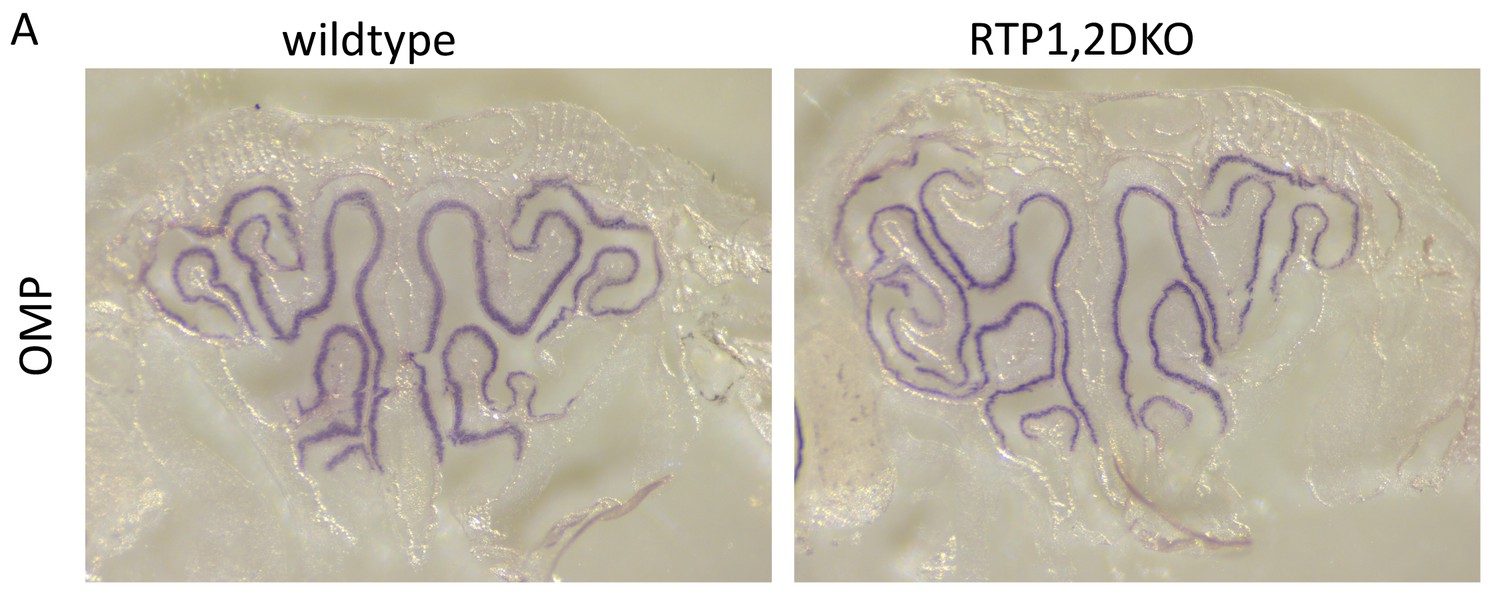
Low magnification view of OMP in situ hybridization signals in OE sections.
(A) Matching OE sections from Wild-type (left) and RTP1,2DKO (right).
Figure 3
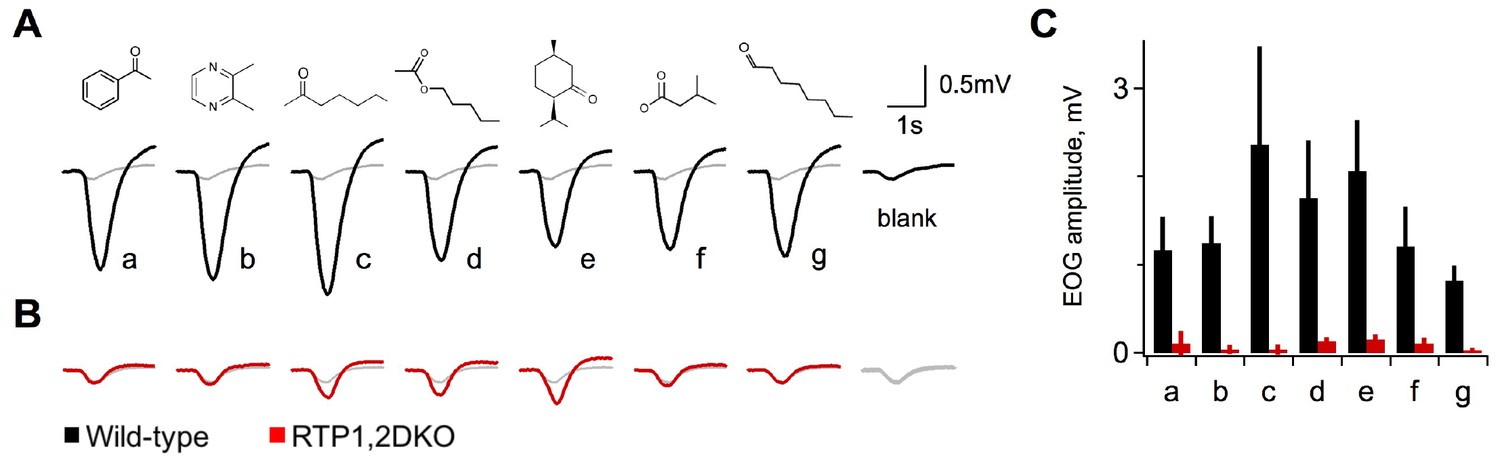
Diminished activity in response to odorants in RTP1,2DKO.
(A) Electroolfactograms show the response to seven odorants wild-type. The grey line denotes the air only blank averaged over multiple interleaved trials interspersed within the series. (B) RTP1,2DKO responses to the same odors (C) Quantification of the EOG amplitudes for each of the seven odorants showing that only a few of the odors elicit responses from the RTP1,2DKO OE and these responses are lower than the wild-type. Each bar represents the difference between the peak of the odor minus the peak of the air only blank.
Figure 4 with 1 supplement
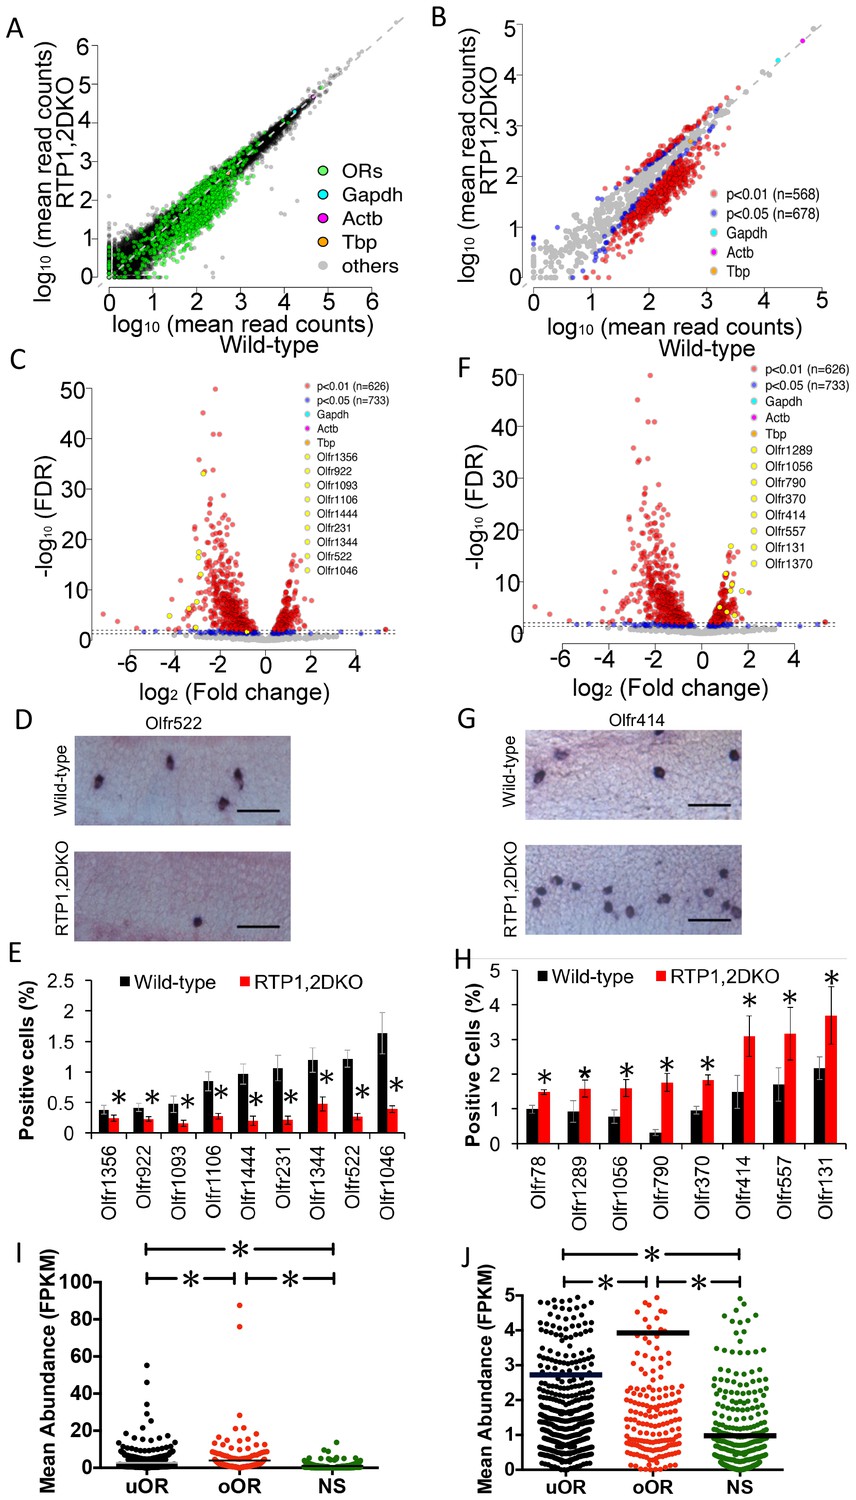
Representation of ORs in RTP1,2DKO.
(A) Comparison of all transcripts between the wild-type and RTP1,2DKO, the green dots represent ORs, higher read counts for ORs are observed in the wild-type compared to RTP1,2DKO. (B) A comparison of the expression levels of ORs between the wild-type (x – axis) and RTP1,2DKO (y-axis). Red indicates uORs and oORs with p<0.01, blue indicates p<0.05. (C) A volcano plot showing the fold change of the expression levels (x-axis) of the ORs between wild-type and RTP1,2DKO using read counts normalized by OR genes. Red dots are ORs with p<0.01, blue: p<0.05, yellow dots signify candidate uORs chosen for validation. (D) Representative images for an in situ analysis with a probe specific to Olfr522 (uOR) where there are fewer positive OSNs in RTP1,2DKO when compared to the wild-type. Scale bar = 25 μm. (E) Quantification of the OSNs expressing uORs shown in (C); all the tested ORs showed smaller fractions of positive OSNs in RTP1,2DKO compared to the wild-type. p<0.05, Mann-Whitney U Test, n = 3 mice. (F) Volcano plot showing oORs with read counts normalized by OR genes. (G) Representative images for an in situ hybridization analysis with a probe specific to Olfr414 (oOR) where there are more positive OSNs in RTP1,2DKO when compared to the wild-type. Scale bar = 25 μm. (H) Quantification of the OSNs expressing oORs shown in (G); all the tested ORs showed greater fractions of positive OSNs in RTP1,2DKO compared to wild-type. p<0.05, Mann-Whitney U Test, n = 3 mice. (I) Plot of the mean abundance where each dot represents a single olfactory receptor classified as an uOR/ oOR/ NS based on normalization by ORs. The horizontal bars denote mean abundance (FPKM). oORs are significantly more abundant than uORs, NS are less abundant than both oORs and uORs (p<0.0001, one-way ANOVA, Tukey’s post hoc test). (J) zoomed in view of the plot showing uOR/oOR and NS abundance, horizontal bars denote mean abundance (FPKM).
-
Figure 4—source data 1
Percent positive cell counts for the uORs and oORs in Figure 4E and 4 hr.
- https://doi.org/10.7554/eLife.21895.009
Figure 4—figure supplement 1
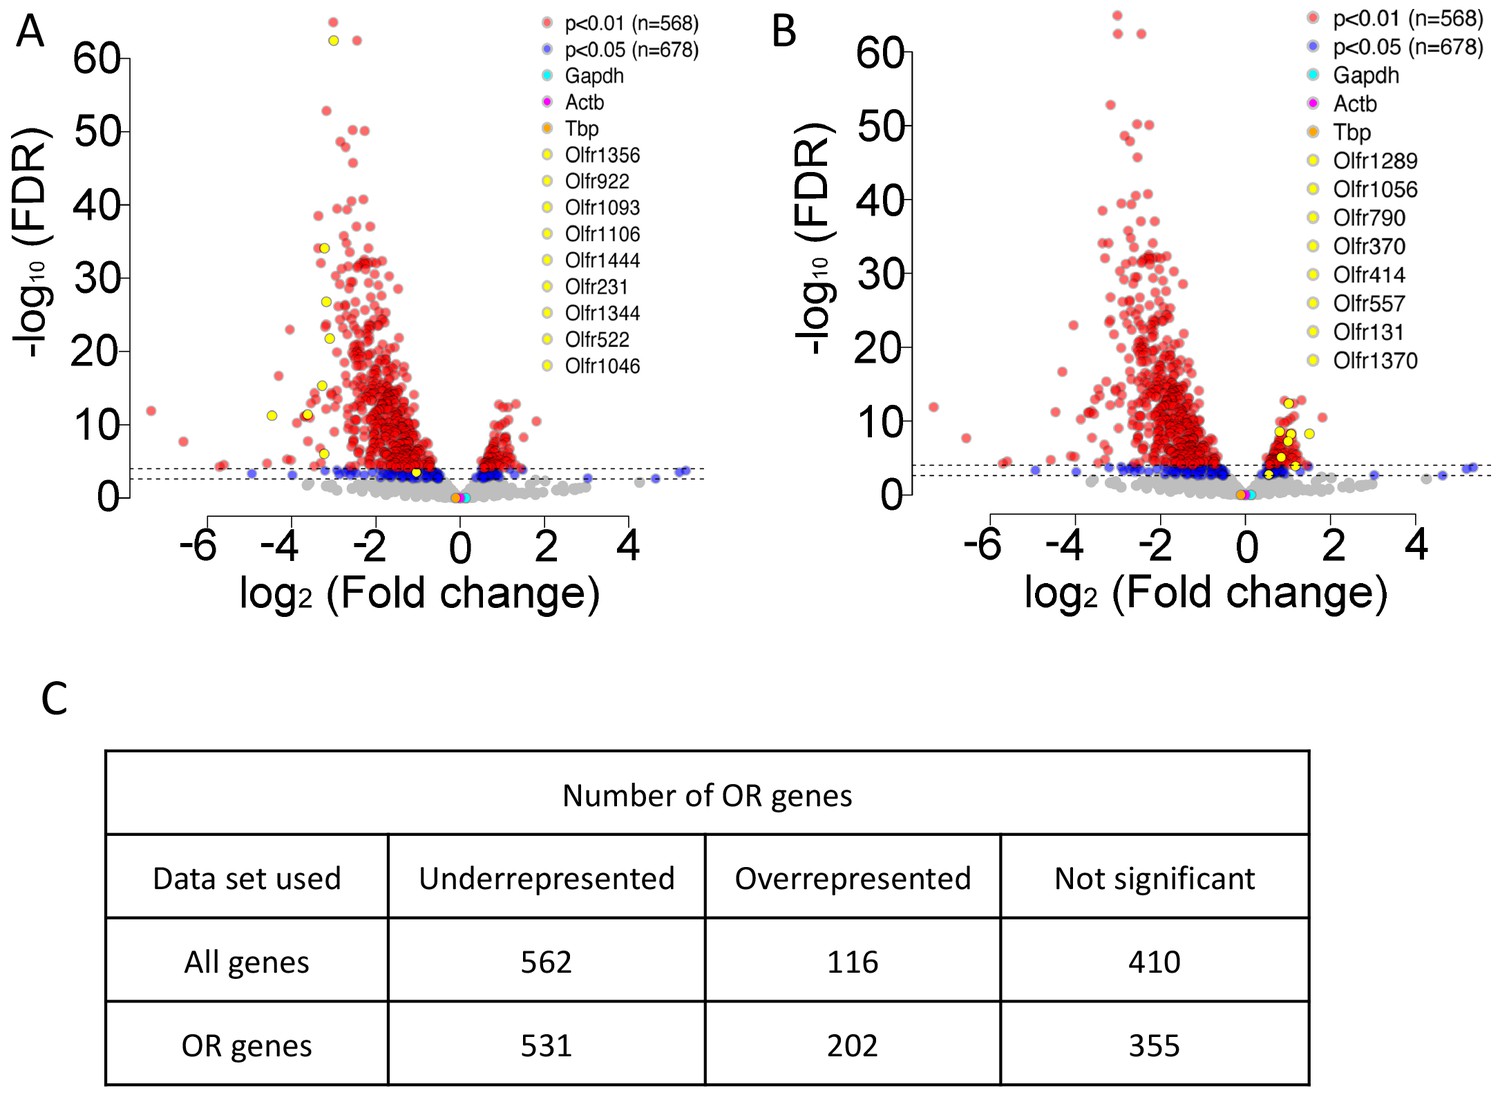
Representation of ORs in RTP1,2DKO using all genes.
(A) Volcano plot showing the fold change of the expression levels (x-axis) of the ORs between wild-types and RTP1,2DKO using read counts normalized by all genes from our sequencing data. Y axis indicates the FDR. Red dots are ORs with p<0.01, blue: p<0.05, yellow dots signify candidate uORs chosen for validation in Figure 4E. (B) Volcano plot showing the fold change of the expression levels (x-axis) of the ORs between wild-types and RTP1,2DKO using read counts normalized by all genes from our sequencing data. Y axis indicates the FDR. Red dots are ORs with p<0.01, blue: p<0.05, yellow dots signify candidate oORs chosen for validation in Figure 4H. (C) Table depicting the number of OR genes that are either underrepresented, overrepresented or not significantly changed based on the data set used to normalize OR read counts.
Figure 5
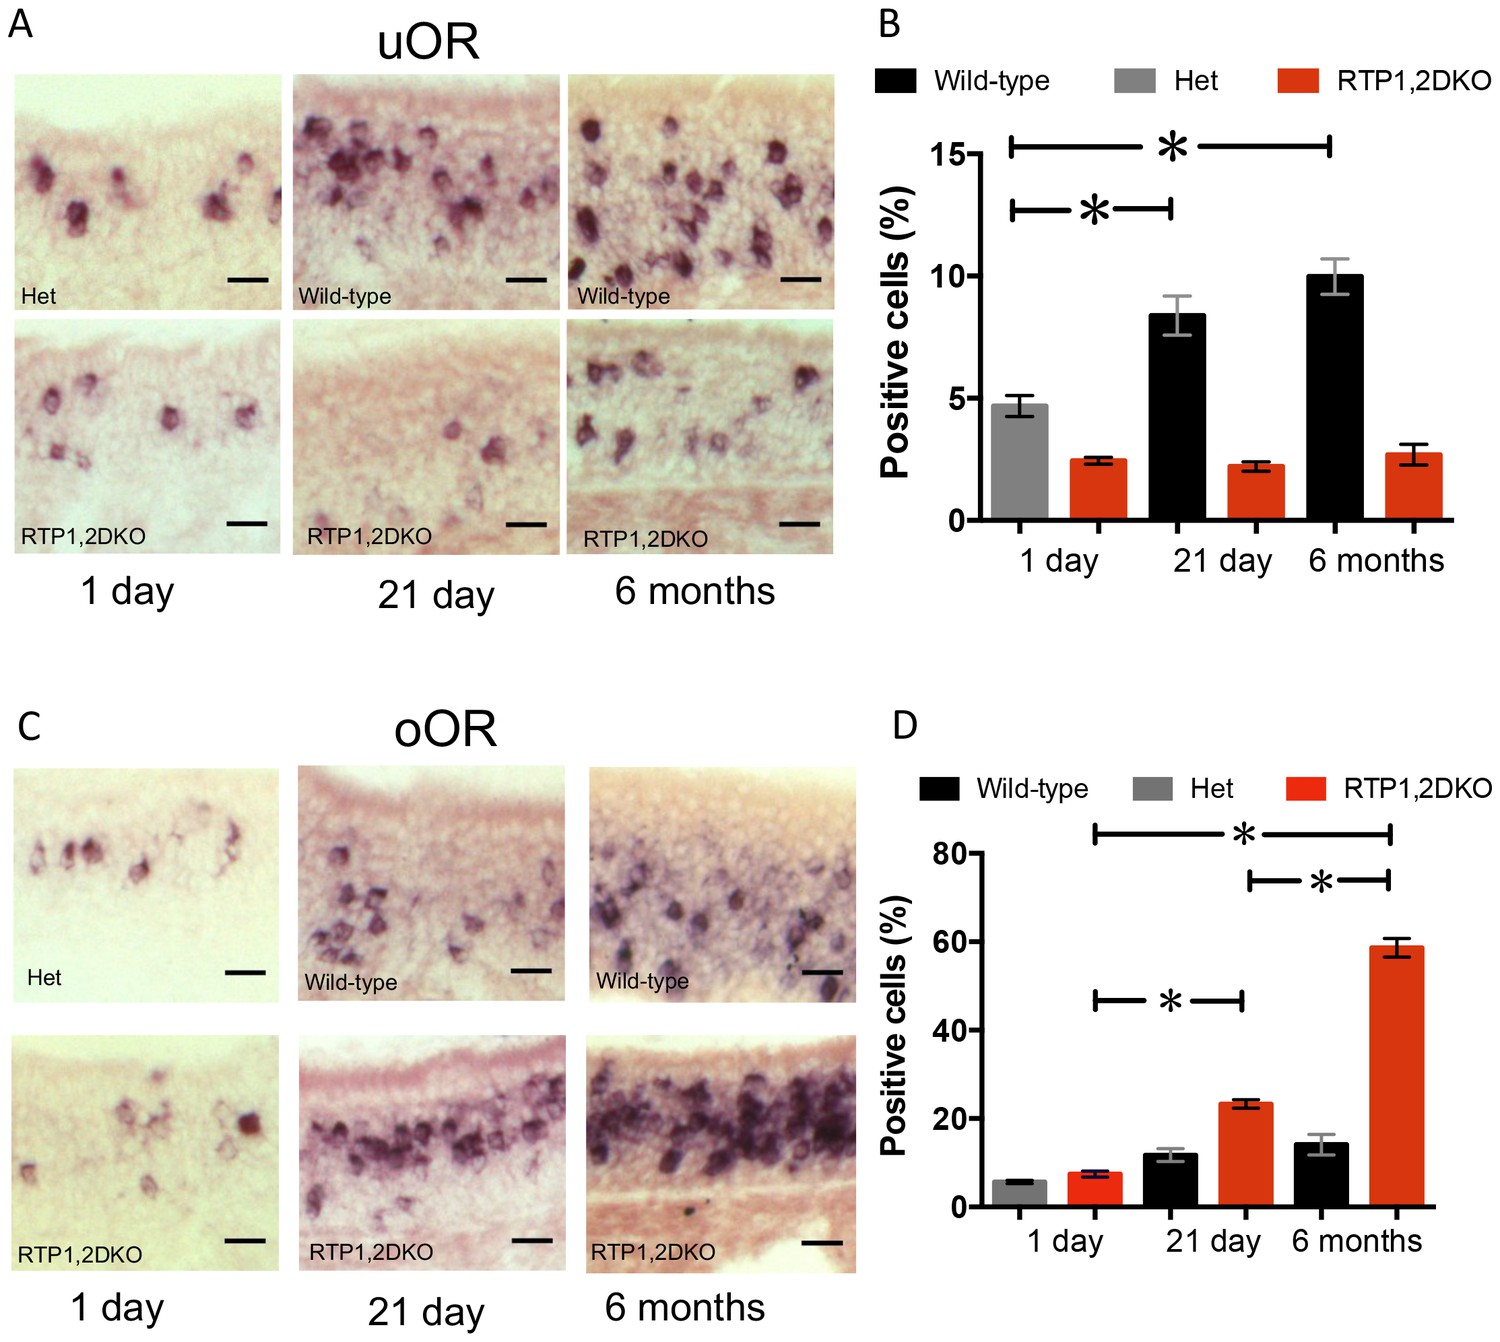
The proportion of OSNs expressing oORs increases in older RTP1,2DKO.
(A) Representative images from 1 day, 21 day and 6 month OE stained with a probe mix against 11 of the uORs expressed in the dorsal OE. (B) Quantification of the percent dorsal uOR positive cells at different ages in RTP1,2DKO and their het or wild-type littermates. The fraction of cells positive for this probe significantly increases with age only in wild-type (p<0.0001 one-way ANOVA, Tukey’s post hoc test). (C) Representative images from 1 day, 21 day and 6 month OE stained with a probe mix against 25 of the oORs expressed in the dorsal OE. (D) Quantification of the percent dorsal oOR positive cells at different ages between RTP1,2DKO and their het or wild-type littermates. The fraction of cells positive for this probe mix significantly increases with age in RTP1,2DKO (p<0.0001 one-way ANOVA, Tukey’s post hoc test).
-
Figure 5—source data 1
Percent positive cell counts for the uOR and oOR probe mix at 1 day, 21 day and 6 month old OE.
- https://doi.org/10.7554/eLife.21895.012
Figure 6
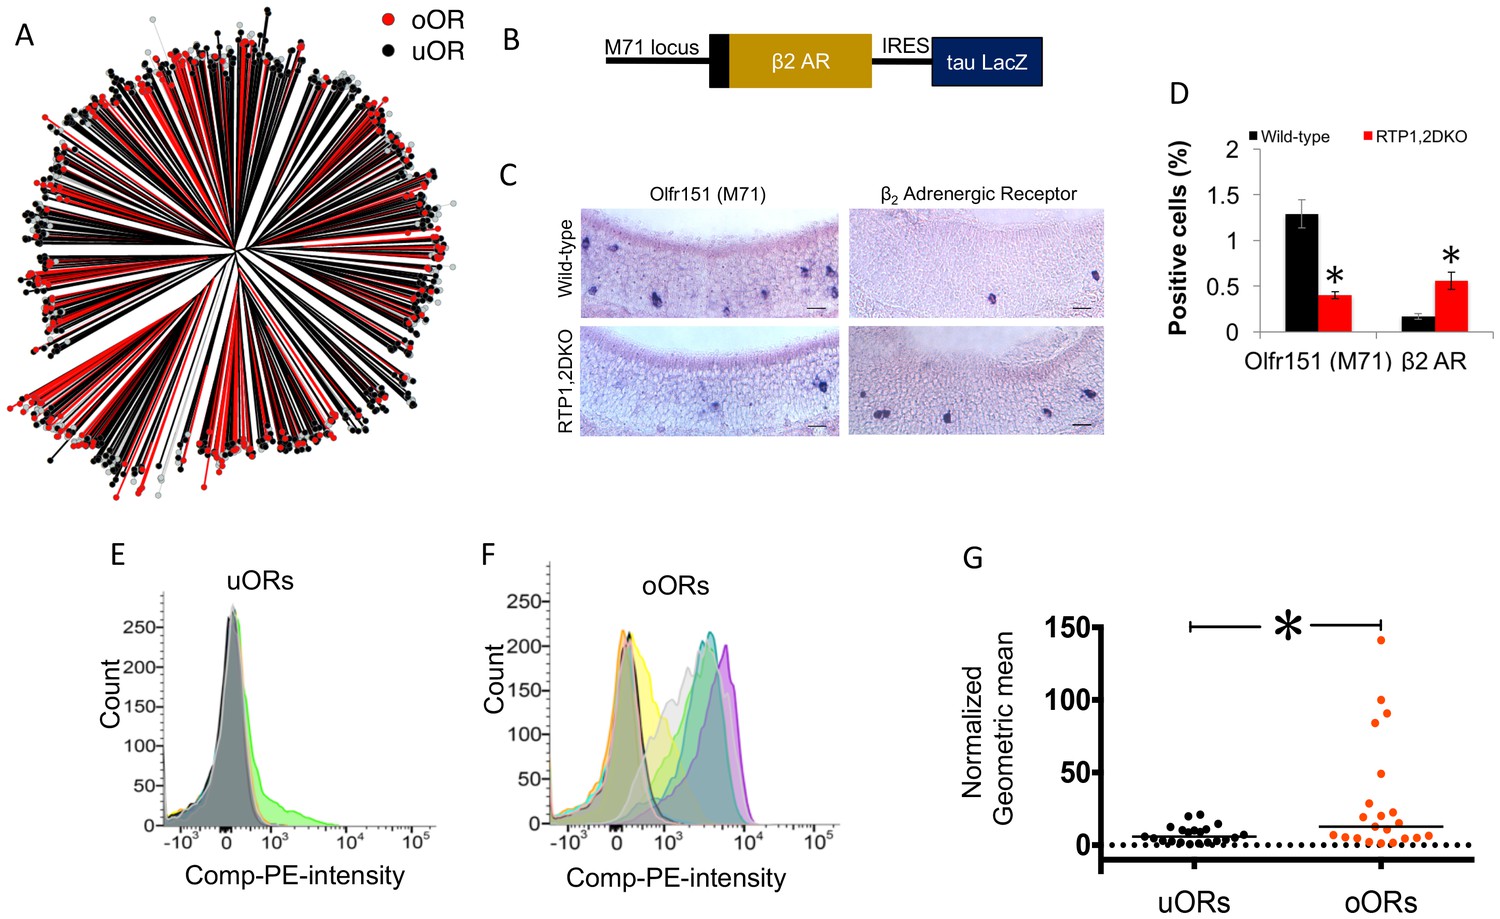
OR protein sequences determine representation in RTP1,2DKO.
(A) Phylogenetic tree showing uORs in black and oORs in red. (B) Schematic depiction of β2AR-IRES-tau LacZ. (C) The percent Olfr151 positive cells is smaller in RTP1,2DKO mouse (left panels). β2Adrenergic receptor expressed from the Olfr151 locus shows more β2AR cells in RTP1,2DKO mouse (right panels). (D) Quantification of the percent positive Olfr151 and β2AR cells in wild-types vs RTP1,2DKO p<0.05 Mann-Whitney U test, n = 3 mice. (E) Representative FACS data graphing the number of cells (y-axis) vs the intensity of phycoerythrin staining expressing Rho tagged uORs (x-axis). Each color represents an individual uOR. (F) Representative FACS data graphing the number of cells (y-axis) vs the intensity of phycoerythrin staining expressing Rho tagged oORs (x-axis). Each color represents an individual oOR. (G) Comparison of the normalized geometric mean of the compensated PE intensity for all uORs vs all oORs tested. The geometric means are normalized to Olfr78 (p=0.0483 Mann-Whitney U test, uOR n = 23 genes, oOR n = 24 genes). Every geometric mean is calculated by counting the PE intensity across 10,000 cells.
-
Figure 6—source data 1
Normalized geometric mean for PE intensity obtained from our FACS experiment.
- https://doi.org/10.7554/eLife.21895.014
Figure 7
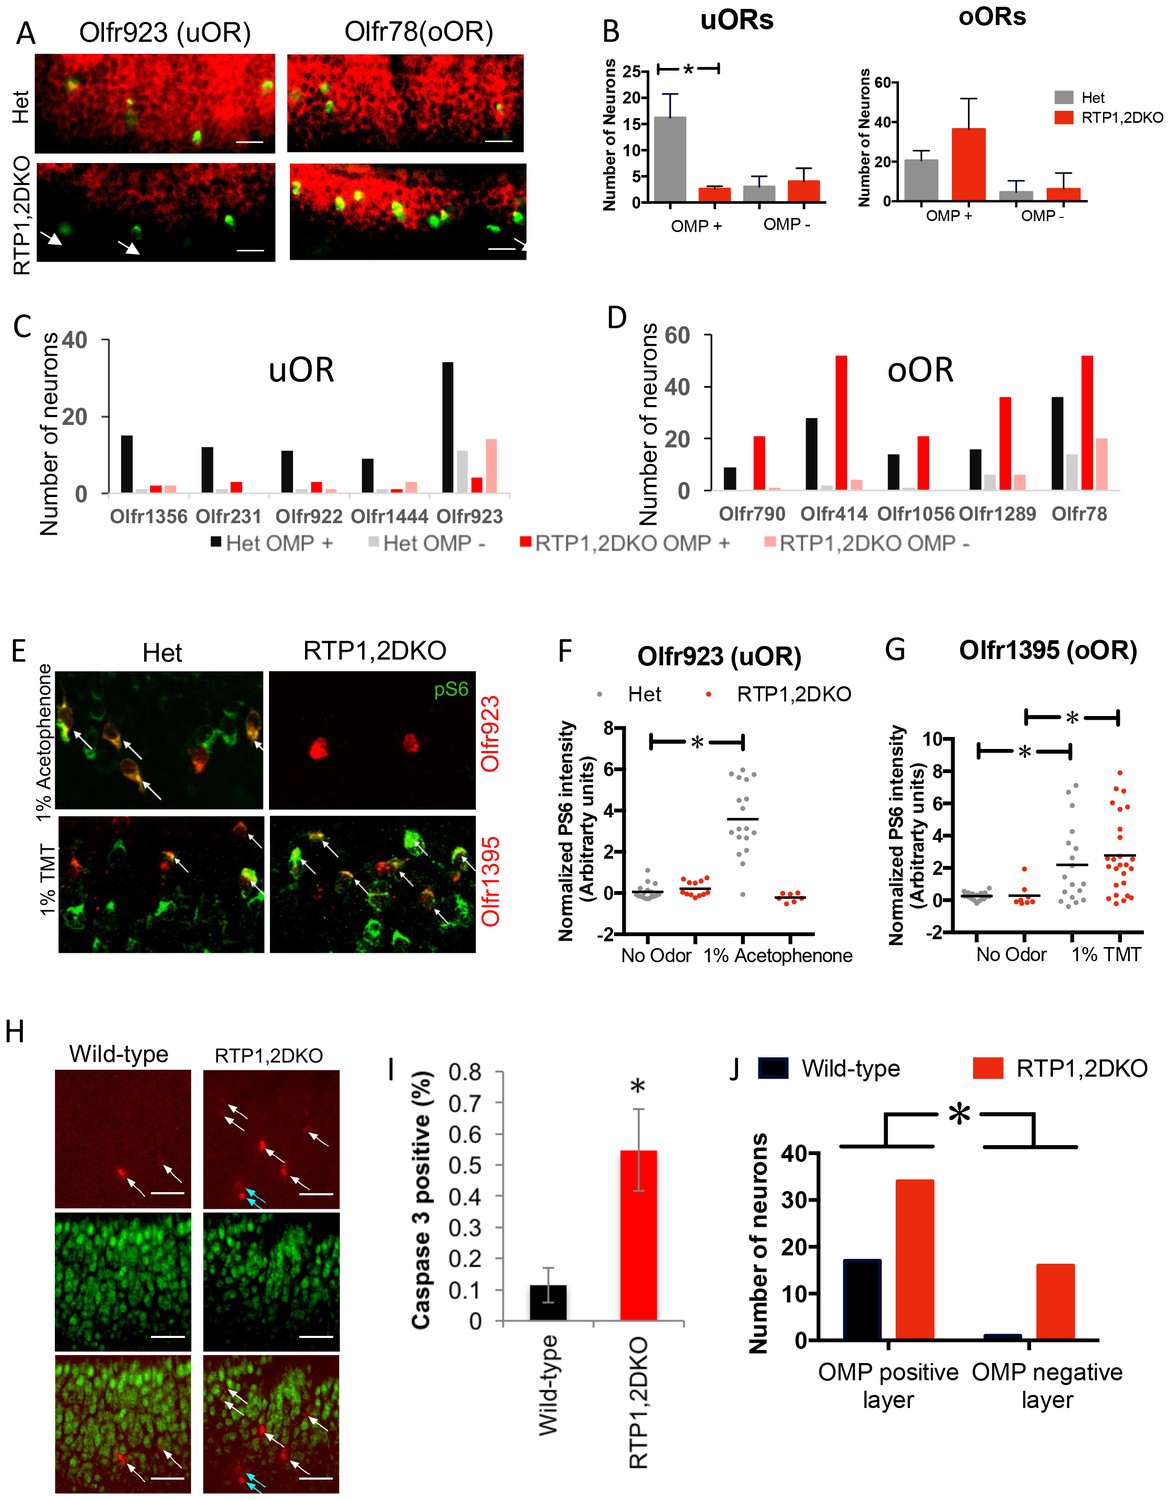
OSNs expressing oORs from RTP1,2DKO can mature and function.
(A) Representative images showing the colocalization of Olfr923 (uOR) and Olfr78 (oOR) (green) with OMP (red) for het (top) and RTP1,2DKO (bottom). OMP negative OSNs are indicated with arrows. (B) Quantification of OMP positive OSNs for uORs and oORs as a group. For uORs there is a significant decrease (p=0.024 Mann Whitney U test, het n = 96, RTP1,2DKO n = 33) in the number of OMP positive OSNs in RTP1,2DKO whereas no significant difference is observed for oORs (p=0.4427 Fisher’s exact test, het n = 126, RTP1,2DKO n = 213). (C) Quantification of the number of OSNs co-expressing OMP for individual uORs. (D) Quantification of the number of OSNs co-expressing OMP for individual oORs. (E) Representative images for pS6 staining (green) along with either a uOR (Olfr923) or an oOR (Olfr1395) in response to their cognate ligands. het (left) shows pS6 induction, whereas RTP1,2DKO (right) shows pS6 induction in response to an odor that stimulates the oOR but not the one that stimulates the uOR. All pS6 positive neurons are indicated by white arrows. (F) Quantification of the fold change in pS6 staining (pixel) intensity for Olfr923 positive cells in het (grey) and RTP1,2DKO mice (red) in response to 1% acetophenone. There is a significant increase in the pS6 induction in het (p<0.0001 one-way ANOVA, Tukey’s post hoc test) but not RTP1,2DKO when subject to the odor. (G) Quantification of the fold change in pS6 staining pixel intensity for Olfr1395 positive cells in het (grey) and RTP1,2DKO mice (red) in response to 1% TMT. There is a significant increase in the pS6 induction in both het and RTP1,2DKO when subject to the odor (p=0.0002, one-way ANOVA, Tukey’s post hoc test). (H) Wild-type (left) and RTP1,2DKO OE (right) stained with an antibody against the active form of caspase3 (red) and OMP (green). The white arrows indicate cells expressing active caspase 3 in the OMP positive layer and the blue arrows show the active caspase 3 positive cells outside the OMP positive layer. Scale bar = 50 μm. (I) Quantification of the percentage of active caspase3 positive cells. Error bars indicate SEM, p<0.01, Mann-Whitney U Test (n = 3 mice) (J) Quantification of OMP and active caspase 3 double staining showing that RTP1,2DKO have significantly more OSNs undergoing cell death both in mature and immature OSN layers compared to wild-type. (p=0.029, Fisher’s exact test)
-
Figure 7—source data 1
Numbers of uOR and oOR neurons found within the OMP layer and outside it.
- https://doi.org/10.7554/eLife.21895.016
-
Figure 7—source data 2
Normalized pS6 staining intensity for Olfr923 and Olfr1395 positive cells from het and RTP1,2DKO OE in response to 1%acetophenone and 1%TMT respectively.
- https://doi.org/10.7554/eLife.21895.017
Figure 8
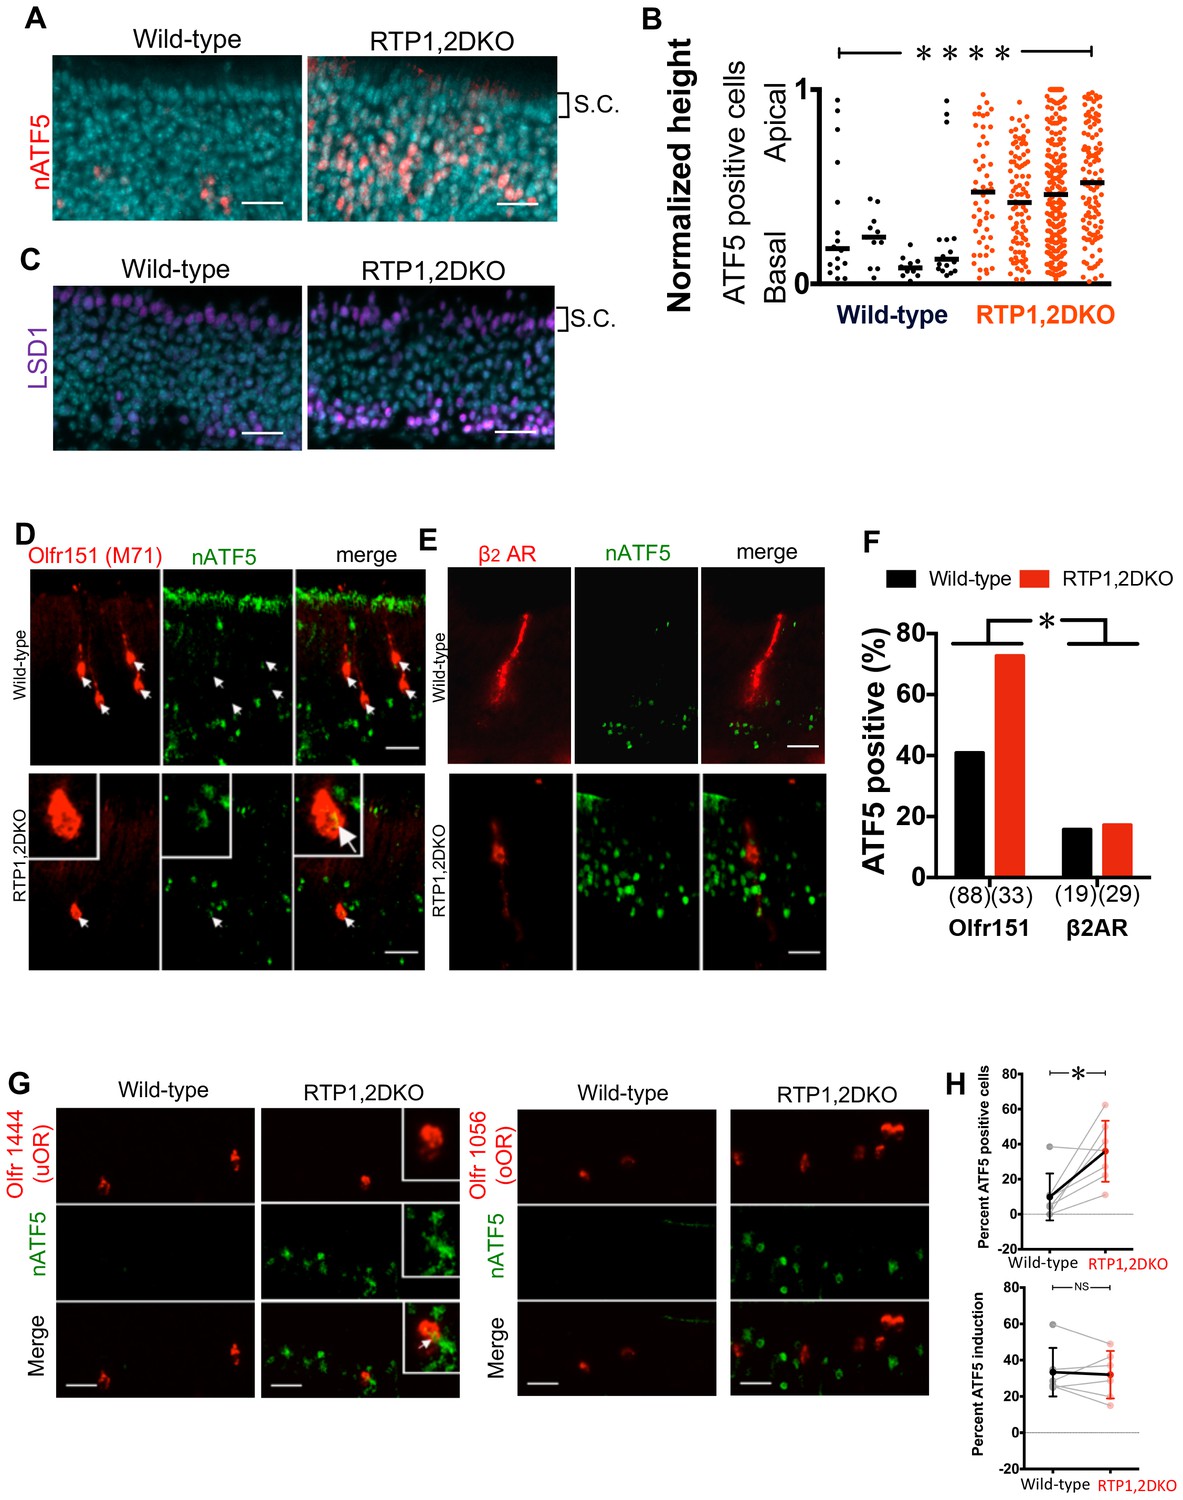
nATF5 expression persists in OSNs expressing uORs but not oORs in RTP1,2DKO.
(A) Expanded expression pattern of nATF5 is observed for RTP1,2DKO Scale bars = 25 μm. S.C. = Sustentacular cells. (B) Analysis of individual sections of wild-type and RTP1,2DKO OE for ATF5 expression, RTP1,2DKO mice have a larger number of nATF5 positive cells and they are more apically situated compared to wild-type p=0.0049, Mann-Whitney U test, n = 3 mice. (C) Similar expanded expression pattern is observed for LSD1. Scale bars = 25 μm. S.C. = Sustentacular cells. (D) Representative images of Olfr151 and nATF5 in wild-type vs RTP1,2DKO OE. Inset: higher magnification, arrow head: nATF5 and Olfr151 co-localization. (E) Representative images from β2Adrenergic receptor IRES tauLacZ (β2AR) with antibody staining against LacZ indicating β2AR positive OSNs and nATF5. (F) Quantification of the number of OSNs positive for both Olfr151 and nATF5 (left) and β2AR and nATF5 (right). In RTP1,2DKO, there was a significant increase in the number of nATF5-Olfr151 double positive OSNs p=0.0022, Fisher’s exact test, n = 3 mice but not β2AR and nATF5 double positive neurons. p=1, Fisher’s exact test, n = 3 mice. (G) Left: Representative images for Olfr1444 (uOR) (red) co-localization with nATF5 (green) signal in wild-type OE (left) and RTP1,2DKO (right). The inset shows a higher magnification of a single OSN positive for Olfr1444 and nATF5. Right: Representative images for Olfr1056 (oOR) shown in red. (H) Top: Percent nATF5 positive OSNs expressing 7 uORs in the wild-type vs the RTP1,2DKO. The solid points indicate the overall mean of all uORs and the solid line shows that more RTP1,2DKO OSNs expressing uORs co-localize with nATF5. p=0.007, Mann-Whitney U test, n = 2 mice. Bottom: Percent nATF5 positive OSNs expressing 6 oORs in the wild-type vs the RTP1,2DKO. (p=0.937, Mann-Whitney U test).
-
Figure 8—source data 1
Percent uOR/oOR positive cells that co-localize with nATF5 in wild-types and RTP1,2DKO.
- https://doi.org/10.7554/eLife.21895.019
Figure 9 with 1 supplement

Unstable expressing of M71 in RTP1,2DKO.
(A) Schematic depiction of OSN lineage tracing. We crossed a mouse carrying M71–IRES- Cre with Rosa26-lox-stop-lox-tdTomato. In the progeny, the expression of Olfr151 (M71) in an OSN will drive the expression of Cre, leading to the permanent production of tdTomato by the removal of the transcriptional stop sequence. Larger numbers of tdTomato positive OSNs that do not express Olfr151 would indicate unstable gene expression (right). On the other hand, if tdTomato OSNs largely stained positive for Olfr151 (double positive, shown in yellow), it would indicate stable OR expression. (B) Representative images from the wild-type and RTP1,2DKO OE stained with antibody against Olfr151 (green) and tdTomato (red). Arrow heads indicate double positive OSNs and the arrows show tdTomato positive and Olfr151 negative OSNs. (C) Each point represents the ratio of the number of tdTomato and Olfr151 double positive OSNs to the number of only tdTomato positive OSNs in one mouse. RTP1,2DKO mice have significantly lower OR gene choice stability compared to both wild-type and het mice. p<0.05, , Fisher’s Exact test, n = 4 mice.
Figure 9—figure supplement 1
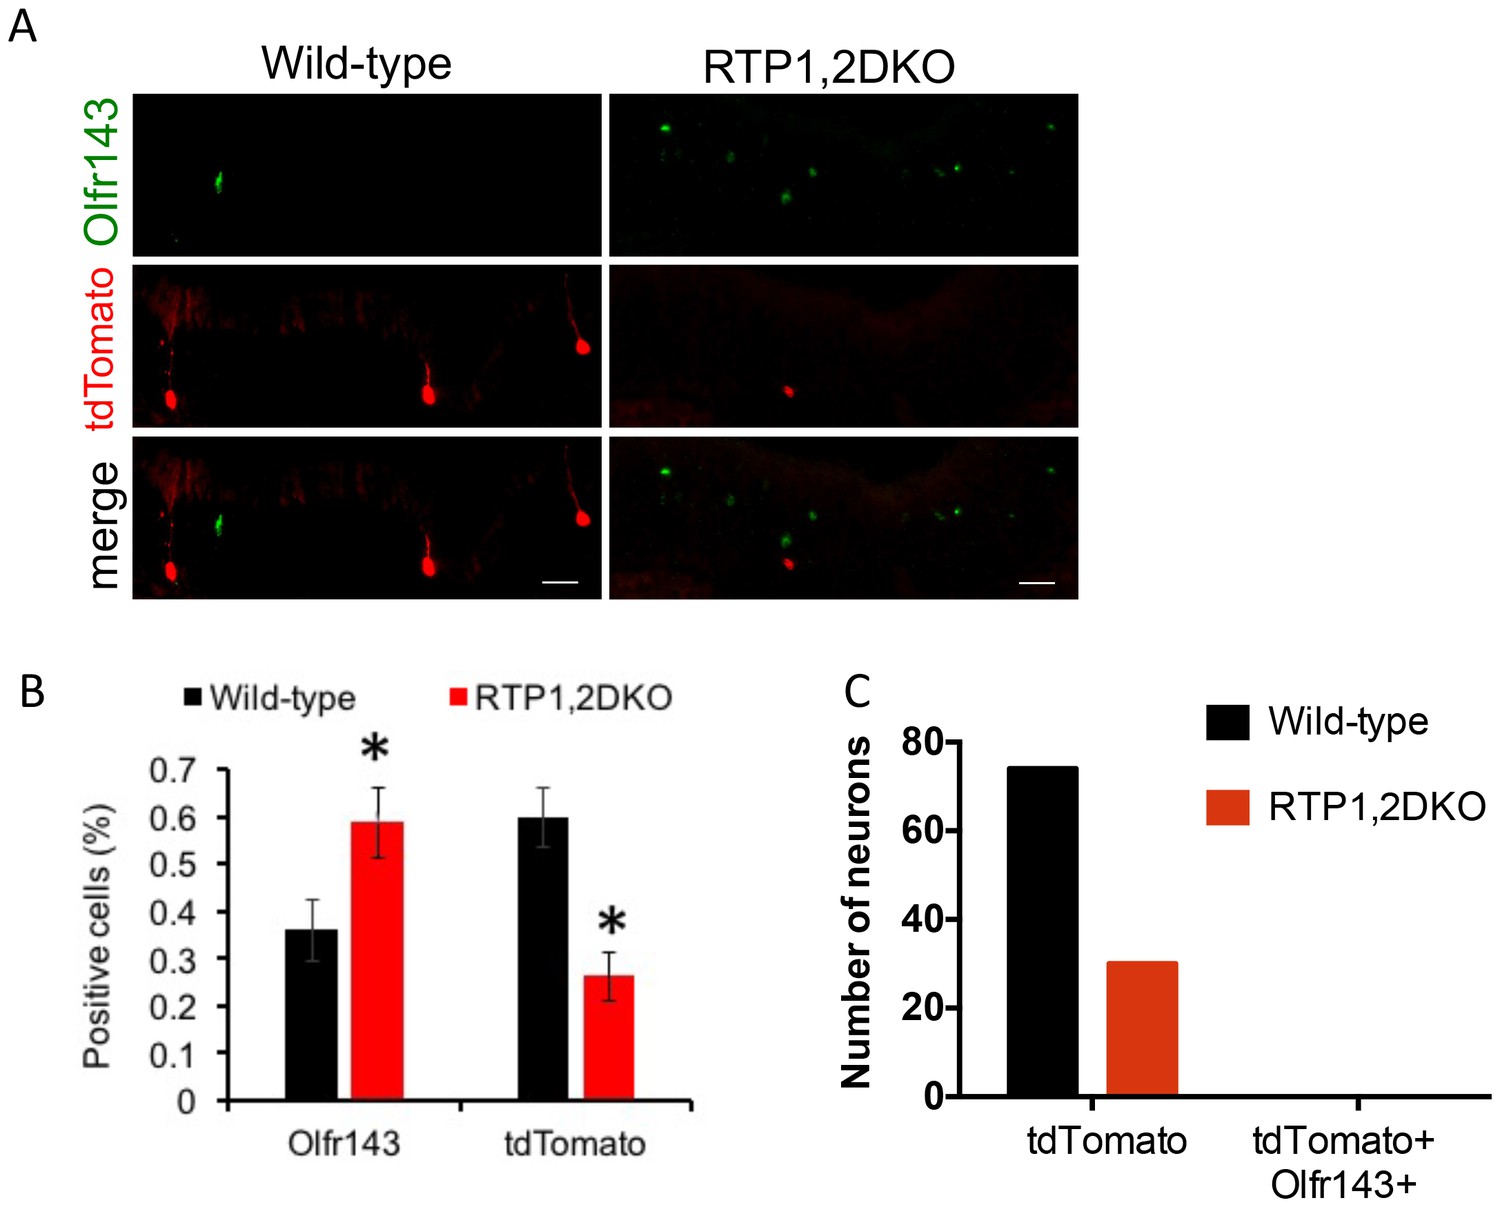
OSNs expressing Olfr151 do not switch to Olfr143.
(A) Representative images from the wild-type and RTP1,2DKO OE stained against Olfr143 (green) and tdTomato (red). (B) The percent Olfr143 positive cells is greater in RTP1,2DKO mouse and tdTomato expressed under the control of the M71 locus shows a reduction in the number of percent positive cells in RTP1,2DKO mouse. (C) The number of neurons that are only tdTomato positive in wild type and in RTP1,2DKO (left). Number of neurons positive for both Olfr143 and tdTomato (right).
Figure 10
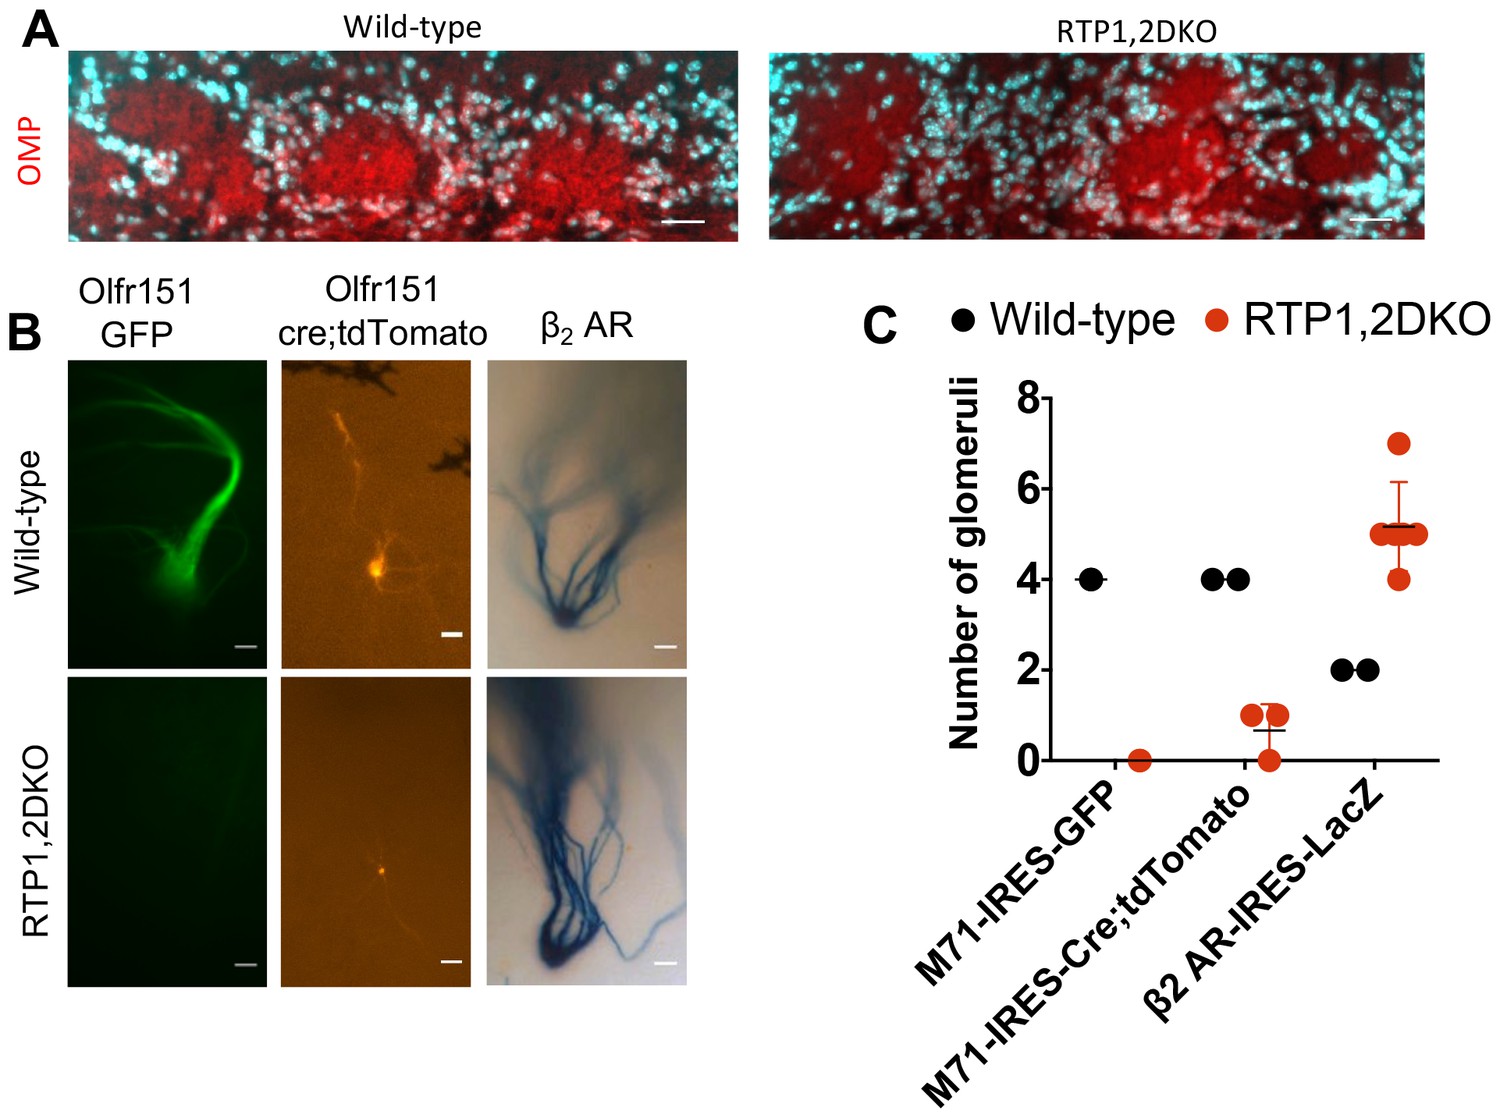
RTP1,2DKO mice are able to form glomeruli.
(A) OMP staining shown in red and nuclear staining in cyan. Both wild-type and RTP1,2DKO mice have OMP in the glomerular layer. Scale bar = 25 μm. (B) A whole mount GFP fluorescence from axons expressing M71 from M71-IRES-tauGFP mice (left), tdTomato fluorescence from M71-IRES-Cre; Rosa26-lox-stop-lox-tdTomato (middle) and LacZ positive axons from β2AR-IRES-tauLacZ mice (right). RTP1,2DKO OBs lack Olfr151 (M71) glomeruli but have tdTomato and LacZ positive ones, while labeled glomeruli are observed in wild-type with M71-IRES-tauGFP, M71-IRES-Cre; Rosa26-lox-stop-lox-tdTomato and β2AR-IRES-tauLacZ. Only the dorso-lateral OB are visible for β2AR-IRES-LacZ in our preparation. Scale bar = 25 μm. (C) Quantification of the total number of glomeruli observed in wild-type and RTP1,2DKO OBs. Each dot represents one mouse.
Figure 11
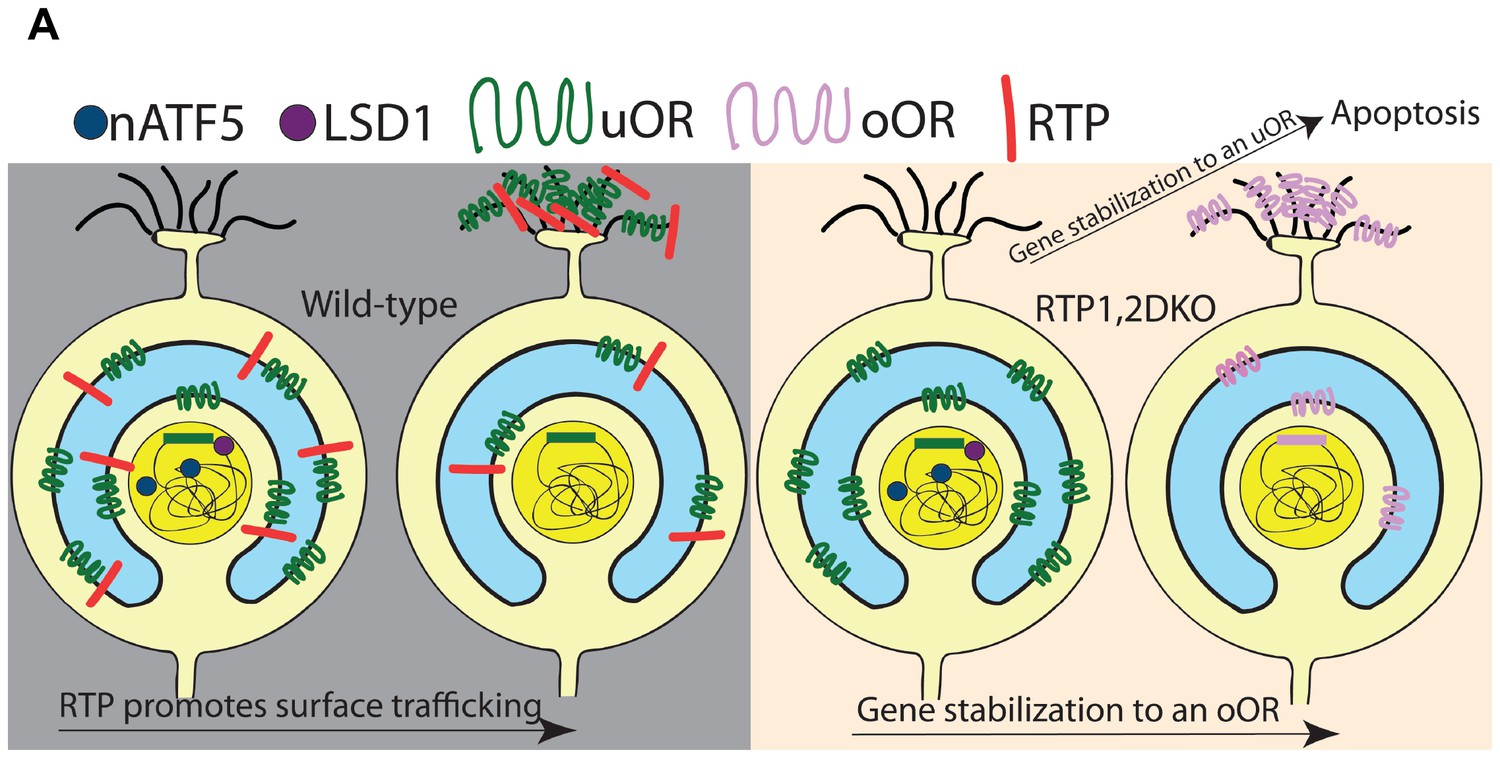
Model for the role of RTP1 and RTP2 in OR gene choice.
(A) A model showing that in the wild-type (left), ORs are transported to the surface of the cell in conjunction with the RTPs. In the absence of the RTPs (right), oORs reach the surface of the cell and these OSNs survive, whereas uORs are not trafficked to the surface and OSNs expressing them show a persistent nATF5 expression. These uOR-expressing OSNs undergo OR choice switching and the OSNs that switch to an oOR are able to survive, leading to oOR overrepresentation. Those that are unable to switch to an oOR undergo cell death.
Additional files
-
Supplementary file 1
The number of sequence reads that map each annotated gene in RNA-Seq from three wild-type and 3 RTP1,2DKO mice. FDR is calculated against the entire data set and the fold change (logFC) is displayed as the log (average wild-type reads/ average RTP1,2DKO reads).
- https://doi.org/10.7554/eLife.21895.024
-
Supplementary file 2
List of oORs and uORs with their chromosomal locations and their expression zones (dorsal versus ventral) in the OE.
- https://doi.org/10.7554/eLife.21895.025
-
Supplementary file 3
Results of one-way ANOVA and Tukey’s post hoc tests
- https://doi.org/10.7554/eLife.21895.026
Download links
A two-part list of links to download the article, or parts of the article, in various formats.
Downloads (link to download the article as PDF)
Open citations (links to open the citations from this article in various online reference manager services)
Cite this article (links to download the citations from this article in formats compatible with various reference manager tools)
Olfactory receptor accessory proteins play crucial roles in receptor function and gene choice
eLife 6:e21895.
https://doi.org/10.7554/eLife.21895


