Sam68/KHDRBS1-dependent NF-κB activation confers radioprotection to the colon epithelium in γ-irradiated mice
- Bloomberg School of Public Health, Johns Hopkins University, United States
- School of Medicine, Johns Hopkins University, United States
- Johns Hopkins University, United States
Figures
Figure 1
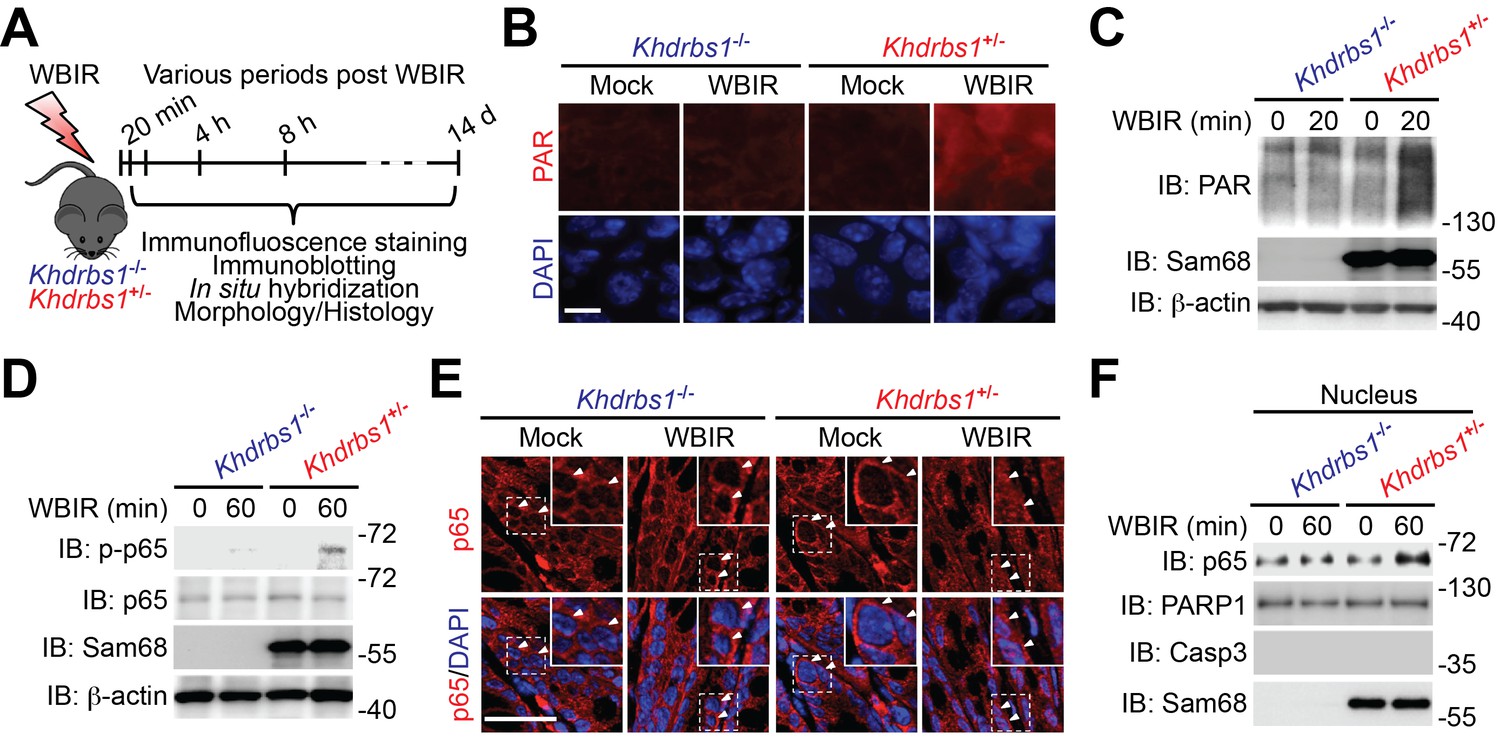
Sam68 deletion diminishes genotoxic stress-induced NF-κB signaling in the γ-irradiated colon.
(A) A schematic of the experimental timeline for the impact of Sam68 deletion on DNA damage-induced NF-κB signaling pathway in γ-irradiated mice. Khdrbs1+/− and Khdrbs1−/− mice subjected to a sublethal dose (6.5 Gy) of whole body γ-irradiation (WBIR) or mock irradiation were euthanized at the indicated periods post WBIR, followed by the analyses as indicated. (B) Immunofluorescence micrographs of PAR in colon tissue collected from Khdrbs1+/− and Khdrbs1−/− mice at 20 min following WBIR or mock irradiation, with nuclei counterstained by DAPI. Scale bar, 25 μm. (C and D) Colon epithelial cells (CECs) were isolated from Khdrbs1+/− and Khdrbs1−/− mice at the indicated periods post WBIR, and whole cell lysates were derived and immunoblotted (IB) for indicated proteins, with β-actin as a loading control. p-p65, phosphorylated p65. (E) Immunofluorescence micrographs of p65 in colon tissue collected from Khdrbs1+/− and Khdrbs1−/− mice at 60 min post WBIR. Scale bar, 50 μm. (F) CECs were collected from Khdrbs1+/− and Khdrbs1−/− mice as treated in (E) and nuclear fractions were derived and IB for indicated proteins. Caspase-3 (Casp3) and PARP1 served as loading controls and cytosolic and nuclear markers, respectively.
Figure 2
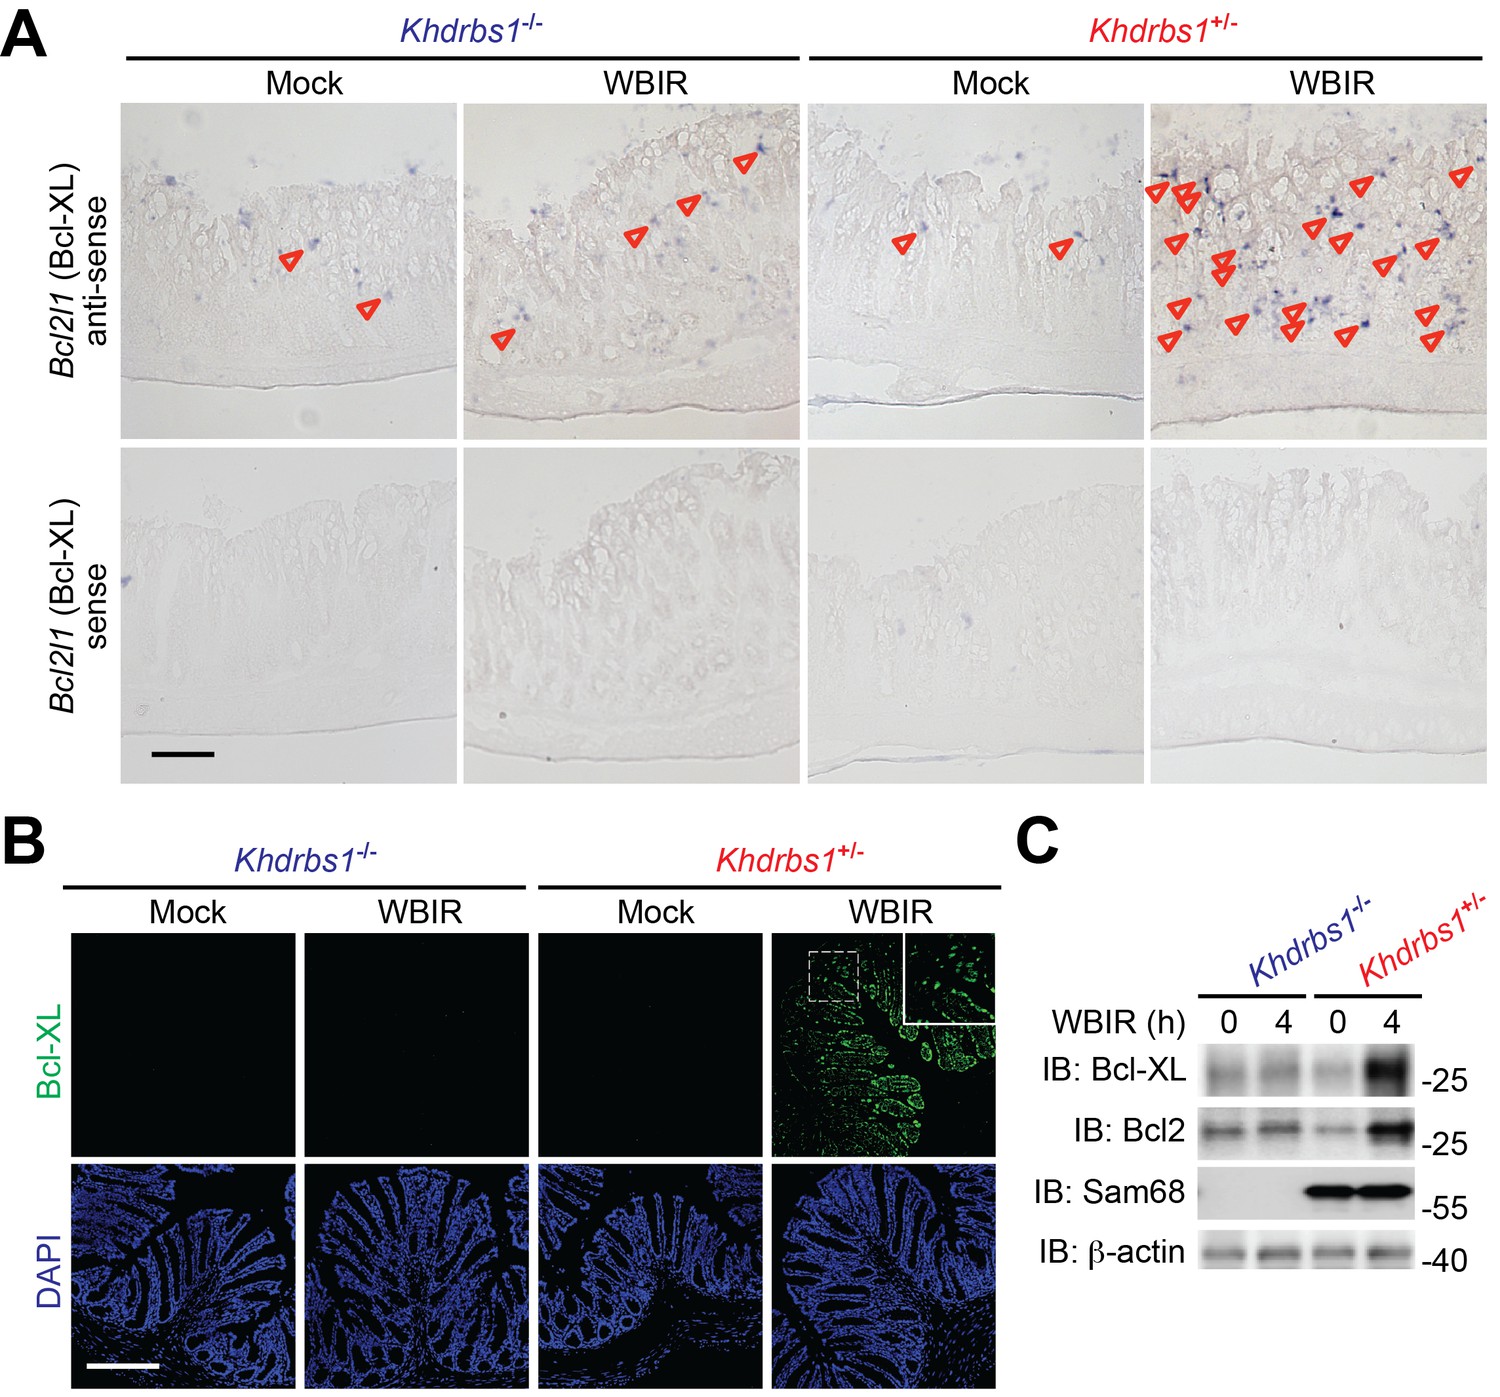
Sam68 is pivotal for NF-κB-mediated anti-apoptotic gene expression in the γ-irradiated colon.
(A) Colon tissue sections derived from Khdrbs1+/− and Khdrbs1−/− mice at 4 hr post whole body γ-irradiation (WBIR) or mock irradiation were stained by in situ hybridization with in vitro synthesized anti-sense probe targeting Bcl2l1 mRNA (purple dots as indicated by triangles), with Bcl2l1 mRNA sense probe as a negative control. Scale bar, 100 μm. (B) Immunofluorescence micrographs of Bcl-XL (encoded by Bcl2l1) in colon tissue collected from mice treated as in (A), with nuclei counterstained by DAPI. Scale bar, 200 μm. (C) Colon epithelial cells were isolated from mice treated as in (A) and whole cell lysates were derived and immunoblotted (IB) for indicated proteins, with β-actin as a loading control.
Figure 3
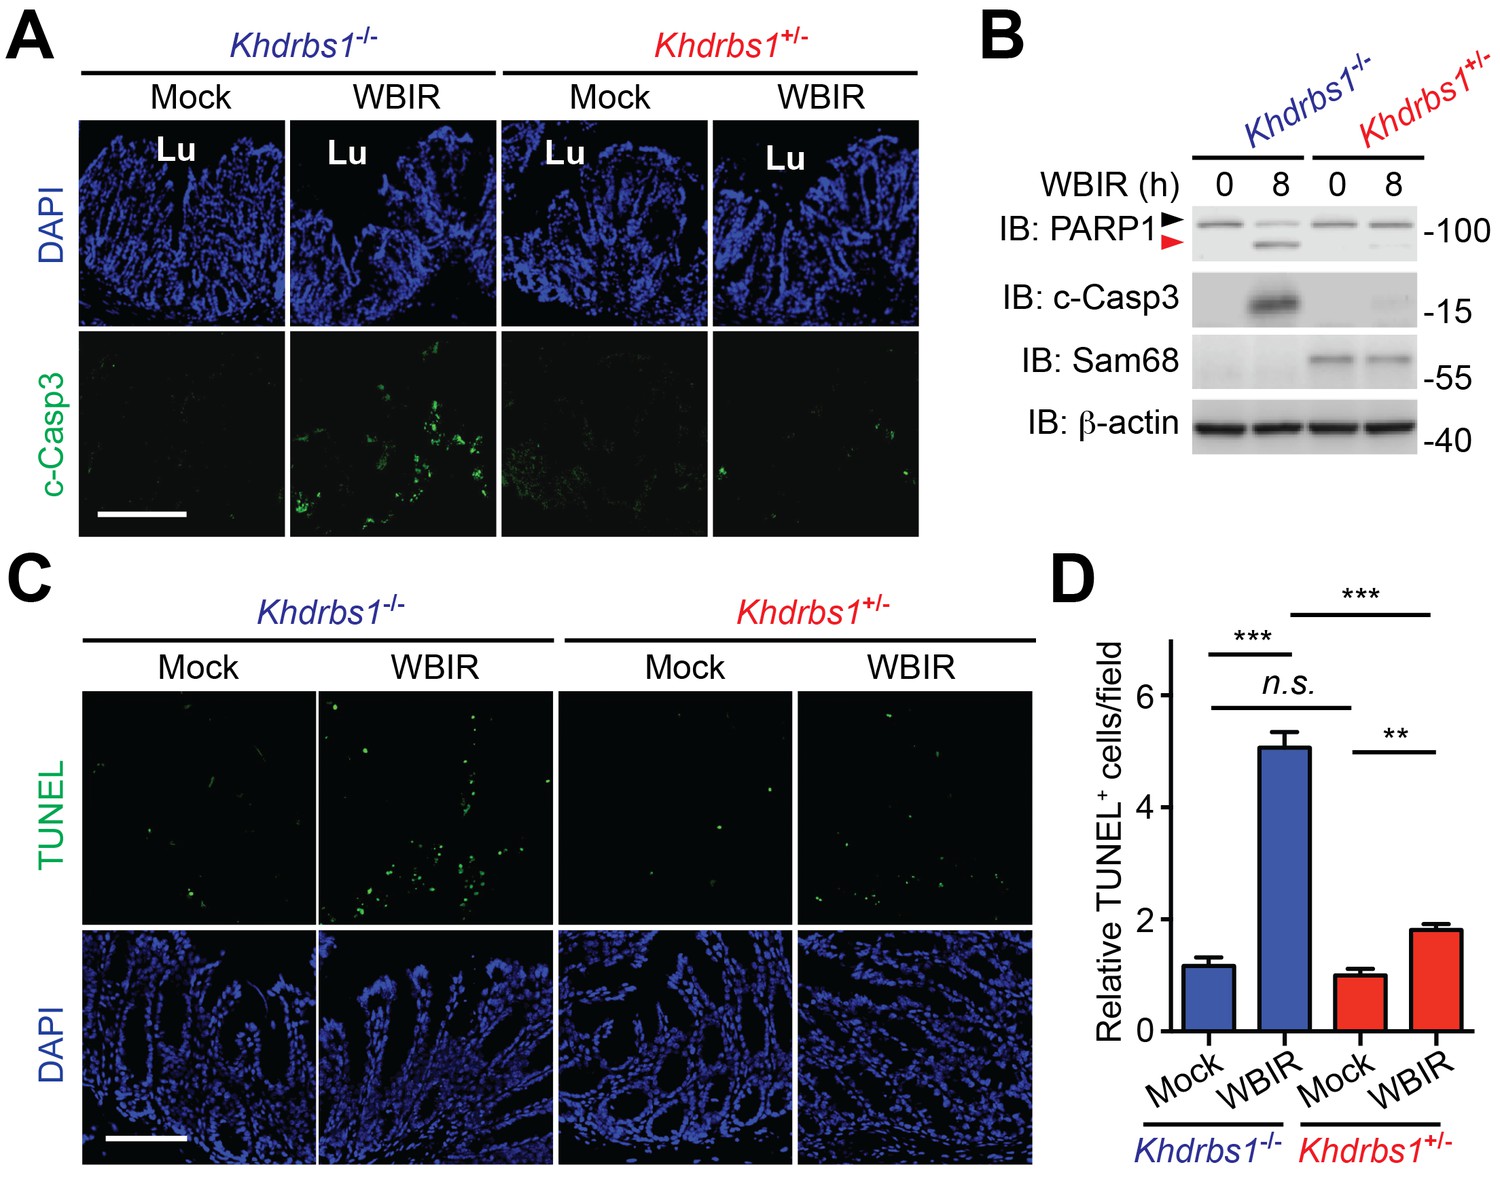
Sam68 deletion sensitizes colon epithelial cells to undergo apoptosis in the γ-irradiated mice.
(A) Immunofluorescence micrographs of cleaved Caspase-3 (c-Casp3) in colon tissue collected from Khdrbs1+/− and Khdrbs1−/− mice at 8 hr post whole body γ-irradiation (WBIR) or mock irradiation, with nuclei counterstained by DAPI. Lu, lumen; Scale bar, 200 μm. (B) Colon epithelial cells were isolated from mice treated as in (A) and whole cell lysates were derived and immunoblotted (IB) for indicated proteins, with β-actin as a loading control. The full-length and cleaved PARP1 are indicated by a black triangle and a red triangle, respectively. (C) Micrographs of TUNEL staining in colon tissue collected from mice treated as in (A), with nuclei counterstained by DAPI. Scale bar, 100 μm. (D) Relative cells with TUNEL staining from four random fields, as in (C), were quantified. Data are representative of at least two independent experiments. Results in (D) are expressed as mean and s.e.m. n.s., non-significant difference and **p<0.01, ***p<0.001 by Student’s t tests.
Figure 4
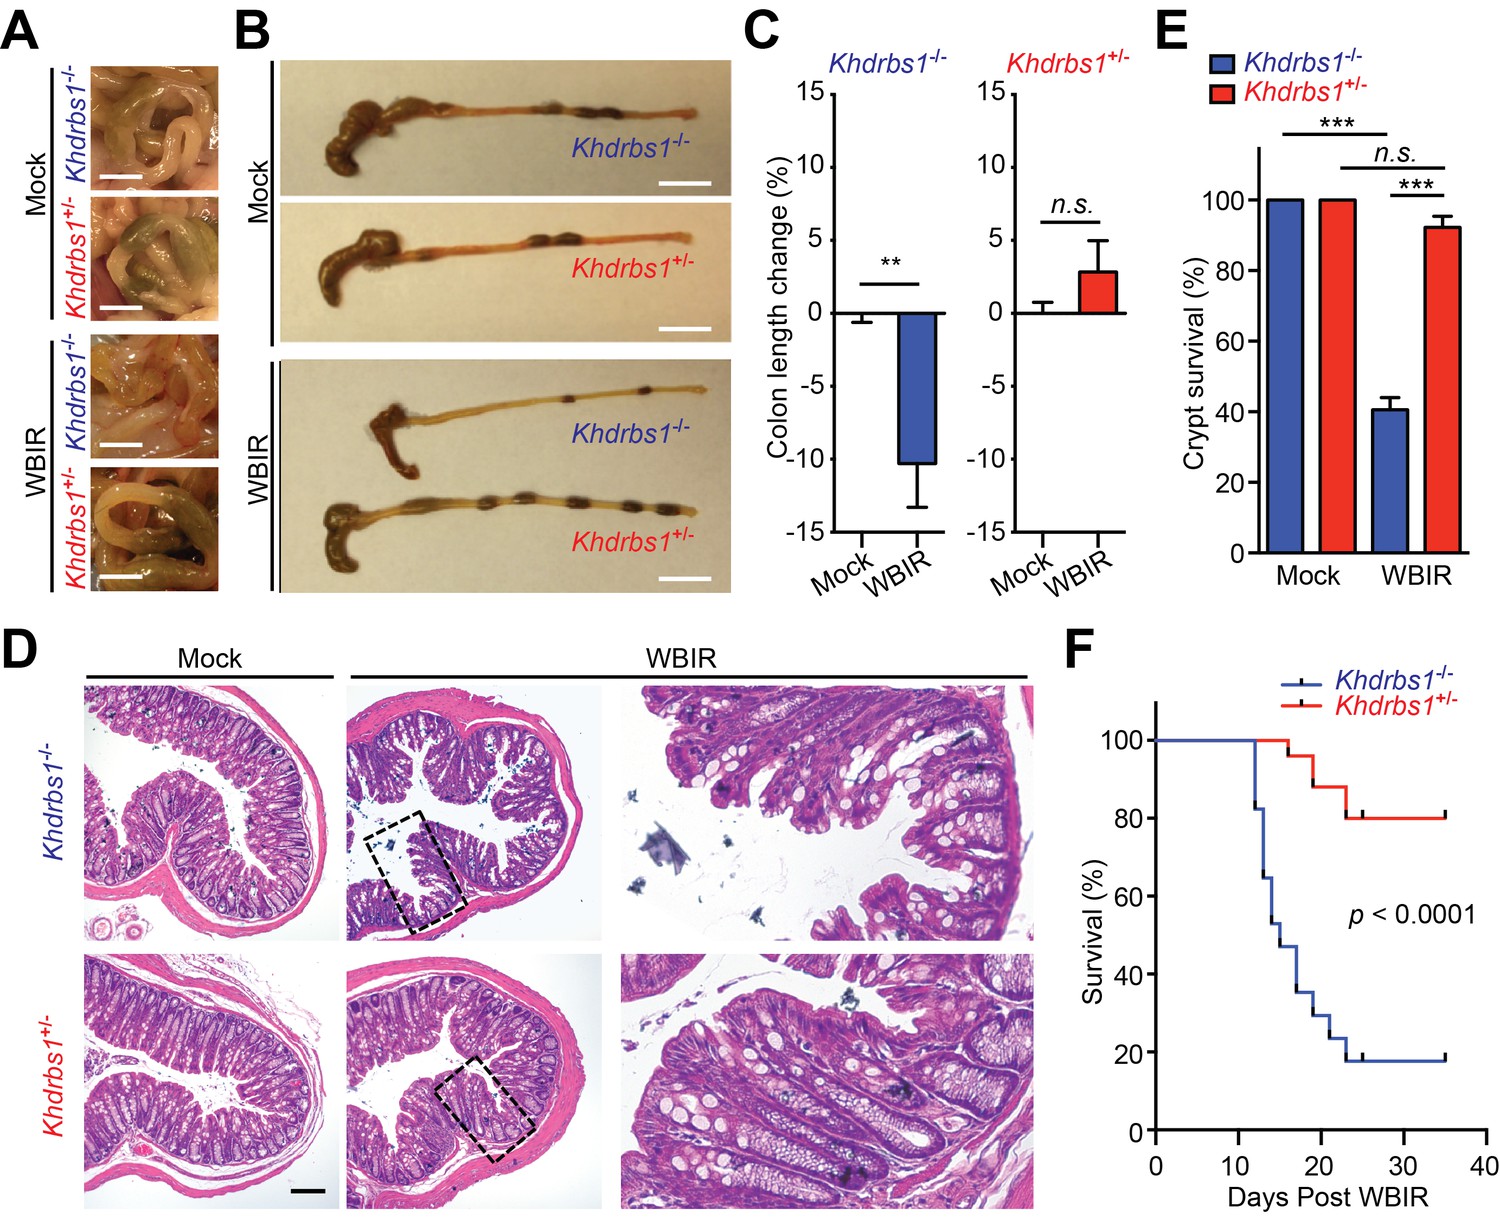
Sam68 is essential for the NF-κB-mediated radioprotection in vivo.
(A and B) Representative photographs of colons in (A) and collected from (B) Khdrbs1+/− and Khdrbs1−/− mice at 14 days post whole body γ-irradiation (WBIR) or mock irradiation. Scale bars, 5 mm (A) and 1 cm (B), respectively. (C) The length changes in the colons derived from Khdrbs1+/− (n = 3) and Khdrbs1−/− (n = 3) mice at 14 days post WBIR or mock-irradiation, normalized to mock-irradiated controls. (D) Hematoxylin and eosin staining of colon tissue sections collected from mice treated as in (A). Scale bar, 100 μm. (E) Percentage of crypt survival in (D) was quantified. (F) Kaplan-Meier analysis of the survival rate in Khdrbs1+/− (n = 25) and Khdrbs1−/− (n = 17) mice following WBIR. p<0.0001 by Gehan-Breslow-Wilcoxon test. Results in (C and E) are expressed as mean and s.e.m. n.s., non-significant difference and **p<0.01, ***p<0.001 by Student’s t tests.
Download links
A two-part list of links to download the article, or parts of the article, in various formats.
Downloads (link to download the article as PDF)
Open citations (links to open the citations from this article in various online reference manager services)
Cite this article (links to download the citations from this article in formats compatible with various reference manager tools)
Sam68/KHDRBS1-dependent NF-κB activation confers radioprotection to the colon epithelium in γ-irradiated mice
eLife 5:e21957.
https://doi.org/10.7554/eLife.21957


