Operon mRNAs are organized into ORF-centric structures that predict translation efficiency
- University of California, San Francisco, United States
- Howard Hughes Medical Institute, University of California, San Francisco, United States
Figures
Figure 1

DMS-seq effectively probes RNA structures in E. coli.
(A) Schematic for obtaining mRNA structure and translation efficiency using DMS-seq, mRNA-seq, and ribosome profiling from the same sample. (B) Plot showing the effect of DMS-seq read coverage on the reproducibility of structure determination. X-axis: DMS-seq read depth cutoff (reads/nucleotide); Y-axis: median of Pearson’s R values calculated by comparing two replicates of in vivo DMS-seq signals of the first 200nt of ORFs passing the DMS-seq depth cutoff indicated in X-axis. A read coverage of ~15 reads/nucleotide is sufficient for reproducible structure determination. (C) Receiver operating characteristic (ROC) curve on the in vivo DMS-seq signals for A and C bases in the 16S rRNA using the E.coli ribosome crystal structure (Zhang et al., 2009) as a model. True positives are defined as bases that are both unpaired and solvent-accessible, and true negatives are bases that are paired. The total number of evaluated A/C bases is 438. Signal threshold of 0.2 has 90% agreement with the crystal structure. (D) Structural prediction for rimM. The predicted rimM structure is based on a minimum free-energy prediction constrained by our DMS-seq measurements, using the same 0.2 threshold used for the 16S rRNA in (B), which agrees with the rimM structure proposed and mutationally verified in Wikström et al. (1992). The DMS-seq signal across rimM is shown below the structure. The color bar indicates the intensity of the DMS-seq signal at each position. (E) Calculation of the Gini index from the DMS-seq signal is indicated schematically by comparing highly structured regions to less structured regions. For a region of mRNA, the cumulative fraction of the total DMS-seq signal is plotted against the cumulative fraction of the total number of positions as a Lorenz Curve. The extent to which the curve sags below the diagonal indicates the degree of inequality of distribution, which is quantified by the Gini index defined as the ratio of the area between the diagonal line and the Lorenz Curve (a) to the area below the diagonal line (a + b). A high Gini index indicates high level of mRNA structure, and vice versa. (F) Histogram of Gini indices of E. coli ORFs calculated from in vivo DMS-seq data at 37°C. All ORFs selected have ≥15 DMS-seq reads/nt (N = 1116). The Gini index of 16S rRNA and rimM, and the mean of Gini indices of in vitro heat-denatured mRNAs at 95°C are indicated.
Figure 2 with 1 supplement
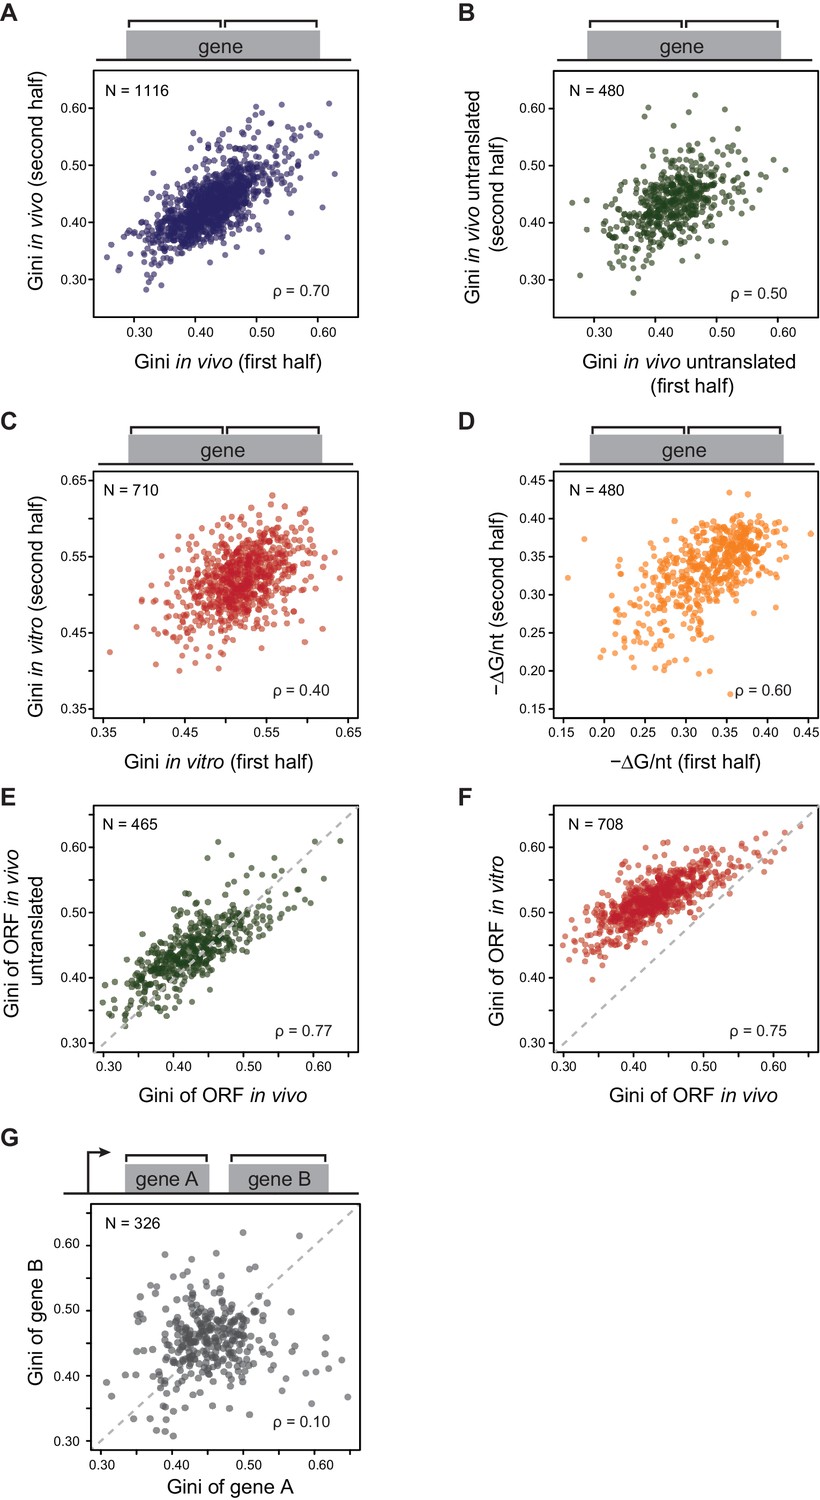
E. coli mRNAs have intrinsic ORF-wide secondary structures.
(A–C) Plots comparing the Gini indices of the first half of the ORF against those of the second half of the ORF for: A. in vivo modified mRNA from cells growing at 37°C; B. in vivo modified mRNA from cells treated with kasugamycin (ksg) at 37°C (no translating ribosomes); C. in vitro mRNA modified at 37°C. In this and all subsequent figures, analysis is performed only on those ORFs with ≥15 DMS-seq reads per nucleotide, with N (the number of ORFs analyzed in each condition), and ρ (the Spearman's rank correlation coefficient) indicated. The ksg-treated sample has fewer ORFs passing the ≥15 DMS-seq reads/nt filter, likely due to mRNA degradation when translation is eliminated. Data calculated using different sets of ORFs are summarized in Supplementary file 1–3. (D) Plot comparing the computationally predicted mRNA structure (- minimum free energy / nucleotide or -ΔG/nt) of the first half of the ORF against that of the second half of the ORF for the 480 ORFs in the ksg-treated DMS-seq dataset. (E) Correlation between Gini indices of the entire ORF calculated from in vivo mRNA vs in vivo untranslated mRNA (ksg-treated cells) for the 465 ORFs in both datasets. The dashed grey line represents the y = x diagonal line. (F) Correlation between Gini indices of the entire ORF calculated from in vivo mRNA vs in vitro refolded mRNA for the 708 ORFs shared in both datasets. (G) Plot comparing Gini indices for adjacent ORFs in operons (N = 326; see Materials and methods for details). The dashed grey line represents the y = x diagonal line.
Figure 2—figure supplement 1
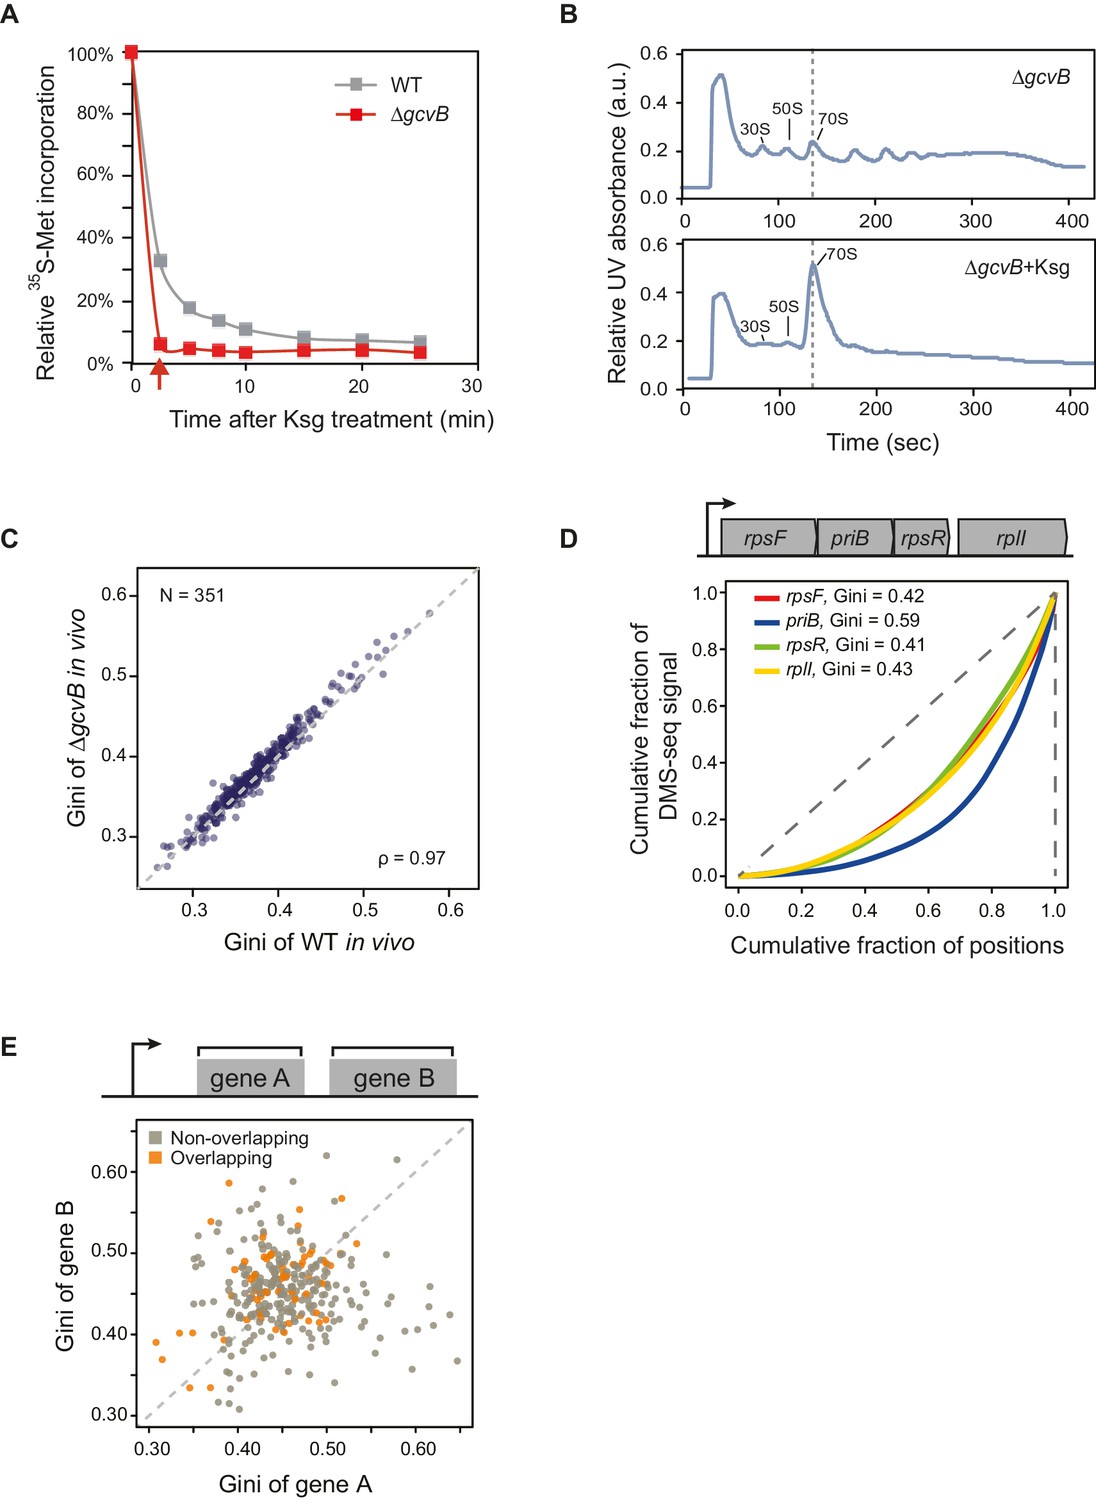
mRNA structure is organized around open reading frames.
(A) Relative 35S-methionine incorporation of WT and ΔgcvB cells after treatment of kasugamycin at 37°C, normalized against the total incorporated radioactivity measured immediately before treatment (t = 0). The relative translation decreases to 6% in ΔgcvB cells after 2-min treatment. This is the time-point used for probing mRNA structure without the majority of translating ribosomes in vivo. (B) Sucrose gradient analysis showing the polysome run-off in ΔgcvB cells after 2 min of kasugamycin (ksg) treatment at 37°C. X-axis: elution time of different fractions of sucrose gradient. Y-axis: relative UV absorbance. Monosome enrichment after ksg treatment was previously seen (Kaberdina et al., 2009). (C) Comparison of Gini indices of entire ORF bodies in WT and ΔgcvB cells indicates that ∆gcvB does not affect global mRNA structure. The 351 ORFs in common between WT and ΔgcvB cells were analyzed. (D) Lorenz curves calculated from in vivo DMS-seq data of ORFs in the rpsF-priB-rpsR-rplI operon. Gini indices of ORFs calculated from the Lorenz curves are indicated. (E) Scatter plot comparing Gini indices of adjacent non-overlapping (N = 253) and overlapping (N = 73) ORFs within operons. Overlapping ORFs are ORF pairs for which the annotated stop codon of the upstream ORF overlaps or is 3’ of the start codon of the downstream ORF. The dashed grey line represents the y = x diagonal line.
Figure 3 with 1 supplement
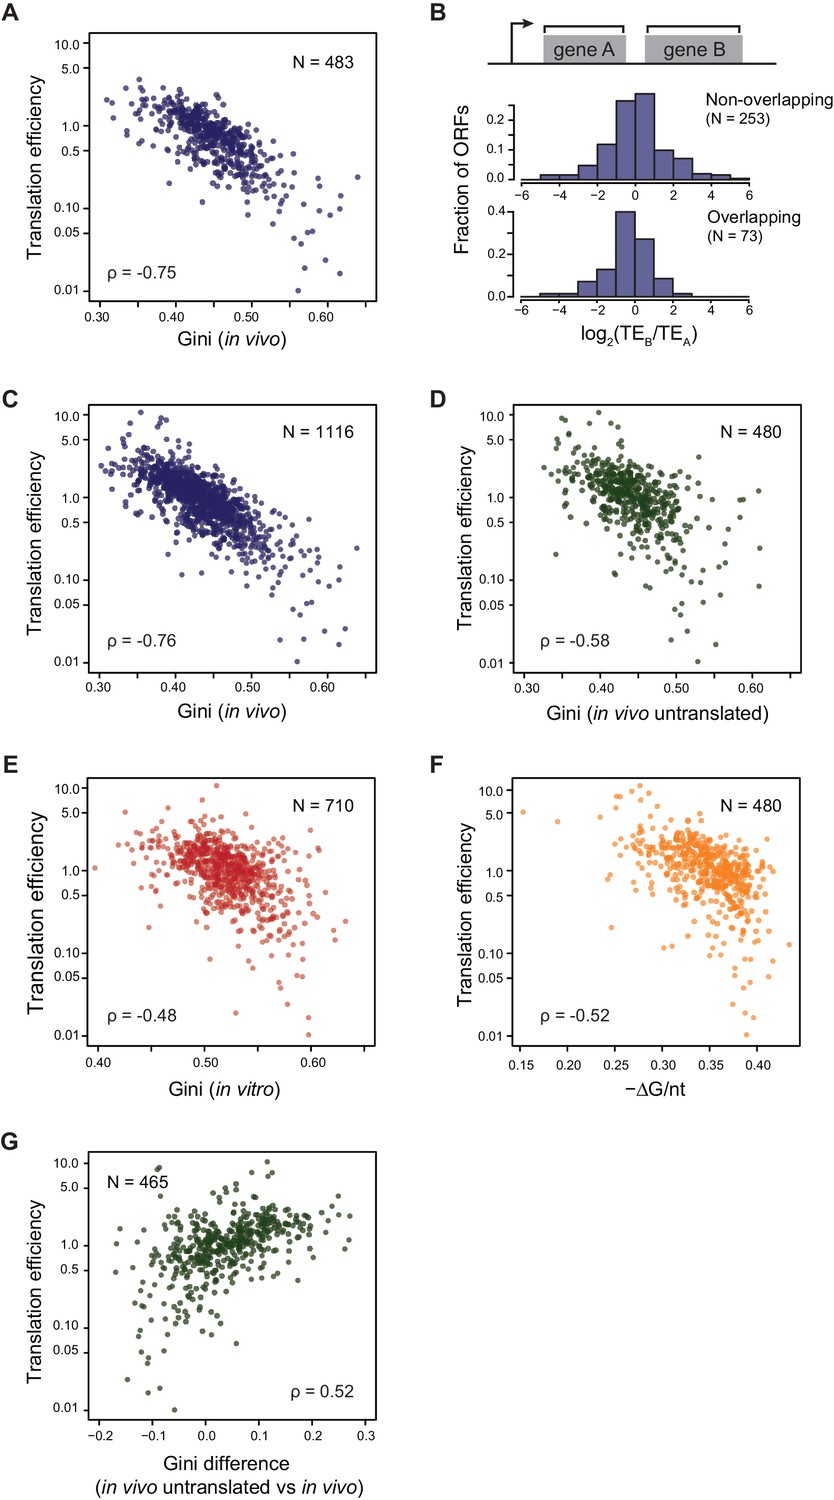
Translational efficiency (TE) is highly correlated with ORF mRNA structure.
(A) Plots comparing the Gini indices of ORFs in polycistronic operons calculated from in vivo DMS-seq to their TEs (N = 483). (B) Histograms of TE ratios between adjacent non-overlapping (N = 253) or overlapping (N = 73) ORFs in operons (see Materials and methods for details). Overlapping ORFs are ORF pairs for which the annotated stop codon of the upstream ORF overlaps or is 3’ of the start codon of the downstream ORF. (C–E) Plots comparing the Gini indices of endogenous ORF mRNAs calculated from DMS-seq data of: C. in vivo RNA; D. in vivo RNA with no translating ribosomes (Ksg treated cells); E. in vitro modified refolded mRNA, to their TEs. For this and all subsequent panels, data calculated using different sets of ORFs are summarized in Supplementary file 1–3. (F) Plot comparing computationally predicted mRNA structure (- minimum free energy / nucleotide; -ΔG/nt) of the entire ORF body to TE. (G) Plots of the difference in the Gini index between untranslated (ksg-treated) and translated in vivo mRNA against their TE for the 465 ORFs in both datasets. X-axis: Gini index (in vivo untranslated) – Gini index (in vivo), normalized by the average of the two.
Figure 3—figure supplement 1
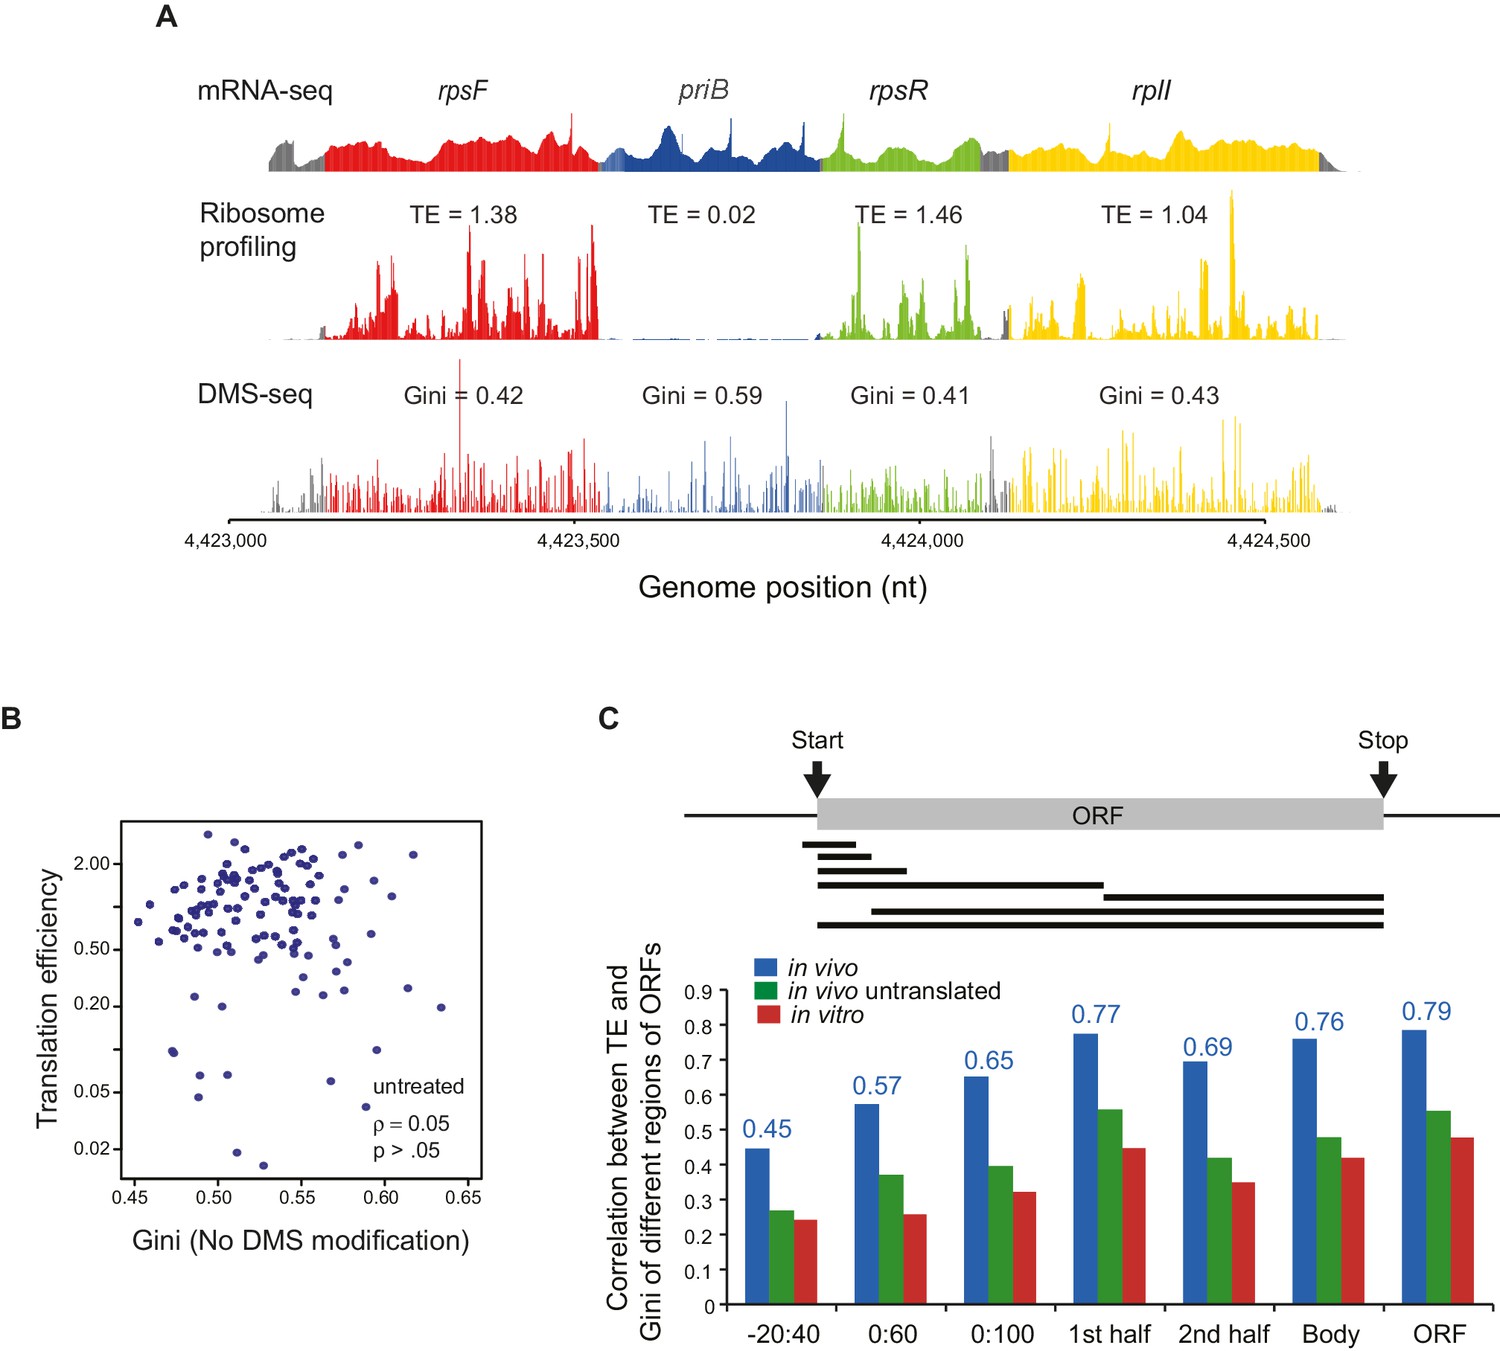
Correlation between the mRNA structural level and translation efficiency.
(A) An example showing the results of mRNA-seq, ribosome profiling and DMS-seq of the rpsF-priB-rpsR-rplI operon, with translation efficiency (TE) and Gini index of each ORF indicated. (B) Plot of Gini index of unmodified mRNA (using the DMS sequencing library preparation protocol but without DMS treatment) calculated across the entire ORF body against TE. (C) Bar plot comparing the absolute value of Spearman’s rank correlation coefficient (ρ) between TE and mRNA structure of different portions of ORF mRNAs in vivo (blue), in vivo no ribosome (ksg-treated; green) and in vitro (red). The portions of ORFs analyzed are shown schematically with the black bars underneath the ORF. The actual correlation between TE and in vivo ORF-wide RNA structure is indicated.
Figure 4 with 2 supplements
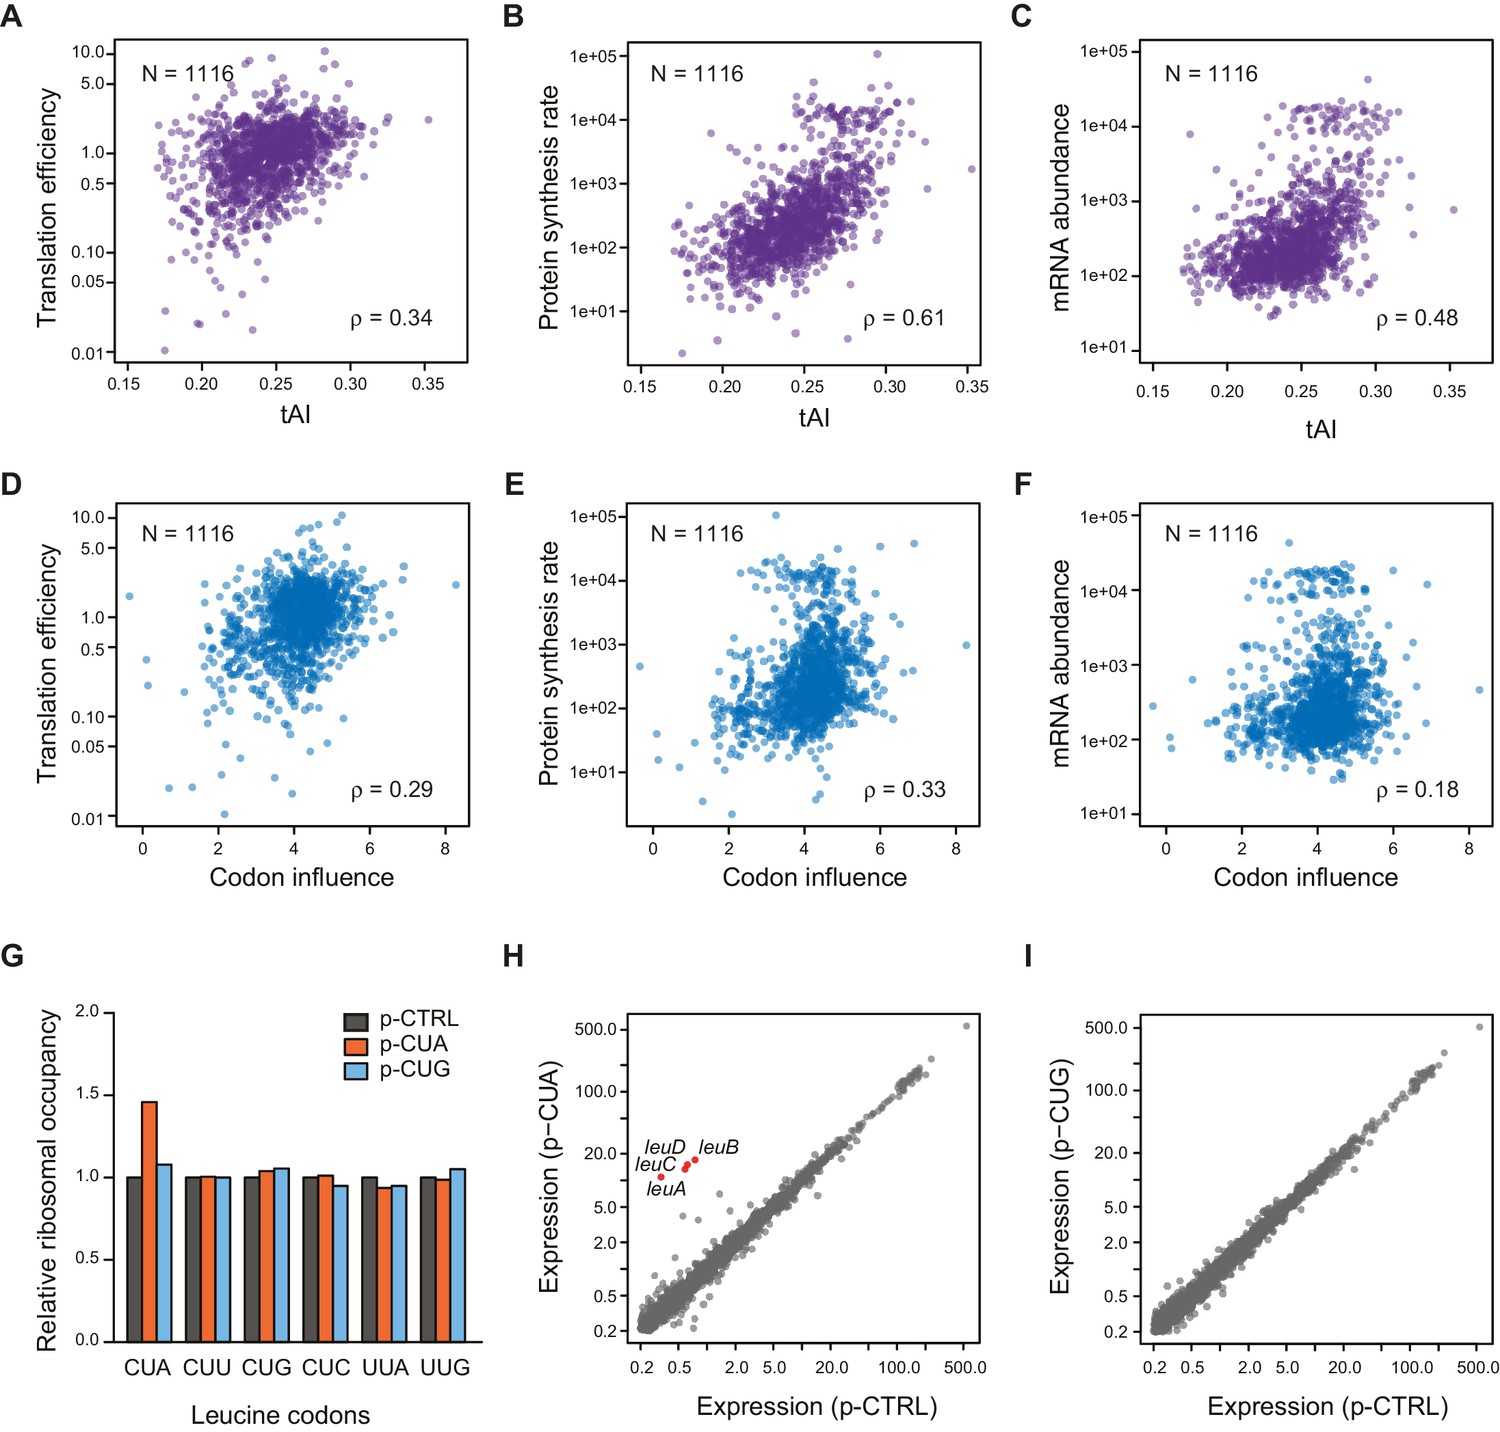
Correlation of Other mRNA features with TE.
(A–C) Plots comparing tAI (tRNA adaptation index) of the entire ORF against: A. translation efficiency (TE, protein synthesis rate per mRNA); B. protein synthesis rate (average ribosome footprint density); C. mRNA abundance (RPKM mRNA sequencing) of the ORF. For this and the following panels of this figure, the 1116 ORFs in the in vivo RNA DMS-seq dataset are analyzed (Supplementary file 1). (D–F) Plots comparing codon influence across the entire ORF defined from overexpressing exogenous genes (Boël et al., 2016) against: D. translation efficiency; E. protein synthesis rate; F. mRNA abundance of the ORF. (G) Average ribosome occupancy at leucine codons in endogeneous genes when overexpressing a control plasmid (p-CTRL without a mini ORF) or plasmids with a heterologous CUA mini-ORF (p-CUA) or a CUG mini-ORF (p-CUG). The ribosome occupancy at each leucine codon was normalized by the average ribosome density of the ORF. The relative ribosome occupancy of that specific leucine codon was averaged across ORFs and normalized to that of the cells with control plasmid. (H–I) Gene expression changes with the control plasmid and heterologous overexpression of CUA codon mini-ORF (H) or CUG codon mini-ORF (I). The average ribosome footprint density of individual genes (see Materials and methods for details) was plotted in log2 scale.
-
Figure 4—source data 1
Linear regression model to predict TE based on different mRNA features.
A multiple linear regression model is applied to predict TE based on the following features: mRNA structure level of various portions of the ORF, codon usage predicted by tAI (dos Reis et al., 2004; Tuller et al., 2010), codon influence metric (Boël et al., 2016), and the strength of Shine-Dalgarno sequence (using the RBS Calculator established by Salis et al from https://github.com/hsalis/Ribosome-Binding-Site-Calculator-v1.0). (A) Comparison between the experimentally measured TE and the model-predicted TE. The red dashed line indicates the y = x diagonal line. (B) Relative contribution of the factors in predicting TE, calculated from stepwise regression. Y-axis: R2 of different models with stepwise addition of individual factors. Asterisks indicate significant improvement of model (based on ANOVA, with significance codes: 0 ‘***’ 0.001 ‘**’ 0.01 ‘*’ 0.05).
- https://doi.org/10.7554/eLife.22037.009
Figure 4—figure supplement 1
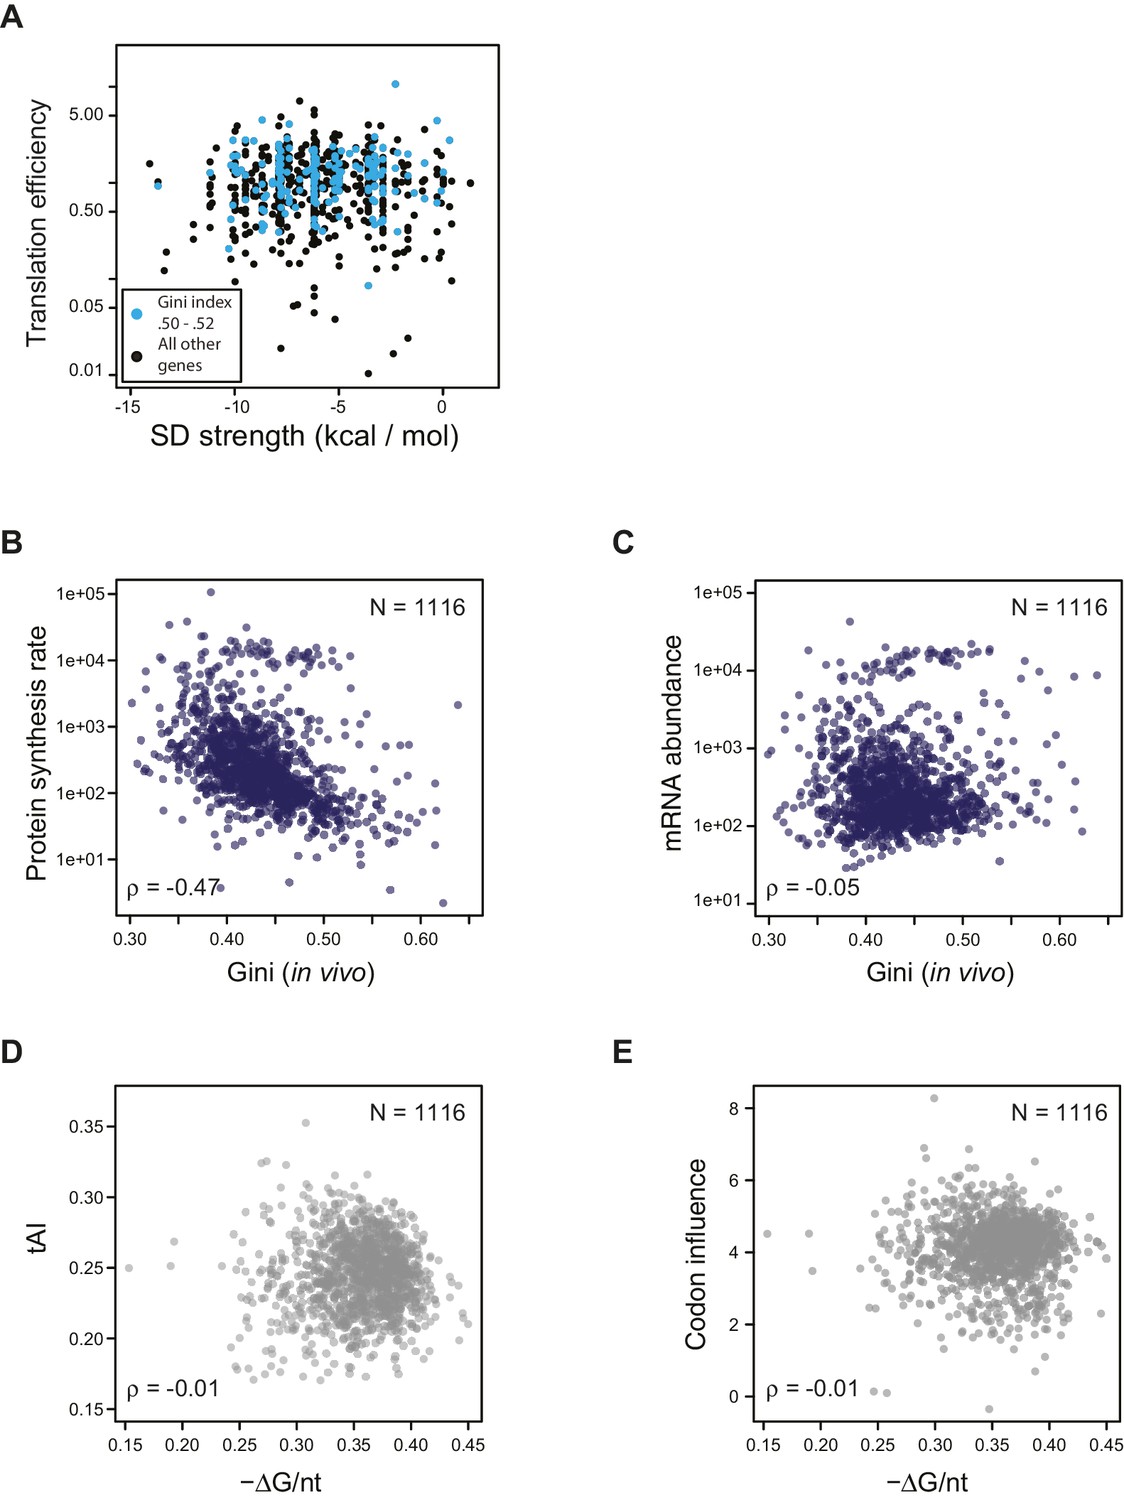
Effect of SD strength, tAI, and codon influence on predicting TE of endogenous genes.
(A) Plot of predicted Shine-Dalgarno strength (see Materials and methods) against in vivo translation efficiency. Genes with Gini indices in a tight range (0.5–0.52) are indicated in cyan. (B–C) Plot comparing Gini indices of ORFs of in vivo mRNA against: B. protein synthesis rate (average ribosome footprint density); C. mRNA abundance (RPKM mRNA sequencing) of ORFs. For this and the following panels of this figure the 1116 ORFs in the in vivo RNA DMS-seq dataset are analyzed (Supplementary file 1). (D–E) Plots of computationally predicted mRNA structure (-minimum free folding energy per nucleotide) against: D. tAI (tRNA adaptation index); E. codon influence across the entire ORF body defined from overexpressing exogenous genes (Boël et al., 2016).
Figure 4—figure supplement 2
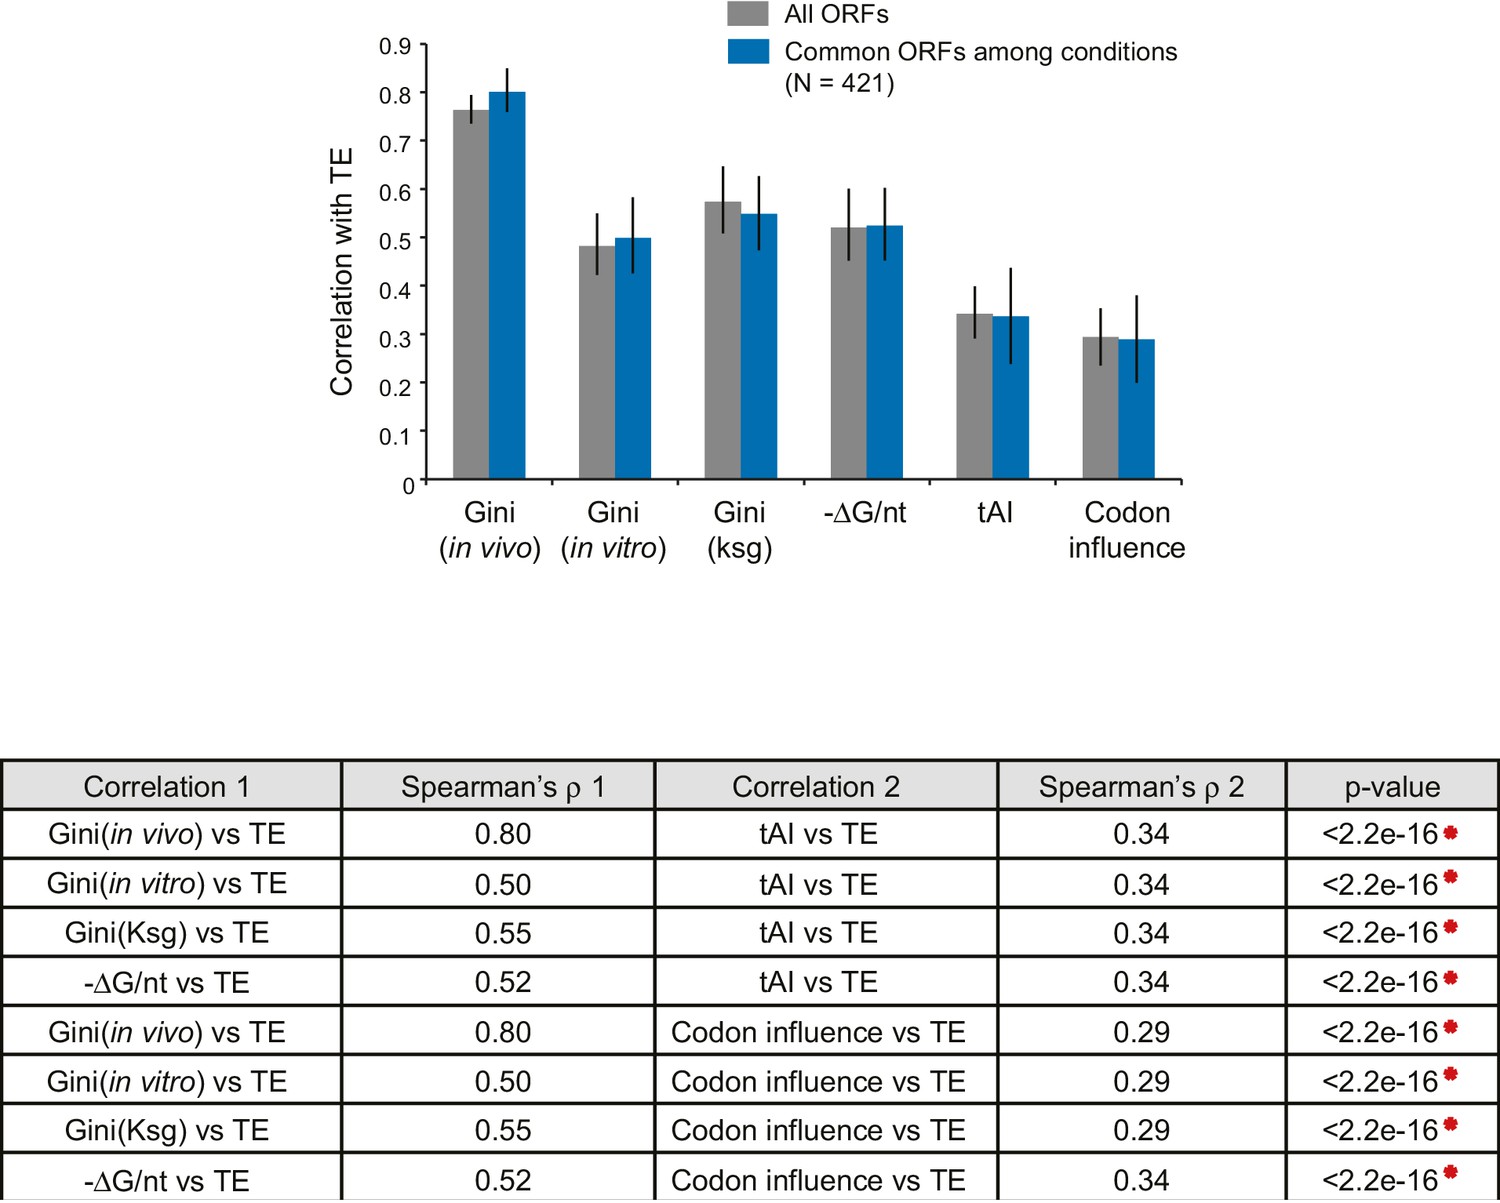
Comparison of the relative significance of different mRNA features in predicting TE.
Top: Bar plot comparing the absolute values of Spearman’s rank correlation coefficient (ρ) in various conditions with Gini indices of the dataset for each condition (gray bars), or for the 421 ORFs present in all three datasets (blue bars). Error bars indicate the 95% confidence intervals estimated from the bootstrapping distribution of the correlation coefficients (replicate number = 1000). Data calculated using 421 common ORFs among conditions are summarized in Supplementary file 4. Bottom: The table shows comparisons between the absolute values of Spearman’s ρ values for pairwise features for the dataset comprised of the 421 ORFs (blue bars above). p-values were calculated from the K-S test comparing two bootstrapping distributions of ρ.
Figure 5 with 1 supplement
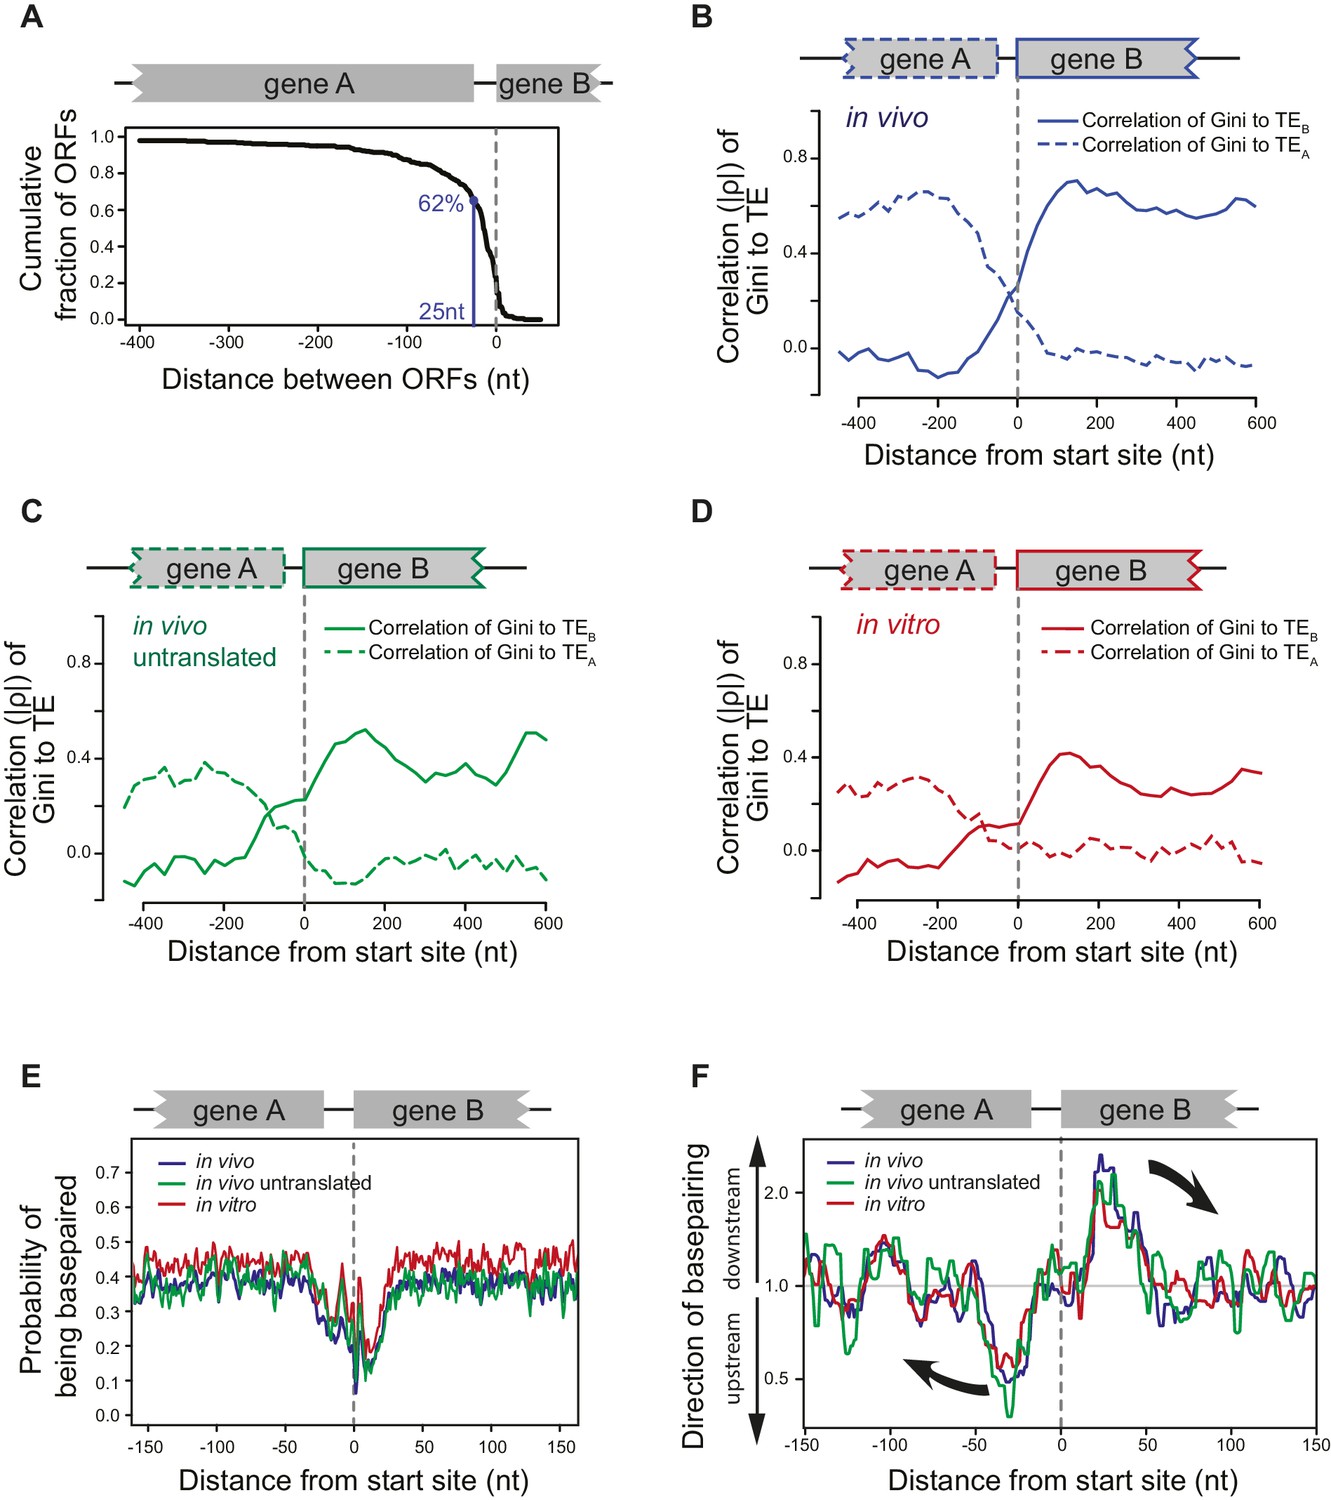
ORFs are isolated from each other by forming ORF-specific RNA structures.
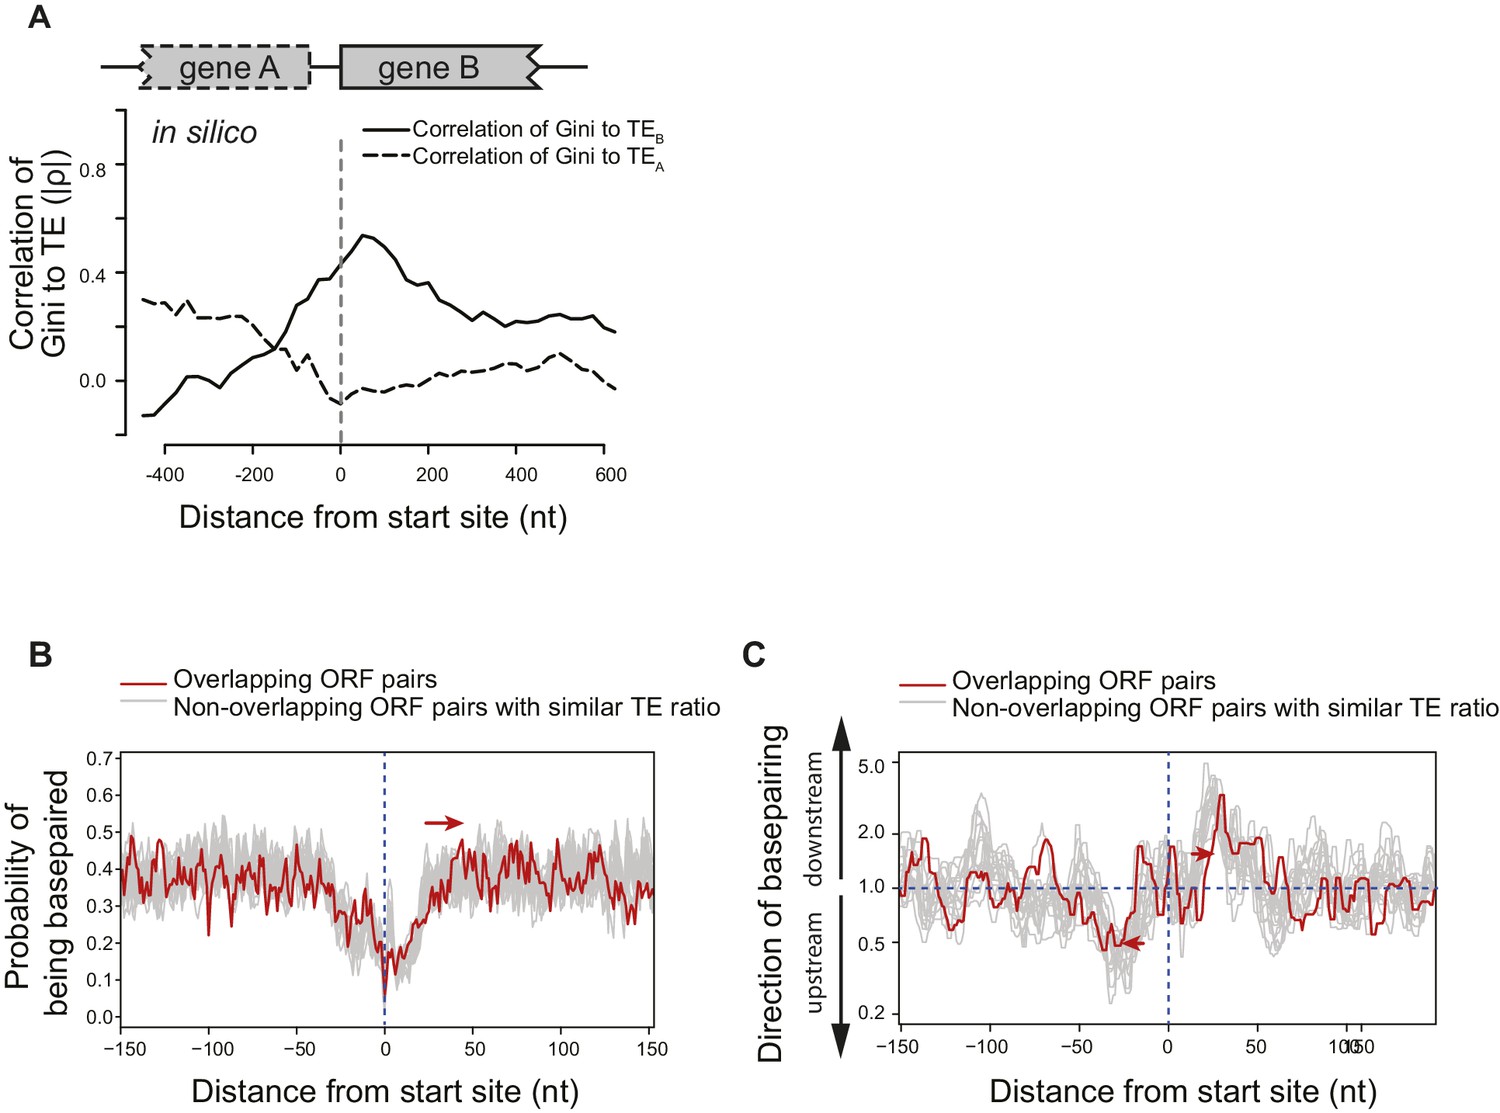
(A) Cumulative distribution of spacing between adjacent ORFs within operons of E. coli. X-axis: distance from 3’ of the stop codon of upstream genes (gene A) to 5’ of the start codon of downstream genes (gene B). (B–D) Correlation between local mRNA structure quantified by Gini index and TE of adjacent ORFs in the same operon. X-axis: distance from the 5’ of start codon of downstream ORFs (gene B). Y-axis: the absolute value of correlation (Spearman’s ρ) of local Gini indices, calculated from DMS-seq of in vivo mRNA (B), in vivo untranslated mRNA (ksg-treated) (C) or in vitro modified mRNA (D), against TE of the upstream (gene A; dashed line) or the downstream (gene B; solid line) gene. Gini indices were calculated within 300 nt windows scanning across the boundary between adjacent ORFs within operons. The correlation to TE is plotted at the center of each 300 nt window. (E) Meta-gene analysis of mRNA structure in the vicinity of translation initiation sites. Structure was predicted by applying the DMS-seq constrained minimum free-energy model calculated from in vivo mRNA (blue), in vivo untranslated mRNA (ksg-treated; green) or in vitro modified mRNA (red). Mean predicted base-pairing probability of each nucleotide (averaged across genes) was plotted across the boundary between adjacent ORFs within operons. (F) Plot of directionality of RNA folding at ORF boundaries. At each position, the probability of base pairing with every other position was calculated for each ORF examined. The average sum probability of base-pairing with any nucleotide in a 60 nt window upstream and in a 60 nt window downstream was calculated. Y-axis: the ratio of the downstream base-pairing probability to the upstream base-pairing probability at each position (X-axis). The black arrows indicate preferential folding direction.
Figure 5—figure supplement 1
Structural isolation between mRNA of adjacent ORFs on the same operons.
(A) The absolute value of correlation (Spearman's ρ) between computationally predicted local mRNA structure at the ORF boundary, quantified by predicted ∆G of minimum free-energy structure, and the in vivo TE of the upstream or downstream ORF. ∆G index was calculated for 300 nt windows that scan gene bodies, using genes that extend through the 300 nt window being examined, and is plotted at the center of each window. (B) Meta-gene analysis of mRNA structure in the vicinity of translation initiation sites at the boundary of overlapping (red) or non-overlapping (grey) ORF pairs. Subsets of non-overlapping ORF pairs with the same number as overlapping ORF pairs were selected to make the TE ratio between adjacent ORFs indistinguishable between overlapping and selected non-overlapping ORF pairs. 20 random selections past the criteria were plotted in gray. For each time, mRNA structure was predicted by applying the in vivo DMS-seq constrained minimum free-energy model. Mean predicted base-pairing probability of each nucleotide was plotted across the boundary between adjacent ORFs within operons. Red arrow indicates a downstream shift of low base-pairing region due to ORF overlapping. (C) Plot of directionality of RNA folding at overlapping (red) or non-overlapping (grey) ORF boundaries. Subsets of non-overlapping ORF pairs were selected as for (B). At each position, the probability of base pairing with every other position was calculated for each ORF examined. The average sum probability of base-pairing with any nucleotide in a 60 nt window upstream and in a 60 nt window downstream was calculated. Y-axis: the ratio of the downstream base-pairing probability to the upstream base-pairing probability at each position (X-axis). The red arrows suggest that between overlapping ORFs, the mRNA folding insulation at ORF boundaries may be weaker and also shifted (due to ORF overlapping) compared to non-overlapping ORFs.
Figure 6 with 1 supplement
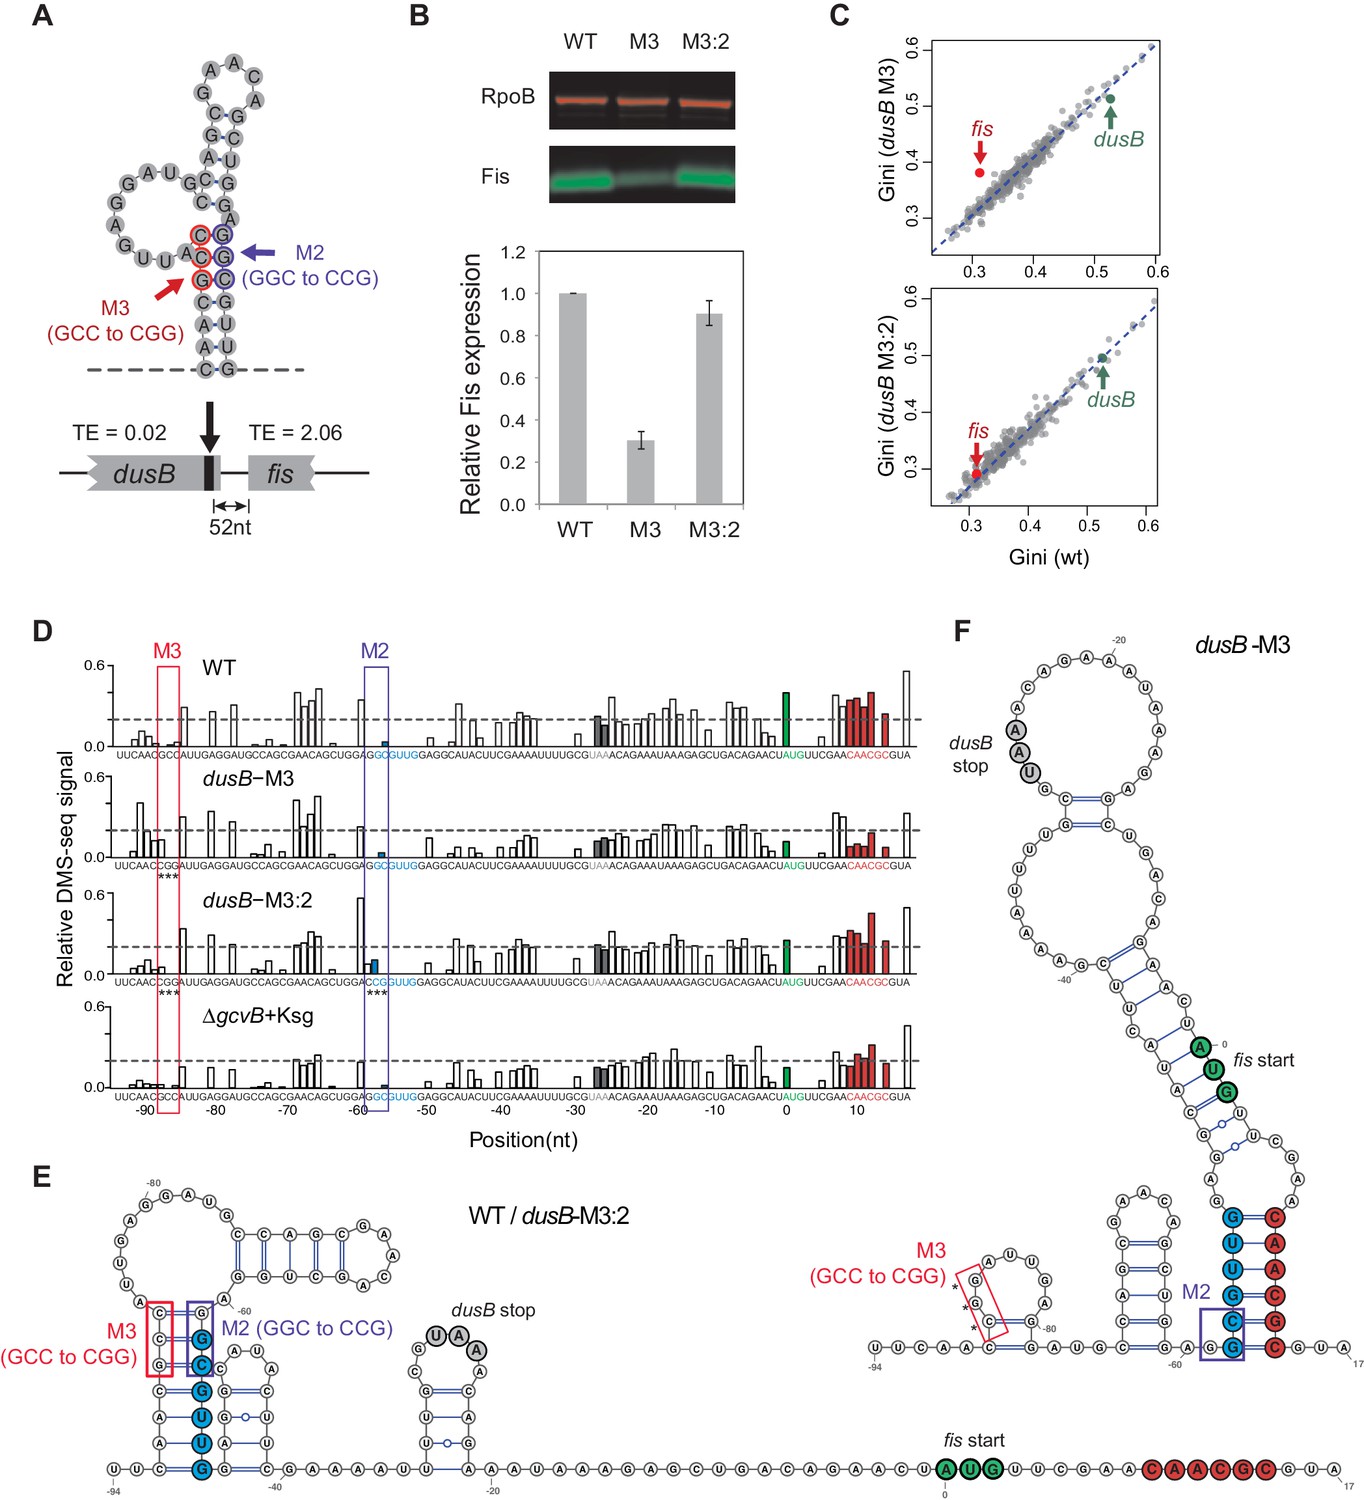
Disruption of structural isolation between dusB and fis affects fis translation.
(A) mRNA structure at the 3’ end of dusB, with mutations M3 and M2 indicated. Translation efficiencies (TEs) of dusB and fis in WT cells are 0.02 and 2.06, respectively. (B) The dusB-M3 mutation decreases Fis expression and is rescued by the complementary M2 mutation. Western blot compares Fis protein amounts in WT, dusB-M3 and dusB-M3:2 double mutant cells, with RpoB protein as an internal control. (C) Scatter plots comparing Gini indices of ORFs in WT cells to those in dusB-M3 or in dusB-M3:2 double mutant cells. Outlier test: fis, Bonferonni p-value=1.02e−05 (dusB-M3); p-value>0.05 (dusB-M3:2). (D) Normalized DMS-seq signals at the dusB-fis boundary region from different samples as indicated. Positions of M3 and M2 are highlighted, with asterisks indicating mutated nucleotides. X-axis: distance from 5’ end of the fis start codon. Y-axis: normalized DMS-seq signals. Dashed line: threshold (0.2) above which the A/C bases are predicted to be unpaired (see Materials and methods). (E) mRNA structure at the dusB-fis boundary region of WT or dusB-M3:2 cells, predicated by constraining a minimum free-energy model with DMS-seq measurements. Locations of mutations M3 and M2 are as indicated. (F) mRNA structure at the dusB-fis boundary region of dusB-M3 mutant cells, predicated by constraining a minimum free-energy model with DMS-seq measurements. CGG residues labeled with asterisks indicate the M3 mutation.
Figure 6—figure supplement 1
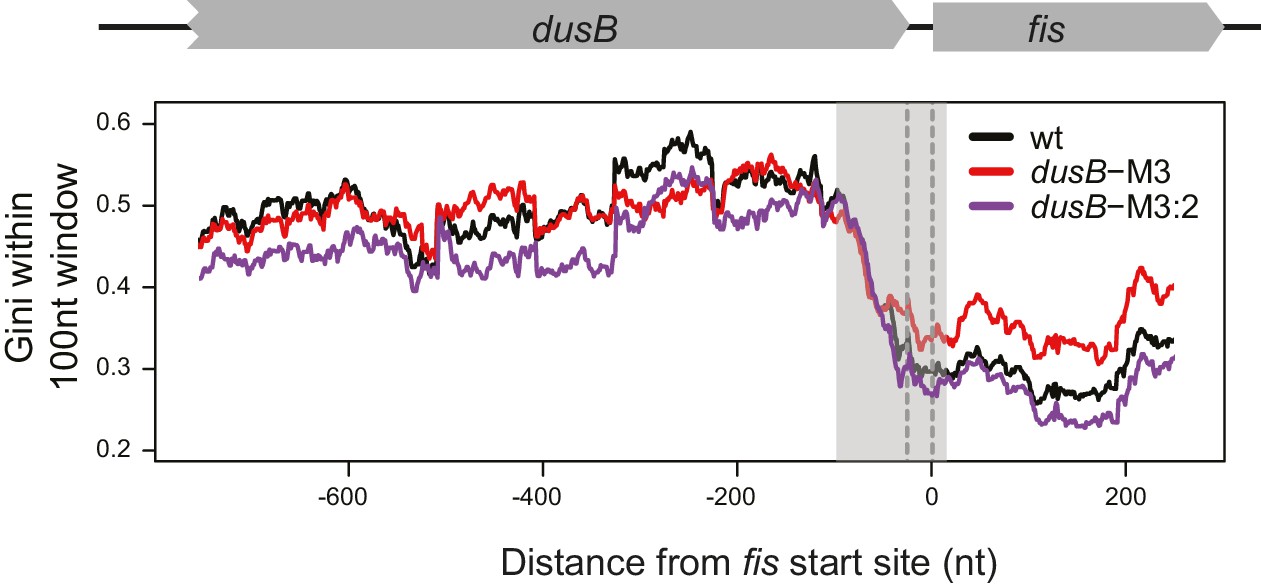
mRNA secondary structure at the dusB-fis boundary region of WT cells and dusB mutants.
Gini indices calculating within 100 nt rolling windows (plotted at the center of windows) at the boundary region of dusB-fis operon. X-axis: distance from the 5’ of fis start codon. Different samples are color-coded as indicated.
Figure 7
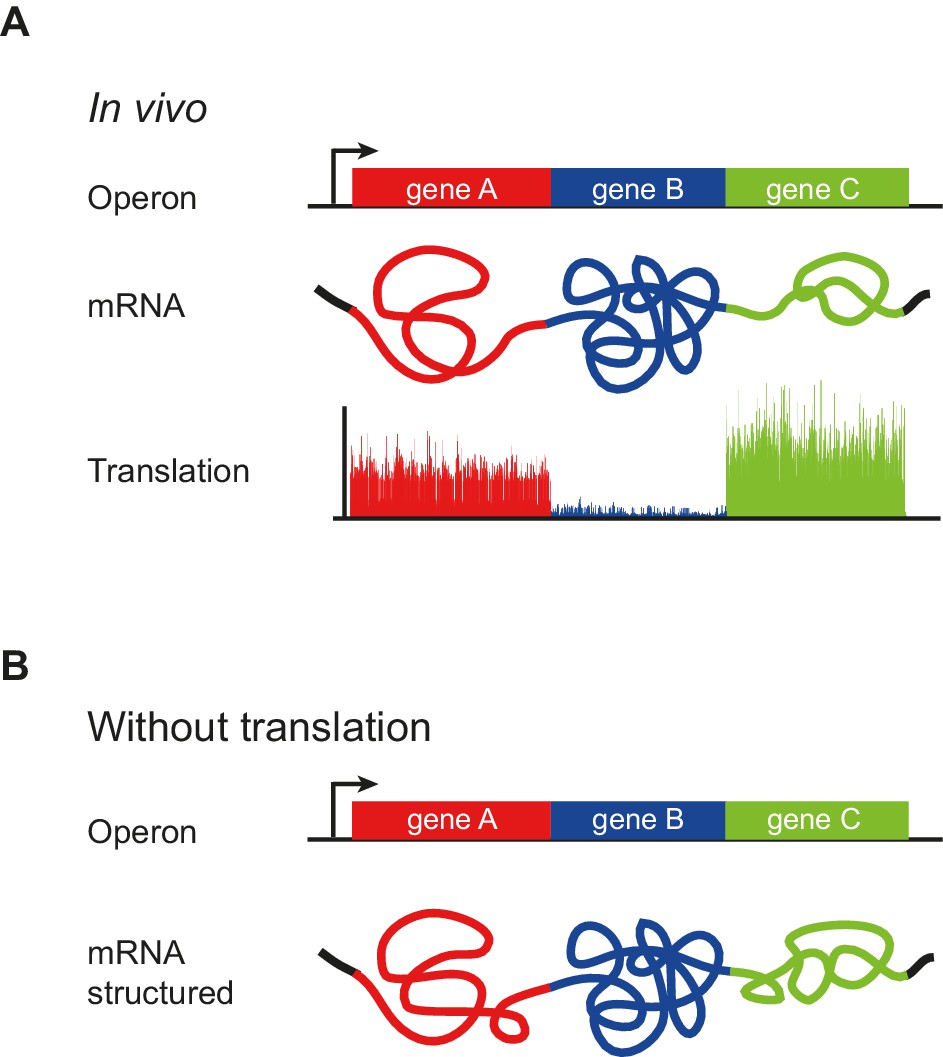
Model of operon mRNA structural organization.
Polycistronic mRNAs are organized into ORF-centric modules with characteristic but different extents of mRNA structure, punctuated by regions of low basepairing close to the translational start site (A). The intrinsic ORF-wide mRNA structure is highly predictive of translation efficiency (B), and is amplified by translation, in a self-reinforcing loop, to provide the mRNA structure that ultimately specifies the translation of each ORF in an operon.
Additional files
-
Supplementary file 1
In vivo data summary.
Data summary of ORFs that have ≥15 reads per nucleotide for in vivo DMS-seq (N = 1116).
- https://doi.org/10.7554/eLife.22037.017
-
Supplementary file 2
In vitro data summary.
Data summary of ORFs that have ≥15 reads per nucleotide for in vitro DMS-seq (N = 710).
- https://doi.org/10.7554/eLife.22037.018
-
Supplementary file 3
In vivo untranslated (ksg-treated) data summary.
Data summary of ORFs that have ≥15 reads per nucleotide for DMS-seq of in vivo untranslated (ksg-treated) mRNA (N = 480).
- https://doi.org/10.7554/eLife.22037.019
-
Supplementary file 4
Common ORFs data summary.
Data summary of ORFs that have ≥15 reads per nucleotide in all three conditions: DMS-seq of in vivo mRNA, in vivo untranslated mRNA and in vitro modified mRNA (N = 421).
- https://doi.org/10.7554/eLife.22037.020
Download links
A two-part list of links to download the article, or parts of the article, in various formats.
Downloads (link to download the article as PDF)
Open citations (links to open the citations from this article in various online reference manager services)
Cite this article (links to download the citations from this article in formats compatible with various reference manager tools)
Operon mRNAs are organized into ORF-centric structures that predict translation efficiency
eLife 6:e22037.
https://doi.org/10.7554/eLife.22037


