Extensive horizontal gene transfer in cheese-associated bacteria
- University of California, San Diego, United States
- Tufts University, United States
- Jacobs School of Engineering, University of California, San Diego, United States
Figures
Figure 1 with 2 supplements
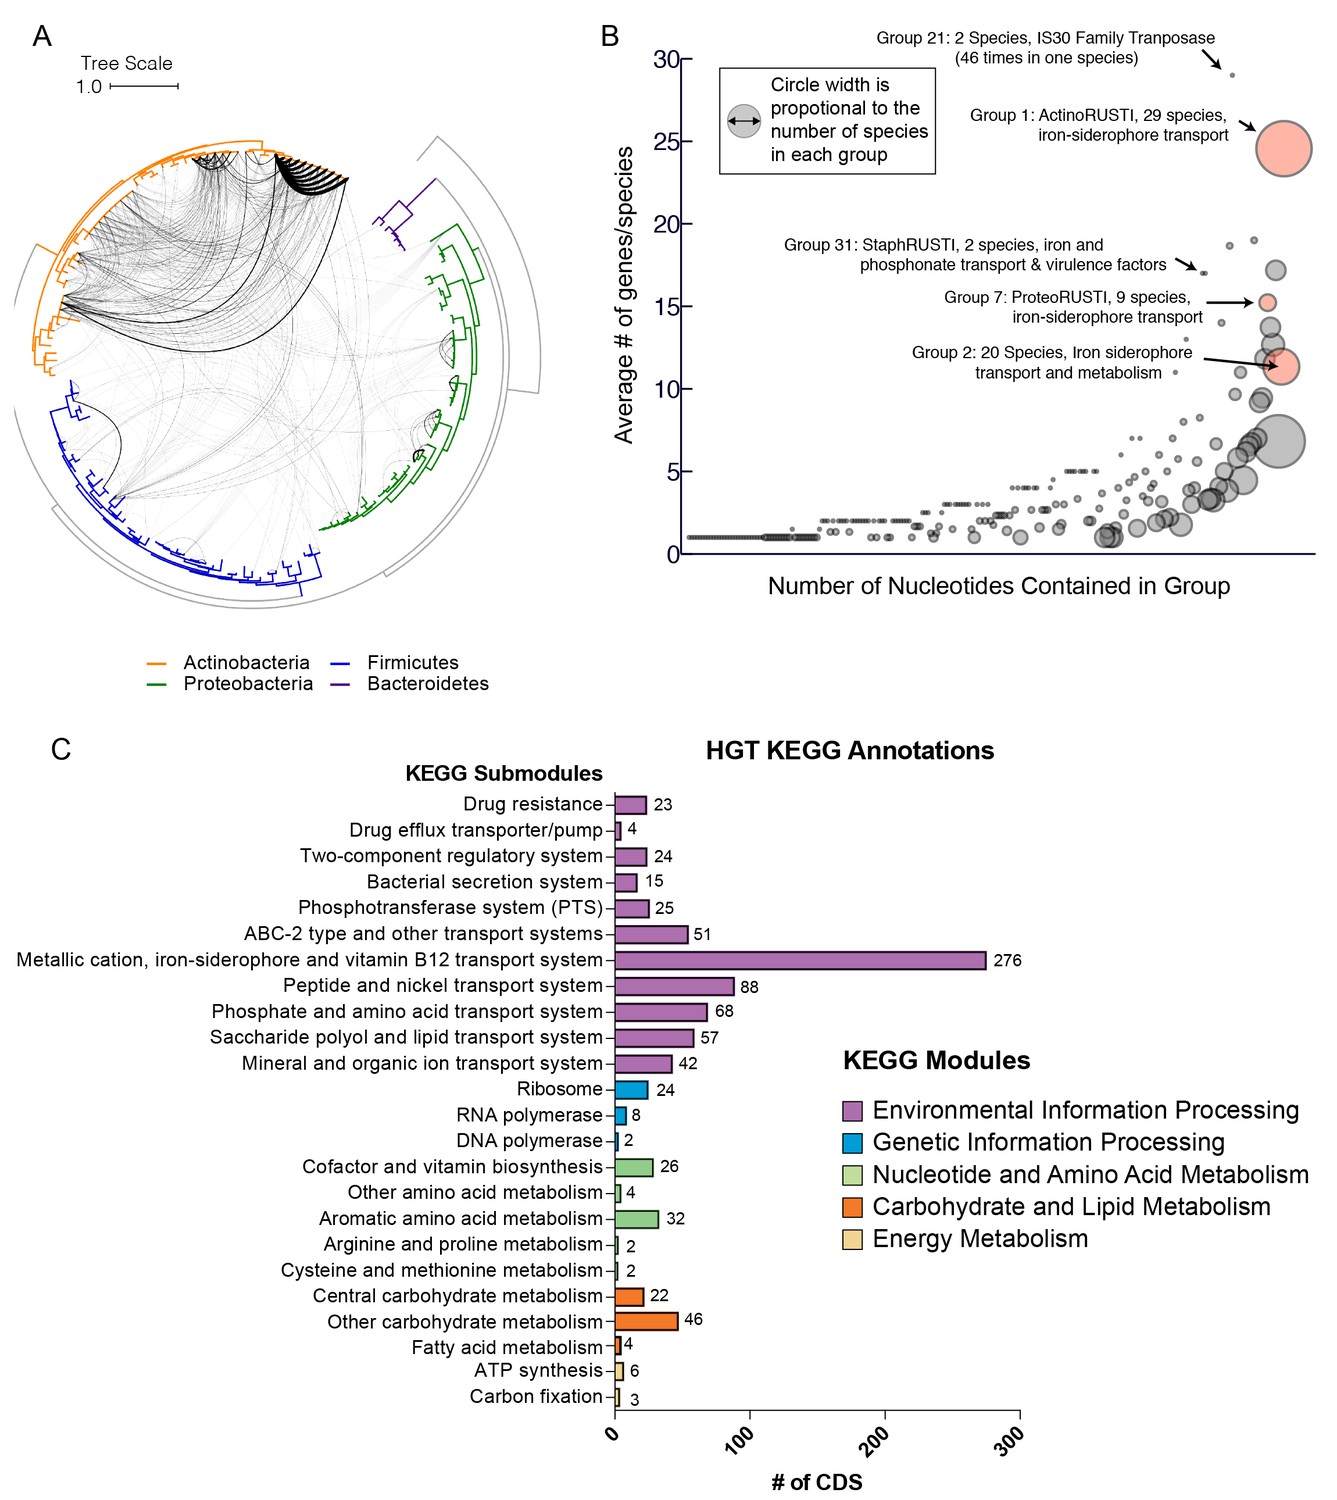
Extensive horizontal gene transfer in the cheese microbiome.
(A) All HGT events in analyzed cheese-associated bacteria. Connection thickness is scaled to number of shared protein coding sequences. Maximum likelihood tree based on 16S RNA alignment using Ribosomal Database Project (RDP). (B) HGT events clustered into 264 ‘groups’ based on genomic proximity. Groups are plotted based on total nucleotide content (x-axis, from low to high), and the mean number of genes per species (y-axis). Diameter of each circle is proportional to the total number of species in the group. Groups highlighted in red are described further in the text. (C) Quantification of KEGG modules and submodules for protein coding genes (CDS) identified as horizontally transferred. Annotations were generated by BLAST-Koala. Genes without function prediction are not depicted.
Figure 1—figure supplement 1
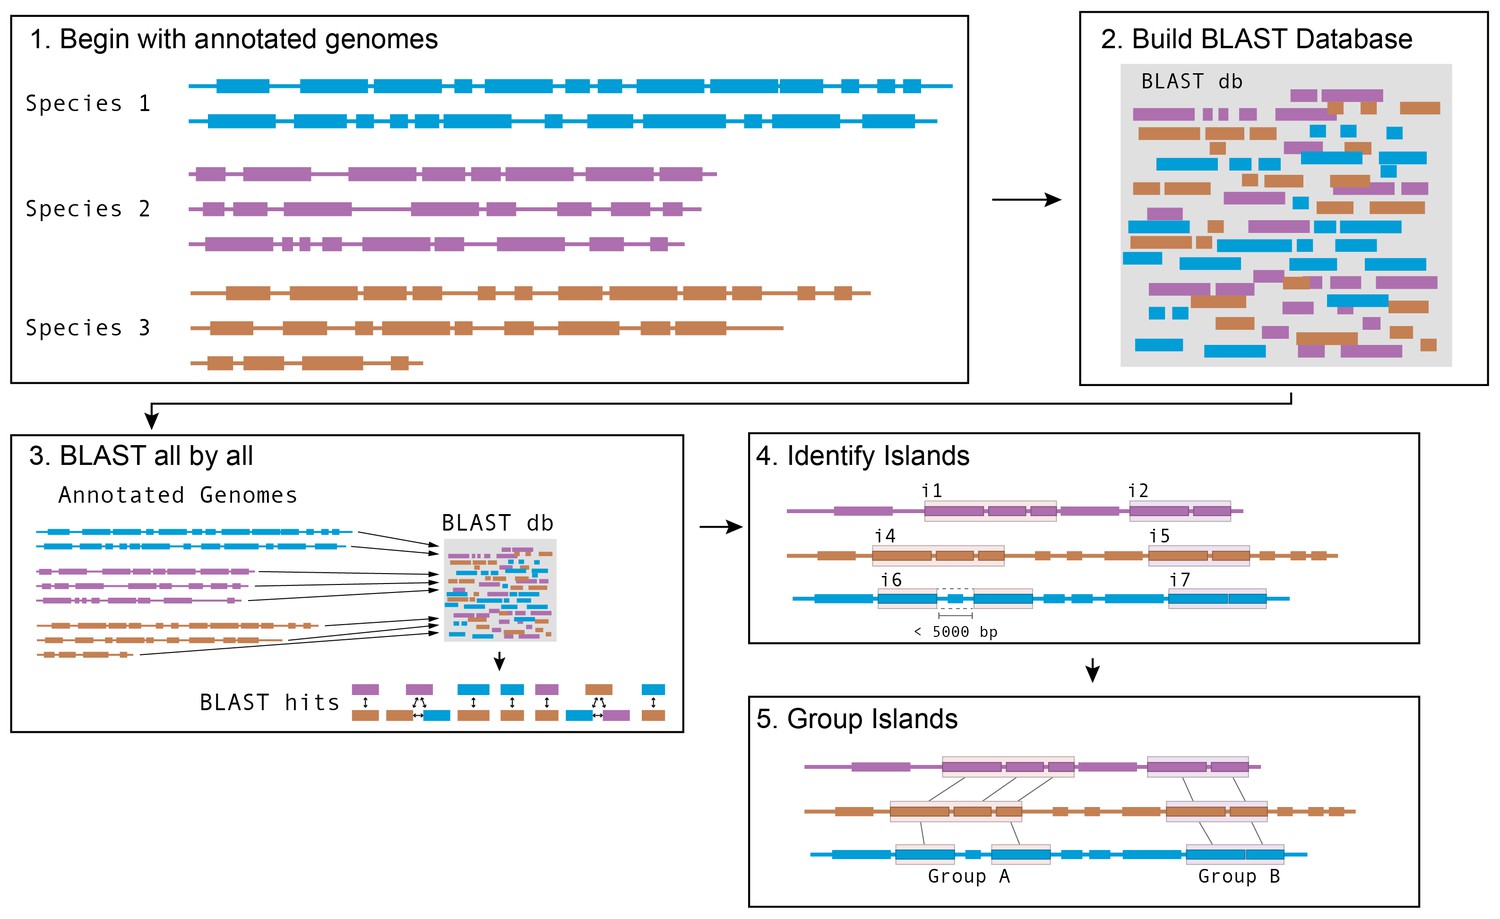
Schematic of software pipeline to identify HGT.
(1) Sequenced genomes are annotated with IMG/ER and downloaded in Genbank format. (2) All annotated genes in all genomes are used to assemble a BLAST database using BLAST+ command-line tools. (3) All protein coding genes (CDS) from all species are queried against the BLAST database. Hits from the same species are discarded; hits from species with an ANI > 89% are discarded; other hits are saved. (4) For each species, coding sequences that have at least one BLAST hit are grouped into islands based on proximity. Genes that are within 5 kb of each other on the same contig are considered to be part of the same island. (5) Islands in each species are compared with islands in other species to form groups. Islands that share at least one gene in common according to BLAST parameters in step 3 are placed in the same group.
Figure 1—figure supplement 2
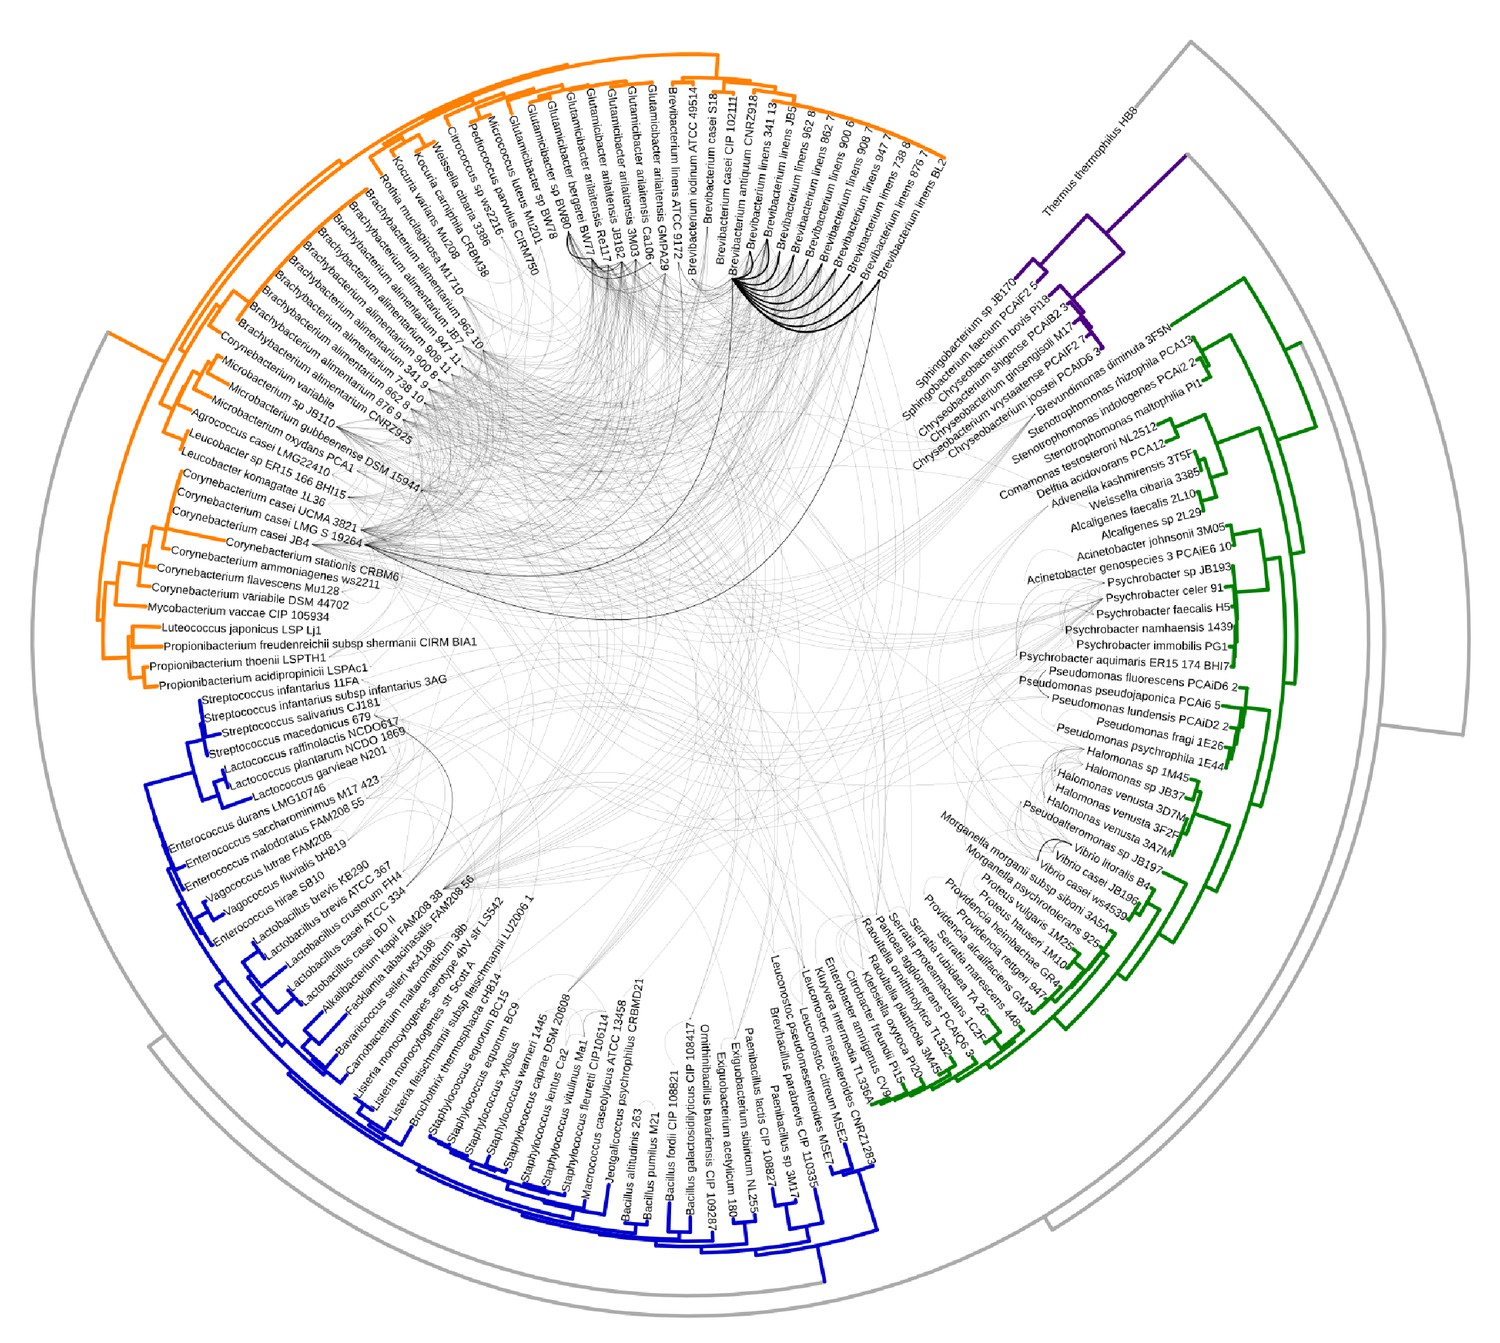
Same as Figure 1A with branch labels.
All HGT events in analyzed cheese-associated bacteria. Connection thickness is scaled to # of shared protein coding sequences. Phylogenetic tree based on 16S RNA alignment using Ribosomal Database Project (RDP).
Figure 2 with 1 supplement
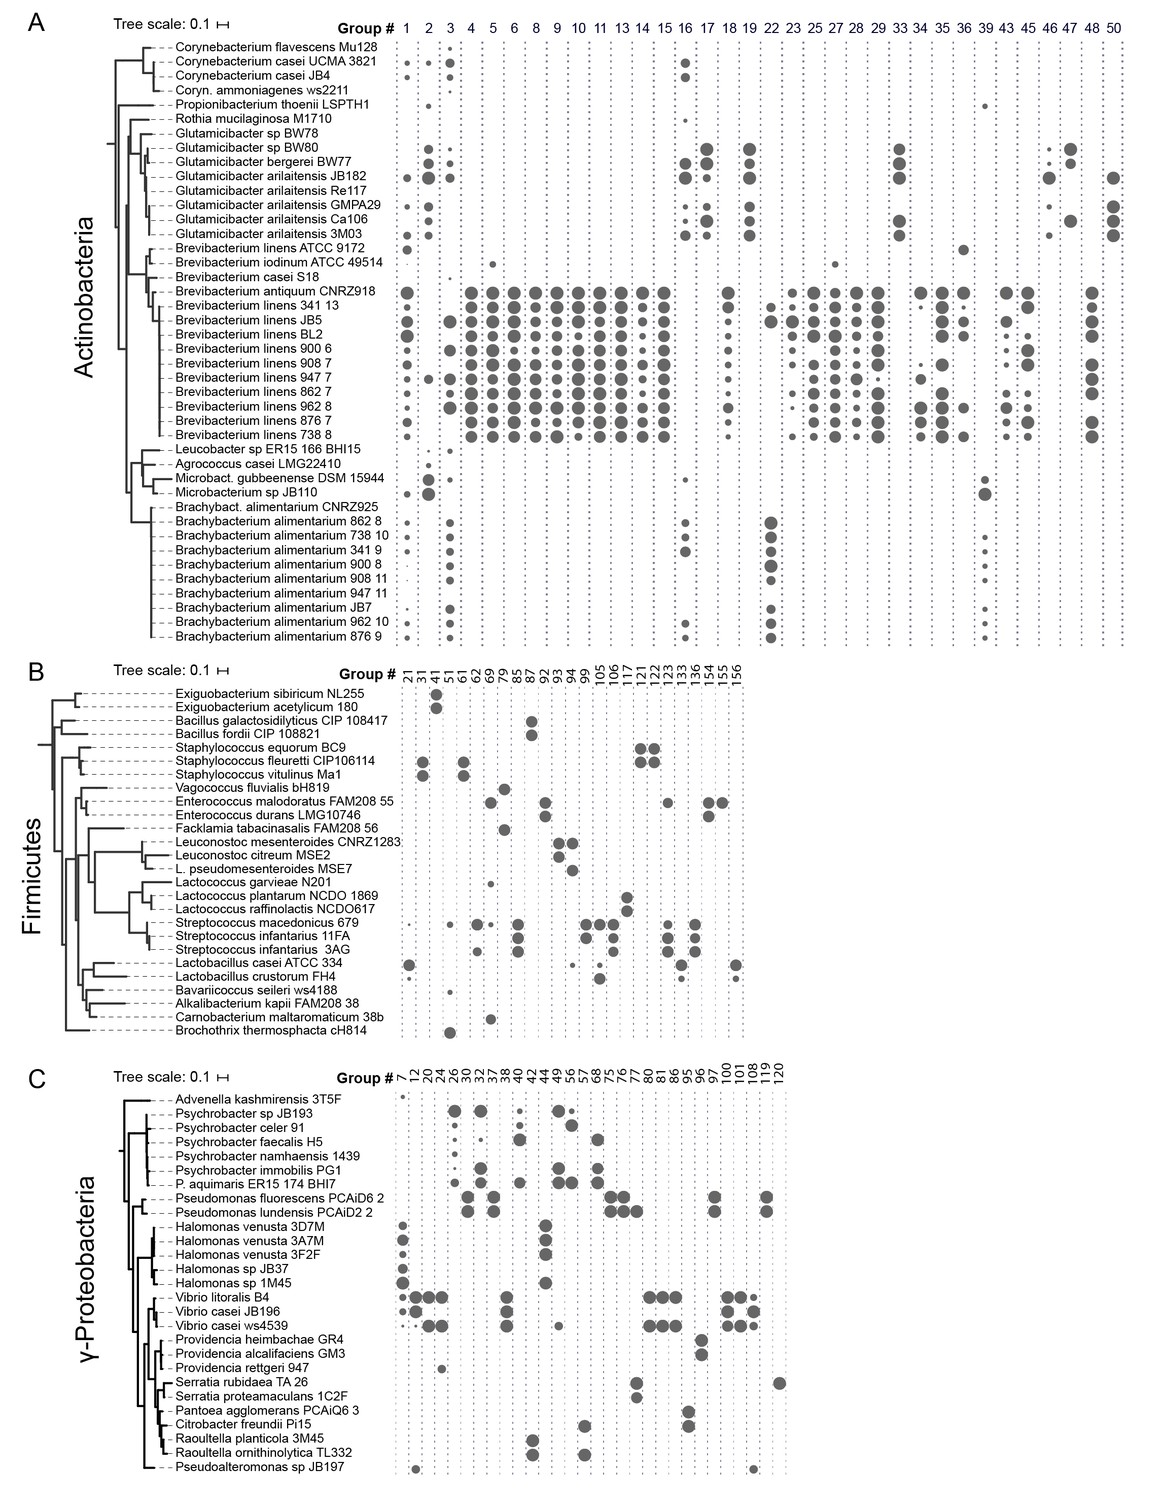
HGT Groups in Actinobacteria, Firmicutes, and γ-Proteobacteria groups.
(A) The 31 largest HGT groups that contain predominantly Actinobacteria. The areas of circles are scaled to log2(n), where n is the total number of nucleotides in that group for each species. The largest circle size represents the largest HGT group in that phylum. Phylogenies (left) are based on small subunit ribosomal RNA alignment. (B) The 25 largest HGT groups that contain predominantly Firmicutes. (C) The 28 largest groups that contain predominantly γ-Proteobacteria.
Figure 2—figure supplement 1
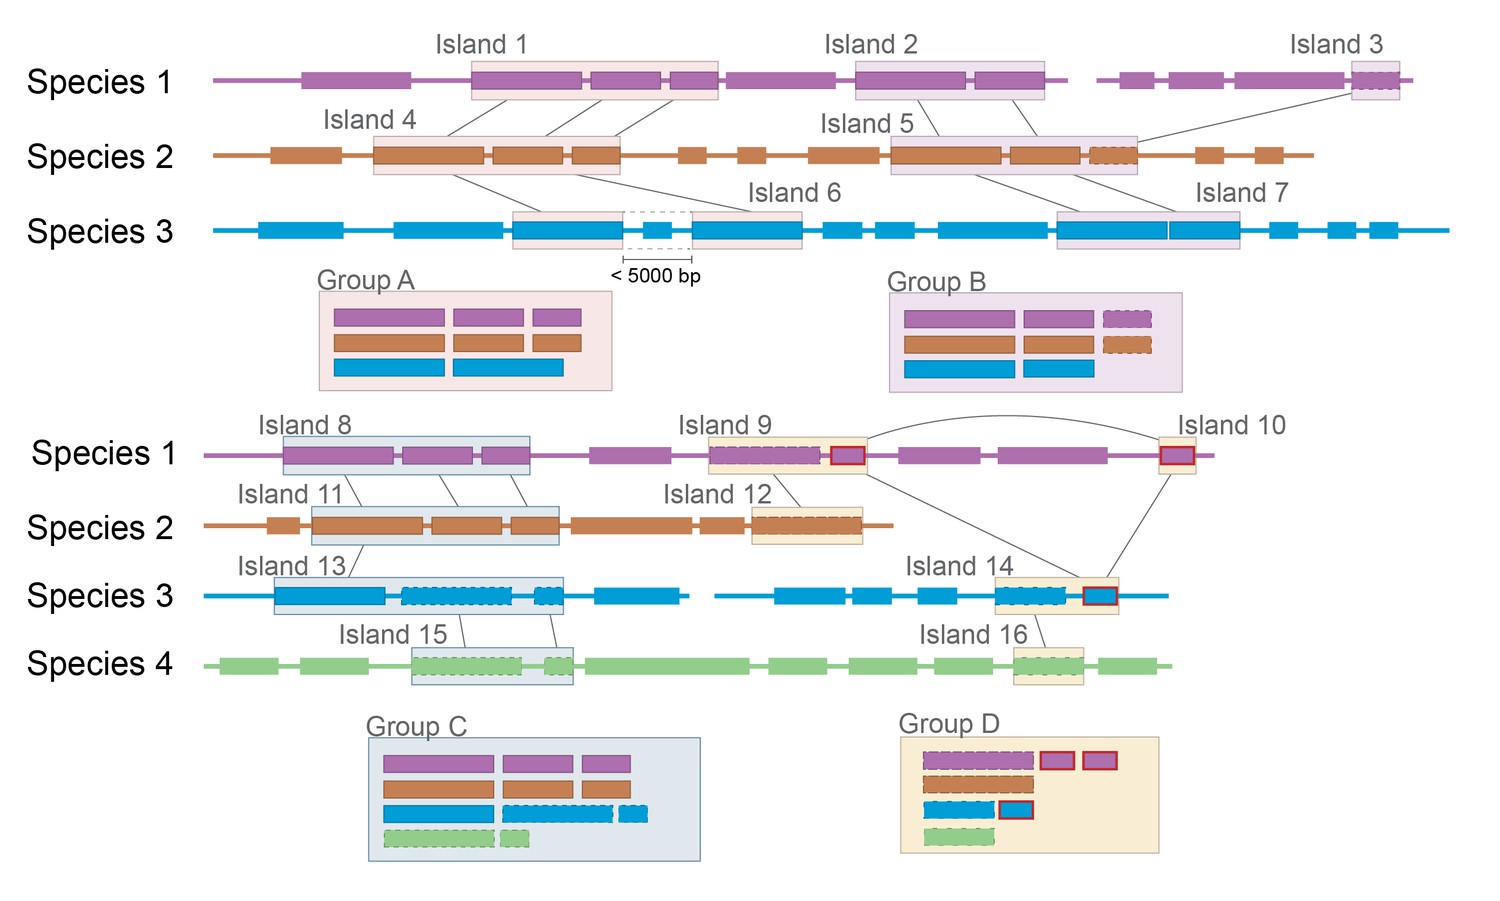
Group A: Expected clustering: contiguous genes in multiple species are in a single group.
Although island 6 (i6) lacks one gene present in i1 and i4, (possibly because of a transposon insertion), it is still considered related. Group B: Ambiguous grouping: islands 2 and 3 from species 1 are found on different contigs, but are grouped together. They may be found in close proximity in the genome, but on different sides of a gap in the assembly, or they may be quite distant from each other. The grouping of related genes in species 2 into a single island suggests that they may have been transferred in a single event, but the possibility of two unrelated HGT events landing in the same spot cannot be excluded. Group C: Possible mis-grouping of two HGT events in a single group: although species 4 does not share any genes with species 1 and 2, these islands are nevertheless clustered because of the proximity of coding sequences in species 3. This may correctly represent a single gene cluster that subsequently diverged in each species, or unrelated HGT that happened to insert in close proximity. Group D: Mis-grouping because of mobile element: Mobile elements (outlined in red) found in multiple locations in multiple genomes may insert next to unrelated HGT islands, causing spurious grouping by the algorithm.
Figure 3
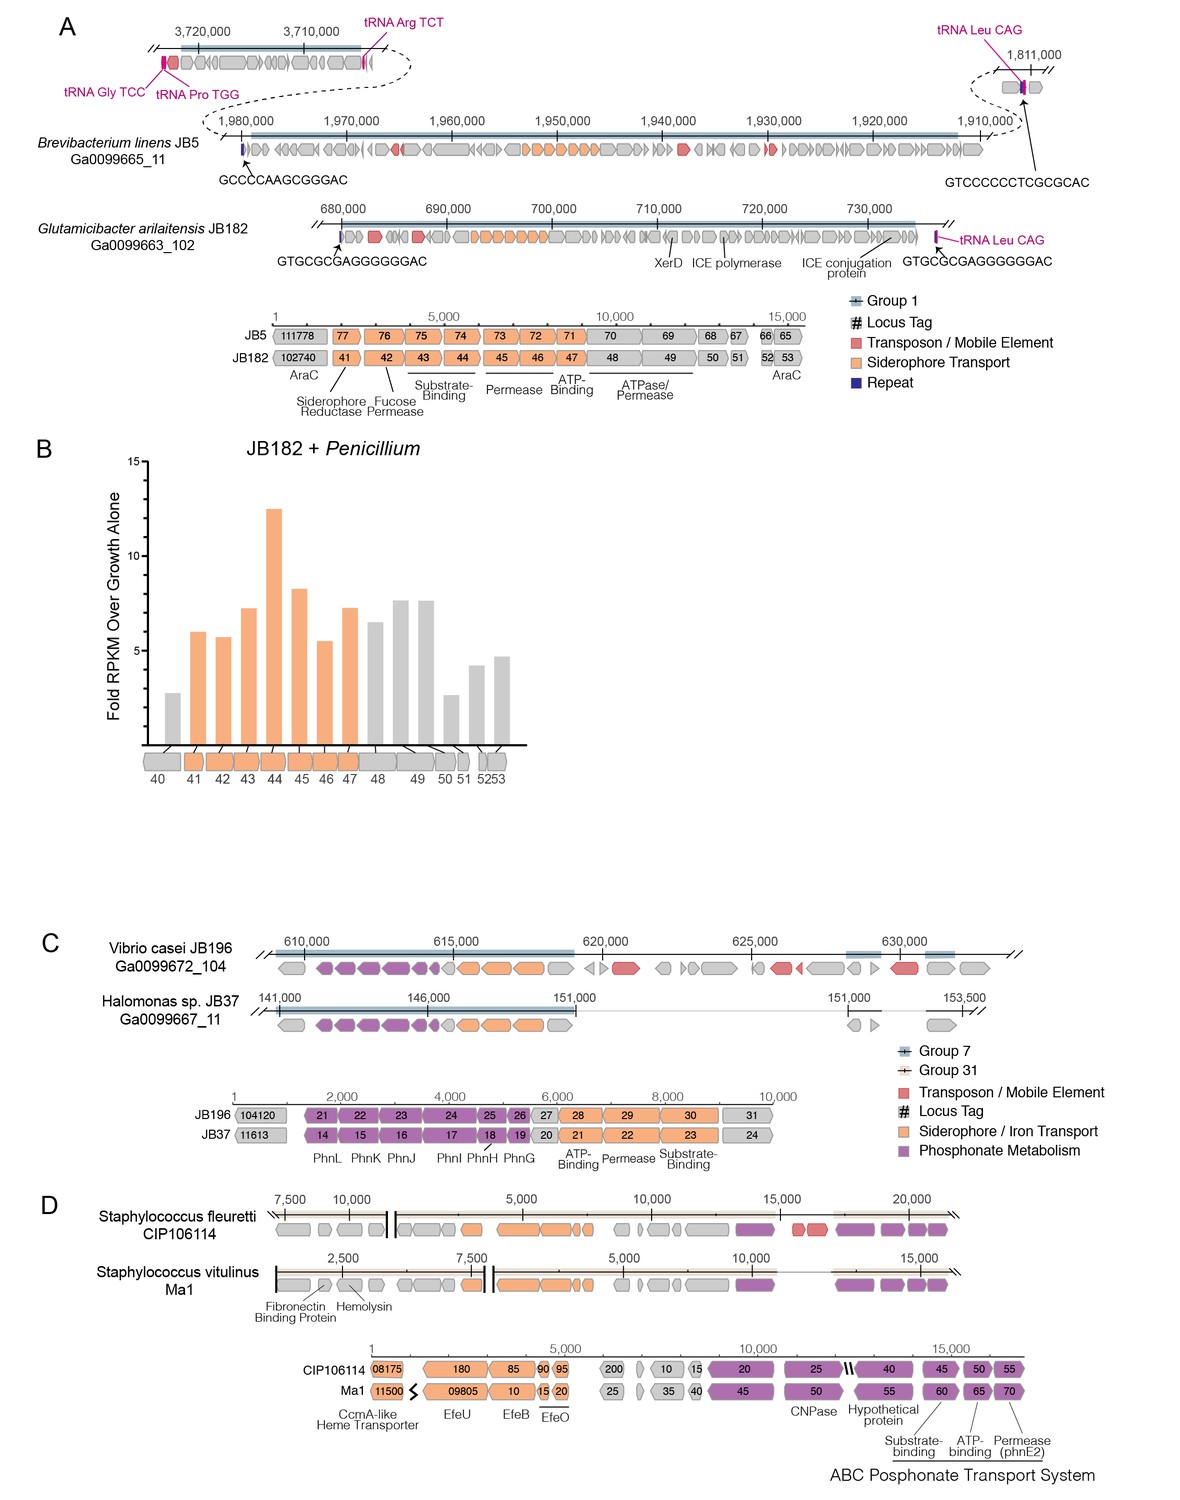
Structure of RUSTI islands.
(A) At-scale schematics for genomic context of HGT Group 1 (top) for B. linens JB5 and G. arilaitensis JB182 and alignment of RUSTI operon (bottom). Nucleotide position values (top) refer to contigs Ga0099665_11 and Ga0099663_102 respectively. Dotted line for JB5 depicts regions of the contig that are not shown. Nucleotide position values (bottom) refer to operon starting from stop codon of leading AraC coding sequence. (B) At-scale schematics for genomic context of HGT Group 7 for Halomonas sp. JB37 and V. casei JB196 (top) and alignment of iron and phosphonate metabolism genes (bottom). Nucleotide position values (top) refer to contigs Ga0099667_11 and Ga0099672_104 respectively. Grey lines for JB196 depict gaps in the alignment resulting from insertions in JB37. Nucleotide position values (bottom) refer to operon starting from stop codon of leading protein coding sequence. (C) At-scale schematics for genomic context of HGT Group 31 for S. fleuretti. CIP106114 and S. vitulinus Ma1 (top). For both species, the group is split across two different contigs and nucleotide position values (top) refer to the relative position for that contig. Alignment of iron and phosphonate metabolism genes from Group 31 (bottom).
Figure 4
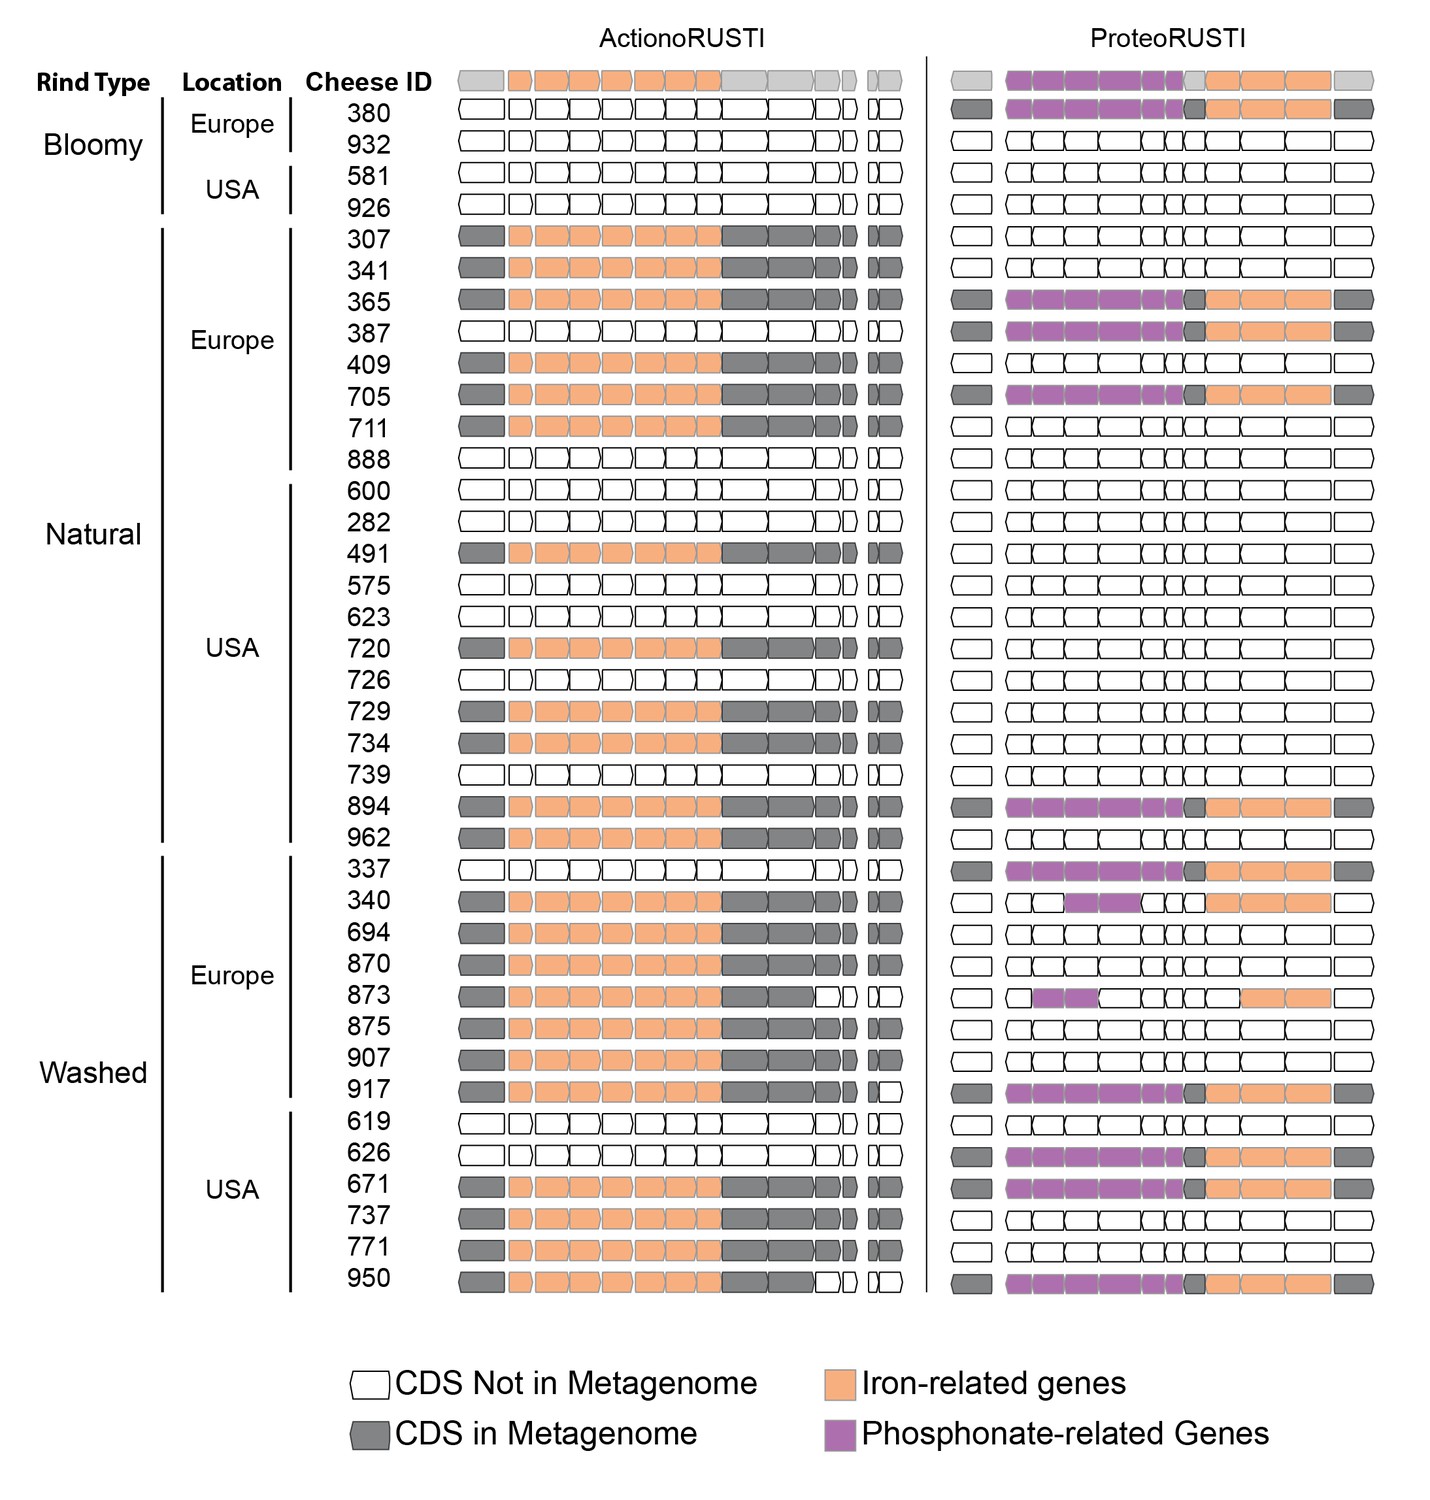
Presence of RUSTI in cheese metagenomes.
Genes in ActinoRUSTI (G. arilaitensis JB182) and ProteoRUSTI (V. casei JB196) regions were compared with 32 assembled metagenomes from the US and Europe. Filled CDS represents a positive (>97% identical nucleotides) hit in that metagenome.
Figure 5
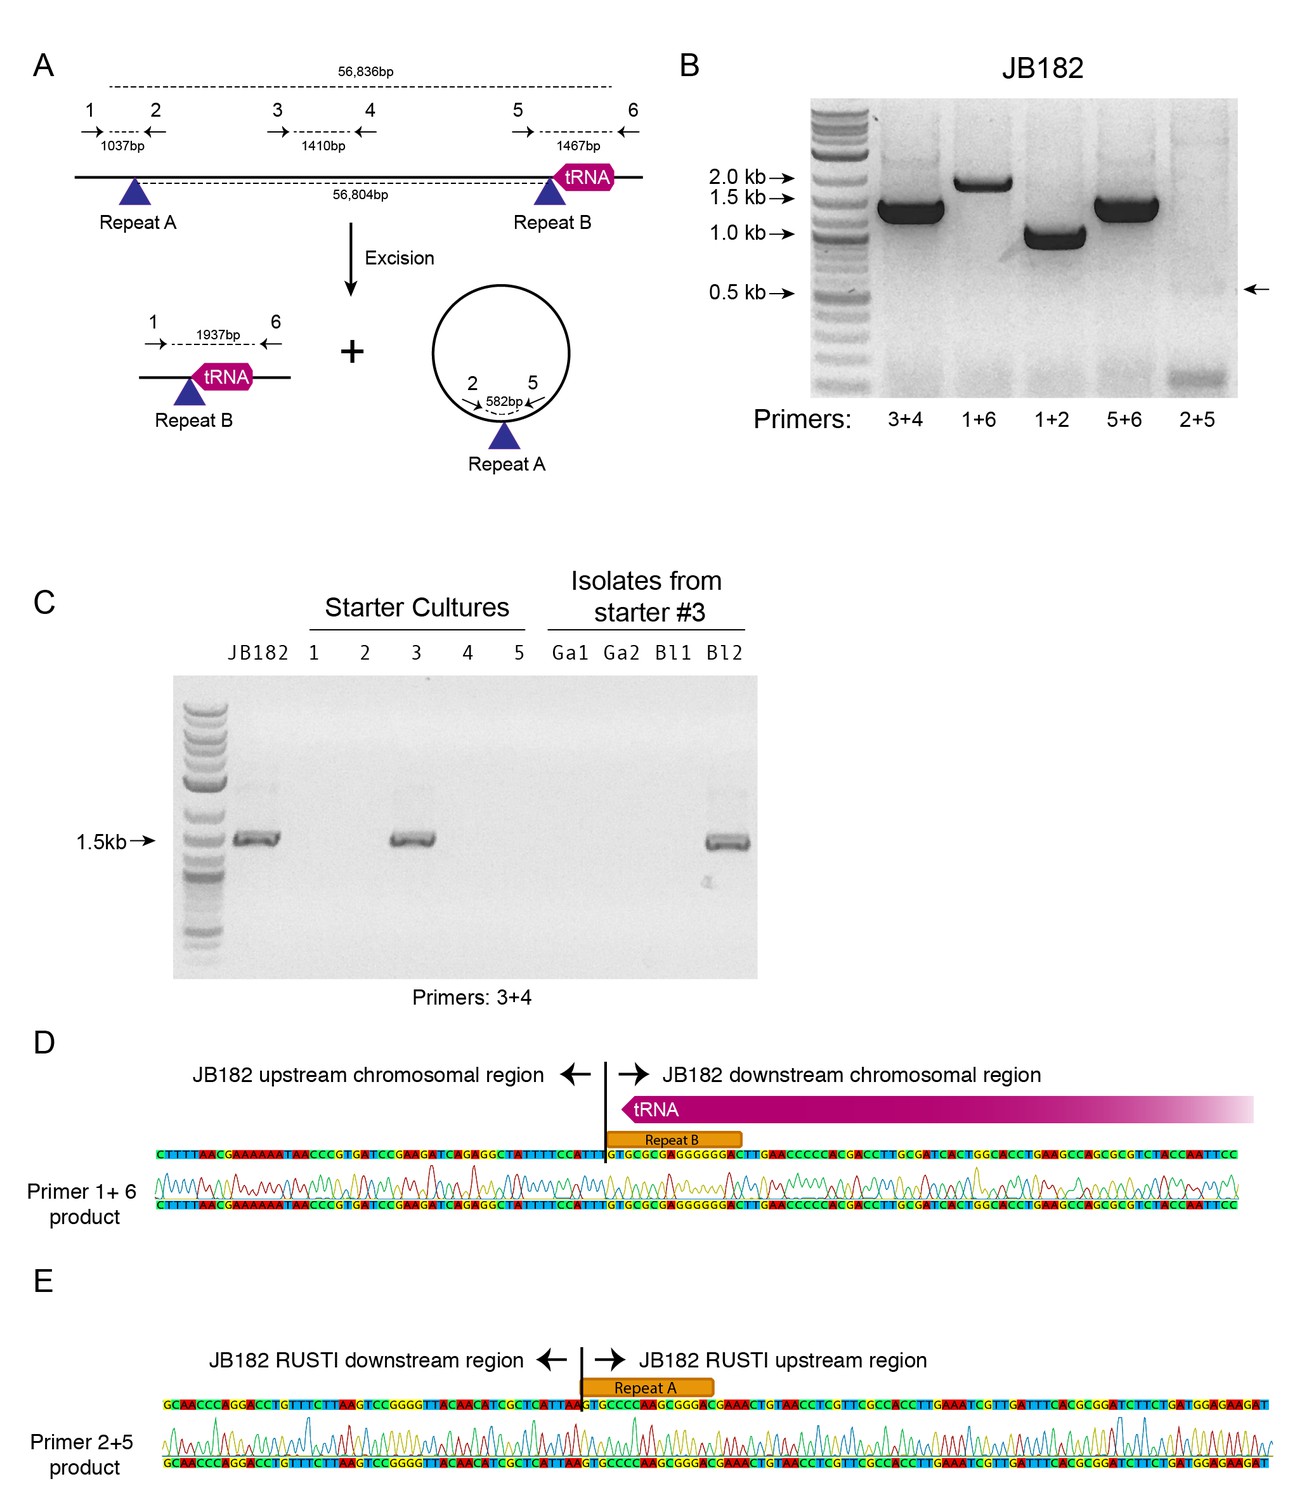
Mobility of RUSTI.
(A) Schematic for PCR primer design - see Materials and methods for details. (B) PCR testing for the presence of RUSTI and for the excision of the ICE in an overnight culture of G. arilaitensis JB182. (C) DNA was extracted from five commercially available starter cultures and tested for the presence of RUSTI using PCR with primers specific for the HGT region (Materials and methods). Starter culture 3 was plated on PCAMS media, and four isolates selected based on colony morphology were also tested. The expected size for the amplicon is ~1.4 kb. Sequencing of the 16S ribosomal RNA genes for these isolates suggested that two isolates are Glutamicibacter arilaitensis and two are Brevibacterium linens. G. arilaitensis. JB182 was used as a positive control. (D) The ~2000 bp band from the PCR amplification using primers 1 and 6 and (E) the ~500 bp band from amplification using primers 2 and 5 were extracted and sequenced. Alignment with the JB182 genome reveals 100% alignment with expected and the spliced chromosomal region containing the 3’ repeat and the excision circle containing the 3’ repeat respectively.
Additional files
-
Supplementary file 1
Genome information.
(a) Genome statistics for newly sequenced genomes, determined by IMG/ER. Gene IDs refer to IMG bioproject or RefSeq Accession. Genomes from Almeida et. al. do not yet have accession numbers. (b) Pairwise species comparison summary total. Protein coding sequences (column ‘Shared CDS’) and nucleotides (in base-pairs - column ‘Shared nt’) determined to be horizontally transferred for every pair of species that were compared by the HGT detection pipeline. Also shows calculated ANI and 16S similarity in % (column ssu - see Materials and methods for method of determining 16S similarity). Species pairs that have ANI > 0.89 were not compared and are not shown. (c) HGT identification parameters. Different parameters for minimum length of gene match for HGT, maximum % ANI identity for related species, and maximum distance between genes in an island were compared. Number of positive HGT hits identified when varying the minimum protein coding gene length. Number of HGT groups constructed when varying the maximum separation between hits that are classified as belonging to the same group. Number of nucleotides or number of protein coding sequences in HGT regions by 16S similarity. Note - There are no results below 500 as 500 bp is the minimum length for protein coding sequences in this analysis. (d) Full group annotations. All protein coding sequences identified as HGT, sorted by group # (ranked by total nucleotide content), species and genome location within species. Certain functional annotations are identified by color (e.g. orange for iron) based on text in annotation. Locus tags and contig IDs beginning with lower case letters were assigned by kvasir, and do not correspond to any published database. (e) Group summary statistics. Summary statistics for each HGT group. (f) Highly conserved genes in Brevibacterium species. Protein coding sequences from Group 29, as well as selected highly conserved genes from Brevibacterium antiquum CNRZ918 were compared with other Brevibacterium strains by BLAST. B. linens 947.7 has substantially lower nucleotide identity for the four genes found in Group 29 than other B. linens strains, despite similar nt distance for other highly conserved genes. This suggests that Group 29 is a true example of HGT between CNRZ918 and other B. linens strains, rather than a false positive. (g) RUSTI gene expression during competition. Gene expression data from RNA seq analysis for genes in JB182 RUSTI. Related to Figure 3B (h) TCBD hits for transporters in RUSTI. Representative CDS of Actino- and ProteoRUSTI from G. arilaitensis JB182 and V. casei JB196, respectively, were compared with the Transporter Classification Database (TCDB). (i) RefSeq BLAST Actino- and ProteoRUSTI from G. arilaitensis JB182 and V. casei JB196, respectively, as well as the consensus sequence for StaphRUSTI (see Figures 3 and 4) were compared with the NCBI RefSeq database using BLAST.
- https://doi.org/10.7554/eLife.22144.011
Download links
A two-part list of links to download the article, or parts of the article, in various formats.
Downloads (link to download the article as PDF)
Open citations (links to open the citations from this article in various online reference manager services)
Cite this article (links to download the citations from this article in formats compatible with various reference manager tools)
Extensive horizontal gene transfer in cheese-associated bacteria
eLife 6:e22144.
https://doi.org/10.7554/eLife.22144


