Structural basis for subtype-specific inhibition of the P2X7 receptor
- Cornell University, United States
Figures
Figure 1
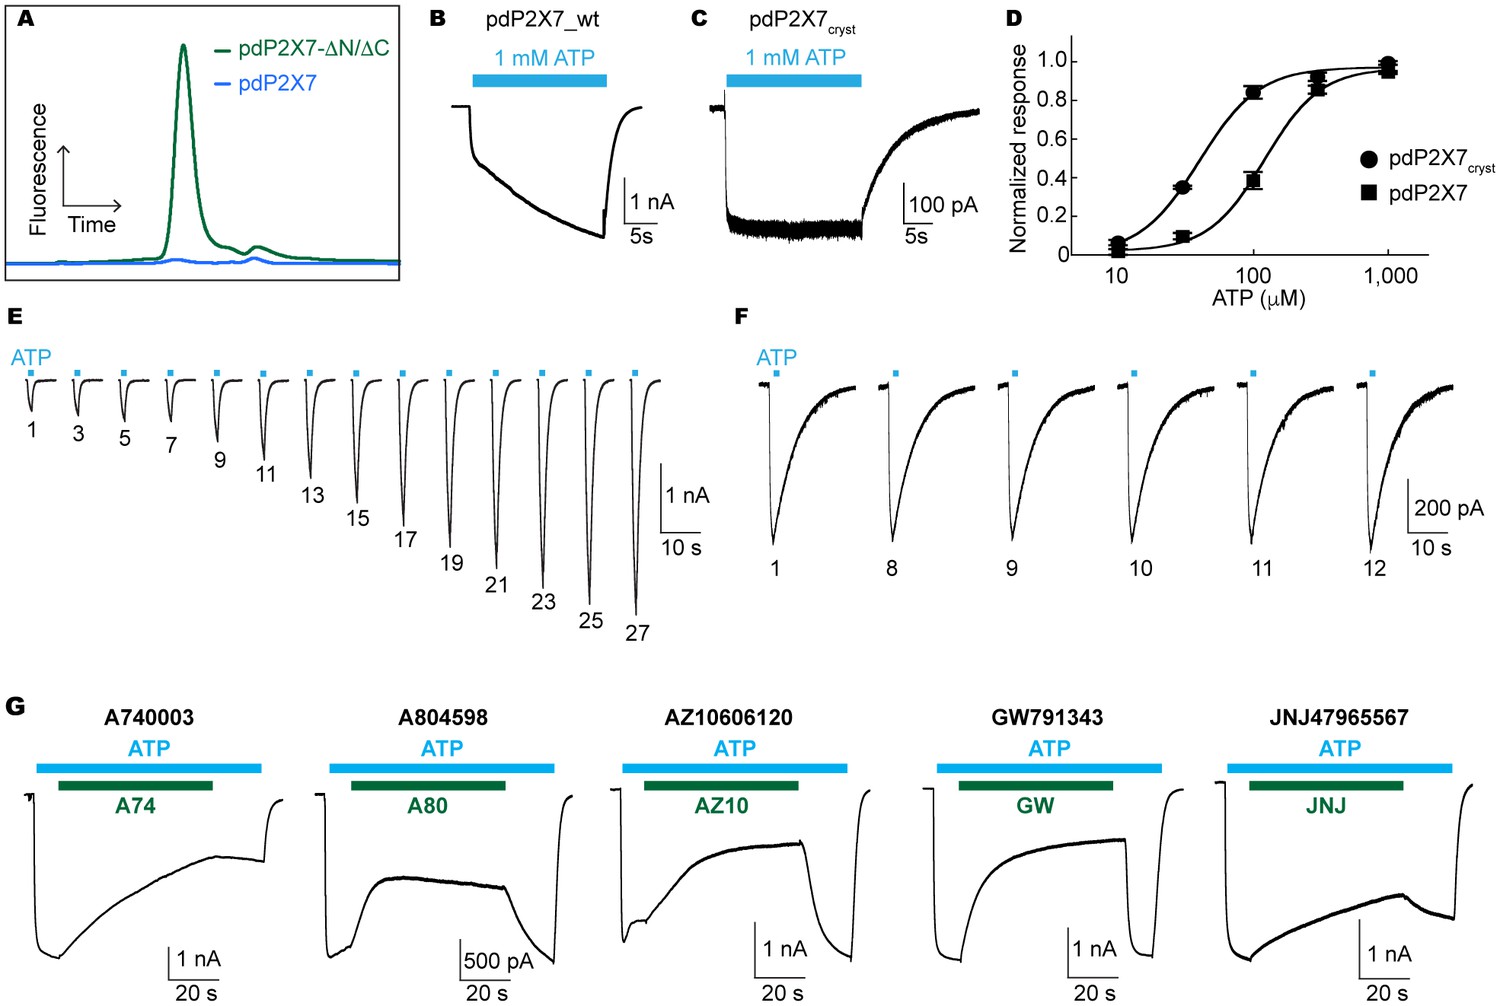
Characterization of pdP2X7.
(A) FSEC traces (Ex: 488 nm and Em: 509 nm) for the full length (blue) and the truncated (green) pdP2X7. (B) and (C) Whole cell patch clamp recordings from the wildtype pdP2X7 (B) and pdP2X7cryst (C) triggered by 1 mM ATP. (D) ATP dose responses of pdP2X7 (square) and pdP2X7cryst (circle) determined by the whole cell patch clamp experiments. The plots were made using the normalized means of five independent experiments and the error bars represent SEM. Dose response curves were fit with the Hill equation. EC50 values of pdP2X7 and pdP2X7cryst were 122 μM and 40 μM, respectively. (E) and (F) Whole cell patch clamp recordings from pdP2X7 (E) and pdP2X7cryst (F) expressed in HEK293 cells. Each trace represents the pdP2X7 mediated current triggered by 1 s applications of 100 μM ATP from the same patch. The numbers below the traces indicate the number of repeated ATP applications. (G) Whole cell patch clamp recordings of pdP2X7 triggered by 1 mM ATP in the presence of different P2X7 specific antagonists. Drugs were applied for 1 min in the presence of ATP. Membrane was held at −60 mV. Concentrations of the drugs were; A740003: 600 nM; A804598: 180 nM; AZ10606120: 2.3 μM; GW791343: 50 μM; JNJ47965567: 136 nM.
Figure 2 with 2 supplements
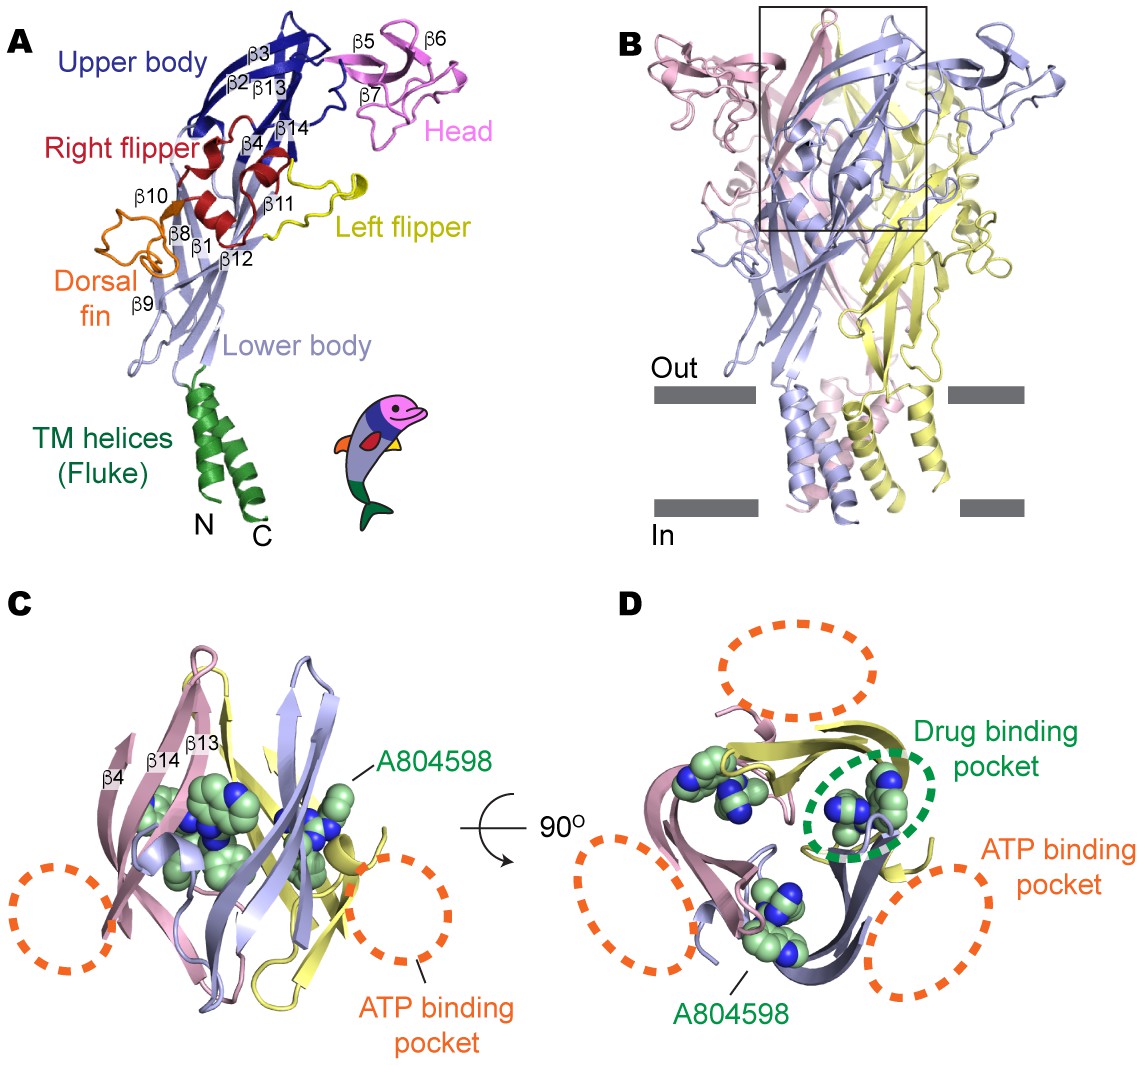
Drug-binding pocket of the P2X7 receptor.
(A) Cartoon representation of a 'dolphin-like' single subunit of the apo pdP2X7 structure. Fourteen beta strands are labeled as β1-14. Each domain is colored consistent with the previous studies for better comparison (Kawate et al., 2009; Hattori and Gouaux, 2012). (B) Cartoon representation of the trimeric pdP2X7 structure viewed from the side. The black box indicates an approximate location of the upper body domains shown in (C) and (D). (C) Side view of the upper body domains exhibiting A804598 binding sites with respect to the ATP-binding pockets (orange dashed lines). A804598 is shown as CPK spheres. (D) Top view of the apo pdP2X7 structure with respect to the ATP-binding pockets (orange dashed lines) and one of the drug-binding pockets (green dashed line).
Figure 2—figure supplement 1
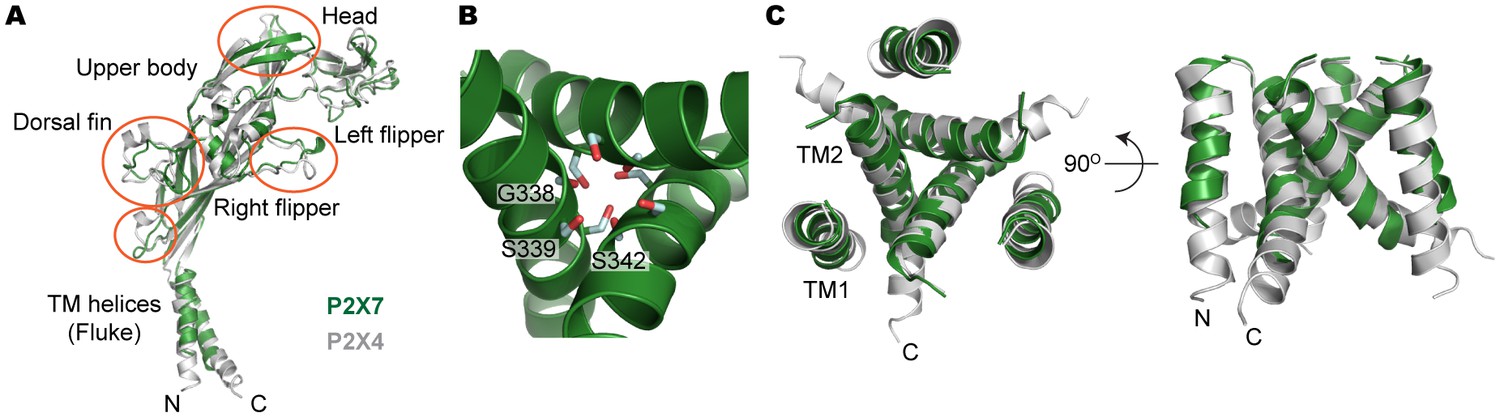
Structural comparison between pdP2X7 and zfP2X4.
(A) Superposition of the apo closed pdP2X7 monomer (green) onto the apo closed zfP2X4 structure (4DW0; gray). The two structures were superposed against each other at the body domain using Lsqkab software (Kabsch, 1976). Notable differences between these two structures are highlighted in orange. (B) Stick representations of the pdP2X7 gate residues. Three TM2 helices are shown as cartoon in green. (C) Superposition of the transmembrane helices of the apo closed pdP2X7 monomer (green) onto the apo closed zfP2X4 structure (gray) Root-mean-square displacement of the Cα positions between monomeric pdP2X7 and zfP2X4 is 2.8 Å.
Figure 2—figure supplement 2
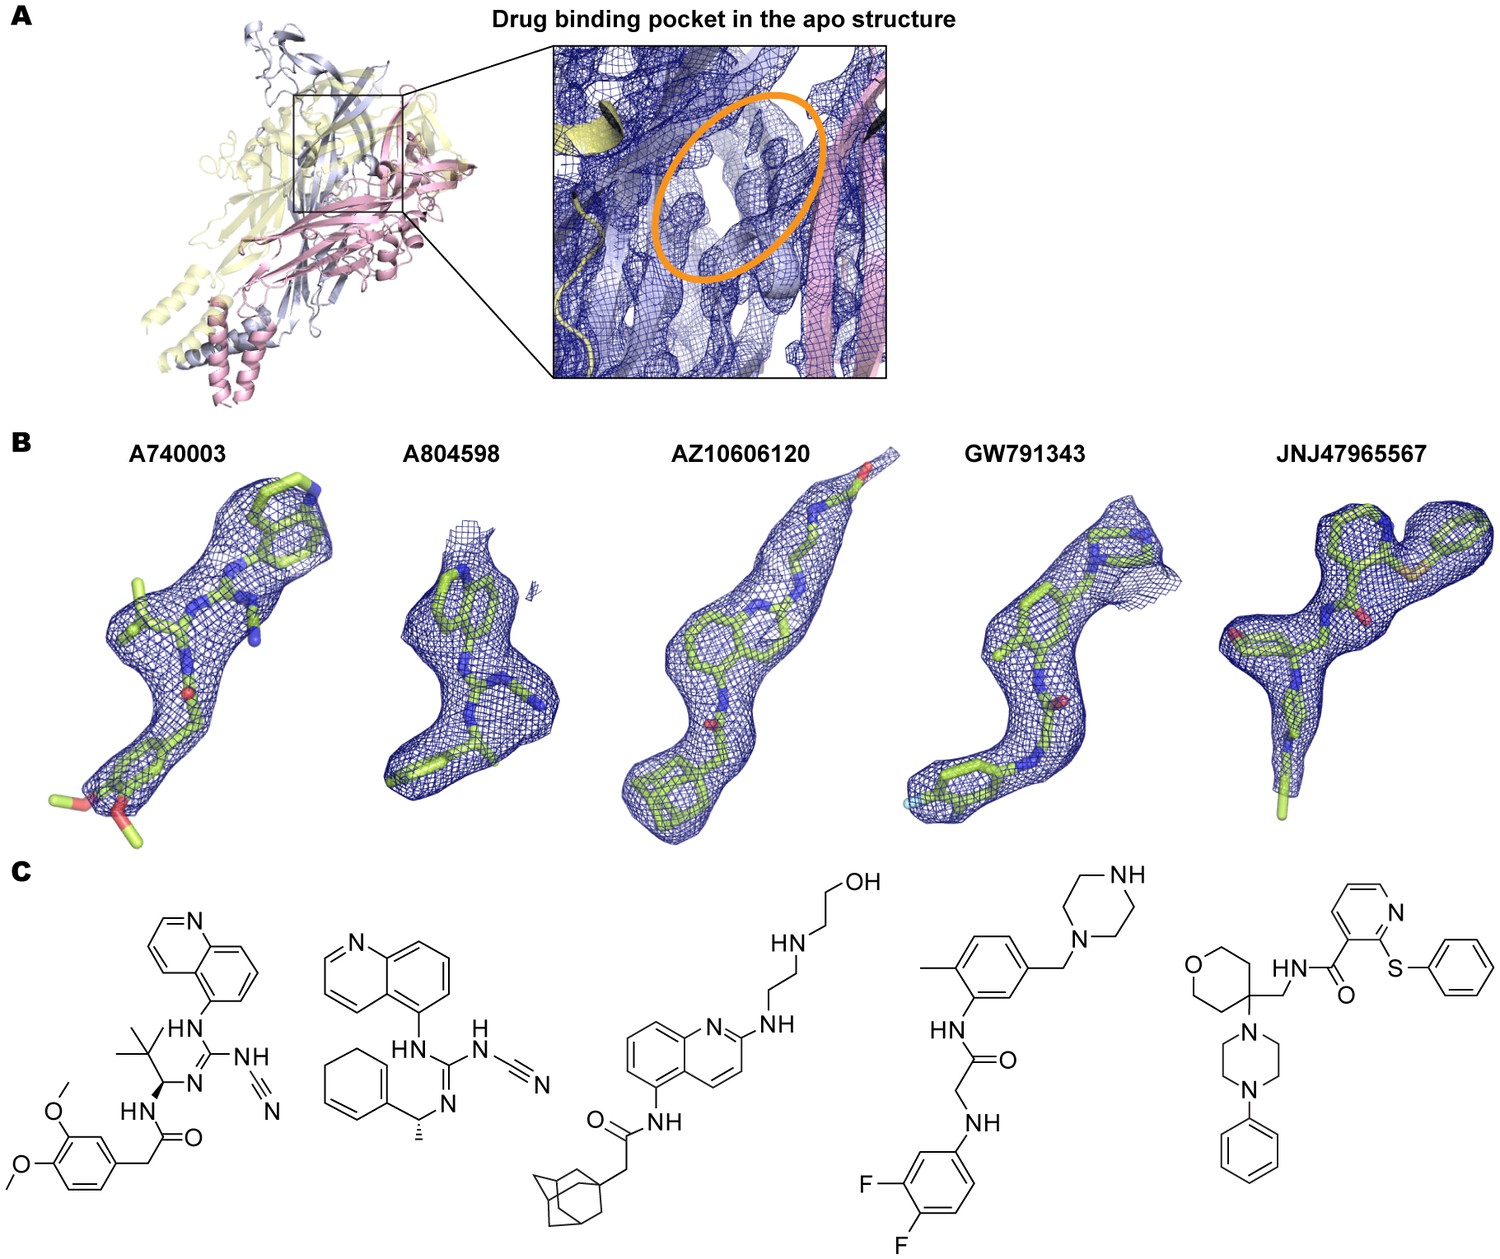
Electron density around the P2X7 specific antagonists.
(A) 2Fo-Fc map (contoured at σ = 2.0) around the drug-binding pocket (orange) in the apo closed pdP2X7. (B) Fo-Fc map (contoured at σ = 3.0) around the P2X7 specific antagonists. Each drug is depicted as a stick representation. (C) Chemical structure of each P2X7 antagonist is shown.
Figure 3 with 6 supplements
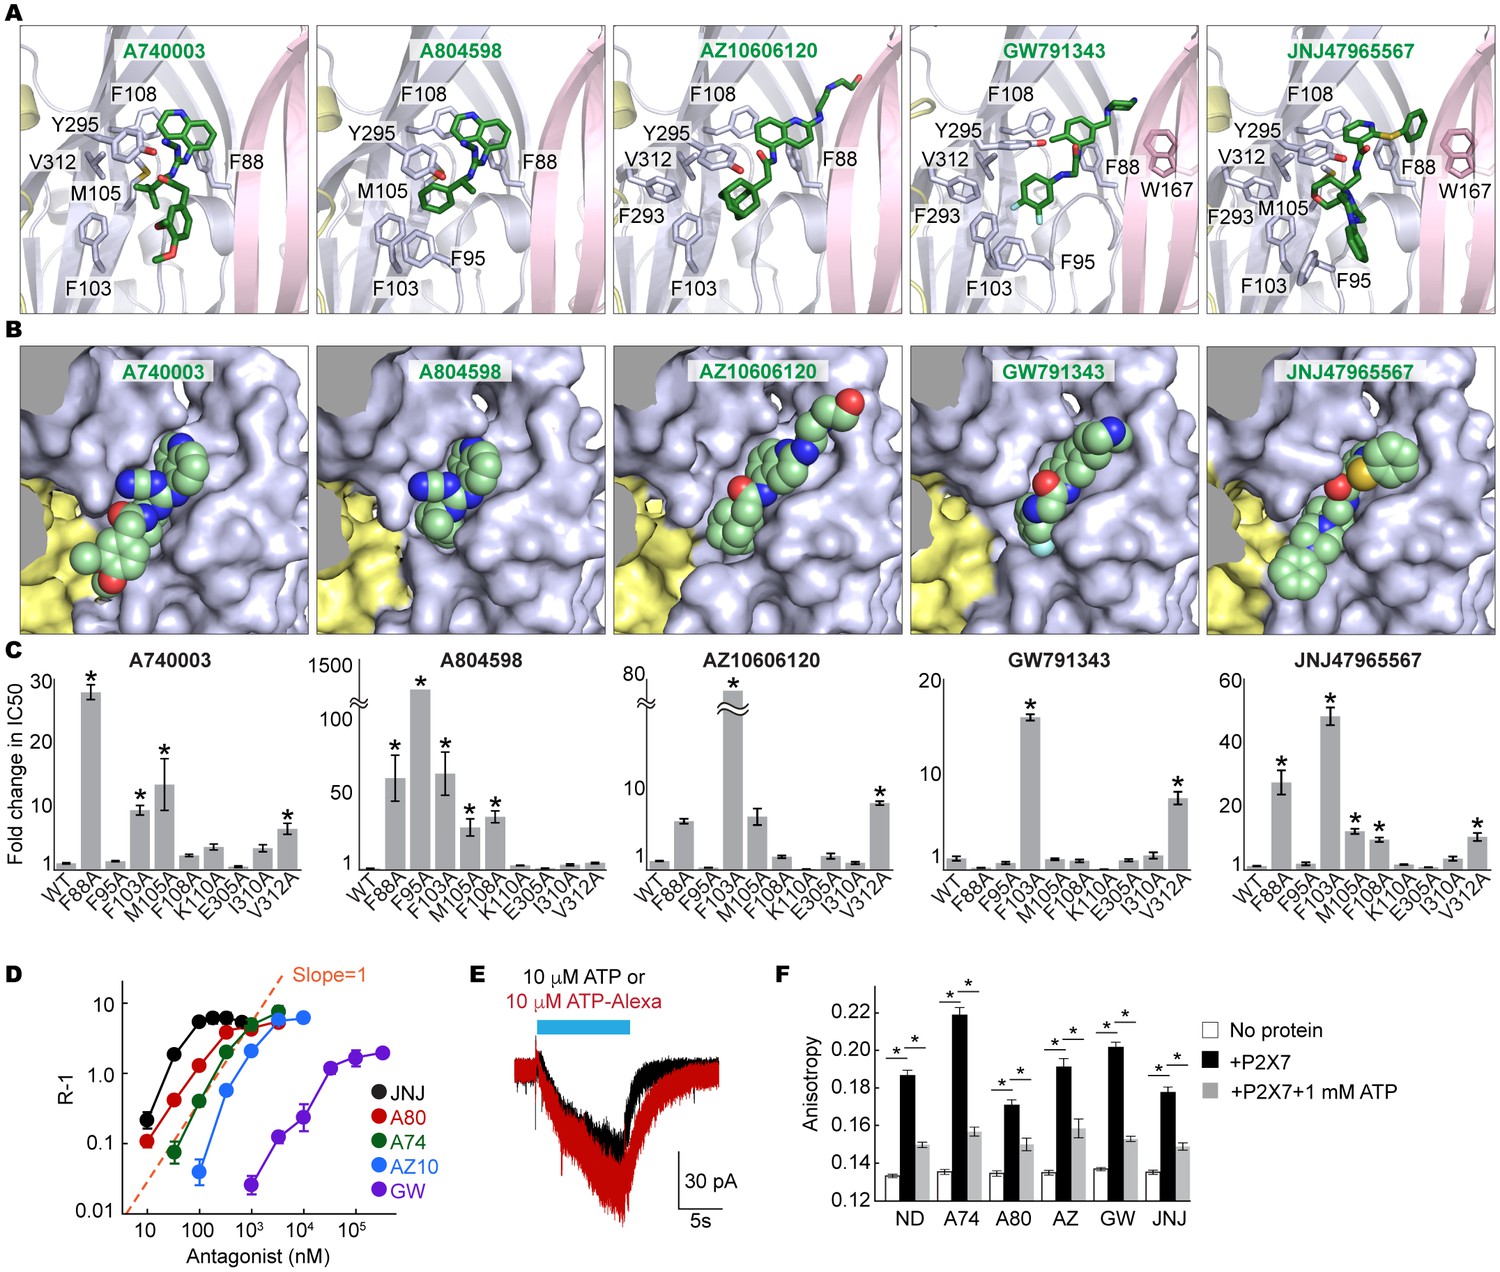
Coordination of the P2X7 specific antagonists.
(A) Stick representations of the indicated P2X7 specific antagonists (green) and the binding residues in the drug-binding pocket. Structural frame of each subunit is depicted as a cartoon representation in a different color. Oxygen atoms are shown in red and nitrogen atoms are shown in blue. (B) Surface representation of the drug-binding pocket with CPK sphere representation of each drug (green). Yellow and light blue surfaces represent two of the three subunits. The third subunit was omitted for clear representation. (C) Fold changes in IC50 values of the P2X7 specific inhibitors against the YO-PRO-1 uptake activity on alanine mutants of the drug coordinating residues. Increased IC50 values in some of the alanine mutants indicate that these residues bind to the P2X7 antagonists. (D) Schild plots against drug concentrations over a range of three orders of magnitude. Plots for all five of the different P2X7 specific antagonists are non-linear, supporting that these drugs work non-competitively. (E) Whole cell patch clamp recordings of the wildtype pdP2X7 triggered by 10 μM ATP (black) or 10 μM ATP-Alexa (red). The holding potential was −60 mV. (F) Fluorescence anisotropy derived from 10 μM ATP-Alexa without protein (white), with pdP2X7 (black), or with pdP2X7 in the presence of 1 mM ATP (grey). The concentration of pdP2X7 was 100 μM. Concentrations of the drugs were: A740003: 600 nM; A804598: 180 nM; AZ10606120: 2.3 μM; GW791343: 50 μM; JNJ47965567: 136 nM. The dots and the bars represent the means of five independent experiments and the error bars represent SEM. Asterisks indicate significant differences from wildtype or the no protein control (p<0.01) determined by one way ANOVA followed by Dunnett's test.
Figure 3—figure supplement 1
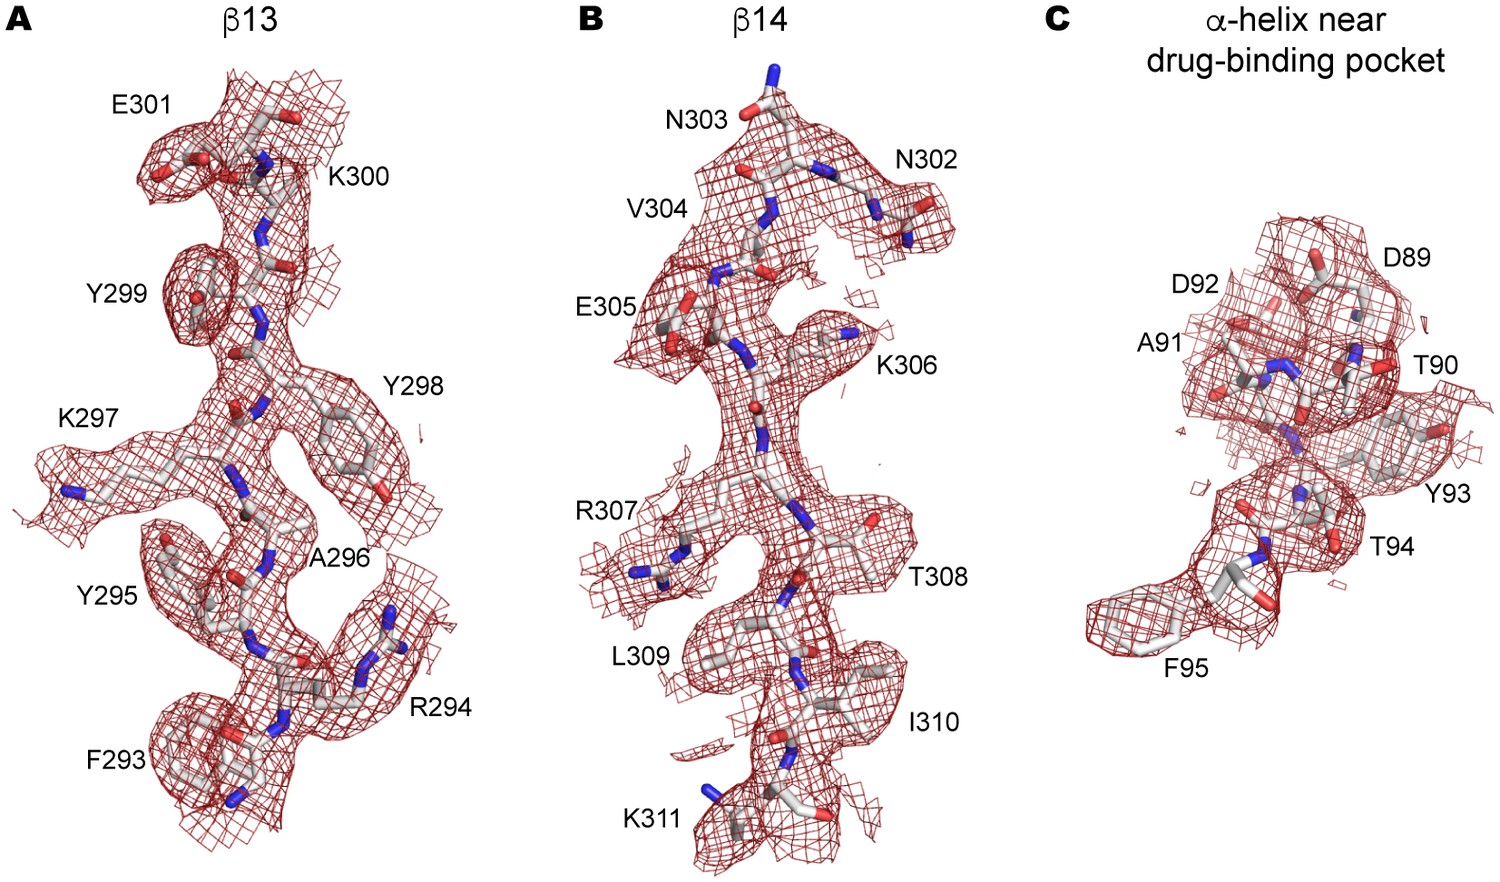
Side-chain electron density near the drug-binding pocket.
(A–C) 2Fo-Fc electron density map of the JNJ47965567-bound P2X7 structure contoured at σ = 1.0. Electron density of β13 (A) and β14 (B) in the upper body domain, and the α-helix near the drug-binding pocket (C) are shown in red. The amino acid residues are depicted as stick representations. Red represents oxygen and blue represents nitrogen.
Figure 3—figure supplement 2
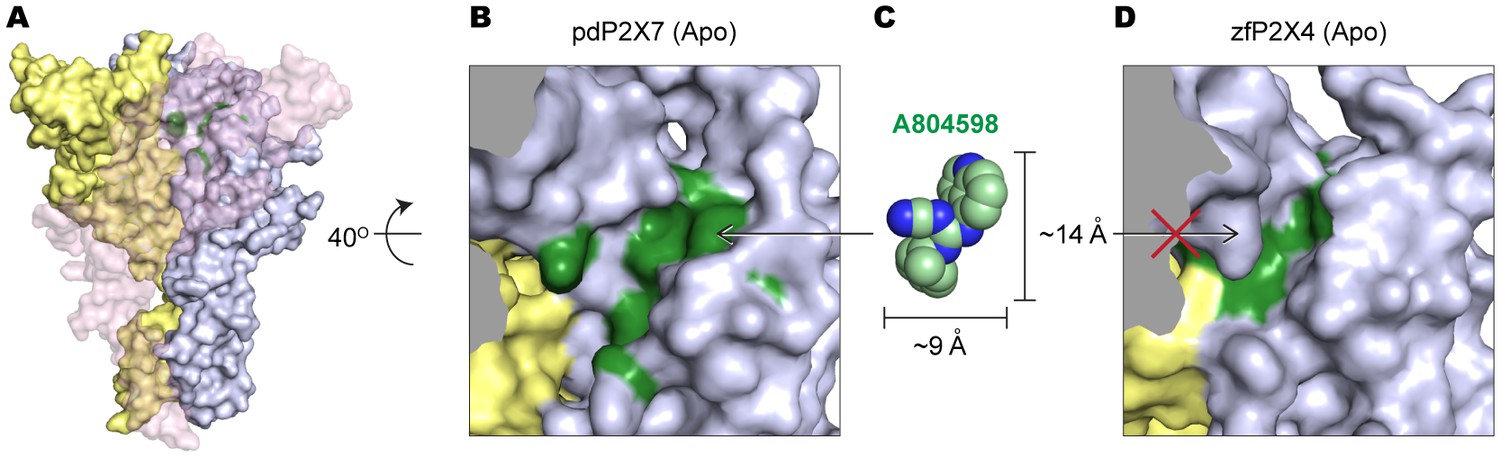
The equivalent position of the drug-binding pocket in the P2X4 receptor is too narrow for P2X7 antagonist to fit in.
(A) Surface representation of the apo pdP2X7 receptor viewed from the side. Light blue, yellow, and light pink represent each subunit. Green residues are the A804598 binding residues (F88, F95, F103, M105, F108 and Y295). Light pink subunit is presented as semi-transparent surface for visualizing the yellow and blue subunits. (B) Zoomed in drug-binding pocket of the pdP2X7 shown in (A). (C) CPK sphere representation of A804598 at the same magnification and orientation as the drug binding site shown in (B). (D) Equivalent pocket in apo zfP2X4. The green residues represent counterparts of the A804598 binding residues (W87, I94, F103, L105, M108, and F289).
Figure 3—figure supplement 3
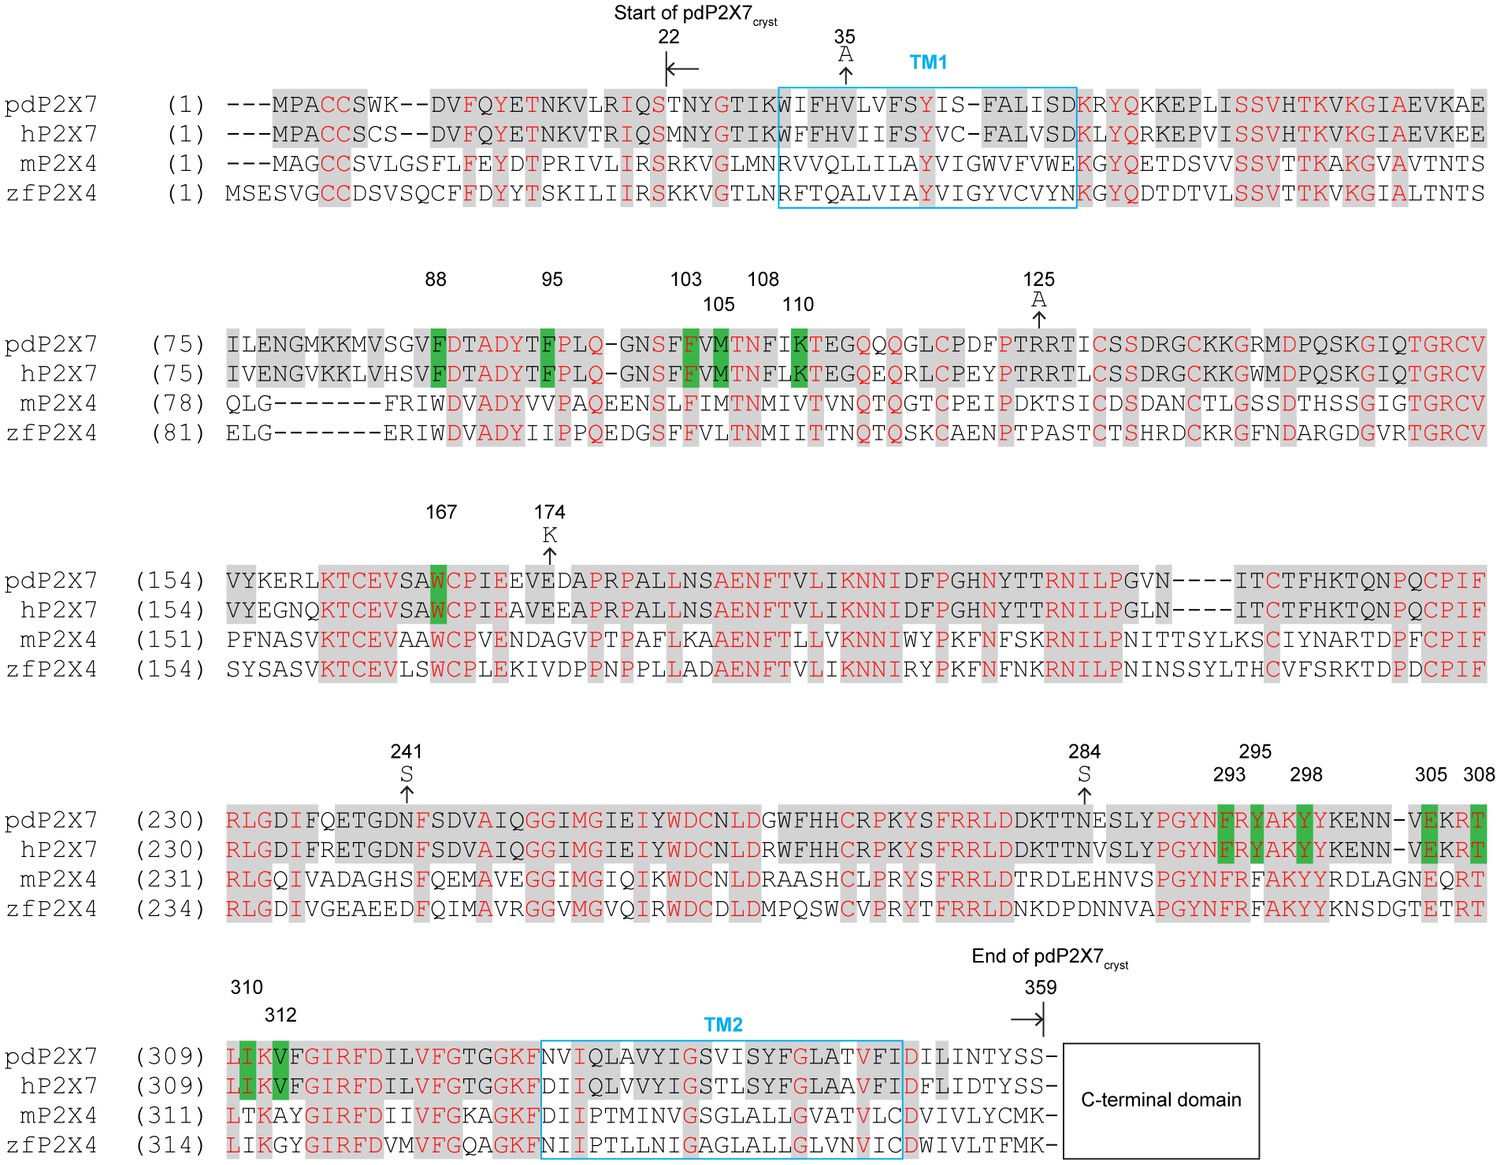
Sequence alignment of P2X7 and P2X4 receptors.
Amino acid sequences of the panda P2X7 (pdP2X7: XP_002913164.1), the human P2X7 (hP2X7: Q99572.4), the mouse P2X4 (mP2X4: NM_011026.3), and the zebrafish P2X4 (zfP2X4: AF317643.1). Starting and ending points of the pdP2X7cryst are indicated by arrows. The drug surrounding residues are highlighted in green. Mutations at N-linked glycosylation sites (N241S and N284S) and at crystal contact sites in the P42 crystal form (V35A, R125A, and E174K) are indicated. The C-terminal sequences beyond 359 AA are omitted for simplicity.
Figure 3—figure supplement 4
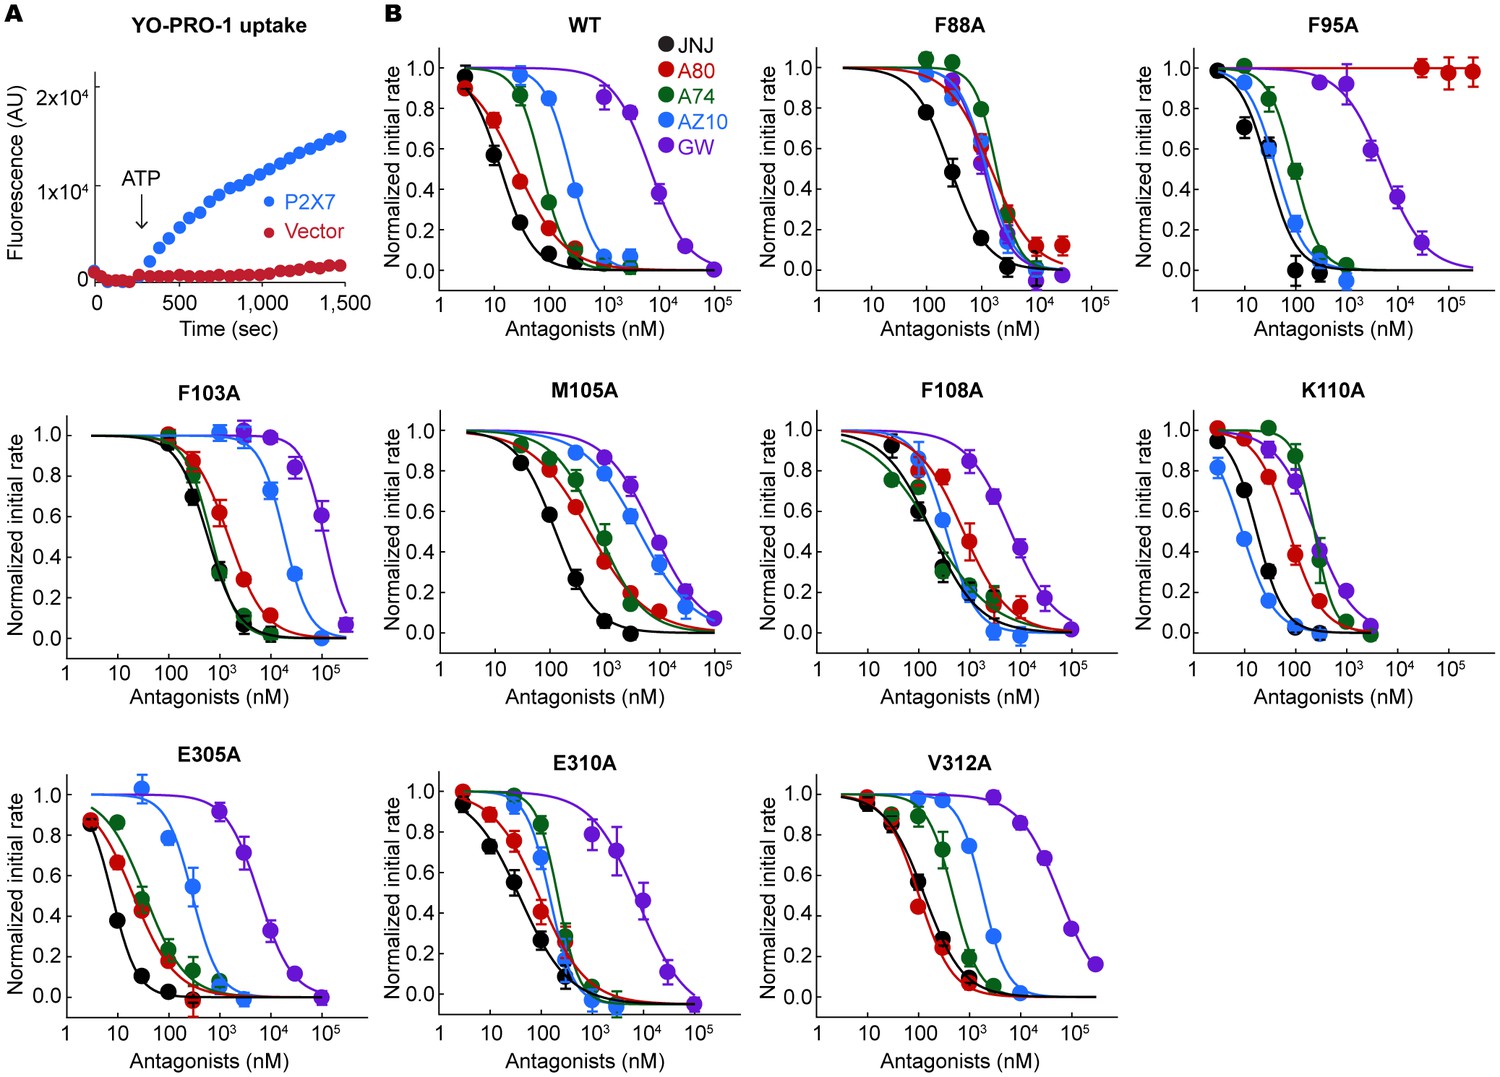
YO-PRO-1 uptake assays on the alanine mutants of the drug coordinating residues.
(A) pdP2X7 mediated YO-PRO-1 uptake triggered by 1 mM ATP (blue). Vector control (red) shows little accumulation of YO-PRO-1. (B) Dose responses of the wildtype and each alanine mutant for the five P2X7 specific antagonists are shown. YO-PRO-1 uptake was initiated with 1 mM ATP application. IC50 values are obtained by fitting the dose responses with the Hill equation. The circles represent the mean values of five independent experiments and the error bars represent SEM.
Figure 3—figure supplement 5
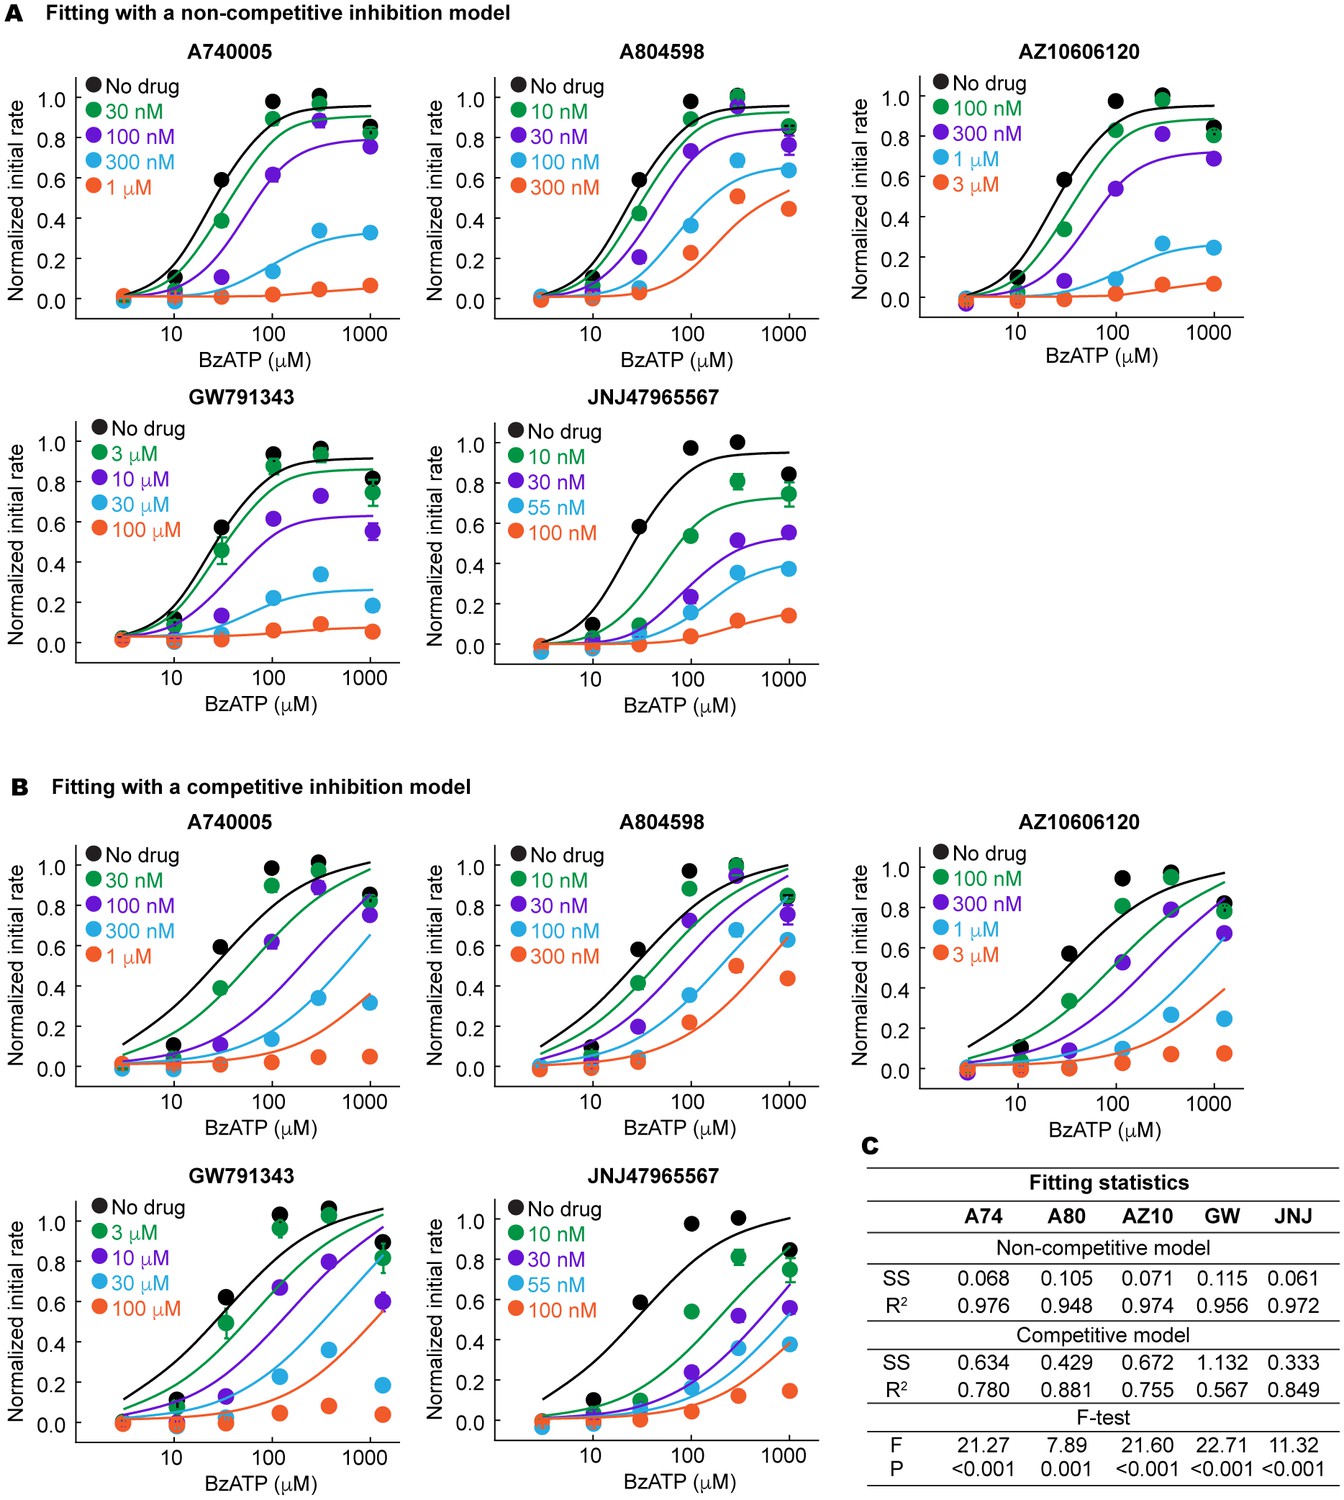
The P2X7 specific antagonists are allosteric non-competitive inhibitors.
(A) and (B) BzATP dose response of the wildtype pdP2X7 in the presence of different concentrations of antagonists. Normalized initial rates of YO-PRO-1 uptake are plotted and the dose response curves are fitted with a non-competitive (A) or competitive (B) inhibition model. The circles represent the means of five independent experiments and the error bars represent SEM. (C) Fitting statistics for the non-competitive and the competitive inhibition models. SS indicates the sum of squared difference. Both R-squared values and the p-values from the F-test support that the drugs used in this study are allosteric non-competitive inhibitors.
Figure 3—figure supplement 6
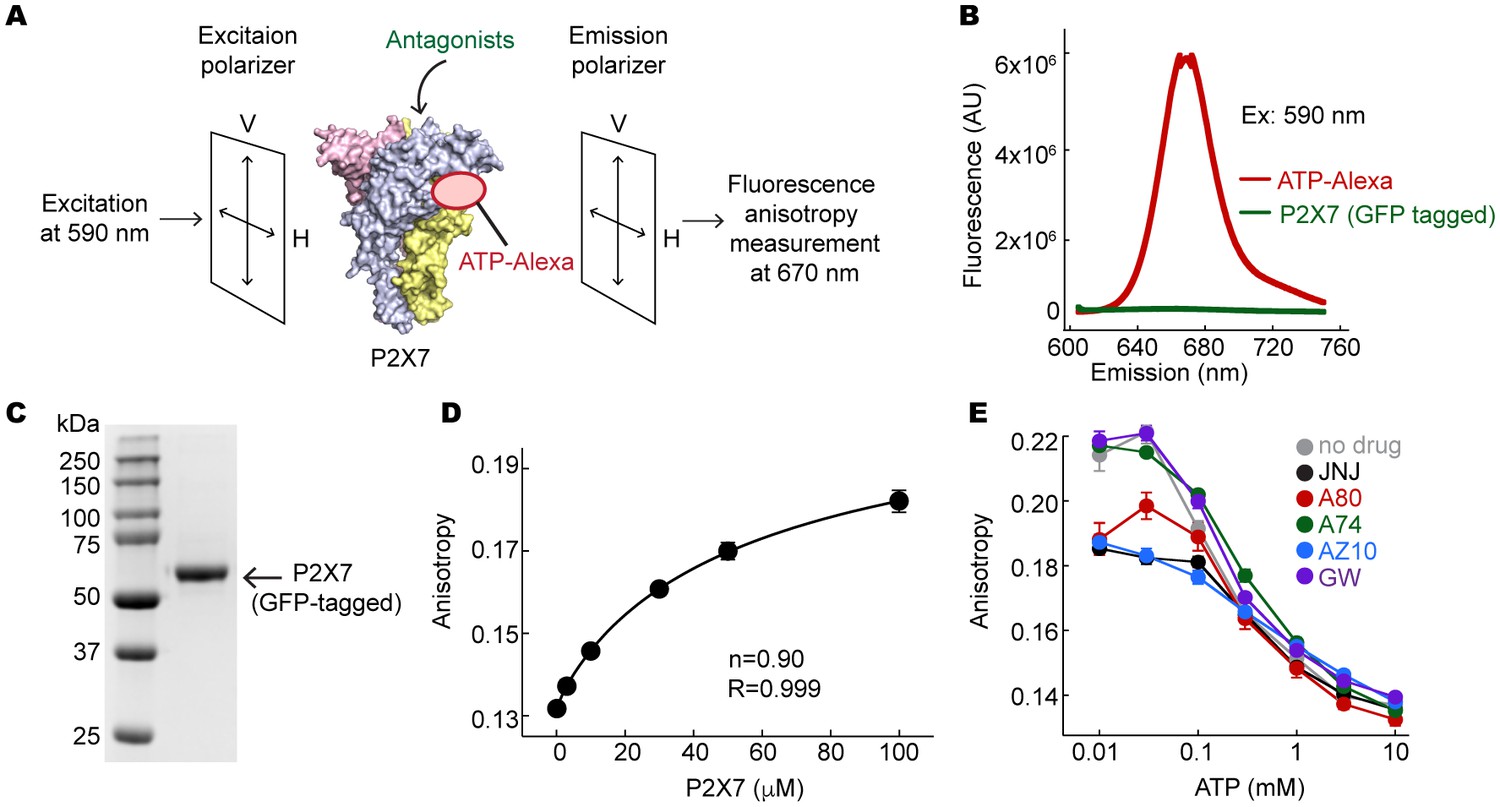
Fluorescent anisotropy experiments.
(A) Schematic representation of the fluorescence anisotropy experiment. (B) Fluorescence emission spectra for 10 μM ATP-Alexa (red) and 100 μM GFP-tagged pdP2X7cryst (green). Excitation wavelength was 590 nm. (C) An SDS-PAGE gel demonstrating that the GFP-tagged pdP2X7cryst is pure. (D) Fluorescence anisotropy plotted against concentrations of the pdP2X7. Polarized emission from 10 μM ATP-Alexa in response to binding to P2X7 was recorded and fitted with the Hill equation with the slope (n) of 0.90. (E) Fluorescent anisotropy decreases as ATP concentration increases, indicating that ATP and ATP-Alexa competes for binding to pdP2X7. Competitive binding of ATP supports that ATP-Alexa binds specifically at the ATP-binding pocket. The circles represent the mean values of five independent experiments and the error bars represent SEM.
Figure 4 with 1 supplement

Drug-binding pocket narrows during P2X7 activation.
(A) Cartoon representation of the turret formed by β13 and β14. P2X7 (apo), zfP2X4 (apo), and ATP-bound zfP2X4 are shown as the top (left) and the side (right) views. (B) Dot representations of the internal-space along the molecular threefold axis running through the center of the apo closed pdP2X7 (top), the apo closed zfP2X4 (4DW0; middle), and the ATP-bound zfP2X4 (4DW1; bottom). The dot plots are made using the HOLE program (Smart et al., 1996). Purple: > 2.3 Å; green: 1.15–2.3 Å; red: < 1.15 Å. (C) Central pore radii of the three P2X crystal structures shown in (B). (D) Surface representation of the residues in the drug-binding pocket tested for accessibility. (E) Whole cell patch clamp recordings of the wildtype pdP2X7 and the I310C mutant triggered by 1 mM ATP. MTS-TPAE (1 mM) was applied in the absence (left) or presence (right) of ATP for 10 s to probe the accessibility in the closed or open state, respectively. The membrane was held at −60 mV. (F) Normalized channel activities after MTS-TPAE treatment during the closed (grey) or open (black) states. The bars represent the means of five or more independent experiments (numbers above the bars indicate the n value) and the error bars represent SEM. Asterisks indicate significant differences from the widltype control (p<0.01) determined by one way ANOVA followed by Dunnett's test.
Figure 4—figure supplement 1
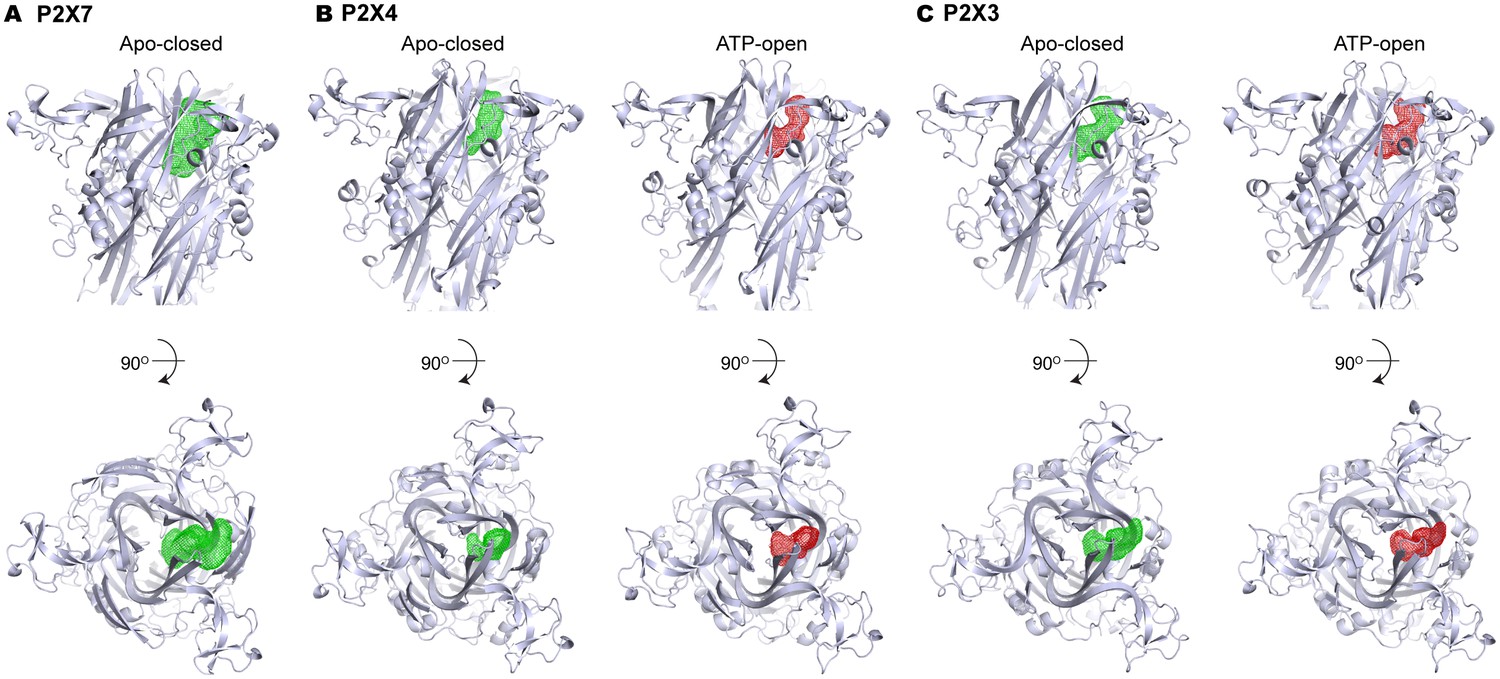
Volume of the P2X7 drug-binding pocket is larger than the corresponding clefts in P2X3 or P2X4.
(A–C) Volumes of the drug-binding pocket in P2X7 (A), and equivalent regions in P2X4 (B) and P2X3 (C) are depicted as mesh representation based on the filled water molecules using HOLLOW (Ho and Gruswitz, 2008). Green mesh represents the volume in apo, closed state and the red mesh represents the volume in ATP-bound, open state. Side view (upper panel) and the top view (lower panel) include cartoon representation of the corresponding P2X structures to locate the cleft.
Figure 5 with 1 supplement
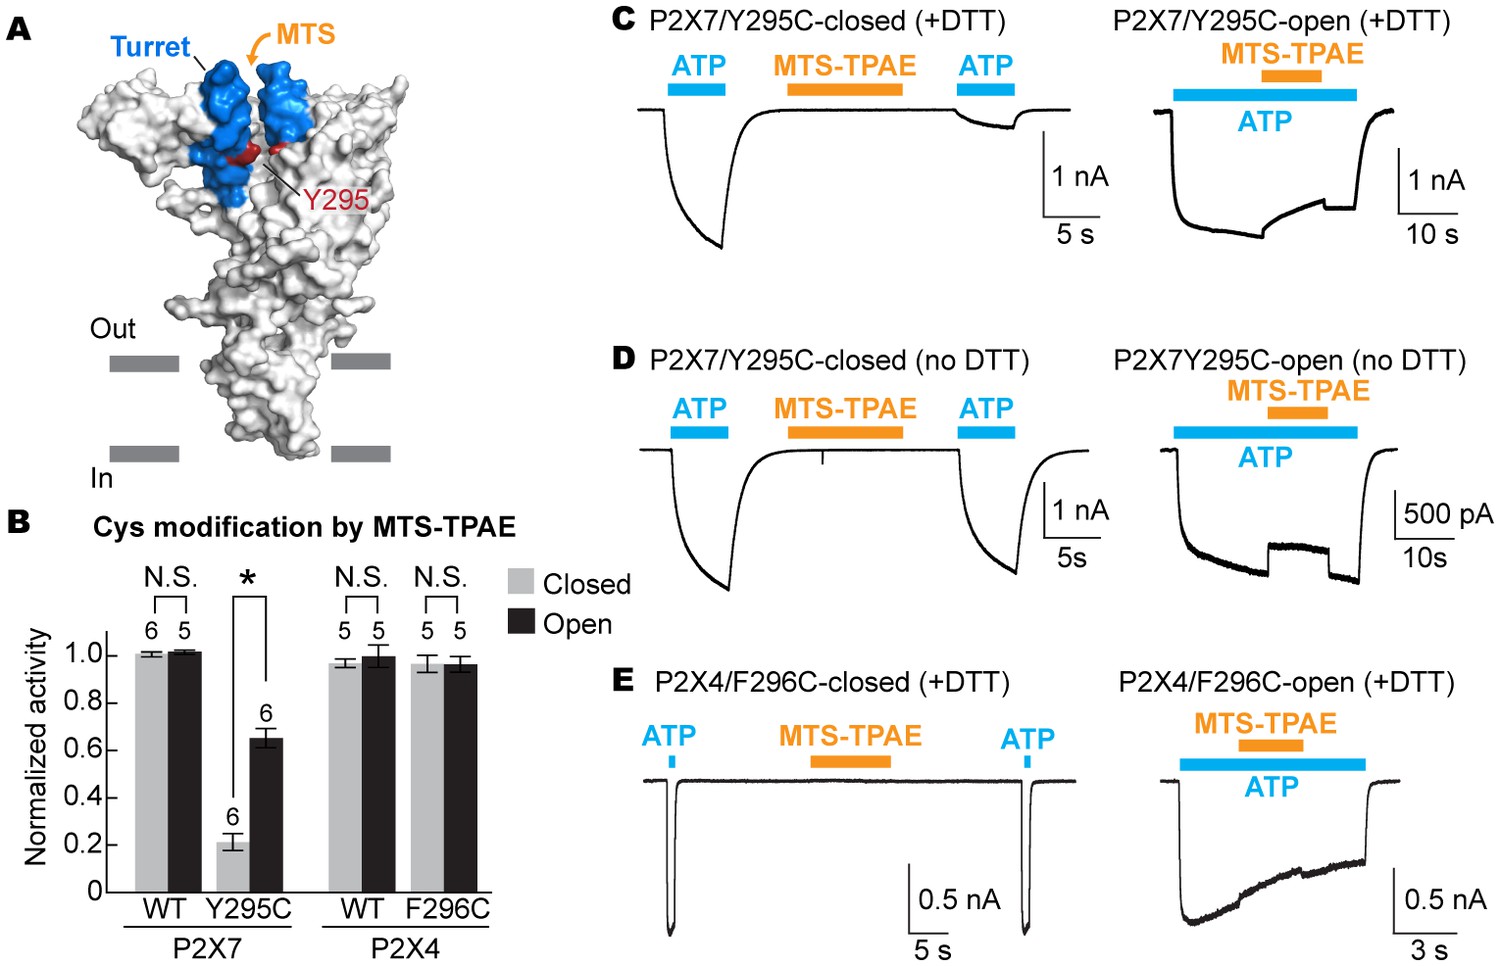
The turret closes during P2X7 activation.
(A) Surface representation of the P2X7 receptor viewed from the side highlighting the location of Y295 (red) facing the center of the turret (blue). Only two of the three subunits are shown for clarity. (B) Summary of MTS-TPAE accessibility. Normalized channel activities after MTS-TPAE treatment indicate that Y295C in P2X7 is more accessible in the closed state than in the open state. The bars represent the means of more than five independent experiments (numbers above the bars indicate the n value) and the error bars represent SEM. Asterisk indicates significant difference in normalized channel activity between the cells treated with MTS-TPAE in the closed and in the open states (p<0.01) determined by Dunnett's test. N.S. indicates not significant. (C) and (D) Whole cell patch clamp recordings of the P2X7/Y295C mutant triggered by 1 mM ATP. MTS-TPAE (100 μM) was applied in the absence (left) or presence (right) of ATP for probing the accessibility in the closed or open state, respectively. Cells were used before (D) or after treating with 10 mM DTT for 5 min (C). Membrane was held at −60 mV. (E) Whole cell patch clamp recordings of the P2X4/F296C mutant triggered by 10 μM ATP. Cells were treated with 10 mM DTT for 5 min before recordings.
Figure 5—figure supplement 1
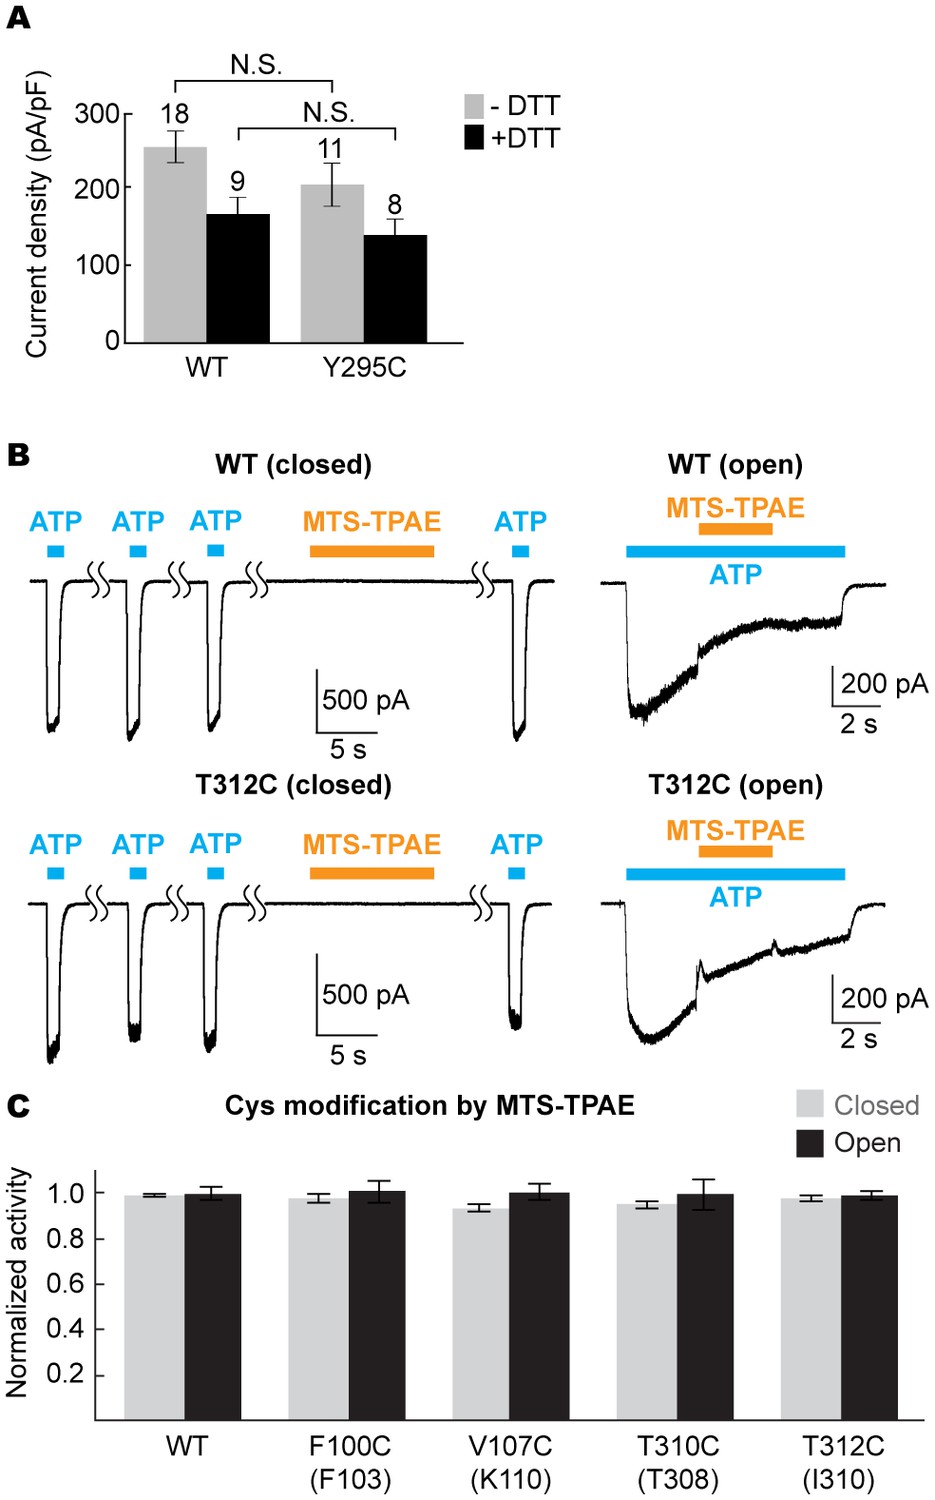
The equivalent position of the drug-binding pocket in the P2X4 receptor is not accessible.
(A) Current densities of the pdP2X7 wildtype (left) and the Y295C mutant (right) in the absence (gray) or presence (black) of 10 mM DTT. Currents were obtained by whole cell patch clamp recordings triggered by 1 mM ATP. Membrane potential was held at −60 mV. The bars represent the means (numbers above the bars indicate the n value) and the error bars represent SEM. N.S. indicates there is no significant difference between the wildtype and Y295C (p=0.216 without DTT; p=0.389 with DTT) by the t-test. (B) Whole cell patch clamp recordings of the wildtype mouse P2X4 (mP2X4) and the T312C mutant triggered by 10 μM ATP (closed state) or 5 μM ATP (open state). MTS-TPAE (1 mM) was applied in the absence (left) or presence (right) of ATP to probe the accessibility in the closed or open state. The membrane was held at −60 mV. (C) Normalized channel activities after MTS-TPAE treatment in the closed (grey) or open (black) states. Residues in parenthesis indicate the counterpart residues in pdP2X7, whose cysteine mutants exhibit current reduction by MTS-TPAE application in the closed state. The bars represent the means of five or more independent experiments (numbers above the bars indicate the n value) and the error bars represent SEM. There was no statistically significant differences from the widltype control (p>0.05) judged by one way ANOVA followed by Dunnett's test.
Figure 6 with 1 supplement
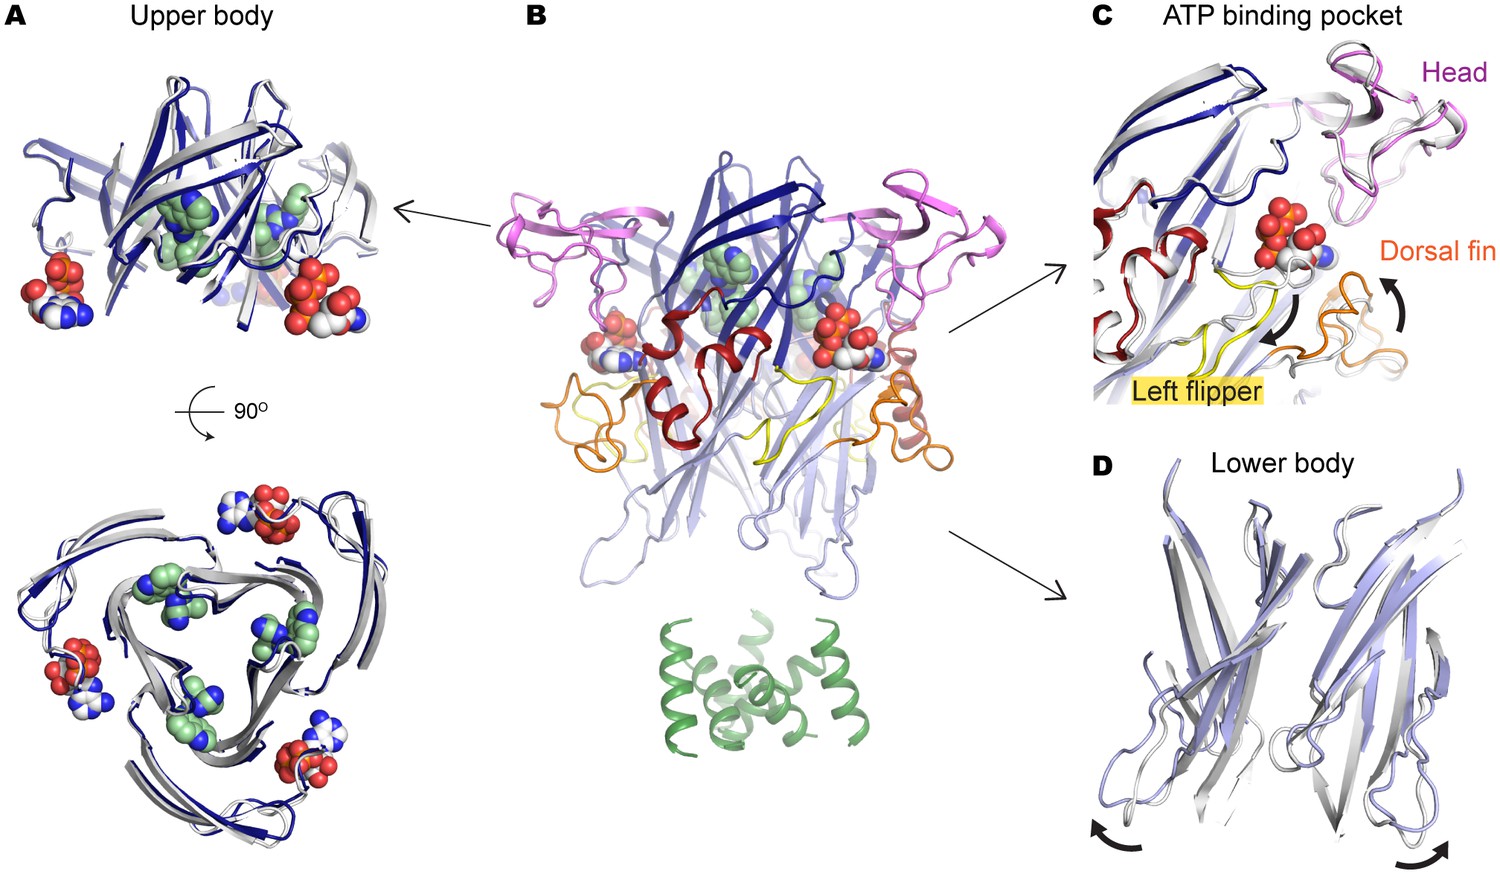
A804598 prevents conformational changes in the upper body domain triggered by ATP-binding.
(A) Cartoon representations indicate little conformational change upon ATP-binding in the upper body domain. Each domain of the ATP/A804598-bound P2X7 is colored according to Figure 2 and the overall structure is shown in (B). Apo P2X7 structure is presented in gray for comparison (A, C and D). (C) and (D) ATP-binding evokes conformational rearrangement in the ATP-binding pocket (C) and in the lower body domain (D). The arrows highlight the direction of the domain movement upon ATP binding.
Figure 6—figure supplement 1
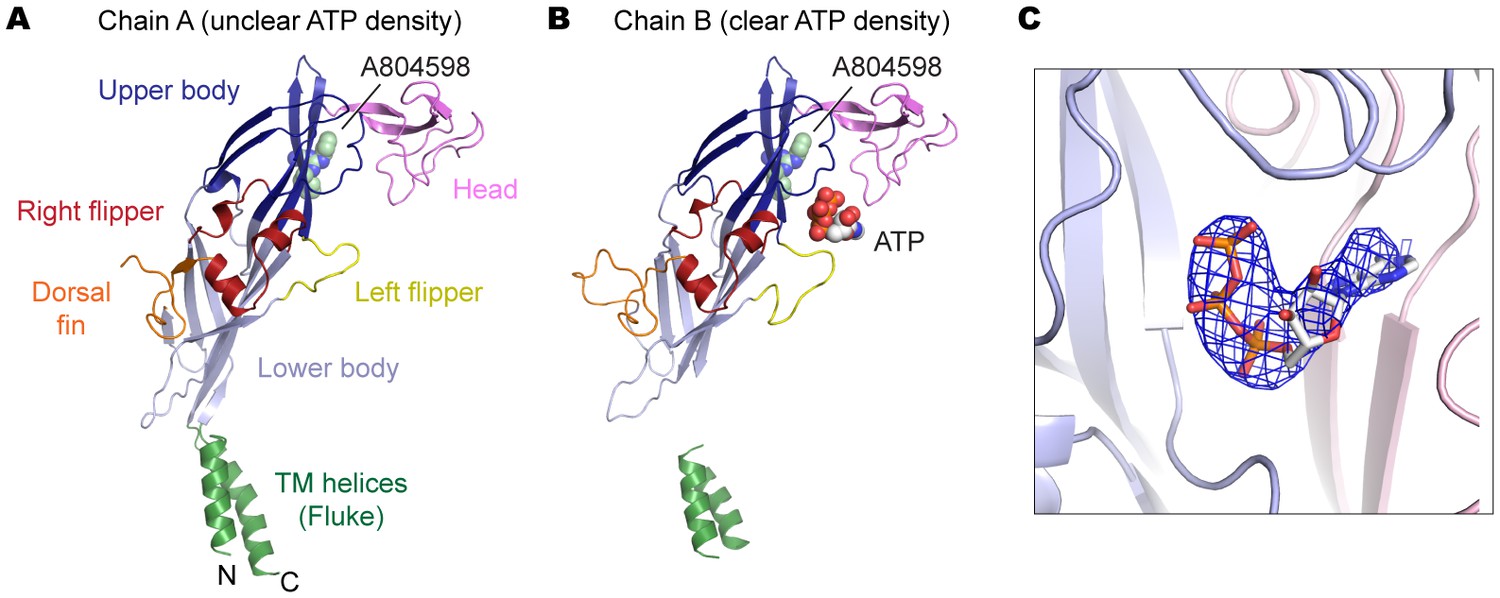
P2X7 structure in the ATP/A804598-bound state.
(A) and (B) Cartoon representations of the two protomers in the asymmetric unit. Clear ATP density was observed in chain B (B) but not in chain A (A). (C) Fo-Fc map (contoured at σ = 3.0) around the ATP molecule in chain B.
Figure 7
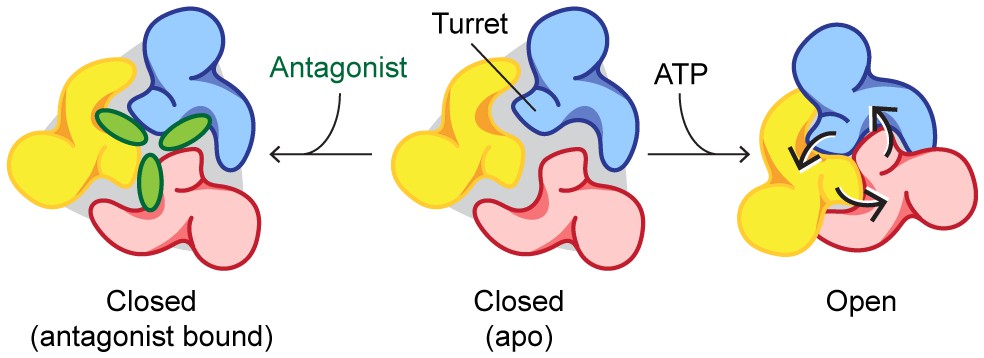
Mechanisms of P2X7 activation and inhibition.
Schematic representations of the P2X7 receptor viewed from the top. Each color represents a different subunit. The drug-binding pocket and the turret narrow during channel activation. P2X7 specific antagonists stabilize its closed conformation by preventing the movement of these inter-subunit cavities.
Videos
Video 1
Electron density of the drug-coordinating residues.
2Fo-Fc electron density map of the JNJ47965567-bound P2X7 structure contoured at σ = 1.0. Electron density is shown as mesh in firebrick red. JNJ47965567 (green) and amino acid residues (white) are depicted as stick representations. Red represents oxygen and blue represents nitrogen.
Video 2
Conformational differences between the apo and ATP/A804598-bound P2X7 structures.
Each domain of the ATP/A804598-bound P2X7 is colored according to Figure 2. ATP and A804598 molecules are presented as CPK spheres.
Tables
Table 1
IC50 value of each P2X7 inhibitor from the YO-PRO-1 uptake assay.
Inhibitor | A740003 | A804598 | AZ10606120 | GW791343 | JNJ47965567 |
|---|---|---|---|---|---|
IC50 | 69.3 nM | 21.7 nM | 231 nM | 8.9 μM | 11.9 nM |
Table 2
Data collection and refinement statistics.
pdP2X7cryst | pdP2X7cryst-JNJ47965567 | pdP2X7cryst-A740003 | pdP2X7cryst-A804598 | pdP2X7cryst-AZ10606120 | pdP2X7cryst-GW791343 | pdP2X7cryst-ATP/A804598 | |
|---|---|---|---|---|---|---|---|
Data collection | |||||||
Space group | I213 | I213 | I213 | I213 | I213 | I213 | P213 |
Cell dimensions | |||||||
a, b, c (Å) | 169.1, 169.1, 169.1 | 169.3, 169.3, 169.3 | 169.6, 169.6, 169.6 | 170.4, 170.4, 170.4 | 170.7, 170.7, 170.7 | 169.7, 169.7, 169.7 | 167.6, 167.6, 167.6 |
α, β, γ (°) | 90, 90, 90 | 90, 90, 90 | 90, 90, 90 | 90, 90, 90 | 90, 90, 90 | 90, 90, 90 | 90, 90, 90 |
Resolution (Å) | 45.2–3.40 (3.52–3.40)* | 45.3–3.20 (3.31–3.20)* | 42.4–3.61 (3.73–3.61)* | 42.6–3.40 (3.52–3.40)* | 42.7–3.50 (3.63–3.50)* | 45.4–3.30 (3.42–3.30)* | 46.5–3.90 (4.04–3.90)* |
Rmerge | 0.099 (1.80) | 0.12 (0.95) | 0.23 (1.71) | 0.15 (1.49) | 0.17 (2.21) | 0.12 (1.72) | 0.12 (2.17) |
I/σ | 17.9 (1.30) | 13.4 (2.90) | 13.2 (1.65) | 11.0 (1.71) | 11.01 (1.16) | 12.55 (1.34) | 15.7 (1.25) |
Completeness (%) | 99.8 (98.8) | 100 (100) | 100 (100) | 100 (100) | 100 (100) | 99.8 (99.4) | 99.8 (99.2) |
Redundancy | 9.8 (9.9) | 10.1 (10.4) | 11.0 (11.0) | 10.1 (10.0) | 10.1 (9.9) | 10.1 (10.2) | 10.0 (10.3) |
Refinement | |||||||
Resolution (Å) | 45.2–3.40 | 45.3–3.20 | 42.4–3.61 | 42.6–3.40 | 42.7–3.50 | 45.4–3.30 | 46.5–3.90 |
No. reflections | 11,197 | 13,482 | 9,510 | 11,474 | 10,598 | 12,383 | 14,510 |
Rwork/Rfree (%) | 24.2/26.3 | 22.3/26.7 | 23.2/26.0 | 25.0/27.3 | 24.5/26.8 | 24.0/27.1 | 33.4/38.6 |
No. atoms | 2304 | 2473 | 2384 | 2439 | 2454 | 2382 | 4116 |
Protein | 2276 | 2382 | 2307 | 2359 | 2367 | 2313 | 3967 |
Ligand/ion | 28 | 91 | 77 | 80 | 87 | 69 | 149 |
B-factors | 124.4 | 103.6 | 97.8 | 97.5 | 114.9 | 119.0 | 149.3 |
Protein | 123.8 | 102.9 | 97.1 | 96.8 | 114.5 | 118.5 | 149.1 |
Ligand/ion | 171.1 | 124.1 | 120.6 | 118.3 | 128.0 | 137.4 | 153.2 |
R.M.S deviations | |||||||
Bond lengths (Å) | 0.002 | 0.004 | 0.003 | 0.003 | 0.004 | 0.004 | 0.001 |
Bond angles (°) | 0.49 | 0.69 | 0.62 | 0.64 | 0.68 | 068 | 0.45 |
-
*Highest resolution shell is shown in parenthesis.
Download links
A two-part list of links to download the article, or parts of the article, in various formats.
Downloads (link to download the article as PDF)
Open citations (links to open the citations from this article in various online reference manager services)
Cite this article (links to download the citations from this article in formats compatible with various reference manager tools)
Structural basis for subtype-specific inhibition of the P2X7 receptor
eLife 5:e22153.
https://doi.org/10.7554/eLife.22153


