Landscape of histone modifications in a sponge reveals the origin of animal cis-regulatory complexity
- University of Queensland, Australia
Figures
Figure 1 with 4 supplements
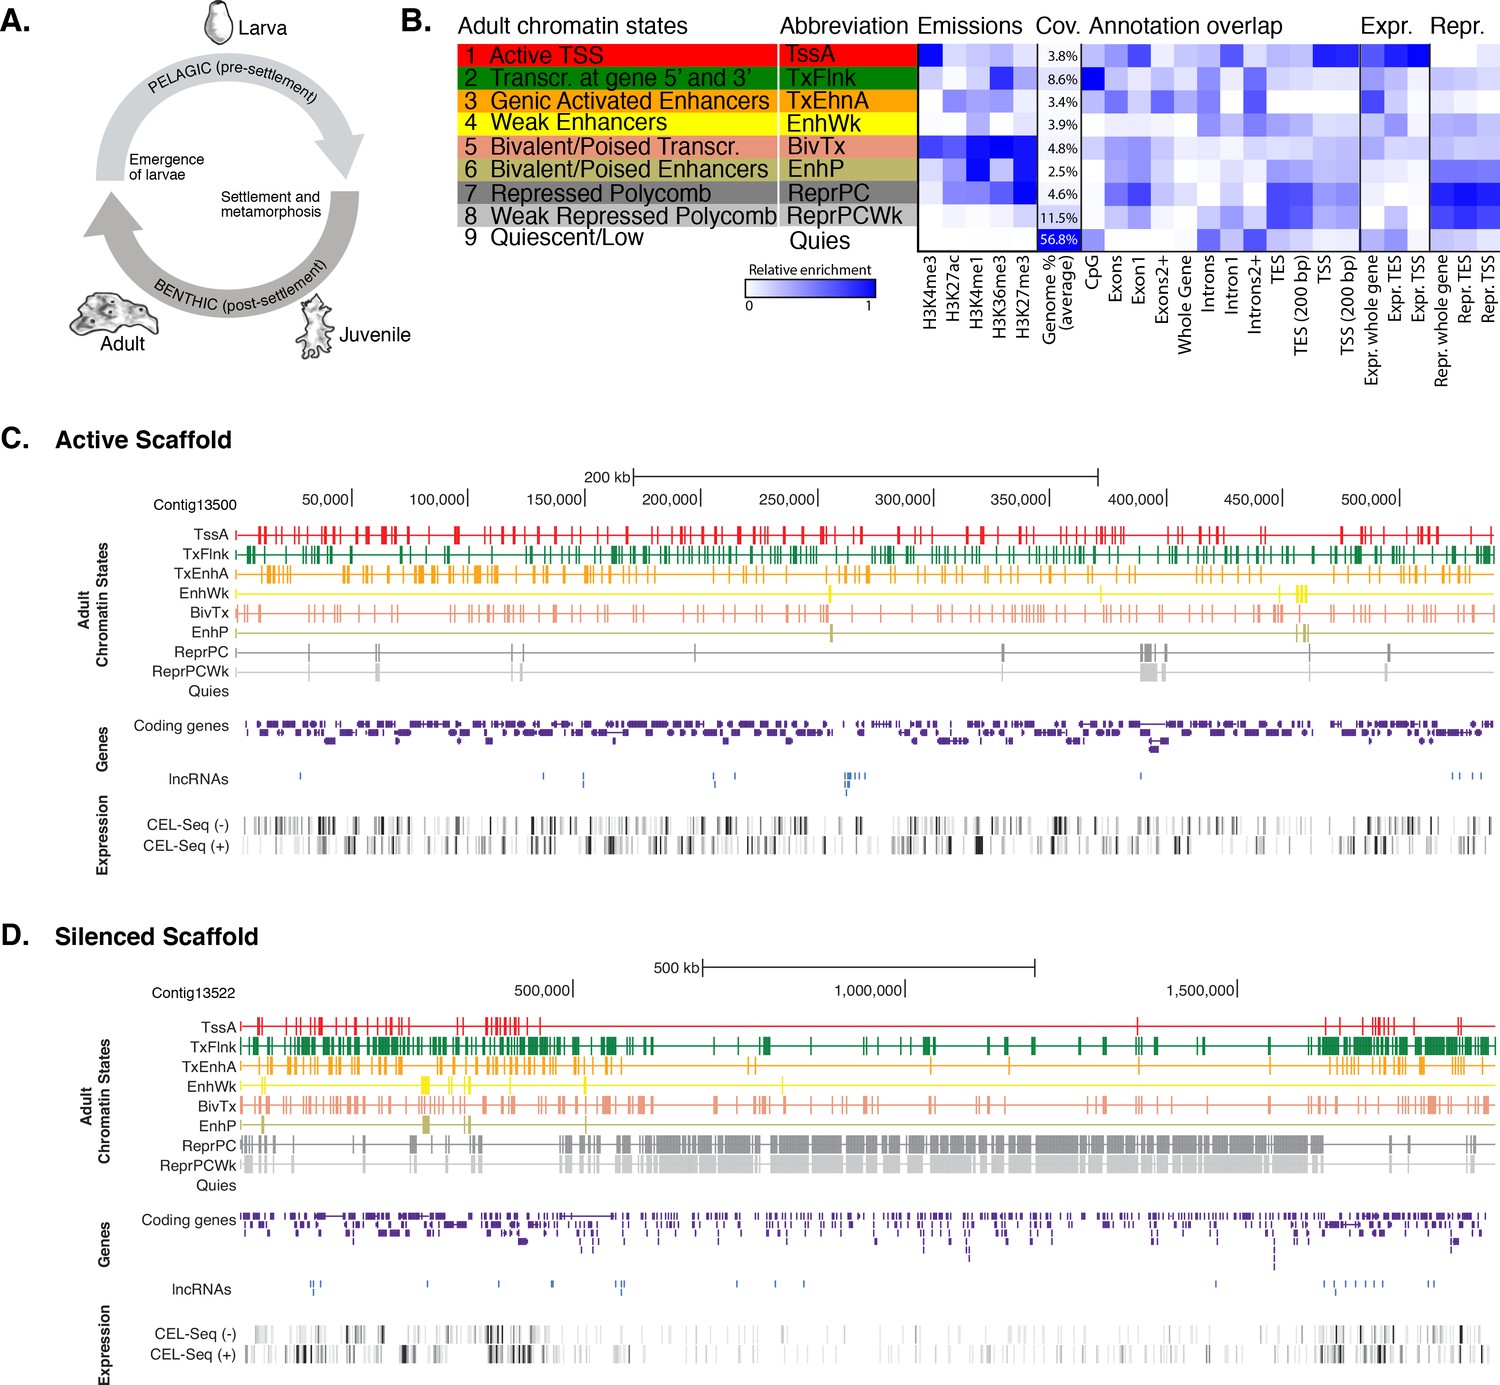
Chromatin states in Amphimedon.
(A) Schematic representation of Amphimedon life cycle. Larvae (oval shaped, 300–500 µm long) emerge from maternal brood chambers and then swim in the water column before they develop competence to settle and initiate metamorphosis into a juvenile. The juvenile body plan, which displays the hallmarks of the adult body plan, including an aquiferous system with canals, choanocytes chambers and oscula, is the outcome of the dramatic reorganization of the radially-symmetrical, bi- or trilayered larva. This juvenile will then grow and mature into a benthic adult (ranging from 10–30 cm3) (Degnan et al., 2015; Edgar et al., 2002). (B) Definition and enrichments for a 9-state Hidden Markov Model based on five histone PTMs (H3K4me3, H3K27ac, H3K4me1, H3K36me3 and H3K27me3) in adult Amphimedon. From left to right: chromatin state definitions, abbreviations, histone PTM probabilities, genomic coverage, protein-coding gene functional annotation enrichments, expressed (Expr.) and repressed (Repr.) protein-coding gene enrichments. Blue shading indicates intensity, scaled by column. (C) Adult chromatin state annotations on gene rich highly transcribed (active) scaffold (contig13500) showing the predominance of ‘TssA’, ‘TxFlnk’, and ‘TxEnhA’ states. For the definition of chromatin states see panel (A). Coding genes (purple) and long non-coding RNAs (blue) are shown, along with signal coverage tracks showing CEL-seq expression in adult. A grey scale indicates CEL-seq expression level: white (no-expression); black (highest expression). (D) Adult chromatin state annotations on a predominantly silenced scaffold (contig13522 from 500,000 to 1,500,000 bp) showing the prevalence of ‘ReprPC’ and ‘ReprPCWk’ states. For the definition of chromatin states see panel (A). Coding genes (purple) and long non-coding RNAs (blue) are shown, along with signal coverage tracks showing CEL-seq expression in adult. A grey scale indicates CEL-seq expression level: white (no-expression); black (highest expression).
-
Figure 1—source data 1
Histone H3 covalent post-translation modifications and RNA Polymerase II investigated in this study and their typical genomic localization relative to coding genes and regulatory regions in bilaterian model organisms.
- https://doi.org/10.7554/eLife.22194.004
-
Figure 1—source data 2
Histone H3 sequences used to generate Figure 1—figure supplement 1.
- https://doi.org/10.7554/eLife.22194.005
-
Figure 1—source data 3
BLASTp search outcome of the relevant histone methyltransferases and acetyltransferases against Amphimedon queenslandica proteins (NCBI nr database; E-value <1e-09).
- https://doi.org/10.7554/eLife.22194.006
-
Figure 1—source data 4
Summary statistics and quality metrics of the ChIP-seq datasets used in this study.
See also Materials and methods for preprocessing of ChIP-seq datasets procedure.
- https://doi.org/10.7554/eLife.22194.007
-
Figure 1—source data 5
Validation of the ChIP-seq results by ChIP-quantitative PCRs (ChIP-qPCRs).
- https://doi.org/10.7554/eLife.22194.008
Figure 1—figure supplement 1
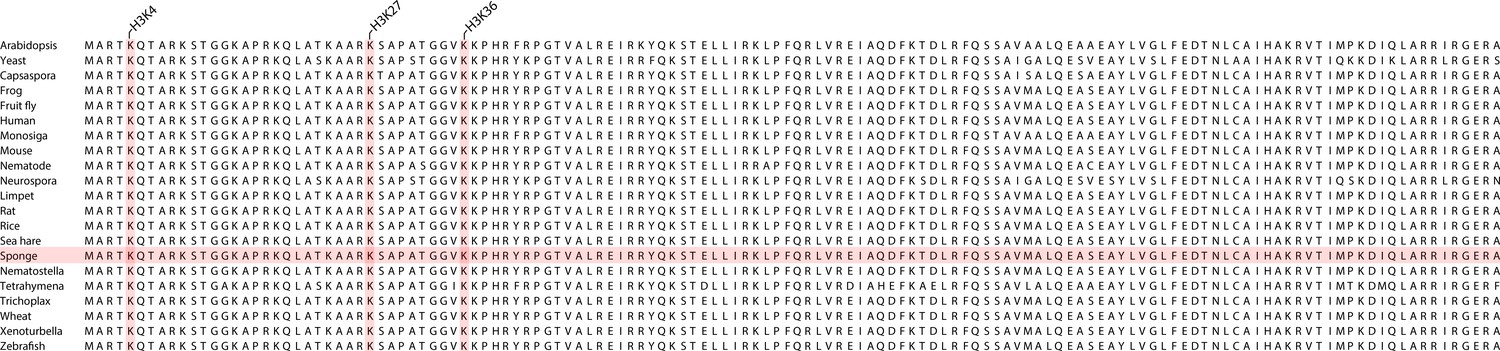
Multiple sequence alignment of various eukaryotic histone H3 proteins (1–136 amino acids), produced by using ClustalO (RRID:SCR_001591) (Sievers et al., 2011).
Note that the entire amino acid sequence of histone H3 is highly conserved across eukaryotes. Sponge sequence is highlighted. The amino acid sequences used to generate the alignment are also provided in Figure 1—source data 2.
Figure 1—figure supplement 2
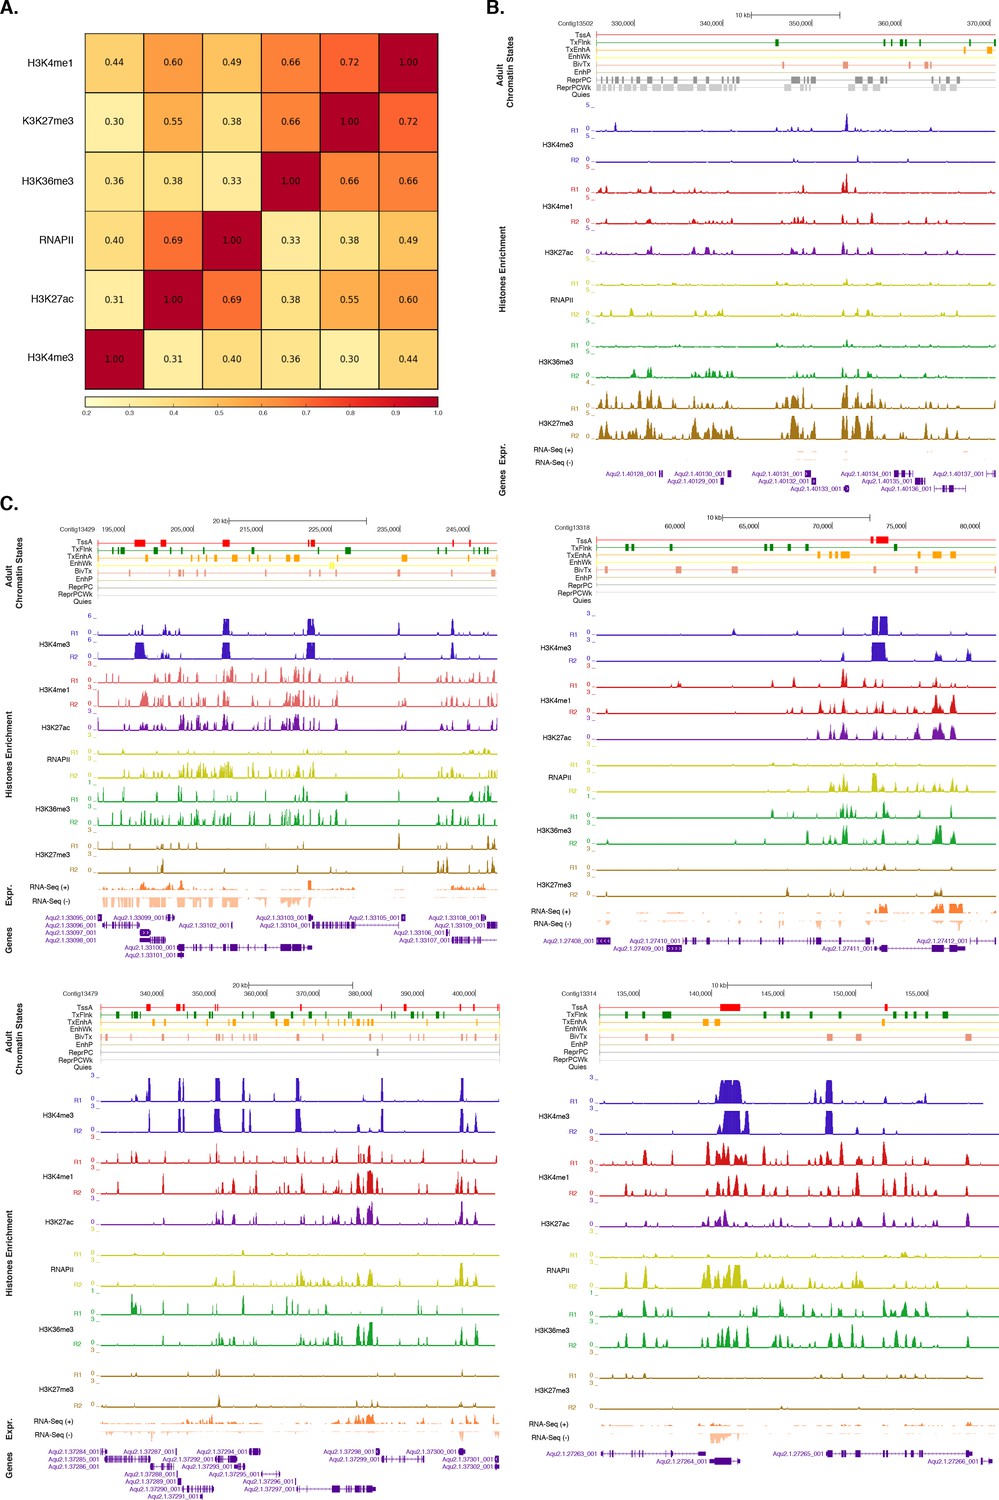
Assessment of reproducibility for biological replicates between histone modifications andRNA Polymerase II.
(A) Pearson correlation coefficients between histone modifications and RNA Polymerase II (RNAPII). Adult experiments (combined biological replicates) are shown. Underlying colors indicate the similarity between the different datasets. Note that H3K36me3 was flagged for low signal to noise, potentially explaining the somewhat high correlation with H3K27me3 (see Figure 1—source data 4). However, this does not affect the conclusions of the paper in any way. (B) Adult chromatin state annotations on a predominantly silenced region. For the definition of chromatin states see Figure 1A. Coding genes (purple) are shown, along with input DNA-normalized coverage of each biological replicate (R1 and R2) of different histone modifications and RNA-seq expression. (C) Same as (B) for highly transcribed regions. Apart from RNAPII replicate 1, which did not pass the quality threshold required so it has been excluded from all further analyses (see Figure 1—source data 4), we obtained highly reproducible data sets.
Figure 1—figure supplement 3
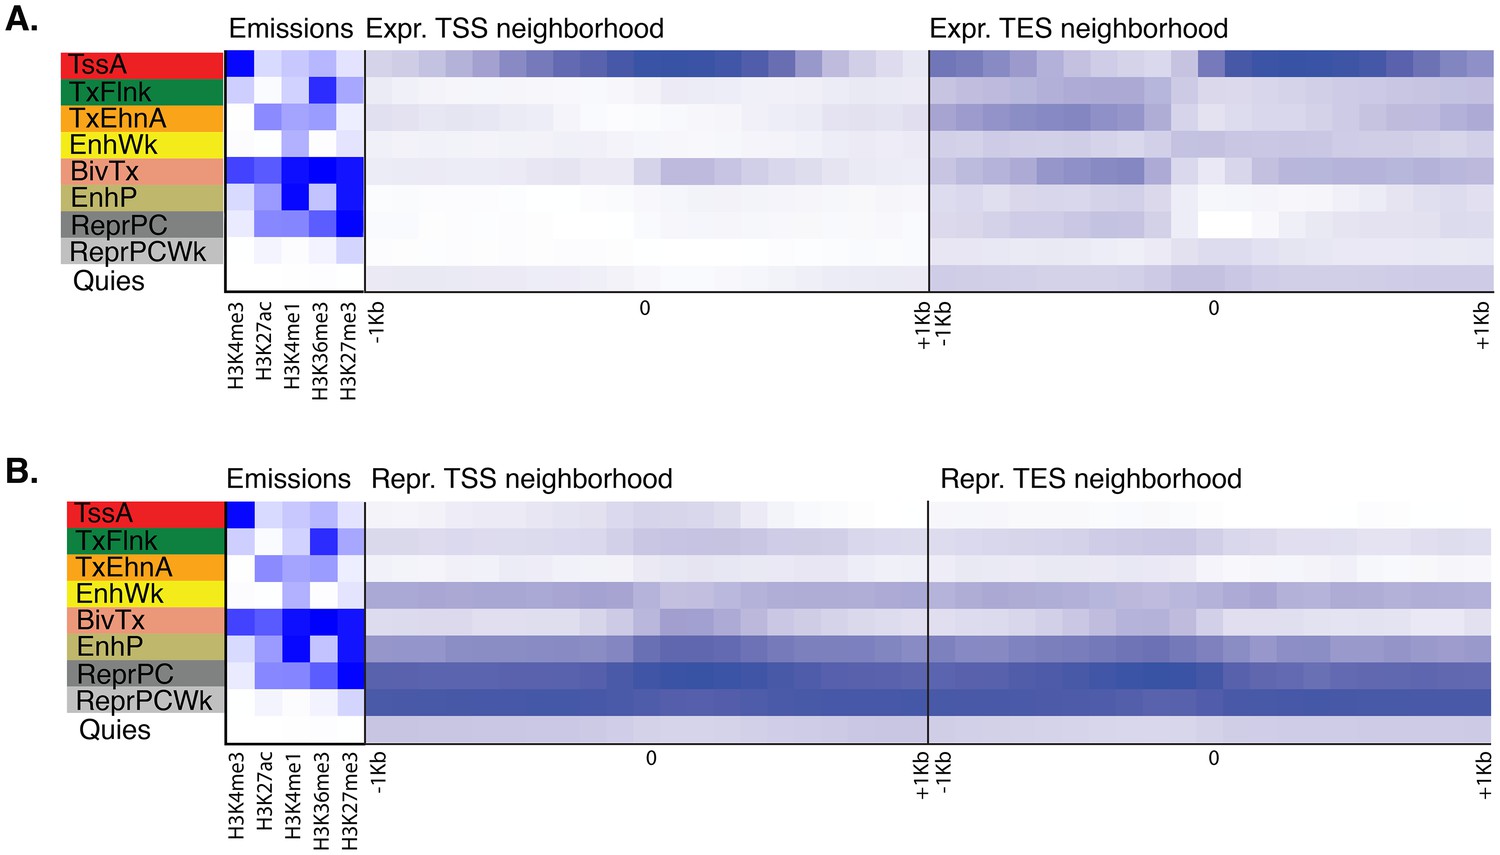
Neighborhood positional enrichment plots of adult chromatin states around transcription start site (TSS) and transcription end site (TES) of proteins-coding genes, produced by ChromHMM (Ernst and Kellis, 2012).
For the definition of adult chromatin states see Figure 1A. (A) Positional enrichments in 100 bp genomic bins around the TSS and TES (±1 kb) of expressed protein-coding genes in adult Amphimedon. (B) Same as (A) for repressed protein-coding genes in adult Amphimedon. Blue shading indicates intensity.
Figure 1—figure supplement 4
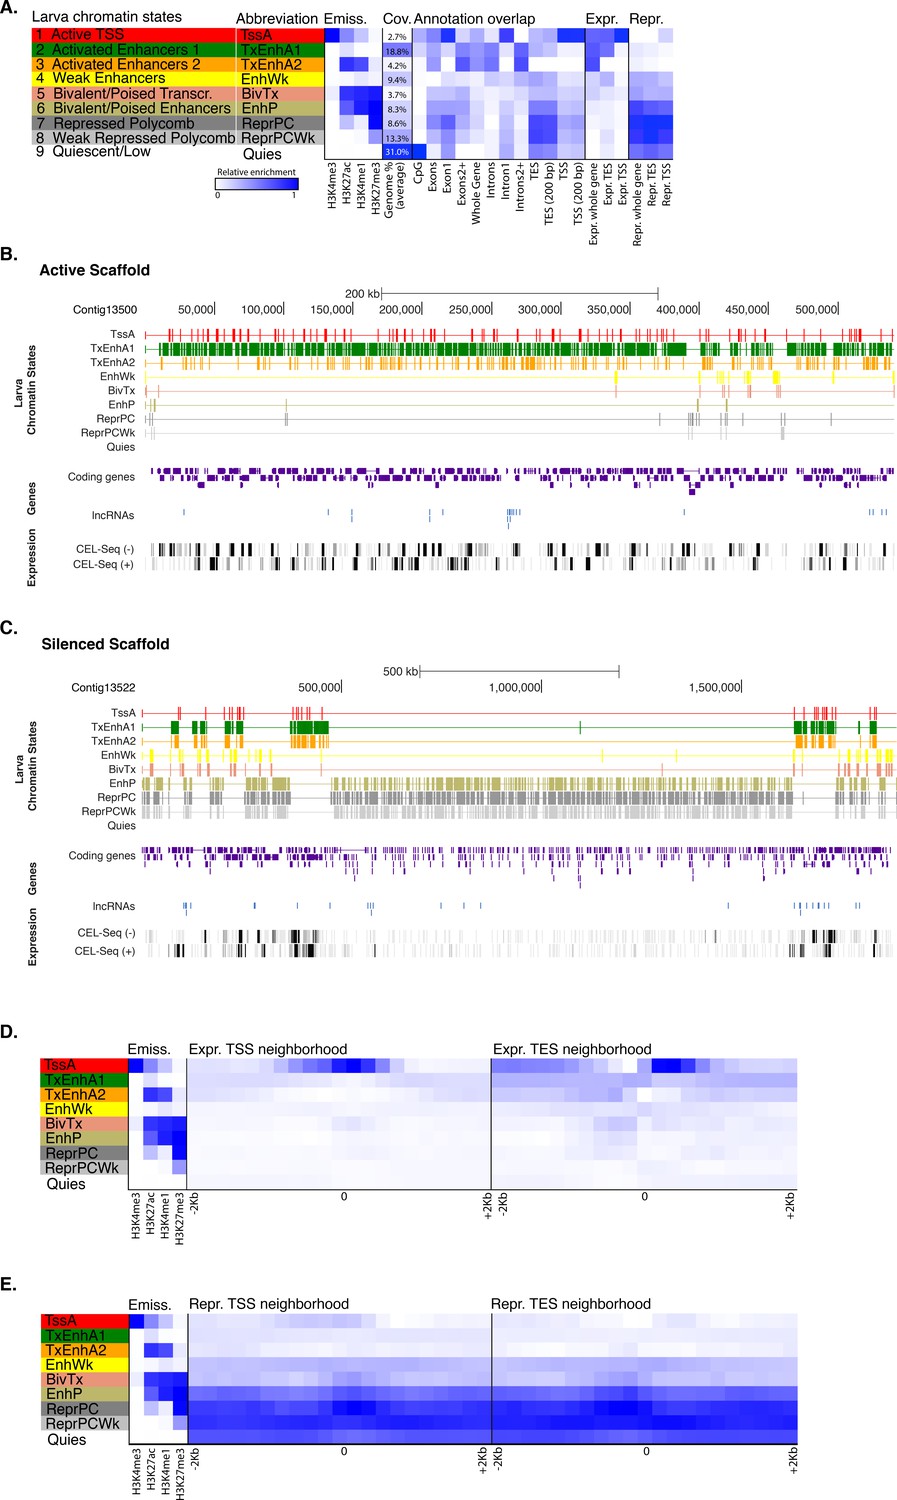
Chromatin states in Amphimedonlarva.
(A) Definition and enrichments for a 9-state Hidden Markov Model based on four histone PTMs (H3K4me3, H3K27ac, H3K4me1, H3K27me3) in Amphimedon larva. From left to right: chromatin state definitions, abbreviations, histone PTM probabilities, genomic coverage, protein-coding gene functional annotation enrichments, expressed (Expr.) and repressed (Repr.) protein-coding gene enrichments. Blue shading indicates intensity, scaled by column. (B) Chromatin state annotations on a gene rich highly transcribed (active) scaffold (contig13500) as in Figure 1. For the definition of chromatin states see panel (A). Coding genes (purple) and long non-coding RNAs (blue) are shown, along with signal coverage tracks showing CEL-seq expression in larva. A grey scale indicates CEL-seq expression level: white (no-expression); black (highest expression). (C) Chromatin state annotations on a predominantly silenced scaffold (contig13522 from 500,000 to 1,500,000 bp) as in Figure 1. For the definition of chromatin states see panel (A). Coding genes (purple) and long non- coding RNAs (blue) are shown, along with signal coverage tracks showing CEL-seq expression in adult. A grey scale indicates CEL-seq expression level: white (no-expression); black (highest expression). (D) Neighborhood positional enrichments in 100 bp genomic bins around the TSS and TES (±1 kb) of expressed protein-coding genes in larva. (E) Same as (D) for repressed protein-coding genes in larva. Blue shading indicates intensity.
Figure 2 with 4 supplements
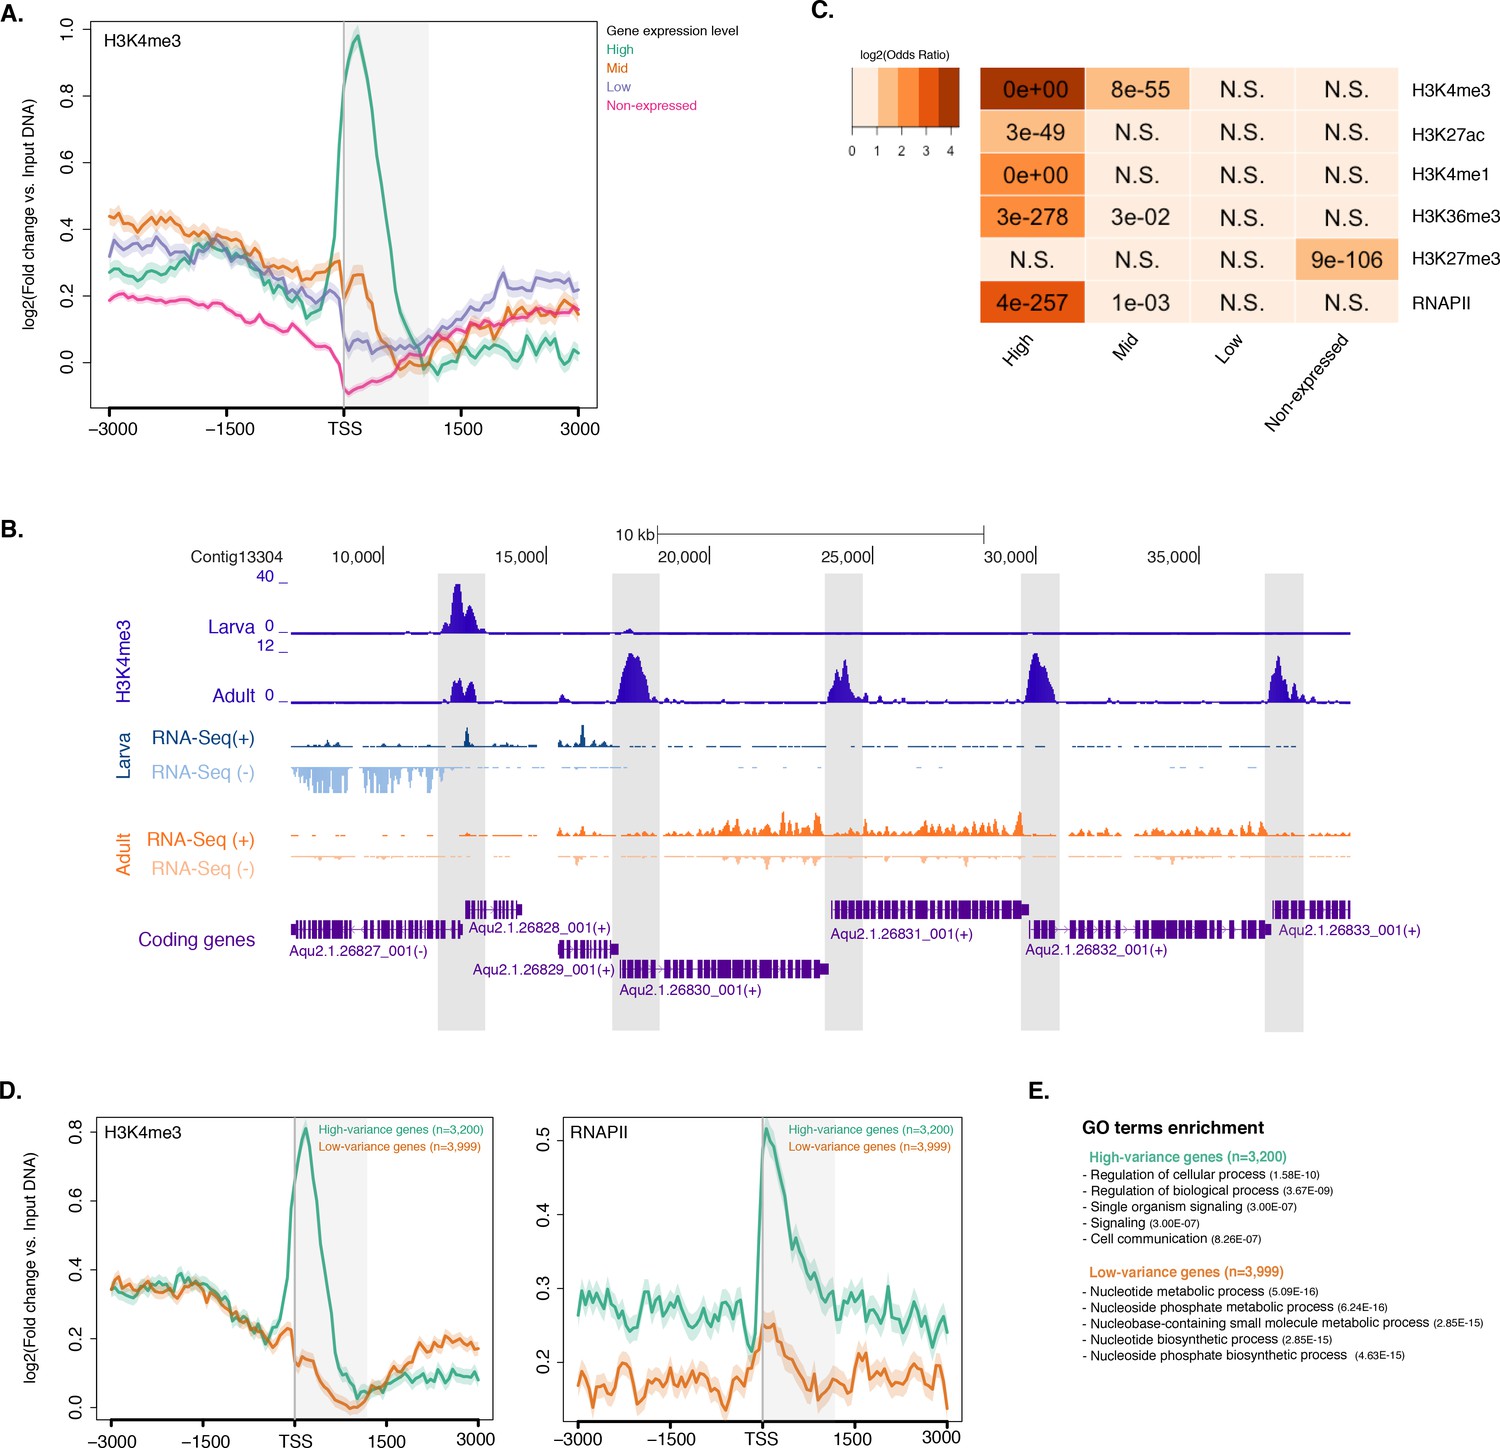
Histone PTMs are correlated with gene expression variations during development.
(A) TSS-centred average input DNA normalised read coverage plot of H3K4me3 across Amphimedon protein-coding genes. The x-axis spans ± 3 kb around TSSs and represents the position within the gene relative to TSS. The y-axis represents the input DNA normalised enrichment for H3K4me3 ChIP-seq reads in adult Amphimedon. Pink line: Non-expressed genes. Blue line: Low expressed genes. Orange line: Medium expressed genes. Light blue line: High expressed genes. The shaded gray area represents the average size of Amphimedon coding sequences. (B) Example of coding genes marked by H3K4me3 peaks. The genomic window shows input DNA-normalized H3K4me3 coverage and RNA-seq expression in both larva and adult. (C) The association of regions of enrichment of five histone H3 PTMs (H3K4me3, H3K27ac, H3K4me1, H3K36me3 and H3K27me3) and RNAPII with lists of various gene expression groups in adult is shown. The color key represents the log2(odds ratio) and the significant adjusted P-values (Fisher’s exact test) are superimposed on the grids. A P-value of zero means the overlap is highly significant. N.S.: not significant. Odds ratio represents the strength of association. (D) TSS-centred average input DNA normalised read coverage plots of H3K4me3 and RNAPII across ‘high-variance’ and ‘low-variance’ protein-coding genes. The x-axis spans ± 3 kb around TSSs and represents the position within the gene relative to TSS. The y-axis represents the input DNA normalised enrichment for ChIP-seq reads in adult Amphimedon. Light blue: high-variance coding genes. Orange line: low-variance coding genes. The shaded gray area represents the average size of Amphimedon coding sequences. (E) Top five most significantly enriched Gene Ontology (GO) terms for high-variance and low-variance protein-coding genes (adjusted P-values in brackets, Hypergeometric test). The full GO table is shown in Figure 2—source data 1.
-
Figure 2—source data 1
GO biological process term enrichment outcome for the high-variance and low-variance gene sets (Hypergeometric test, FDR<0.01).
- https://doi.org/10.7554/eLife.22194.014
-
Figure 2—source data 2
KEGG pathways significantly enriched in low-variance and high-variance genes.
- https://doi.org/10.7554/eLife.22194.015
Figure 2—figure supplement 1
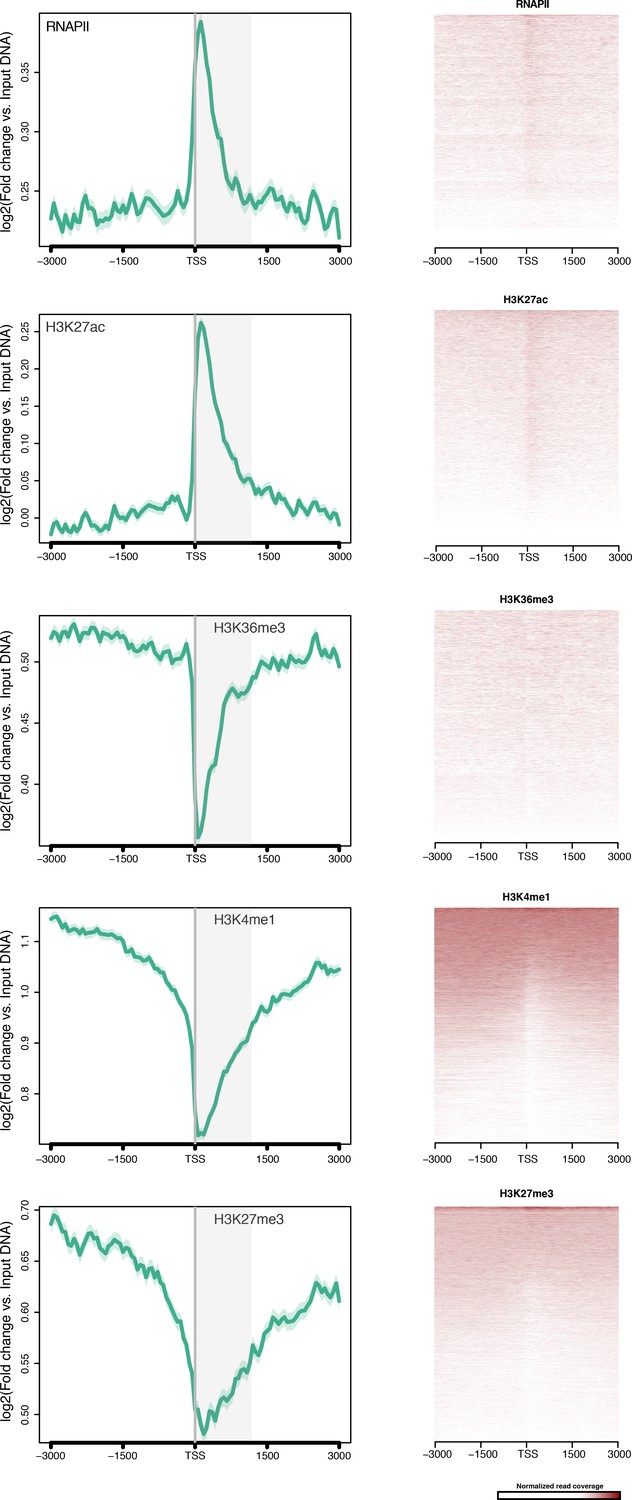
TSS-centred average input DNA normalised read coverage plots and heatmaps of RNAPII, H3K27ac, H3K36me3, H3K4me1 and H3K27me3 across Amphimedon protein-coding genes.
The x-axis spans ± 3 kb around TSSs and represents the position within the gene relative to TSS. The y-axis represents the input DNA normalised enrichment for ChIP-seq reads in adult. The shaded gray area represents the average size of Amphimedon coding sequences.
Figure 2—figure supplement 2
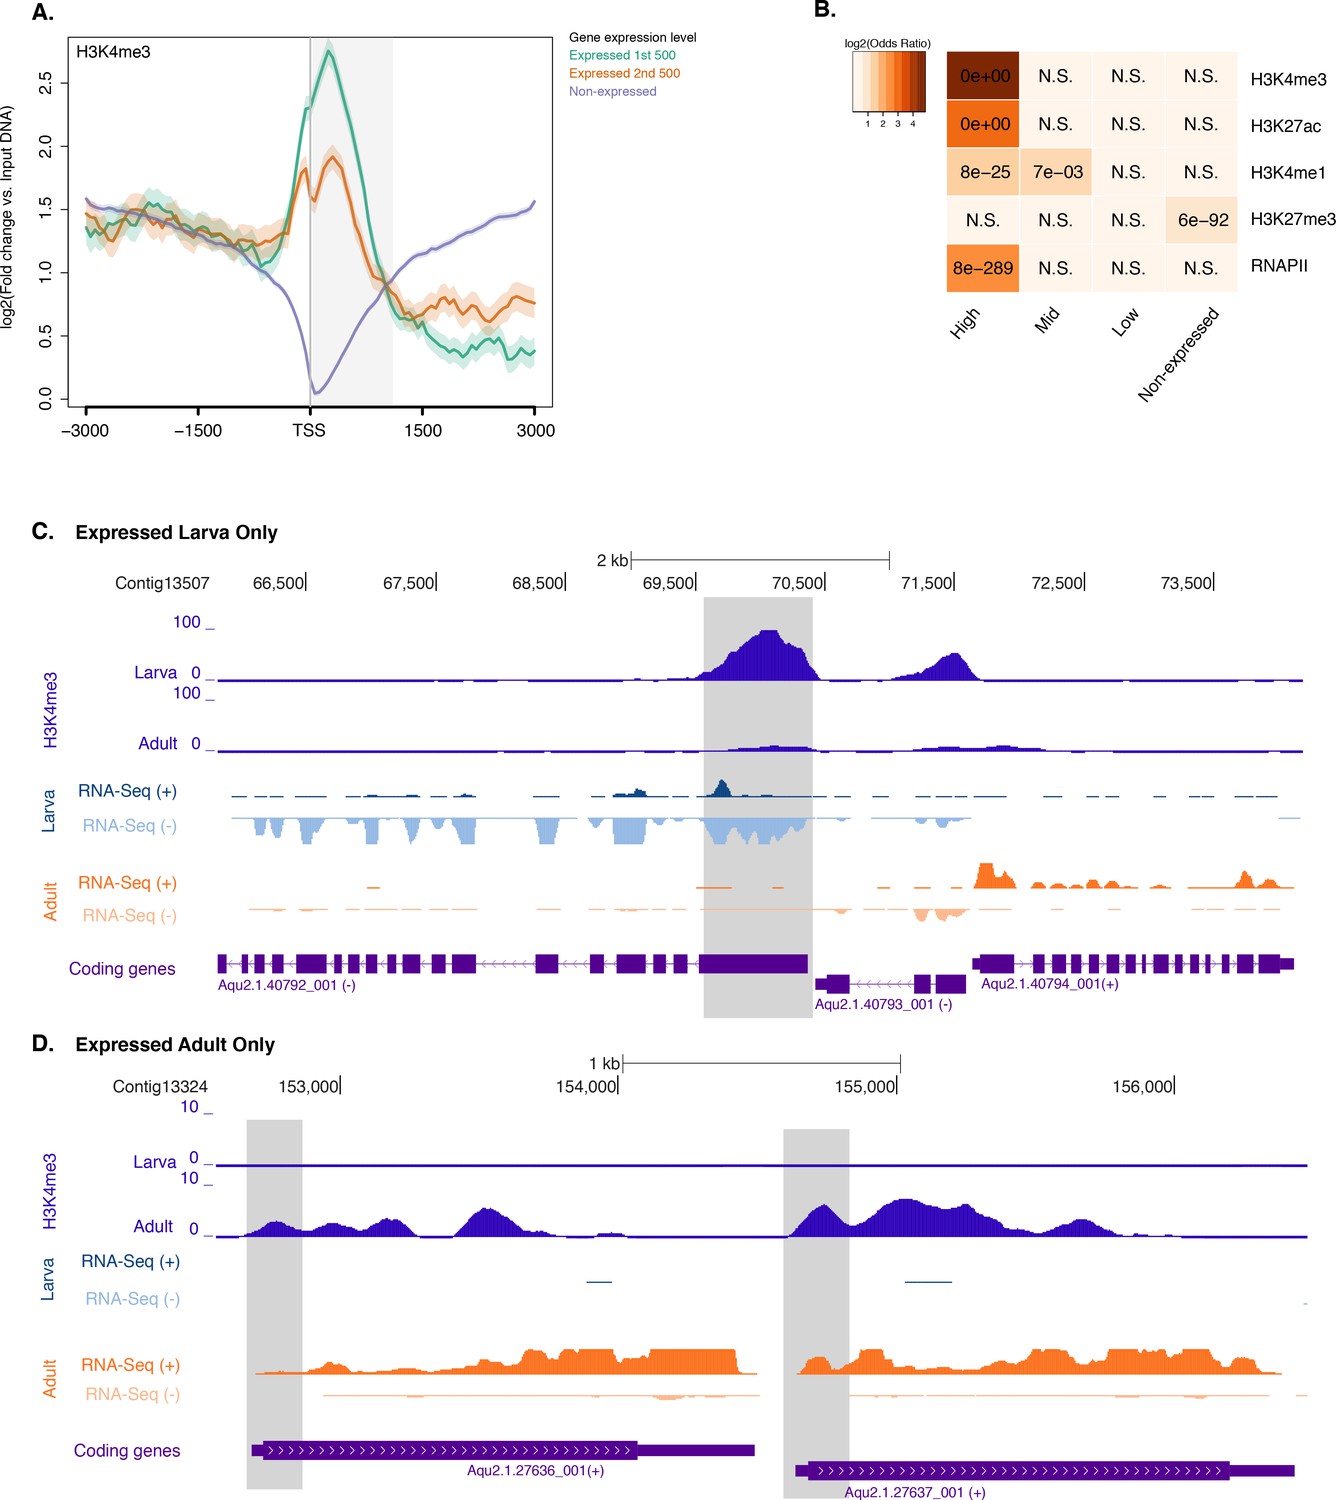
Histone PTMs and gene expression variations during development.
(A) TSS-centred average input DNA normalised read coverage plot of H3K4me3 across Amphimedon protein-coding genes. The x-axis spans ± 3 kb around TSSs and represents the position within the gene relative to TSS. The y-axis represents the input DNA normalised enrichment for H3K4me3 ChIP-seq reads in larva. Blue line: Non-expressed genes. Orange line: second 500 expressed genes. Light blue line: first 500 expressed genes. The shaded gray area represents the average size of Amphimedon coding sequences. (B) The association of regions of enrichment of four histone H3 PTMs (H3K4me3, H3K27ac, H3K4me1, and H3K27me3) and RNAPII with lists of various gene expression groups in larva is shown. The color key represents the log2(odds ratio) and the significant adjusted P-values (Fisher’s exact test) are superimposed on the grids. A P-value of zero means the overlap is highly significant. N.S.: not significant. (C) Coding gene with larva-specific expression marked by H3K4me3. The genomic window shows input-DNA normalized H3K4me3 coverage and RNA-seq expression in both larva and adult. (D) Same as (C) for coding genes with adult-specific expression.
Figure 2—figure supplement 3
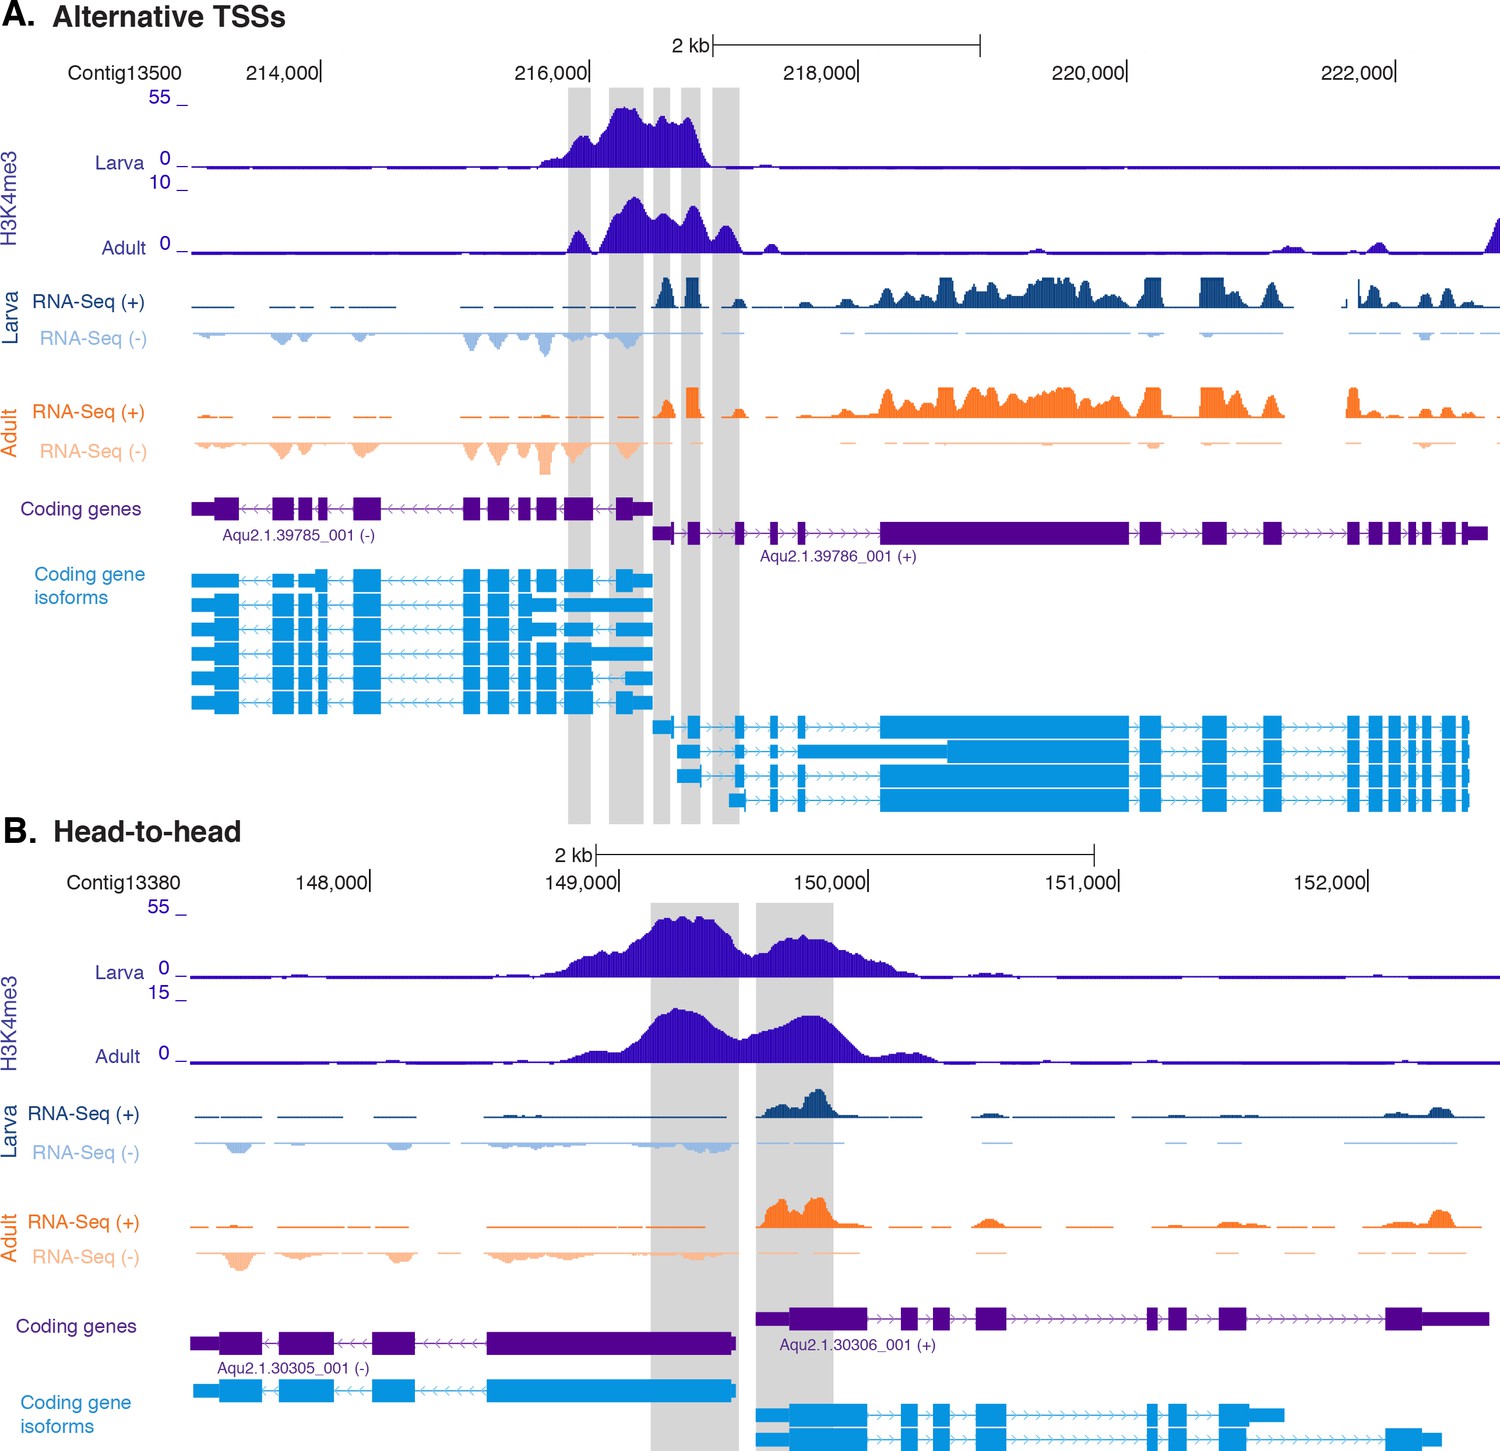
H3K4me3 enrichment at genes with head-to-head orientation and alternative TSSs.
(A) Example of coding genes with alternative TSSs (Aqu2.1.39785_001 and Aqu2.1.396786_001) marked by successive H3K4me3 peaks. The genomic window shows input DNA-normalized H3K4me3 coverage and RNA-seq expression in both larva and adult. (B) Same as (A) for closely located head-to-head genes (Aqu2.1.30305_001 and Aqu2.1.30306_001). Coding genes (purple) and coding gene isoforms (light blue) are shown.
Figure 2—figure supplement 4
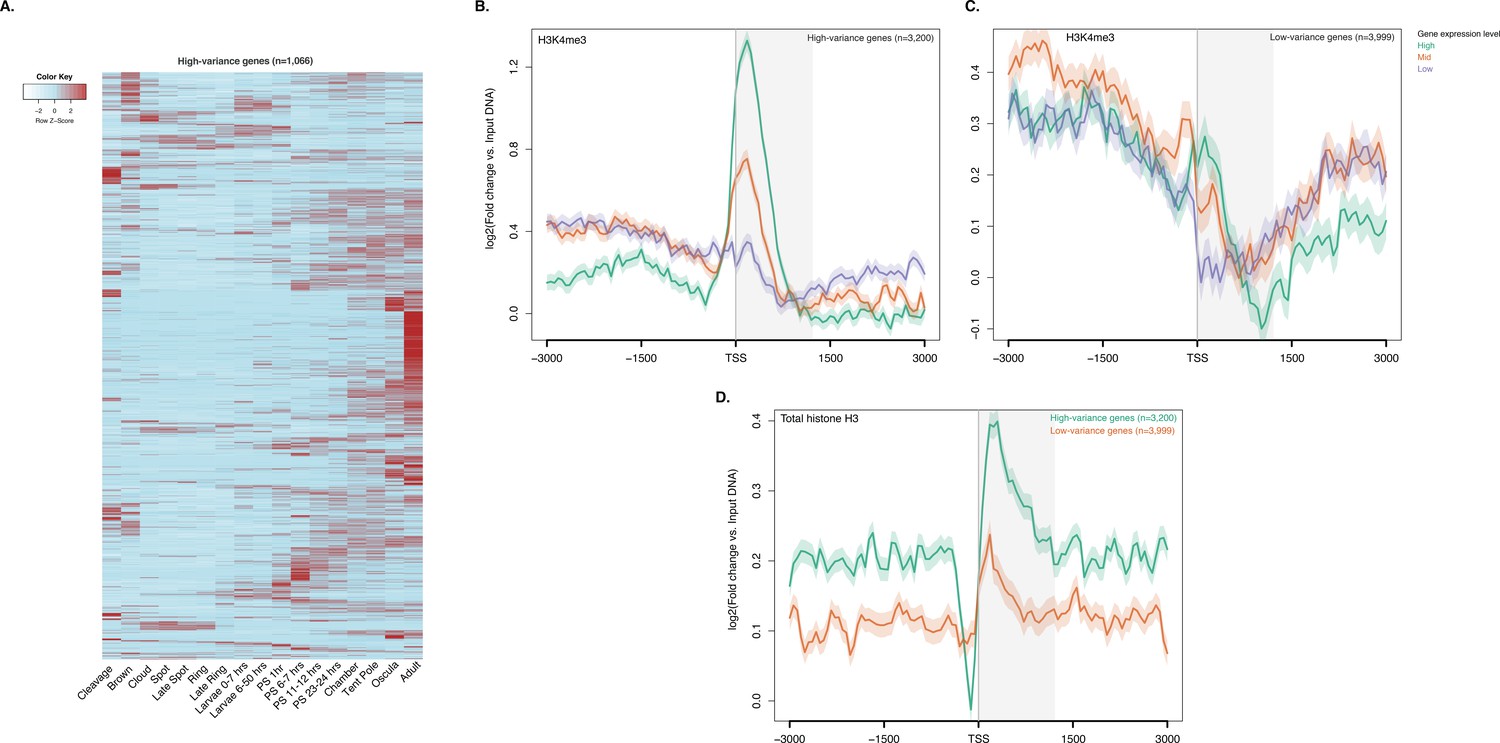
ChIP-seq profiles of H3K4me3 and total histone H3 across high-variance and low-variance genes.
(A) Developmental expression profile, from early cleavage to adult, of the highly expressed high-variance genes (n = 1066). Expression levels were measured by CEL-seq and rescaled by row. Red indicates high expression level, light blue low expression. PS, post-settlement postlarva. (B) TSS-centred average input DNA normalised read coverage plot of H3K4me3 across high-variance protein-coding genes. The x-axis spans ± 3 kb around TSSs and represents the position within the gene relative to TSS. The y-axis represents the input DNA normalised enrichment for H3K4me3 ChIP-seq reads in adult. Purple line: Low expressed genes. Orange line: Medium expressed genes. Light blue line: High expressed genes. (C) Same as (B) but for the low-variance genes. (D) TSS-centred average input DNA normalised read coverage plot of total histone H3 across high-variance and low-variance protein-coding genes. The x-axis spans ± 3 kb around TSSs and represents the position within the gene relative to TSS. The y-axis represents the input DNA normalised enrichment for ChIP-seq reads in adult. Light blue: High-variance coding genes. Orange line: Low-variance coding genes. The shaded gray area represents the average size of Amphimedon coding sequences.
Figure 3 with 1 supplement
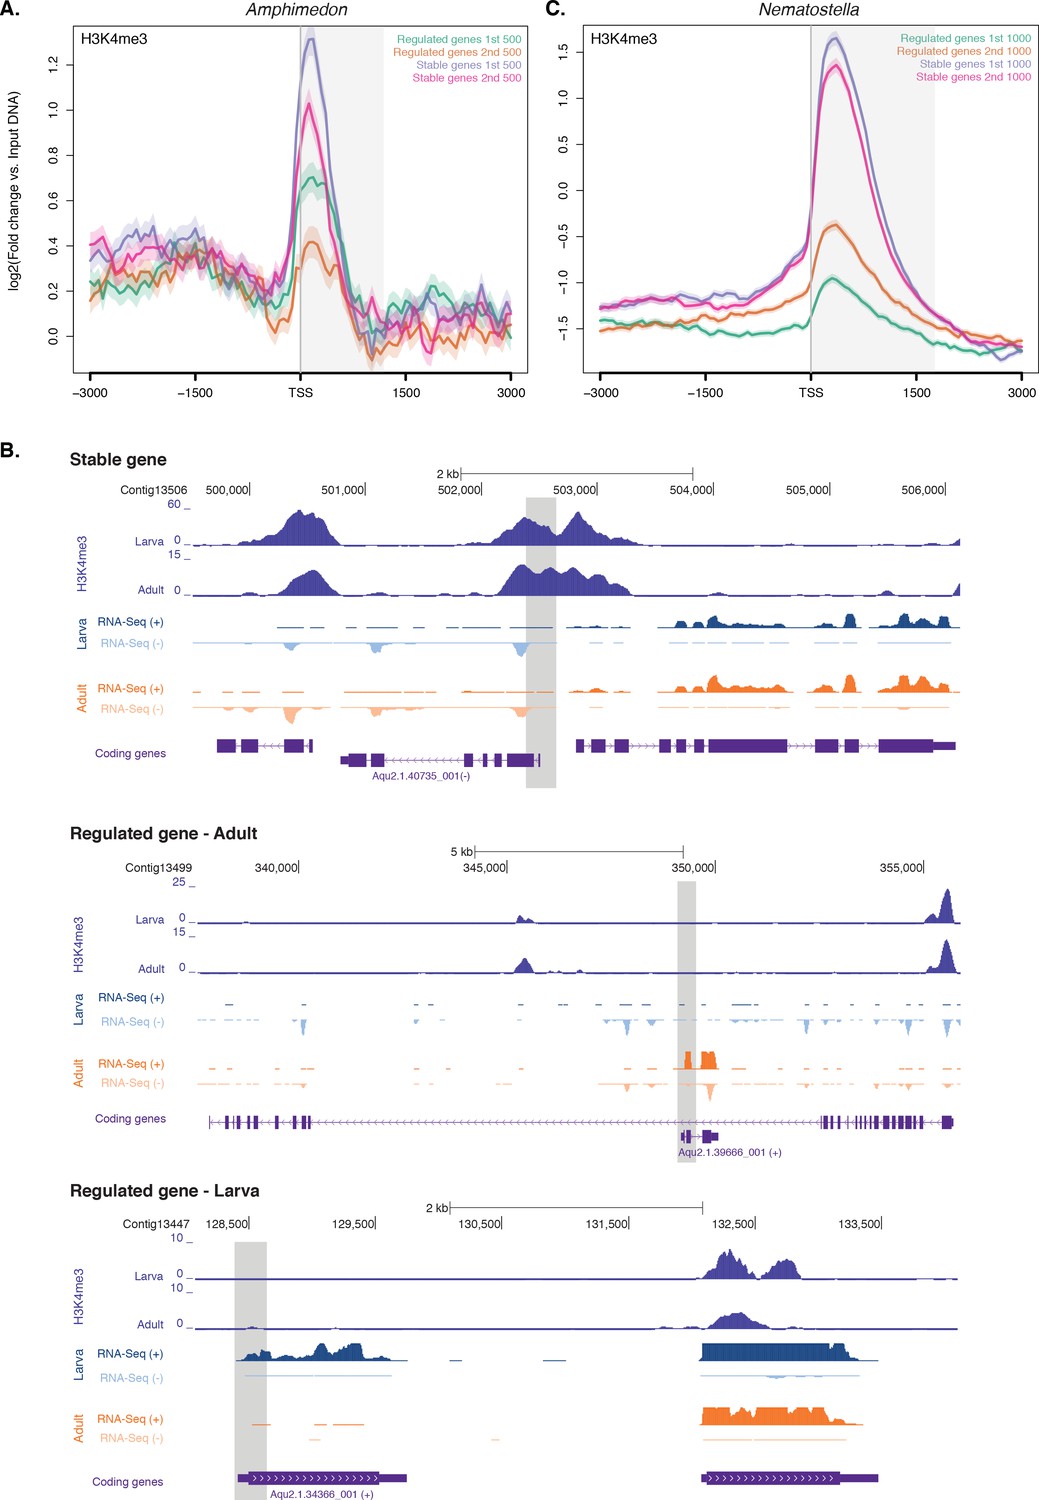
Expression without H3K4me3 in strongly developmentally regulated genes.
(A) TSS-centred average input DNA normalised read coverage plot of H3K4me3 across ‘regulated’ and ‘stable’ protein-coding genes during Amphimedon development. The x-axis spans ± 3 kb around TSSs and represents the position within the gene relative to TSS. The y-axis represents the input DNA normalised enrichment for H3K4me3 ChIP-seq reads in adult Amphimedon. Light blue line: first 500 regulated genes. Orange line: second 500 regulated genes. Purple line: first 500 stable genes. Pink line: second 500 stable genes. The shaded gray area represents the average size of Amphimedon coding sequences. (B) Input DNA-normalized H3K4me3 coverage and RNA-seq expression in adult for Aqu2.1.40735_001, a gene stably expressed during Amphimedon development, Aqu2.1.39666_001, a regulated gene with adult-specific expression, and Aqu2.1.34366_001, a regulated gene with larva-specific expression. (C) TSS-centred average input DNA normalised read coverage plot of H3K4me3 across ‘regulated’ and ‘stable’ protein-coding genes during Nematostella vectensis development. The x-axis spans ± 3 kb around TSSs and represents the position within the gene relative to TSS. The y-axis represents the input DNA normalised enrichment for H3K4me3 ChIP-seq reads in Nematostella adult female polyps. The shaded gray area represents the average size of Nematostella coding sequences.
Figure 3—figure supplement 1
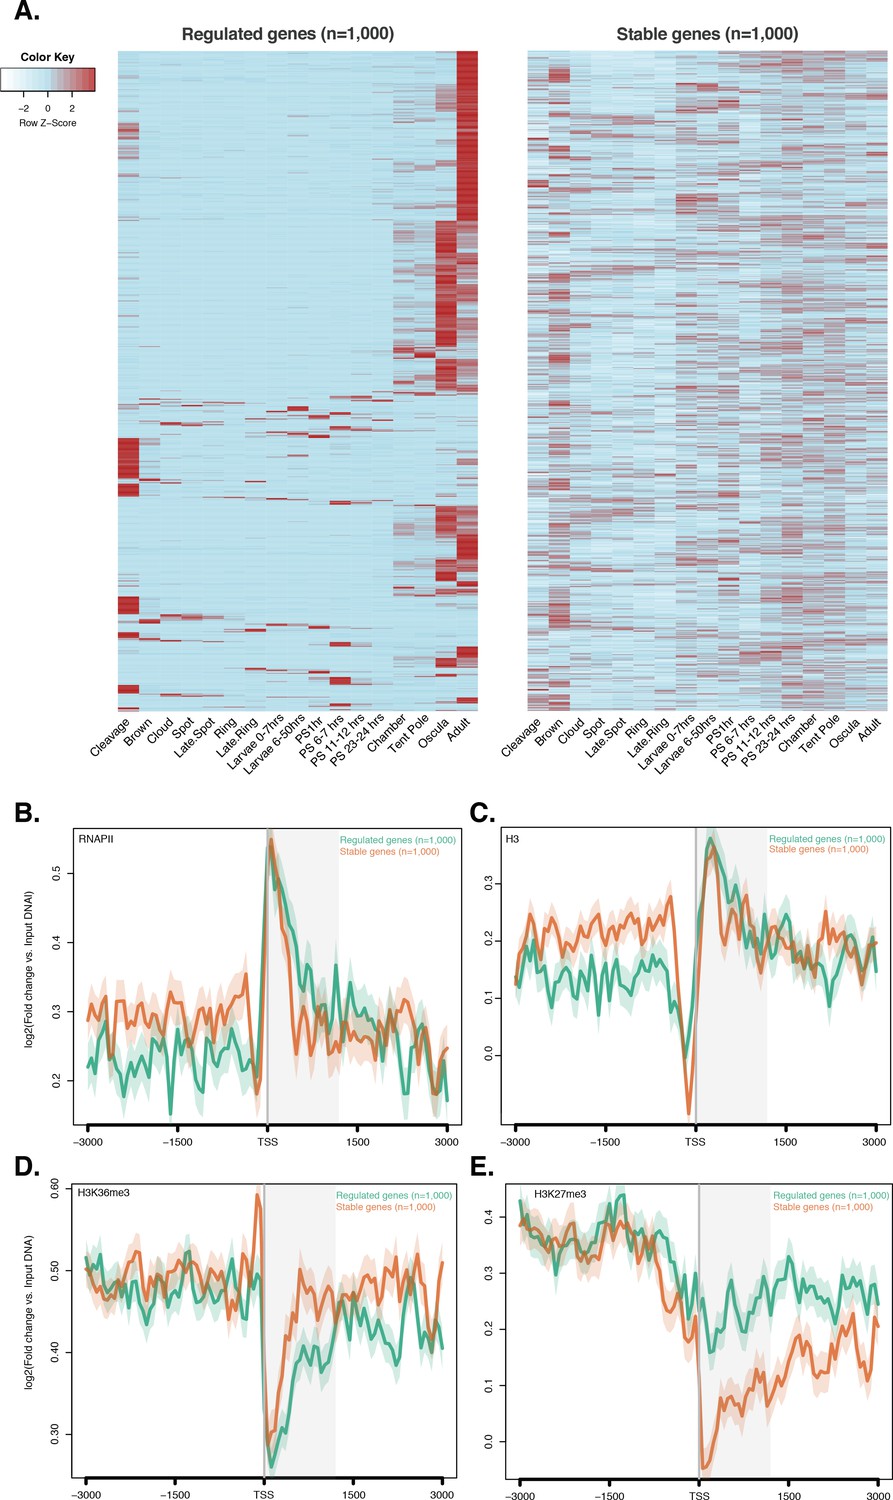
ChIP-seq profiles of RNAPII, total histone H3, H3K36me3 and H3K27me3 across regulated and stable genes.
(A) Developmental expression profile, from early cleavage to adult, of the regulated and stable protein-coding genes (see main text and Materials and methods for details). Expression levels were measured by CEL-seq and rescaled by row. Red indicates high expression level, light blue low expression. Note that the ‘regulated’ genes show much more restricted expression patterns, being typically expressed at only one or two stage(s) of development (oscula and/or adult), than both ‘stable’ and ‘high-variance’ genes (see Figure 2—figure supplement 4A for a comparison). PS, post-settlement postlarva. (B) TSS-centred average input DNA normalised read coverage plot of RNAPII, (C) total H3, (D) H3K36me3 and (E) H3K27me3 across ‘regulated’ and ‘stable’ protein-coding genes during Amphimedon development. The x-axis spans ± 3 kb around TSSs and represents the position within the gene relative to TSS. The y-axis represents the input DNA normalised enrichment for ChIP-seq reads in adult. Light blue line: first 1,000 regulated genes. Orange line: first 1,000 stable genes. The shaded gray area represents the average size of Amphimedon coding sequences.
Figure 4 with 1 supplement
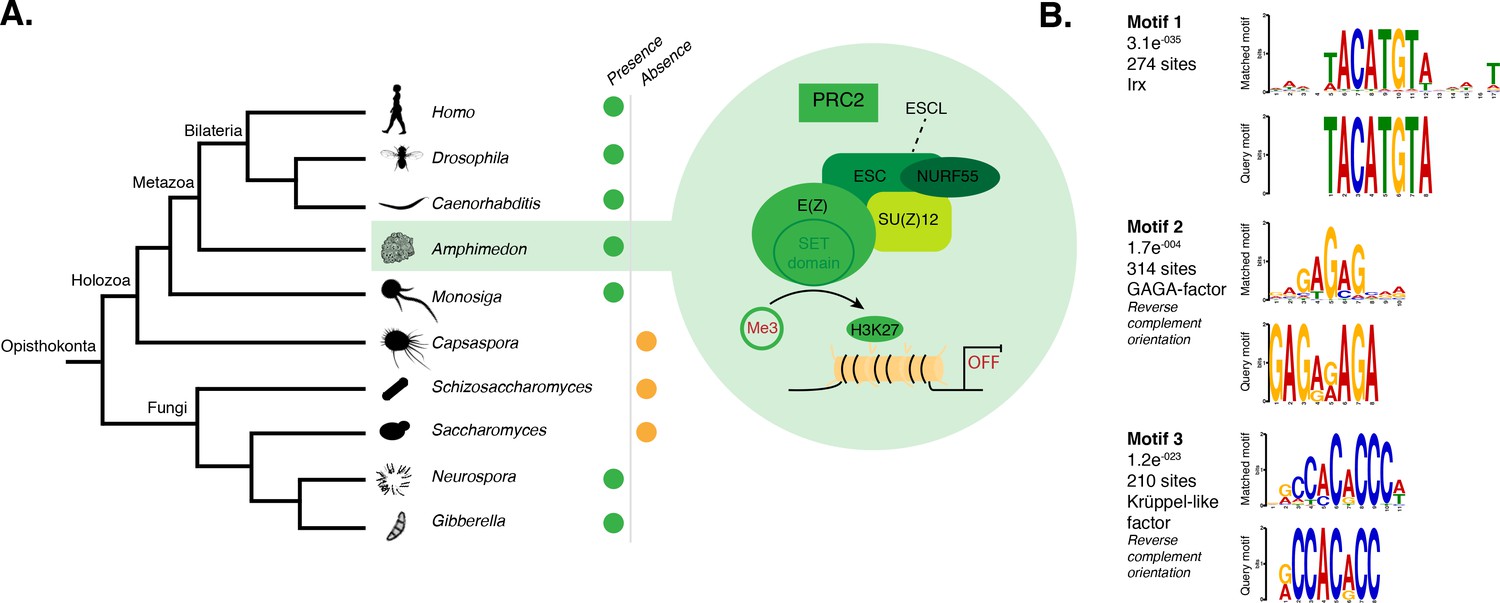
DNA motifs overrepresented in H3K27me3 transcriptionally silenced regions.
(A) Diagram representing the composition of Drosophila PRC2 complex and its four core components: the catalytic subunit of the complex E(z), the zinc finger protein SU(z)12, the WD-repeat protein ESC and the histone-binding protein Nurf55. E(z) is responsible for the main enzymatic activity of PRC2, which is to trimethylate histone H3 at lysine 27, yielding H3K27me3. Adapted from (Vissers et al., 2012). The presence (green) or absence (orange) of PRC2 and its core components in the different opisthokont species represented in the phylogenetic tree (left) is shown. Amphimedon is highlighted in green. (B) Sequence logos of a subset of the DNA motifs determined by MEME-ChIP analysis to be significantly enriched in the transcriptionally silenced regions marked by H3K27me3 in adult Amphimedon. For each motif, the best TOMTOM match to a motif in the JASPAR CORE and UniPROBE mouse databases, the E-value and the number of sites contributing to the construction of the motif are shown, respectively. The matched motif is shown on the top and the query motif is shown on the bottom.
-
Figure 4—source data 1
Putative orthologs of Drosophila PcG components and associated factors in yeast, Capsaspora, sponge, nematode, and human genome.
Table of PcG proteins is adapted from (http://www.igh.cnrs.fr/equip/cavalli/link.PolycombTeaching.html).
- https://doi.org/10.7554/eLife.22194.023
Figure 4—figure supplement 1
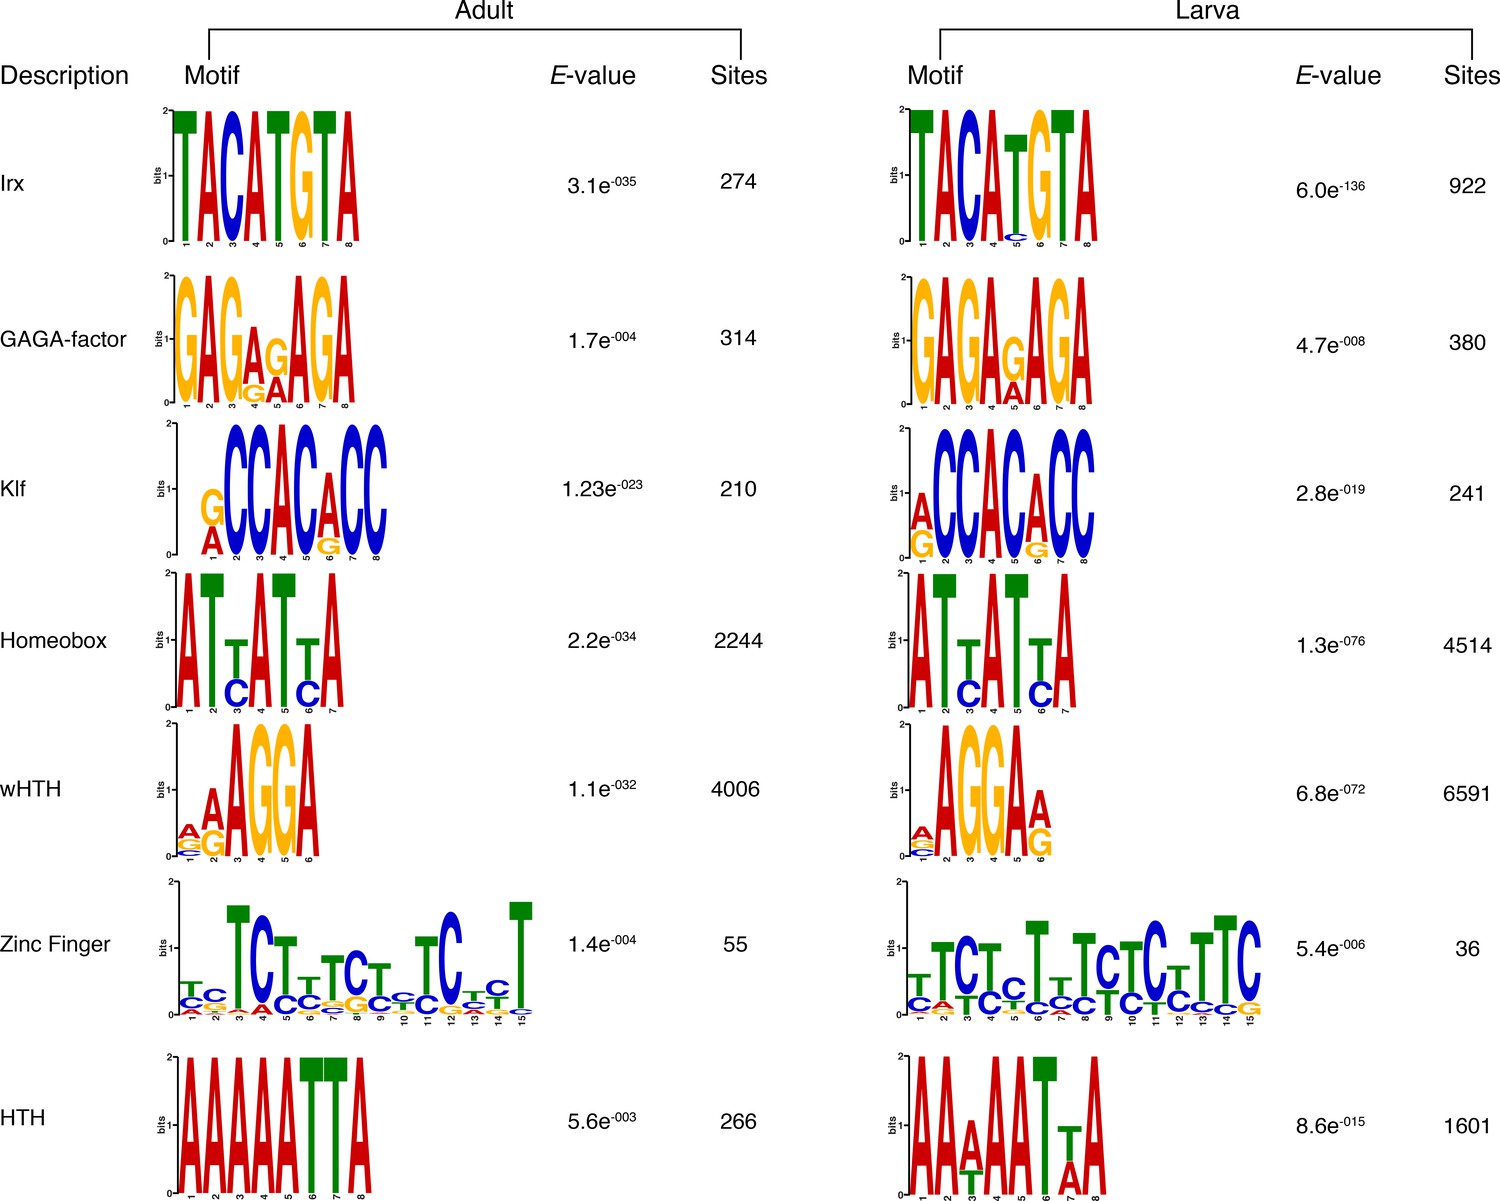
Matching sequence logos of the DNA motifs determined by MEME-ChIP analysis to be significantly enriched in the transcriptionally silenced regions marked by H3K27me3 in both adult and larva.
The E-value (log likelihood ratio of each motif) and the number of sites contributing to the construction of the motif are shown, respectively.
Figure 5 with 1 supplement
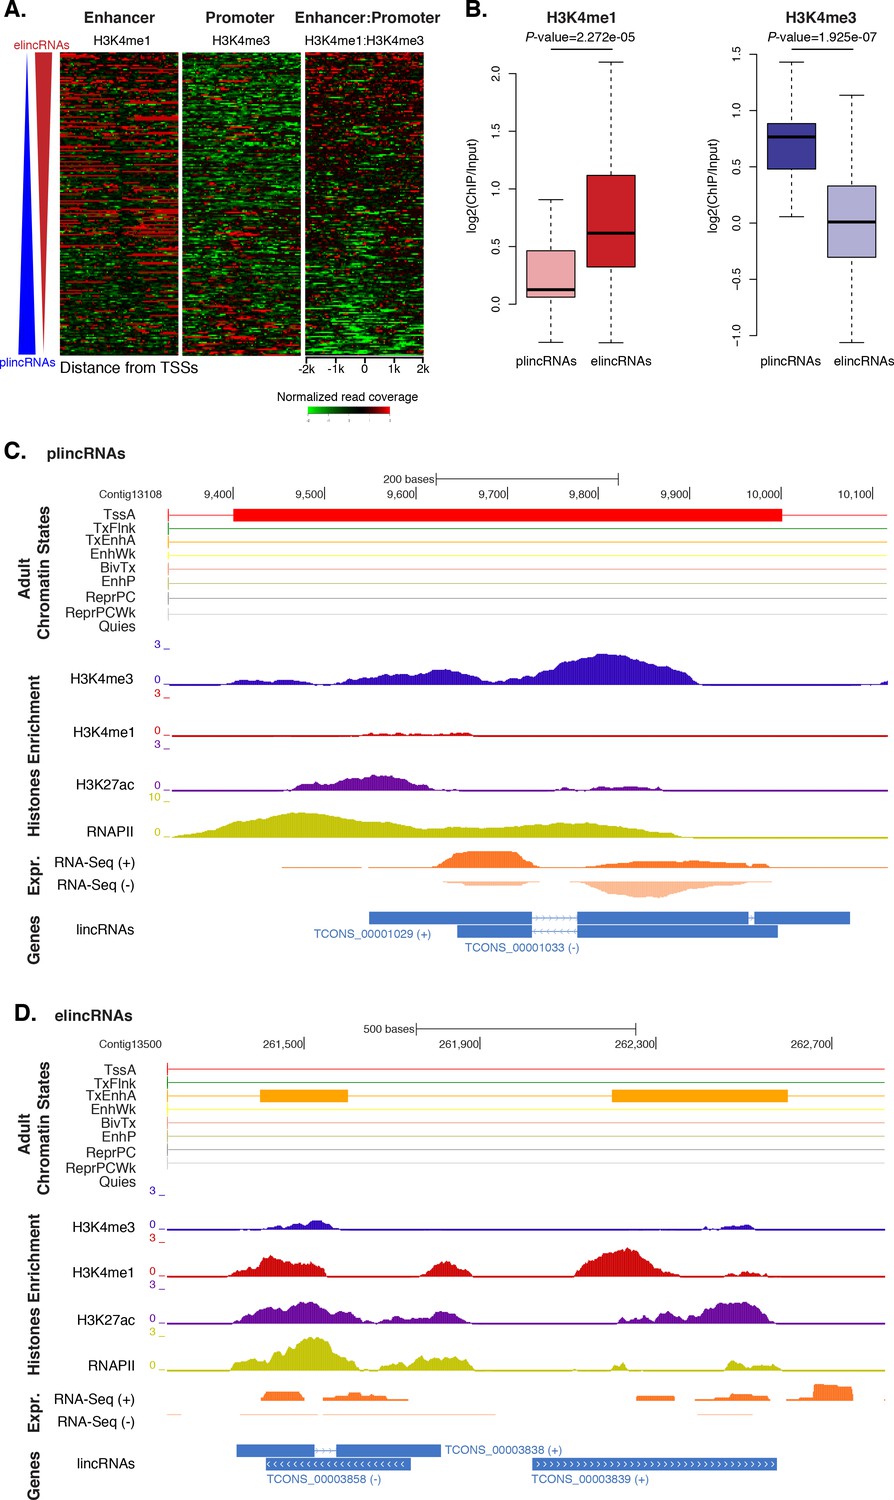
Amphimedon lincRNA populations defined by histone PTM signatures.
(A) Heatmap showing the average read normalised coverage of H3K4me1, H3K4me3 and their ratio in adult Amphimedon across a 4 kb interval centred on TSSs of lincRNAs. Each line of the heatmaps represents a single lincRNA (y-axis). Profiles are sorted based on the differences in enrichment between H3K4me1 and input DNA, and H3K4me3 and input DNA, respectively. Also provided is the H3K4me1:H3K4me3 log2(ratio) around TSSs. (B) Enrichment of H3K4me1 (left) and H3K4me3 (right) (ChIP versus input) at plincRNAs and elincRNAs. P-values are indicated for Mann-Whitney U test. (C) Example of lincRNAs with promoter-like chromatin signature (plincRNAs). For the definition of adult chromatin states see Figure 1A. Promoter-like lincRNAs (blue) are shown, along with input DNA-normalized coverage of different histone modifications and RNA-seq expression in adult. (D) Same as (C) but for lincRNAs with enhancer-like chromatin signature (elincRNAs).
-
Figure 5—source data 1
Annotation of putative elincRNAs and plincRNAs.
- https://doi.org/10.7554/eLife.22194.026
Figure 5—figure supplement 1
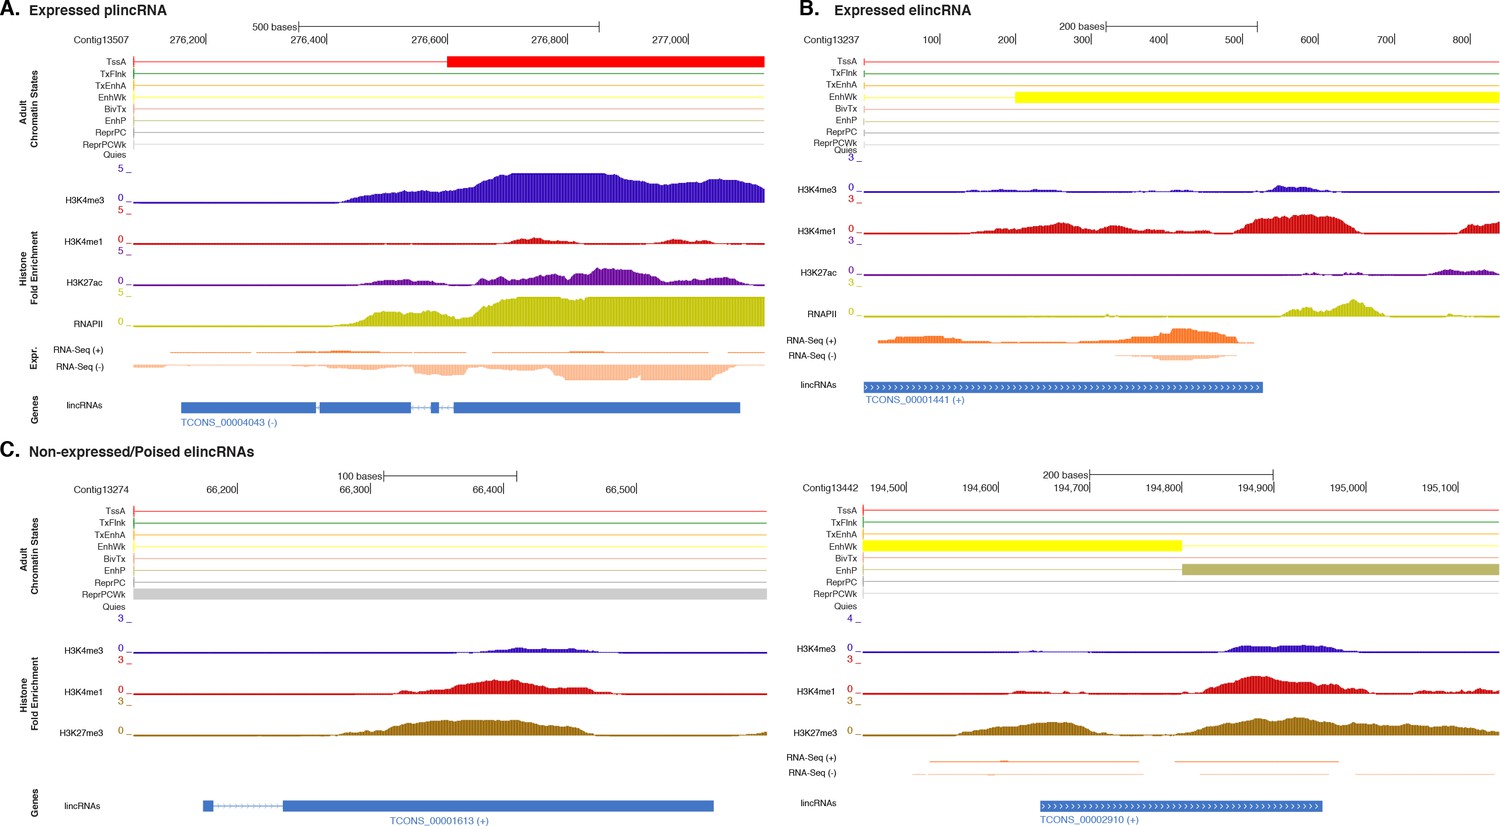
Additional examples of plincRNAs and elincRNAs.
(A) Example of a lincRNA with promoter-like chromatin signature (plincRNA). For the definition of adult chromatin states see Figure 1A. Promoter-like lincRNA (blue) is shown, along with input DNA-normalized coverage of different histone modifications and RNA-seq expression in adult. (B) Same as (A) but for a lincRNA with enhancer-like chromatin signature (elincRNA). (C) Same as (B) but for non-expressed lincRNAs with enhancer-like chromatin signature (elincRNAs). Note the prevalence of ‘ReprPC’, ‘ReprPCWk’ and ‘EnhP’ chromatin state at these regions.
Figure 6 with 5 supplements
Distal enhancer regulation at the dawn of animals.
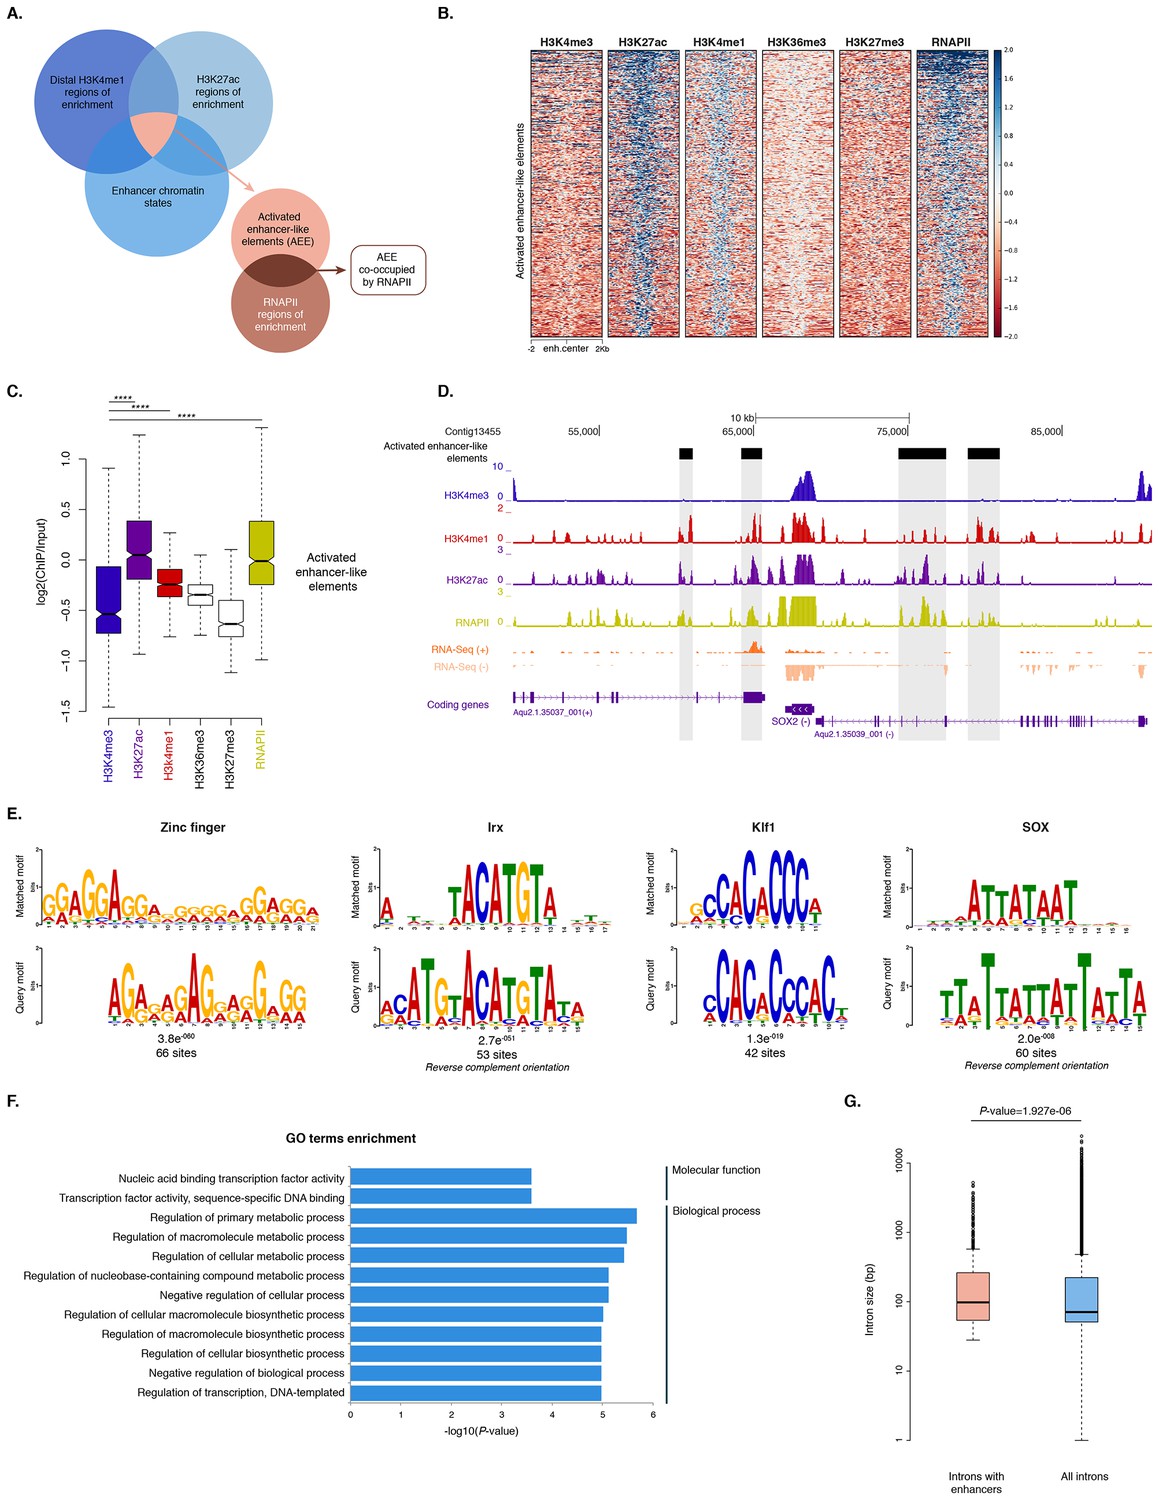
(A) Overview of the computational filtering pipeline adopted to predict the putative Amphimedon activated enhancer-like elements. See main text and Materials and methods for details. (B) Heatmap showing different histone modifications enrichment at predicted activated enhancer-like elements (±2 kb of flanking regions). (C) Boxplot showing enrichment of different histone modifications (ChIP versus input) at predicted activated enhancer-like elements, showing that activated enhancer-like elements have higher H3K4me1 than H3K4me3 levels, a typical characteristic of eumetazoan enhancers. Four asterisks (****) indicate p-values<2.2e-16 for Mann-Whitney U test between H3K4me3 and H3K27ac, between H3K4me3 and H3K4me1, and between H3K4me3 and RNAPII, respectively. (D) Example of predicted activated enhancer-like elements. Protein coding genes (purple) are shown, along with input DNA-normalized coverage of different histone modifications and RNA-seq expression in adult. Regions of enrichments (high confidence peaks, representing reproducible events across true biological replicates) corresponding to the predicted activated enhancer-like elements are highlighted in grey. (E) Sequence logos of the DNA motifs determined by MEME-ChIP analysis enriched in the adult predicted activated enhancer-like sequences. For each motif, the best match to a motif in the JASPAR CORE and UniPROBE mouse databases, the E-value and the number of sites contributing to the construction of the motif are shown, respectively. The matched motif is shown on the top and the query motif is shown on the bottom. (F) Gene Ontology (GO) enrichment activities of the nearest neighbor protein-coding genes of the adult predicted activated enhancer-like elements are shown. Bar length indicates the significance of the enrichment (Hypergeometric test; -log10[adjusted P- value]). Only the top ten GO biological process terms are shown. See Figure 6—source data 2 for the complete list. (G) Boxplot showing the size of introns that harbour adult activated enhancer-like elements versus all introns in the genome. The y-axis indicates the intron size (bp) in log scale. P-value is indicated for Mann–Whitney U test.
-
Figure 6—source data 1
Genomic location of all the predicted activated enhancer-like elements and their distance to the closest TSS.
- https://doi.org/10.7554/eLife.22194.029
-
Figure 6—source data 2
Functional annotation of nearest neighbors genes of the adult predicted activated enhancer-like elements.
- https://doi.org/10.7554/eLife.22194.030
-
Figure 6—source data 3
Functional annotation of nearest neighbors genes of the larva predicted activated enhancer-like elements.
- https://doi.org/10.7554/eLife.22194.031
-
Figure 6—source data 4
GO term enrichment outcome for the nearest neighbors genes of the adult predicted activated enhancer-like elements (Hypergeometric test, FDR<0.01).
- https://doi.org/10.7554/eLife.22194.032
-
Figure 6—source data 5
GO term enrichment outcome for the nearest neighbors genes of the larva predicted activated enhancer-like elements (Hypergeometric test, FDR<0.01).
- https://doi.org/10.7554/eLife.22194.033
Figure 6—figure supplement 1
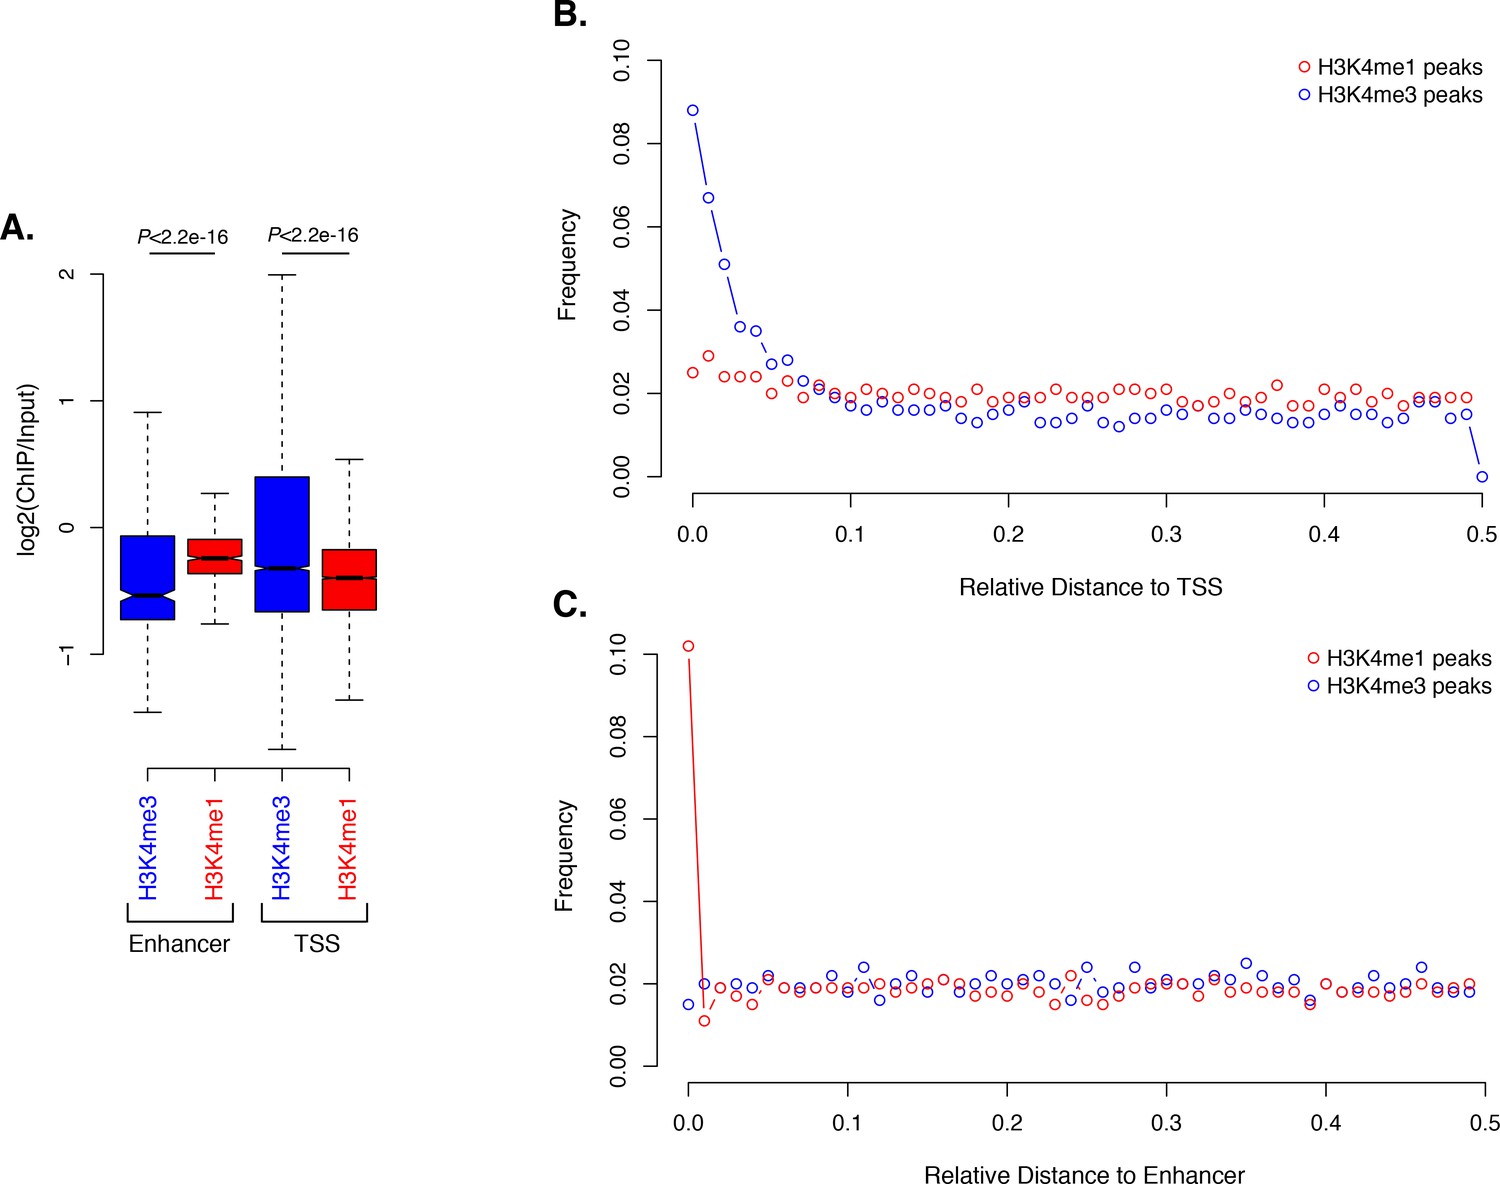
Activated enhancer-like elements have higher H3K4me1 than H3K4me3 levels.
(A) Enrichment of H3K4me1 (red) and H3K4me3 (blue) (ChIP versus input) at predicted activated enhancer-like elements (left) and TSSs (right), showing that activated enhancer-like elements have higher H3K4me1 than H3K4me3 levels, a typical characteristic of eumetazoan enhancers. P-values are indicated for Mann-Whitney U test. (B) Relative distance distribution observed between H3K4me1 (red) and H3K4me3 (blue) regions of enrichment (peaks) and TSSs. If there is no spatial correlation between the two sets, one would expect the relative distances to be uniformly distributed among the relative distances ranging from 0 to 0.5, as observed for H3K4me1 peaks and TSSs. If, however, the intervals tend to be much closer than expected by chance, the distribution of observed relative distances would be shifted towards low relative distance values, as observed for H3K4me3 peaks and TSSs. (C) Relative distance distribution observed between H3K4me1 (red) and H3K4me3 (blue) peaks and predicted activated enhancer-like elements, indicating spatial correlation between H3K4me1 peaks and predicted activated enhancer-like elements.
Figure 6—figure supplement 2
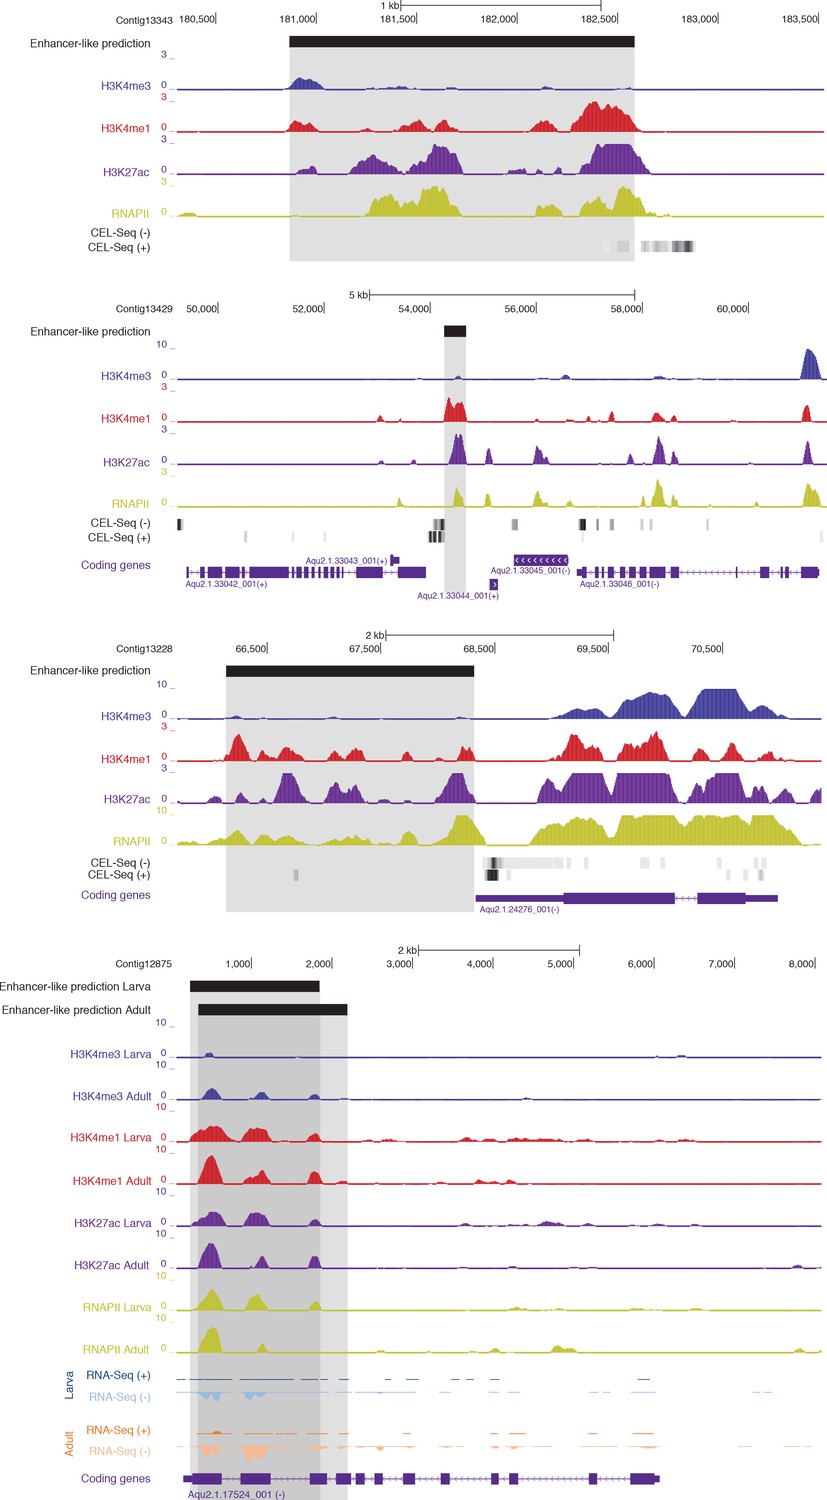
Examples of CEL-seq or RNA-seq expression detected at putative activated enhancer-like sites, suggesting that 1D eRNAs, which are generally polyadenylated (Natoli and Andrau, 2012; Li et al., 2016), might be transcribed from these regions.
Protein-coding genes (purple) are shown, along with input DNA-normalized coverage tracks of different histone modifications. Regions of enrichments (high confidence peaks, representing reproducible events across true biological replicates) corresponding to putative activated enhancer-like sites are highlighted in grey. Unless otherwise specified, adult data are shown.
Figure 6—figure supplement 3
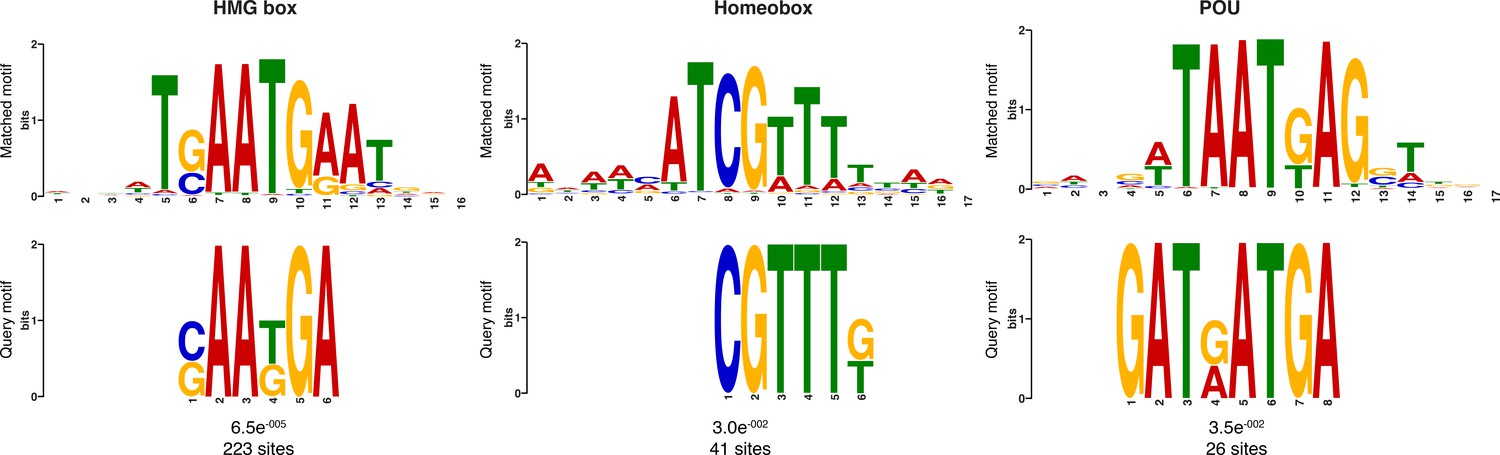
Additional sequence logos of the DNA motifs determined by MEME-ChIP analysis to be significantly enriched in the adult predicted activated enhancer-like sequences.
The E-value (log likelihood ratio of each motif) and the number of sites contributing to the construction of the motif are shown, respectively. The matched motif is shown on the top and the query motif is shown on the bottom.
Figure 6—figure supplement 4
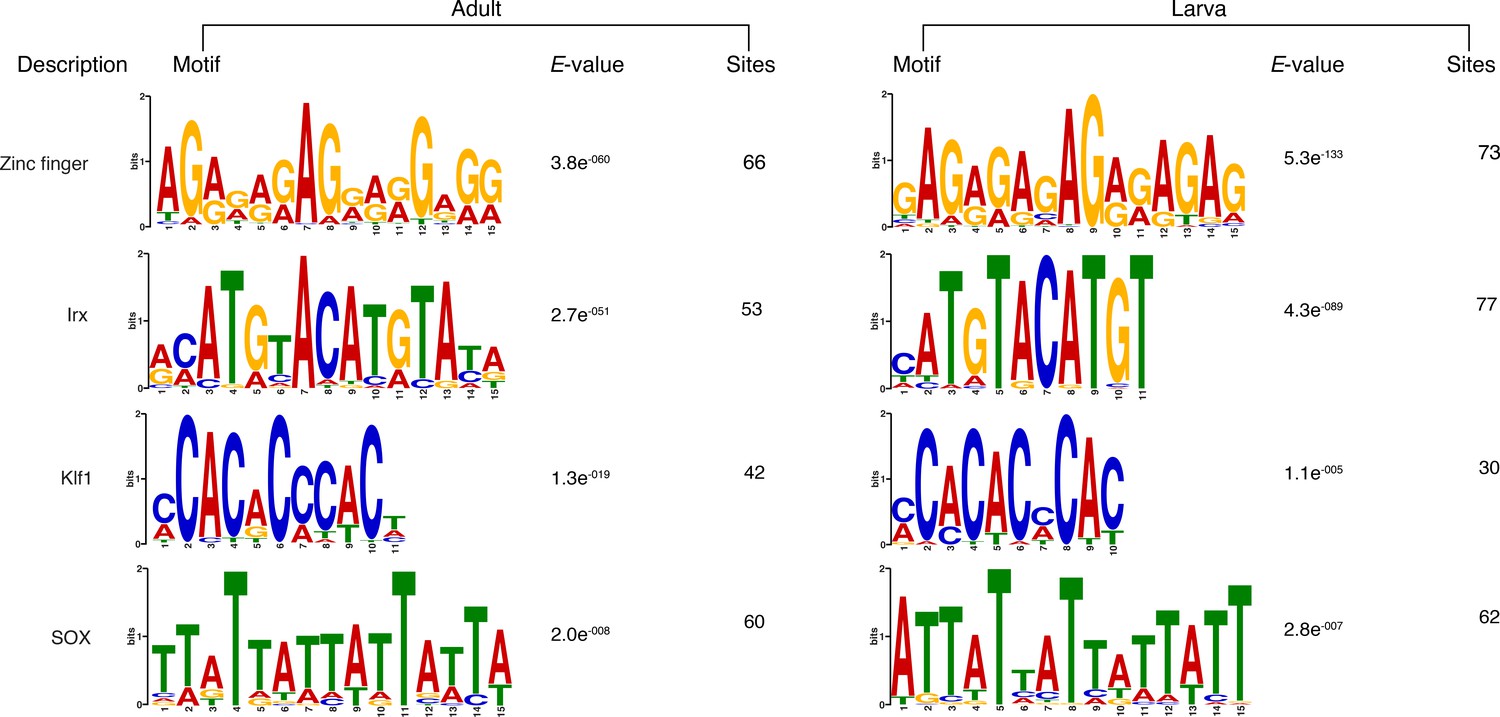
Matching sequence logos of the DNA motifs determined by MEME-ChIP analysis to be significantly enriched in the predicted activated enhancer-like sequences in both adult and larva.
The E-value (log likelihood ratio of each motif) and the number of sites contributing to the construction of the motif are shown, respectively.
Figure 6—figure supplement 5
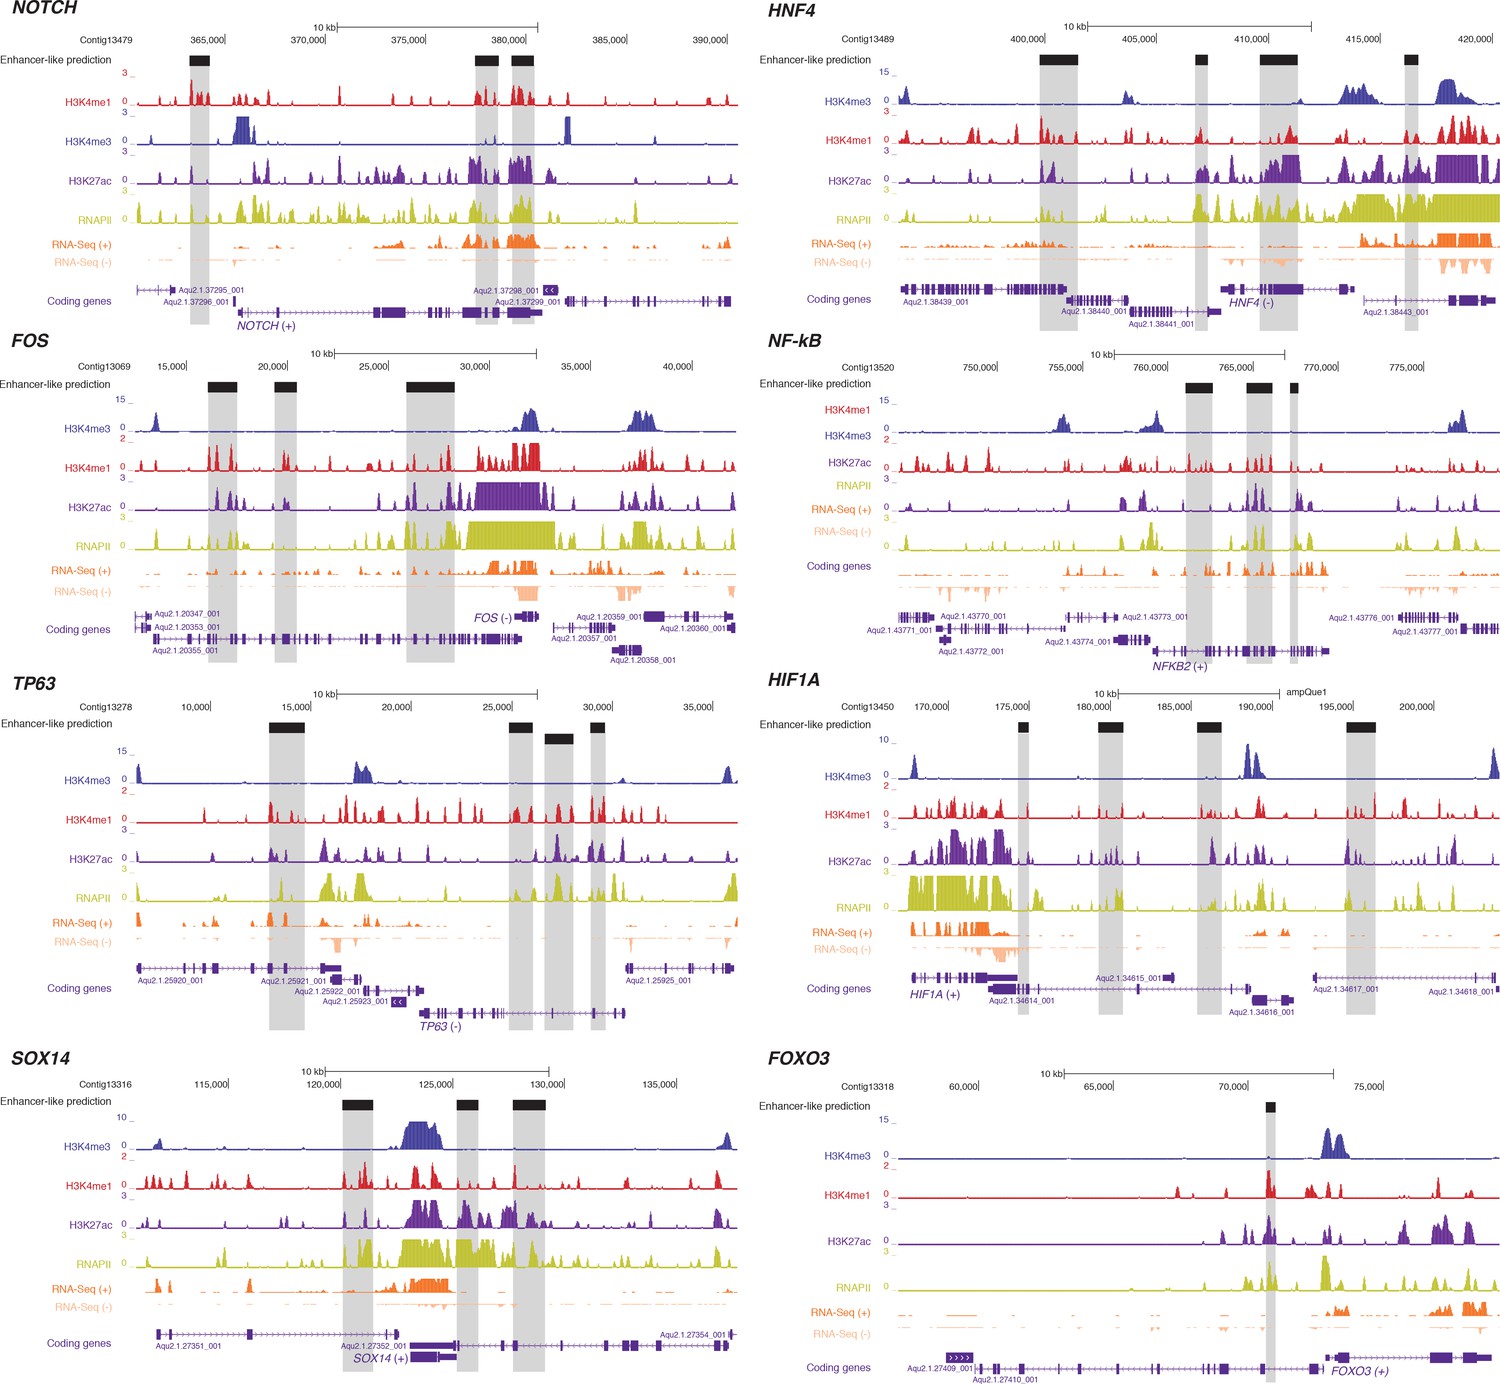
Examples of predicted enhancer-like elements in proximity of well-known developmental and transcription factor genes.
Protein-coding genes (purple) are shown, along with input DNA-normalized coverage of different histone modifications and RNA-seq expression. Regions of enrichments (high confidence peaks, representing reproducible events across true biological replicates) corresponding to adult putative enhancer-like sites are highlighted in grey.
Figure 7 with 1 supplement
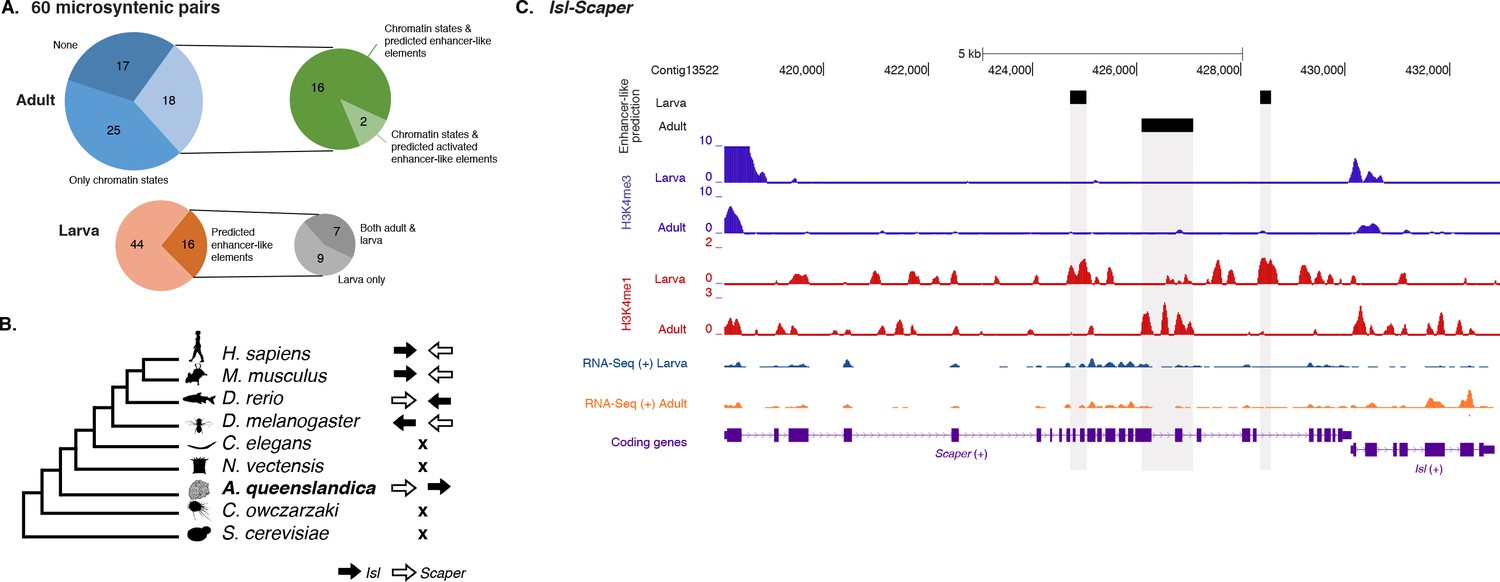
Amphimedon enhancer-like elements are enriched in metazoan-specific microsyntenic units.
(A) Putative adult and larva enhancer-like signatures identified in the 60 metazoan-specific microsyntenic pairs investigated. (B) The cladogram represents known phylogenetic distribution of the Isl2-Scaper microsyntenic gene pair across opisthokonts. The orientation of the arrow corresponds to gene orientation. Isl2-Scaper is not conserved in yeast, Capsaspora, Nematostella and C. elegans. (C) Enhancer elements in the Isl-Scaper microsyntenic gene pair locus in Amphimedon. Scaper and Isl genes (purple) are shown, along with input DNA-normalized coverage of H3K4me3 and H3K4me1 and RNA-seq expression in both adult and larva. Regions of enrichments (high confidence peaks, representing reproducible events across true biological replicates) corresponding to the predicted enhancer-like elements located within the introns of Scaper are highlighted in grey.
-
Figure 7—source data 1
60 microsyntenic units representing functional gene linkages and presence-absence of chromatin states containing typical eumetazoan enhancer histone PTM patterns (‘EnhP’,’ EnhWk’,’ TxEnhA’) (adult only) and/or in silico predicted enhancer-like elements (both larva and adult).
- https://doi.org/10.7554/eLife.22194.040
Figure 7—figure supplement 1
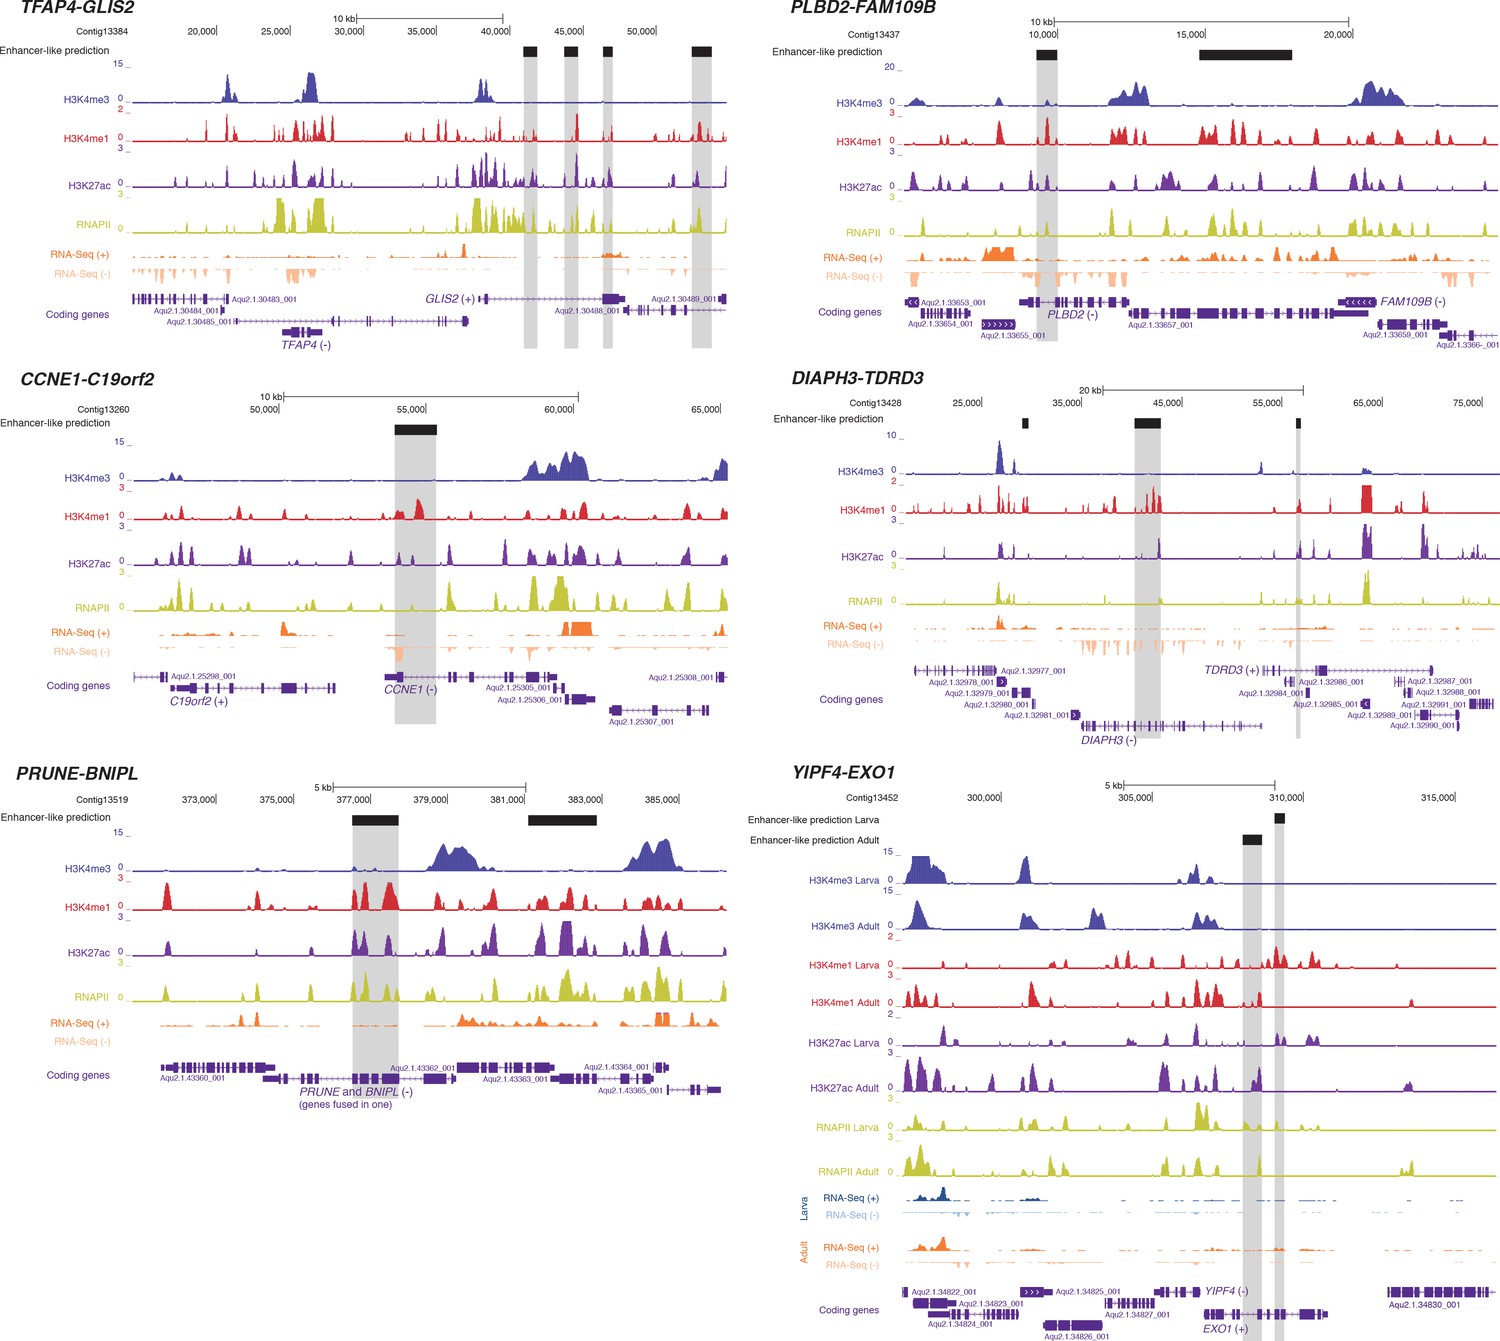
Additional examples of predicted enhancer-like elements in conserved microsyntenic units.
Protein-coding genes (purple) are shown, along with input DNA-normalized coverage of different histone modifications and RNA-seq/CEL-seq expression. Regions of enrichments (high confidence peaks, representing reproducible events across true biological replicates) corresponding to putative enhancer-like sites located within the microsyntenic units are highlighted in grey. Unless otherwise specified, adult data are shown.
Figure 8
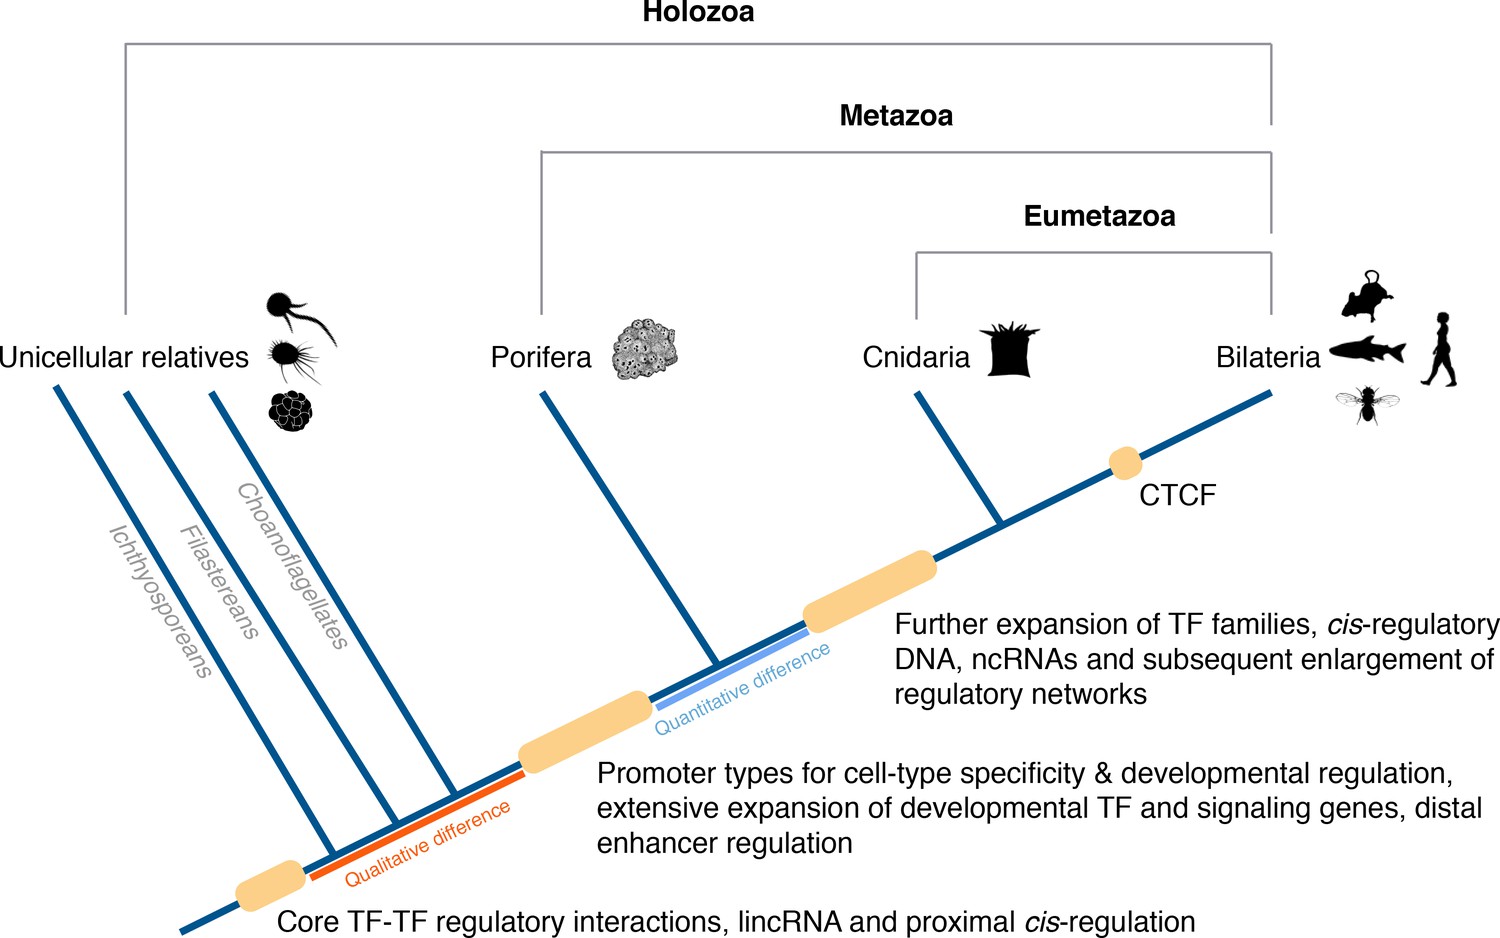
Origin of animal cis-regulatory complexity.
The phylogenetic relationship of representative animal lineages and unicellular holozoans is shown here. Highlighted are the major genomic innovations that correlate with the emergence and early diversification of animals. Some components of the metazoan regulatory landscape may predate the split of the metazoan and holozoan lineages, including core TF-TF regulatory interactions and long intergenic non-coding RNAs, which have been recently identified in unicellular relatives of animals (Sebé-Pedrós et al., 2016; de Mendoza et al., 2015) but for which the evolutionary origin is still unclear. With a complex gene regulatory landscape already in place at the dawn of animals, the expansion of developmental gene families (encoding transcription factors and components of signaling pathways), cis-regulatory DNA and non-coding RNAs, along with the emergence of the architectural protein CTCF to allow more complex enhancer-promoter interactions, appear to underlie the evolutionary diversification of the eumetazoan body plans.
Additional files
-
Supplementary File 1
Primer sequences.
- https://doi.org/10.7554/eLife.22194.043
Download links
A two-part list of links to download the article, or parts of the article, in various formats.
Downloads (link to download the article as PDF)
Open citations (links to open the citations from this article in various online reference manager services)
Cite this article (links to download the citations from this article in formats compatible with various reference manager tools)
Landscape of histone modifications in a sponge reveals the origin of animal cis-regulatory complexity
eLife 6:e22194.
https://doi.org/10.7554/eLife.22194


