Systems biology derived source-sink mechanism of BMP gradient formation
- University of Pennsylvania Perelman School of Medicine, United States
- Purdue University, United States
Figures
Figure 1
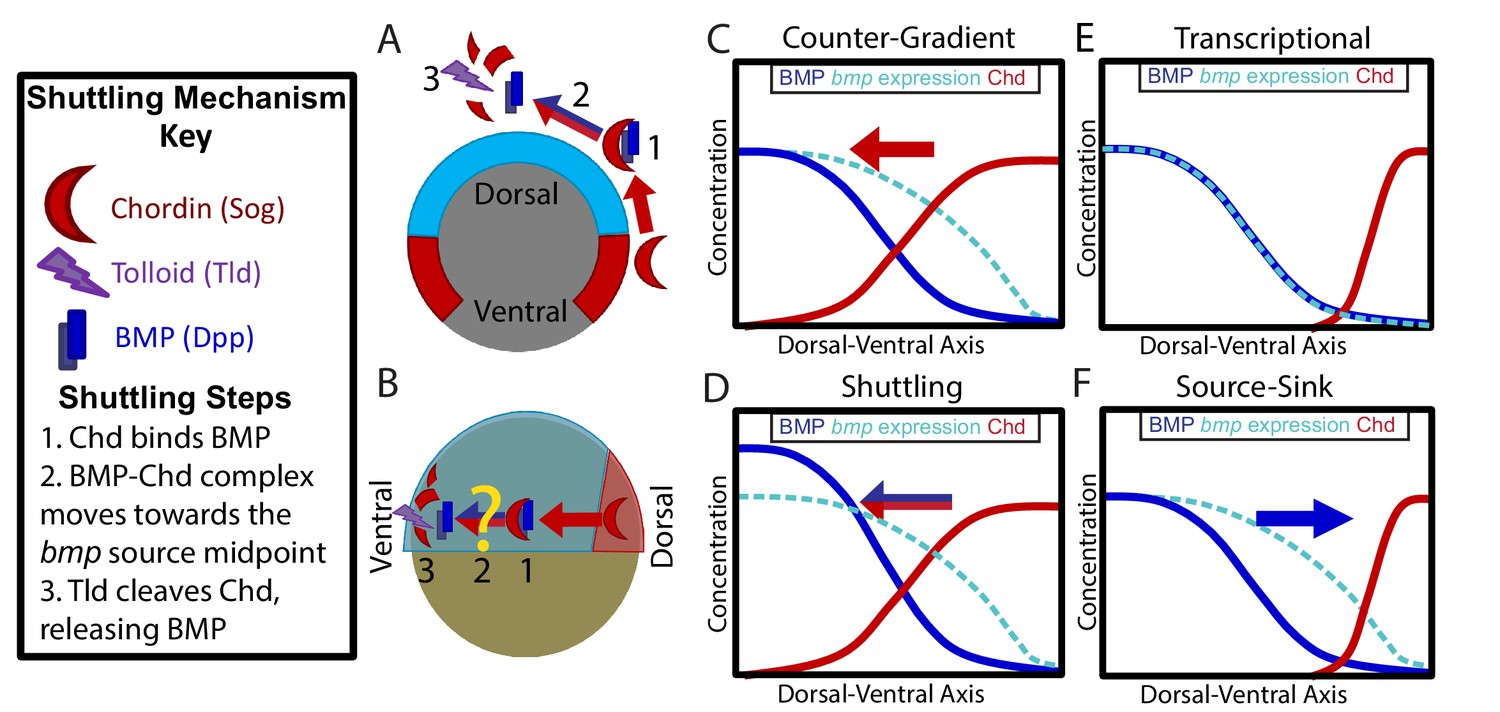
Potential Mechanisms of BMP Morphogen Gradient Formation.
(A) Cross-sectional view of the Drosophila embryo depicting Sog shuttling Dpp (the fly BMP ligand) dorsally. (B) Lateral view of the zebrafish embryo depicting Chordin (Chd) shuttling BMP ventrally. (C) Counter-Gradient: Chd diffuses ventrally to form a counter-gradient repressing BMP. (D) Shuttling: BMP bound to Chd is shuttled ventrally, where it is released by Tolloid cleavage. (E) Transcriptional: BMP stays where it is produced, mirroring the bmp expression gradient. (F) Source-sink: BMP diffuses from its source of ventral production to a sink of dorsal Chd.
Figure 2

Dynamics of the WT P-Smad5 gradient across head and trunk patterning.
(A–E) Animal views of maximum projections (MP) of P-Smad5 stained individual embryos. (A’–E’) Animal views of nuclear intensities of all nuclei from the embryos shown above. (F) Average marginal intensities for 4.7–6.7 hpf (4.7: N = 3, 5.3: N = 4, 5.7: N = 13, 6.3: N = 11, 6.7: N = 4). Error bars indicate standard deviation. (G) Slope of the P-Smad5 gradients shown in panel F. Dotted line separates high slope (>0.5 a.u./deg) regions from low slope regions. (H) Change in cell number versus (vs.) developmental time of embryos fixed from a single cross and nuclei stained with Sytox Orange. (I) Cell number varies between different crosses of WT fish fixed at 5.7 hpf. (H,I) Gray dots are individual embryo cell counts. Red lines show the mean number of cells at a given time point, red boxes show 95% confidence interval, blue boxes show one standard deviation.
Figure 3
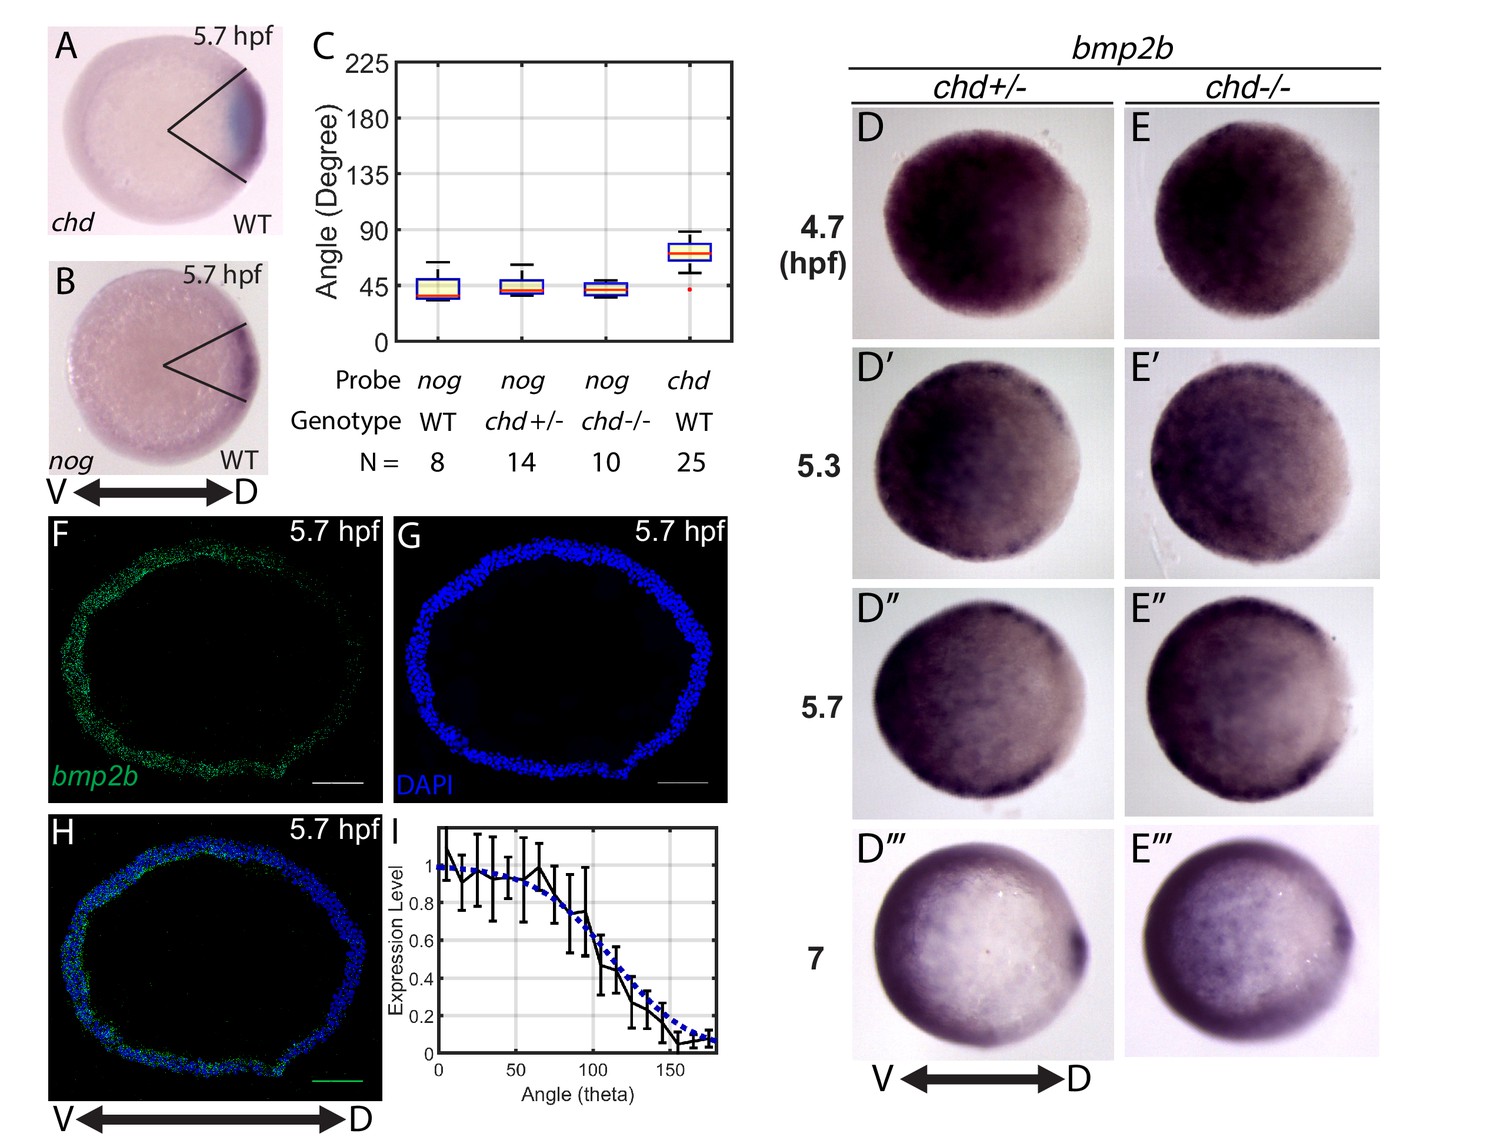
Measuring the bmp2b, chordin, and noggin expression domains.
Animal pole views of wholemount in situ hybridizations of the expression of (A) chd (N = 25), and (B) nog (N = 8) in WT embryos. (C) Measured domain size of chd and nog domains via wholemount in situ hybridization in WT and chd mutant embryos. (D–D’’’) bmp2b in chd ± embryos at 4.7 (N = 10), 5.3 (N = 15), 5.7 (N = 20), and 7 hpf (N = 16), and (E–E’’’) bmp2b expression in chd -/- embryos at 4.7 (N = 6), 5.3 (N = 16), 5.7 (N = 13), and 7 hpf (N = 12). (F–H) Fluorescent in situ hybridization (FISH) signal of bmp2b from a marginal slice at 5.7 hpf with a DAPI nuclear stain. Scale bars = 100 μm. (I) Quantification of FISH of bmp2b expression from ventral to dorsal (black line, N = 5) compared to the BMP production gradient used in the mathematical model (blue dotted line). Error bars indicate standard deviation.
Figure 4 with 1 supplement
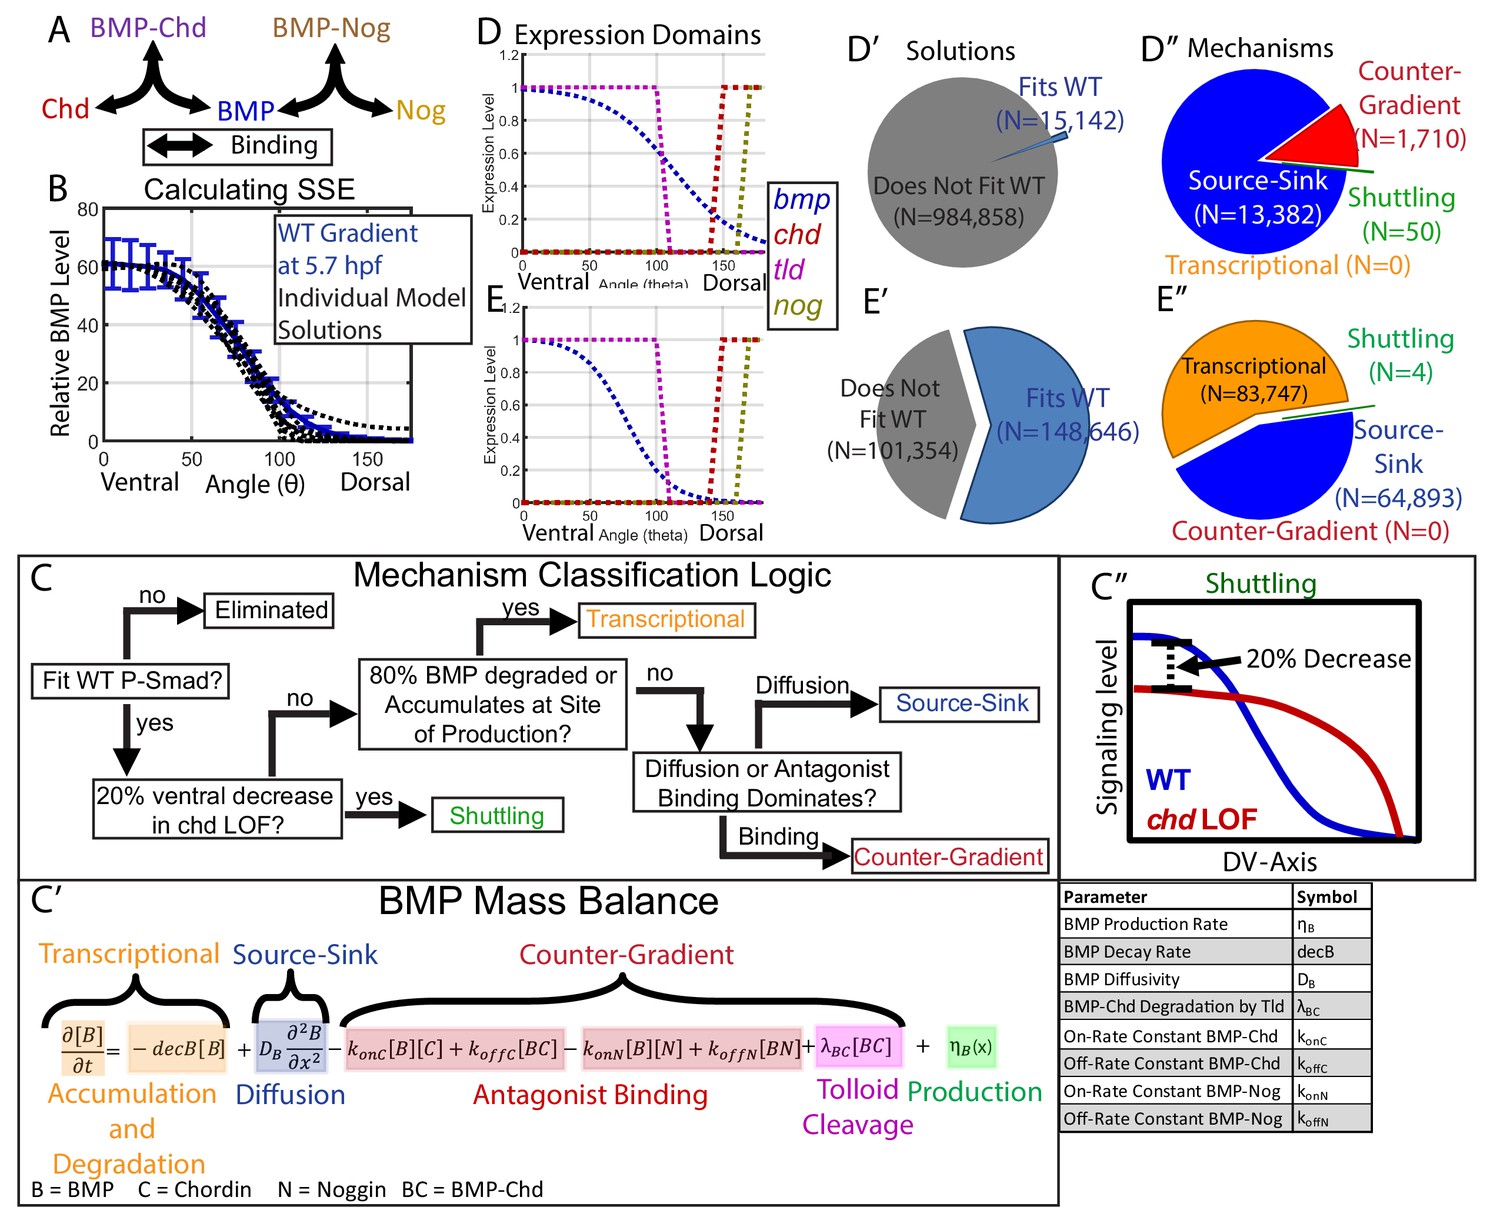
Creation of a mathematical model of BMP gradient formation.
(A) Depiction of the species and binding possibilities modeled. (B) BMP distributions of 10 individual model solutions (black dotted lines) plotted against the WT 5.7 hpf P-Smad5 gradient (blue line). Error bars indicate standard deviation. (C) Flow-chart of model mechanism classification. (C’) BMP mass balance from model labeled to indicate which terms contribute to the source-sink, counter-gradient, and transcriptional mechanisms at each point. (C”) Shuttling mechanism was defined by a 20% decrease at the ventral-most point in chd LOF compared to WT. (D) Expression domains of bmp (blue), tld (purple), chd (red), and nog (yellow) used in the model. (E) Expression domains of bmp (blue), tld (purple), chd (red), and nog (yellow) used for the alternative scenario where the bmp expression domain mirrors the measured P-Smad5 gradient. (D’, E’) Pie chart showing how many parameter combinations fit the WT data (blue) and how many failed to do so (grey). (D”, E”) Pie chart showing how many parameter combinations were classified to have a source-sink (blue), counter-gradient (red), transcriptional (orange), or shuttling (green) mechanism.
Figure 4—figure supplement 1
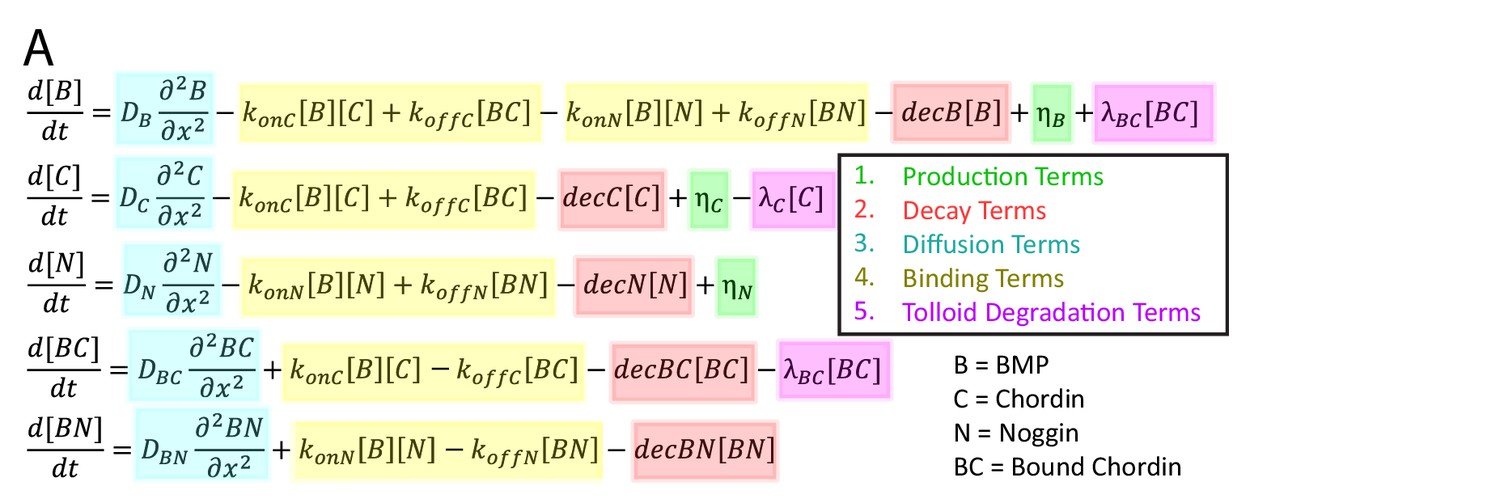
Model-based screen of DV patterning in zebrafish.
(A) System of differential equations used for model-based screen.
Figure 5

Biophysical values of individual simulations that fit the WT P-Smad5 gradient.
(A–L) Scatter plots comparing biophysical parameters of 1000 randomly selected solutions classified by mechanism that fit the WT data. Combinations that failed to fit the WT P-Smad5 gradient are small grey dots. We plot solutions as large circles colored according to their mechanism, which is based on definitions outlined in Figure 4C: counter-gradient (red), source-sink (blue), transcriptional (orange), or shuttling (green). We plotted additional shuttling solutions in order to better illustrate trends. (A–F) Simulations using domains displayed in Figure 4D. (G–L) Simulations using domains displayed in Figure 4E. (A,G) BMP diffusivity vs. BMP decay rate. (B,H) Chd diffusivity vs. Chd decay rate, which includesthe rate of Chd cleavage by Tld. (C,I) Range was estimated as sqrt(diffusivity/decay). (D,J) Diffusivity of BMP bound to Chd vs. decay rate of BMP bound to Chd. (E,K) Range of Nog protein. (F,L) Chd and BMP-Chd cleavage rate by Tld.
Figure 6 with 1 supplement
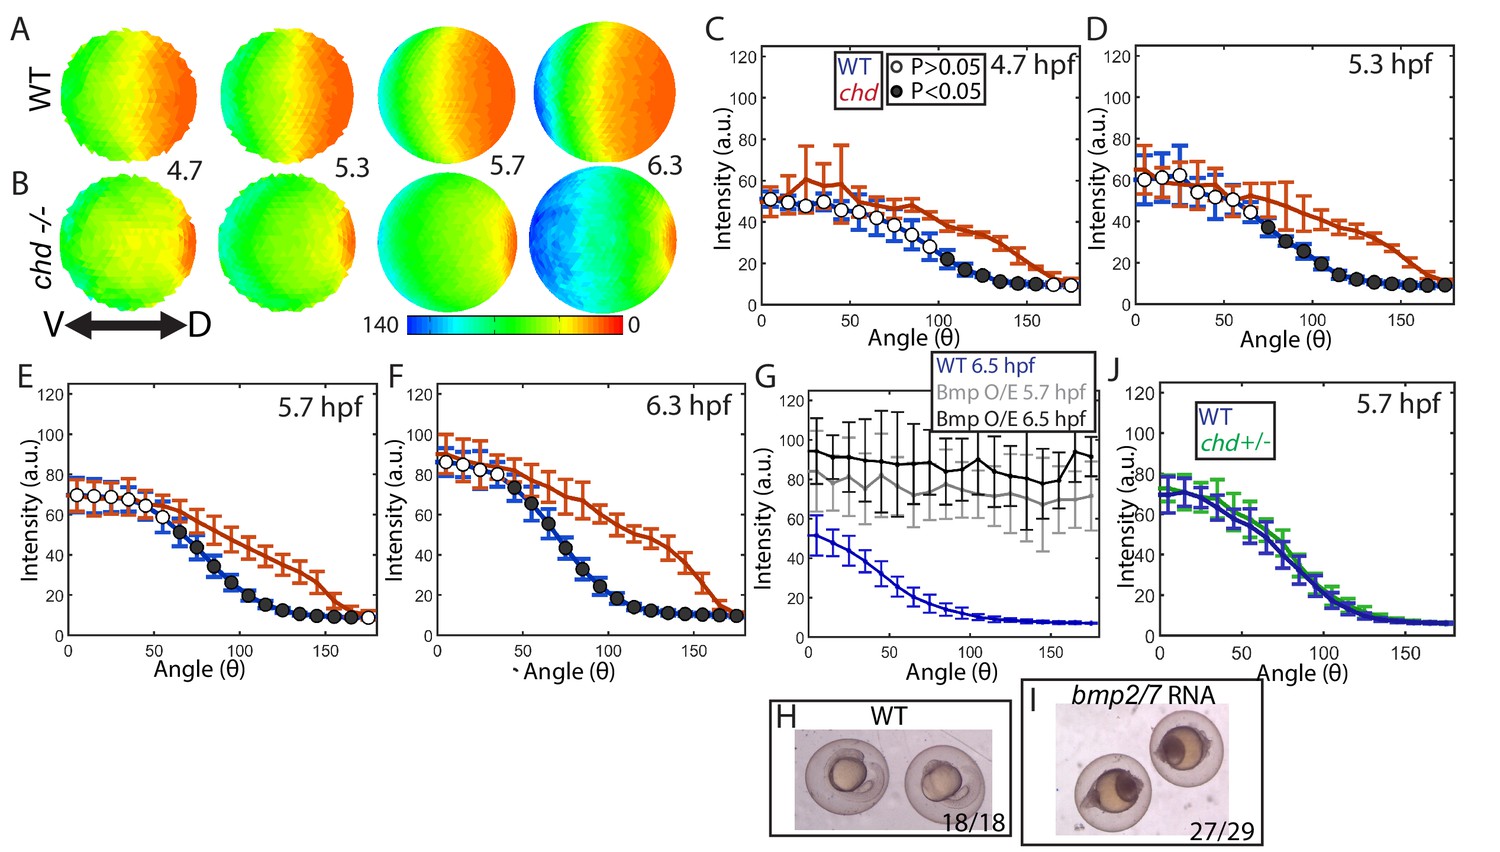
Effect of Chd on gradient shape and ligand shuttling.
(A,B) Animal views of average intensities from each time-point in (A) WT (4.7: N = 3, 5.3: N = 4, 5.7: N = 13, 6.3: N = 11) and (B) chd mutant (4.7: N = 3, 5.3: N = 5, 5.7: N = 11, 6.3: N = 9) embryos. (C–F) Average marginal intensities for WT (blue) and chd mutant (red) embryos from 5.7 to 6.3 hpf. (G) Average marginal intensities for WT (blue, N = 4) and bmp2/7 RNA injected embryos at 5.7 (grey, N = 4) and 6.3 hpf (black, N = 5). Error bars indicate standard deviation. (H,I) Fully ventralized (V5) embryos injected with 6 pg of bmp7a RNA and 12 pg of bmp2b RNA vs uninjected WT siblings. (J) WT (N = 9) vs chd+/- (N = 10) at 5.7 hpf.
Figure 6—figure supplement 1
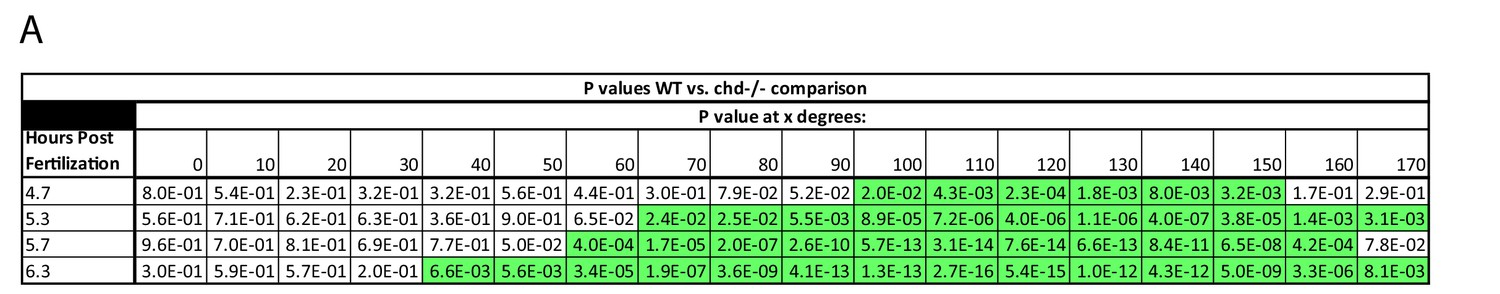
Effect of Chd on gradient shape and ligand shuttling.
(A) P-Values of WT vs. chd mutant embryo margin comparison. P-values less than 0.05 are highlighted in green.
Figure 7
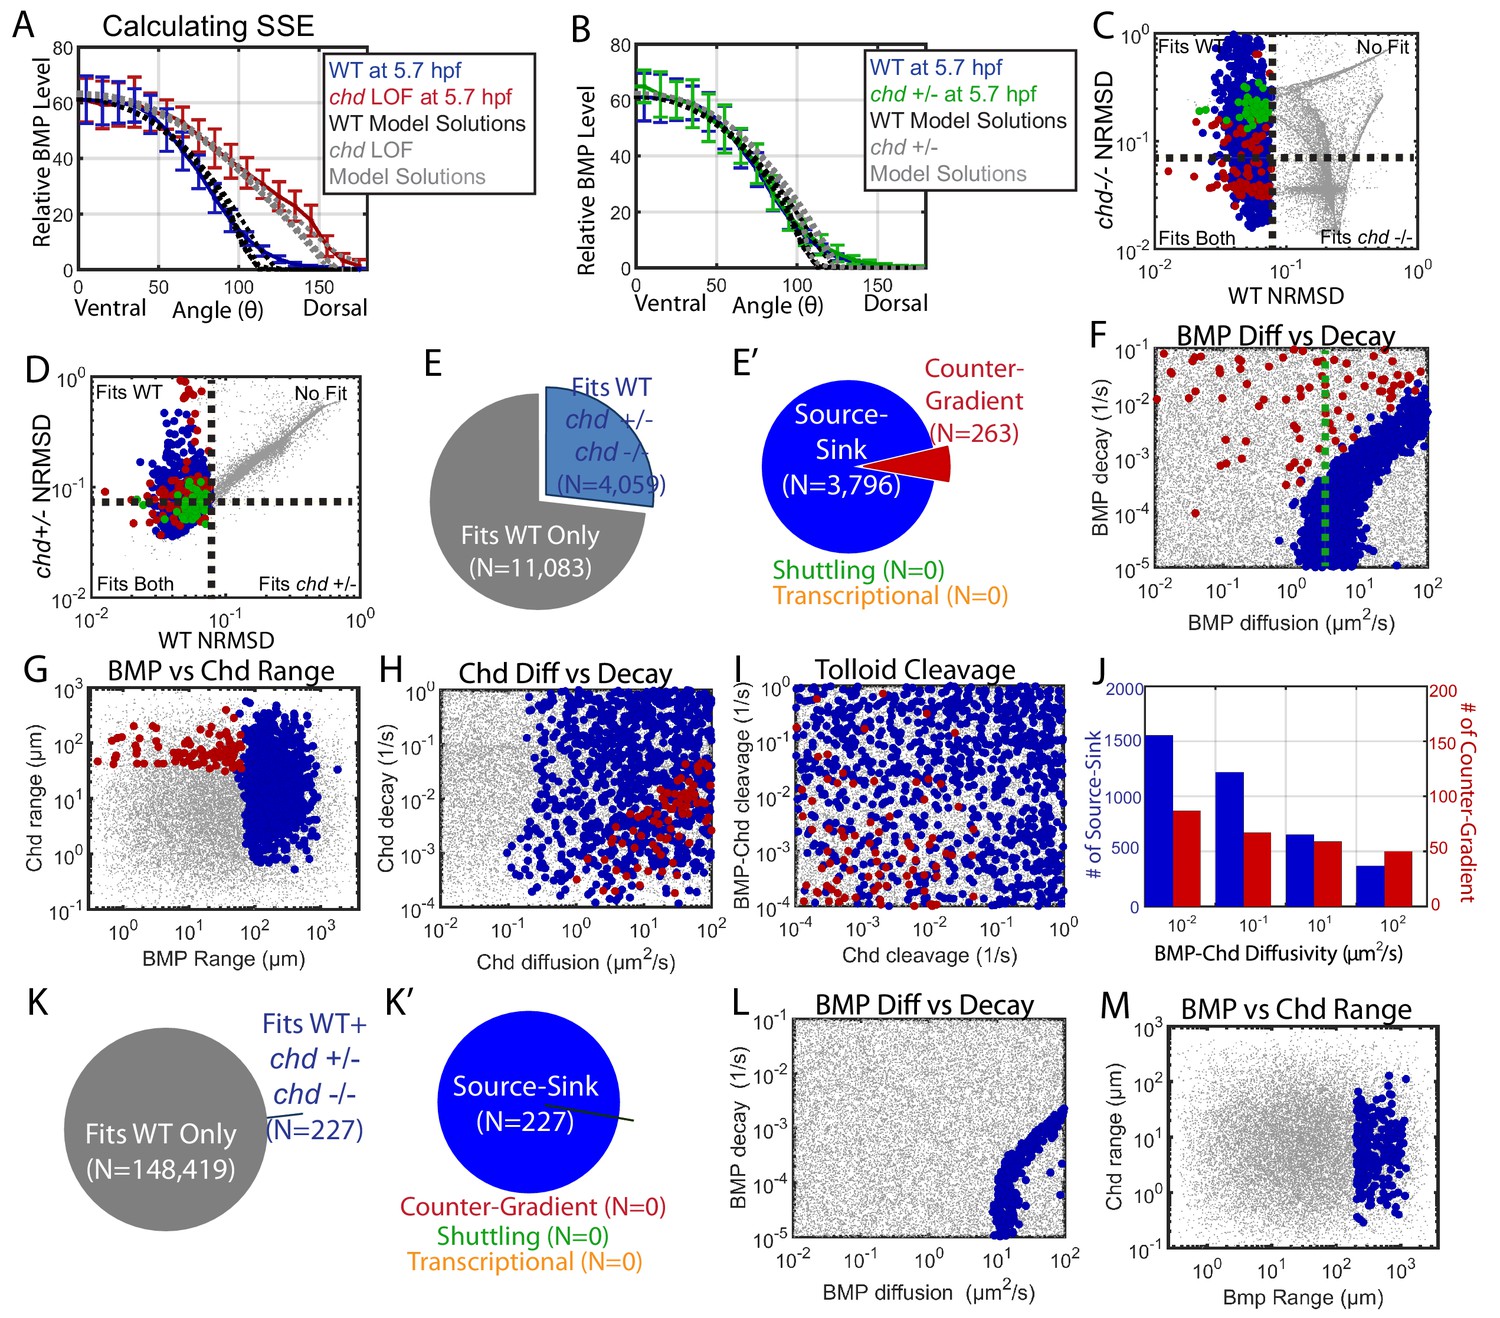
Biophysical values of individual simulations that fit both the WT and chd LOF P-Smad5 gradients.
(A) BMP distributions of 5 individual modeling solutions (WT: black dotted lines, chd LOF: grey dotted lines) plotted against WT (blue line) and chd LOF (red line) 5.7 hpf P-Smad5 gradients. Error bars indicate standard deviation of experimental P-Smad5 intensity. (B) BMP distributions of 5 individual modeling solutions (WT: black dotted lines, chd +/-: grey dotted lines) plotted against WT (blue line) and chd +/- (green line) 5.7 hpf P-Smad5 gradients. Error bars indicate standard deviation of experimental P-Smad5 intensity. (C,D,F–J,L, M) 1000 randomly selected parameter combinations capable of fitting both the WT data, chd +/-, chd LOF data classified by mechanism. Larger circular points fit the WT P-Smad gradient and are colored based on their mechanism according to the definitions outlined in Figure 4C: counter-gradient (red), source-sink (blue), transcriptional (orange), or shuttling (green). Combinations that failed to fit the WT P-Smad5 gradient are small grey dots. (C–D) Normalized Root Mean Squared Deviation (NRMSD) between the measured P-Smad5 and the model BMP distributions. Black dotted lines mark the 8% threshold. (C) Comparing WT and chd LOF. (D) Comparing WT and chd +/-. (E) Parameter combinations that fit both the WT and chd LOF data (blue) and those that failed to do so (grey). (E’) parameter combinations were classified to have a source-sink (blue), counter-gradient (red), or shuttling (green) mechanism. (F–J) Simulation using the bmp expression domain displayed in Figure 4D. (L,M) Simulation using the bmp expression domain displayed in Figure 4E. (F,L) BMP diffusivity vs. BMP decay rate. Green dotted line marks the BMP diffusivity we measured using FRAP (4.4 µm2/s). (G,M) Range was estimated as sqrt(diffusivity/decay). (H) Chd diffusivity vs. Chd decay rate plus the rate of Chd cleavage by Tld. (I) Rate of Chd cleavage by Tld vs rate of BMP-Chd cleavage by Tld. (J) BMP-Chd diffusivity for source-sink and counter-gradient simulation solutions. (K) Pie chart showing the parameter combinations that fit the WT data (blue) or failed to do so (grey) for the alternative scenario where the bmp expression domain mirrors the measured P-Smad5 gradient (Figure 3I). (K’) Pie chart of the solutions that had a source-sink (blue), counter-gradient (red), transcriptional (orange), or shuttling (green) mechanism.
Figure 8
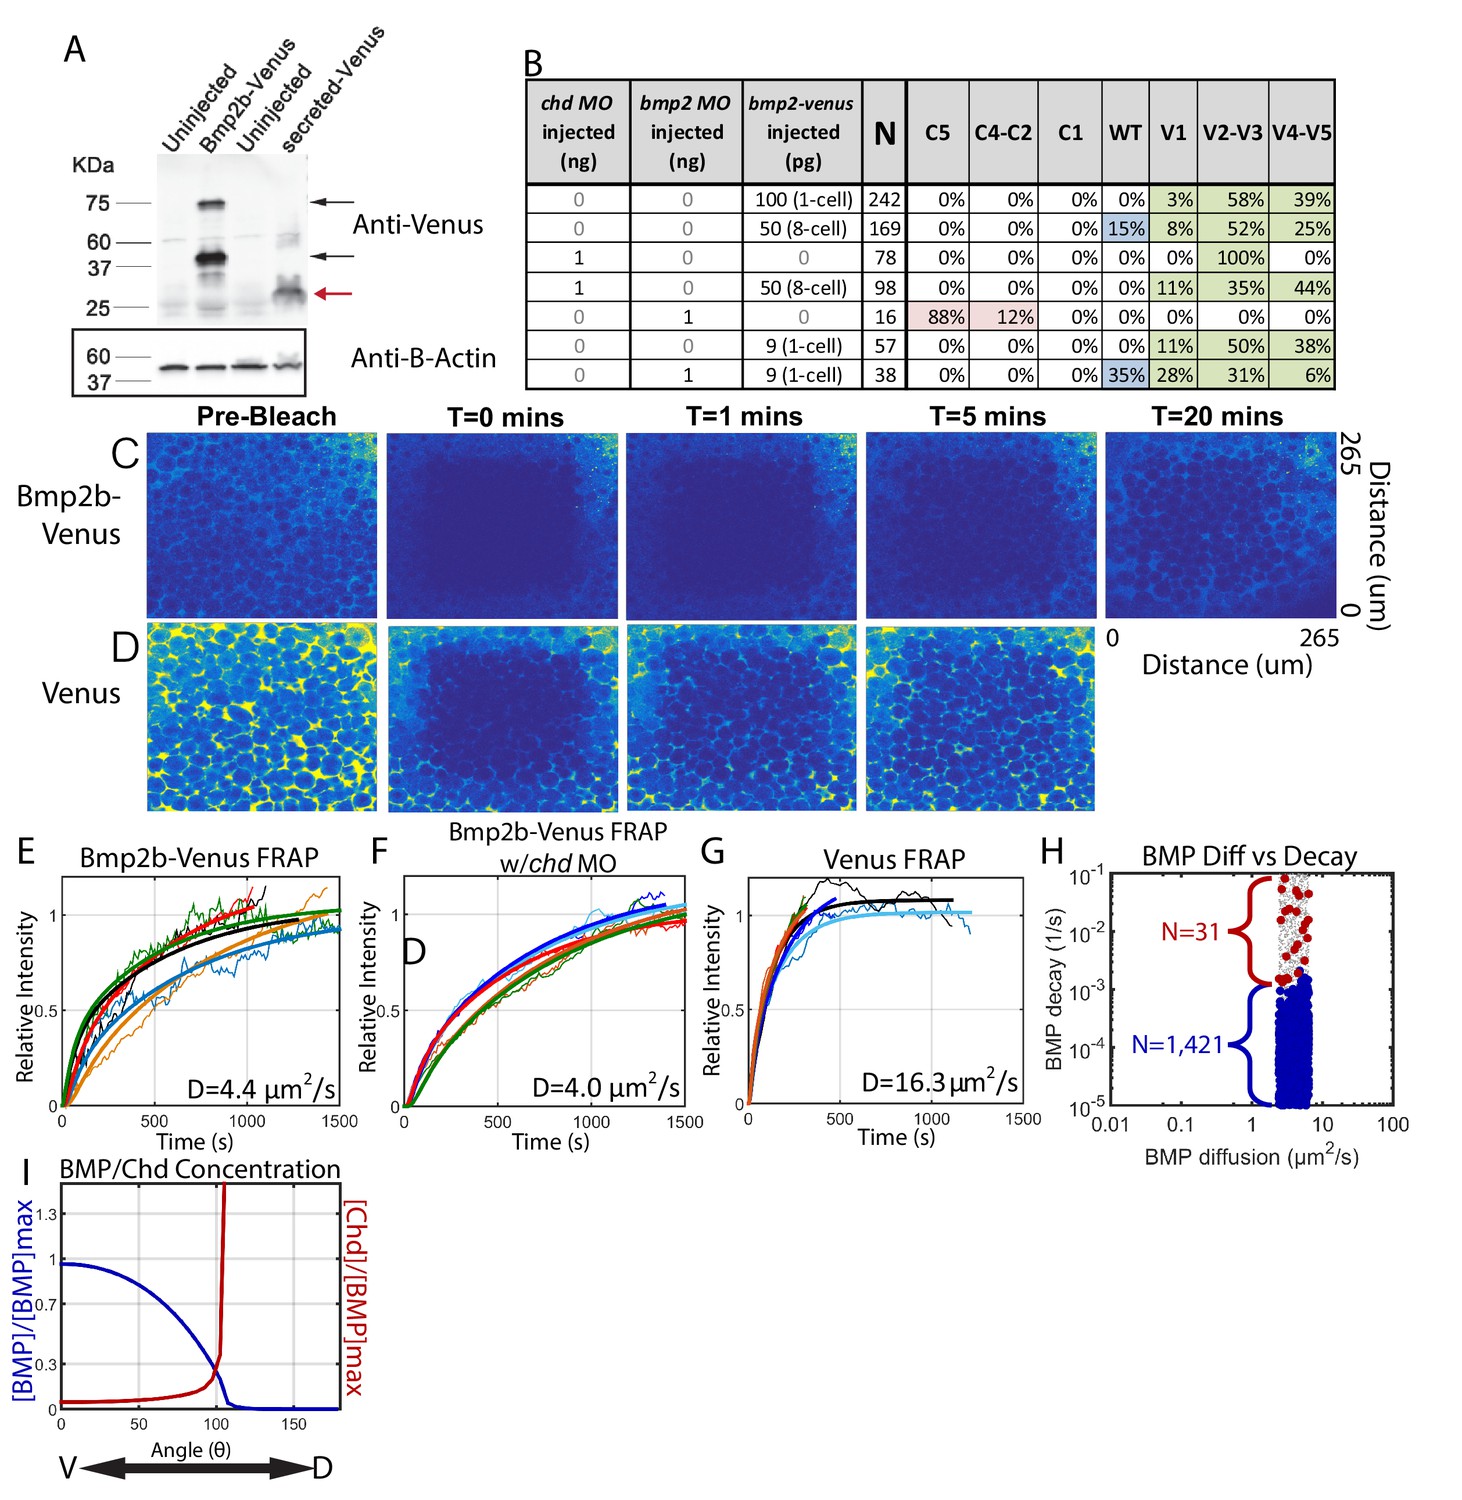
Measuring Bmp2b-Venus diffusivity via FRAP.
(A) Detection of Bmp2b-Venus and secreted Venus proteins by western blot. Embryos were injected with bmp2b-venus mRNA (250 pg) or secreted-Venus mRNA (200 pg) at the one-cell stage. Protein lysates were prepared at late blastula stage. In the Bmp2b-Venus overexpression sample, two major protein bands were detected by Venus antibody (black arrows). The larger molecular weight protein is the pro- and mature domains of Bmp2b with Venus protein (669 amino acids (AA),~74 KDa). The smaller protein is the mature domain of Bmp2b with Venus protein (376 AA,~41 KDa). The secreted Venus protein (248 AA,~27 KDa) is also detected in the secreted-Venus overexpression sample (red arrow). β-actin was used as a loading control. (B) 24 hpf phenotypes of embryos injected with the bmp2b-venus construct used for FRAP experiments, controls, and rescue. Dorsalization was classified as C5: Loss of all ventral structures; C4-C3: Loss of, or truncated tail; C2-C1: Loss of ventral tail fin. Ventralization is classified as V1: reduction is eye size; V2-V3: the eyes, notochord, and anterior brain are partially or completely absent; or V4-V5: complete loss of all dorsal structures. Fluorescent BMP-Venus (C) or Venus (D) recovery after photobleaching for 20 min. (E–G) Plots of fluorescent intensity recovery in the extracellular region. Bold lines are mean curves, thin lines are raw intensity data. (H) BMP diffusivity vs. BMP decay rate for simulations that fit WT, chd +/-, and chd -/- P-Smad5 profiles and were within 2 µm2/s of 4.4 µm2/s. Large blue circles are simulations classified as source-sink, red are counter-gradient, and small grey dots failed to fit the measured P-Smad5 profiles. (I) The mean BMP and Chd concentrations in all solutions that fit the WT, chd-/-, and chd +/- P-Smad5 data and within a diffusivity of 2.4 and 6.4 µm2/s that are also robust to uniform Chd production.
Figure 9
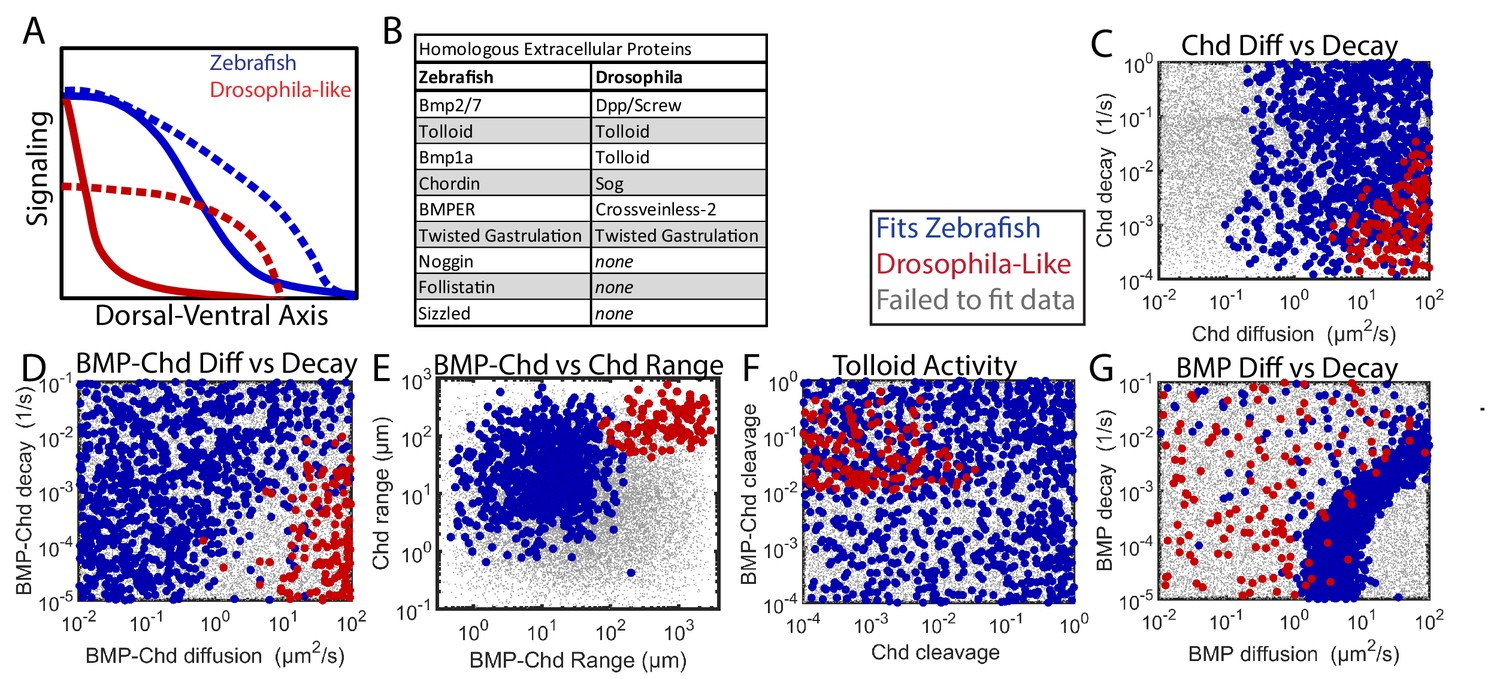
Comparing Zebrafish and Drosophila-like solutions.
(A) Depiction of the BMP gradients patterning the Drosophila and zebrafish DV axis. The Drosophila DV axis has been flipped to match the zebrafish. Solid lines are WT. Dotted lines are chd or sog LOF. (B) List of homologous proteins involved in DV patterning of zebrafish and Drosophila. (C–F) Solutions able to fit WT and chd LOF zebrafish data (blue) vs. solutions capable of fitting Drosophila-like WT and Drosophila-like sog LOF gradients (red). Parameter combinations that failed to fit either are represented as small grey dots. (C) Chd diffusivity vs. Chd decay rate, which includes the rate of Chd cleavage by Tld. (D) Diffusivity of BMP bound to Chd vs. decay rate of BMP bound to Chd. (E) Range was estimated as sqrt(diffusivity/decay). (F) Cleavage rate of Chd and BMP-Chd by Tolloid. (G) BMP diffusivity vs. BMP decay rate.
Figure 10
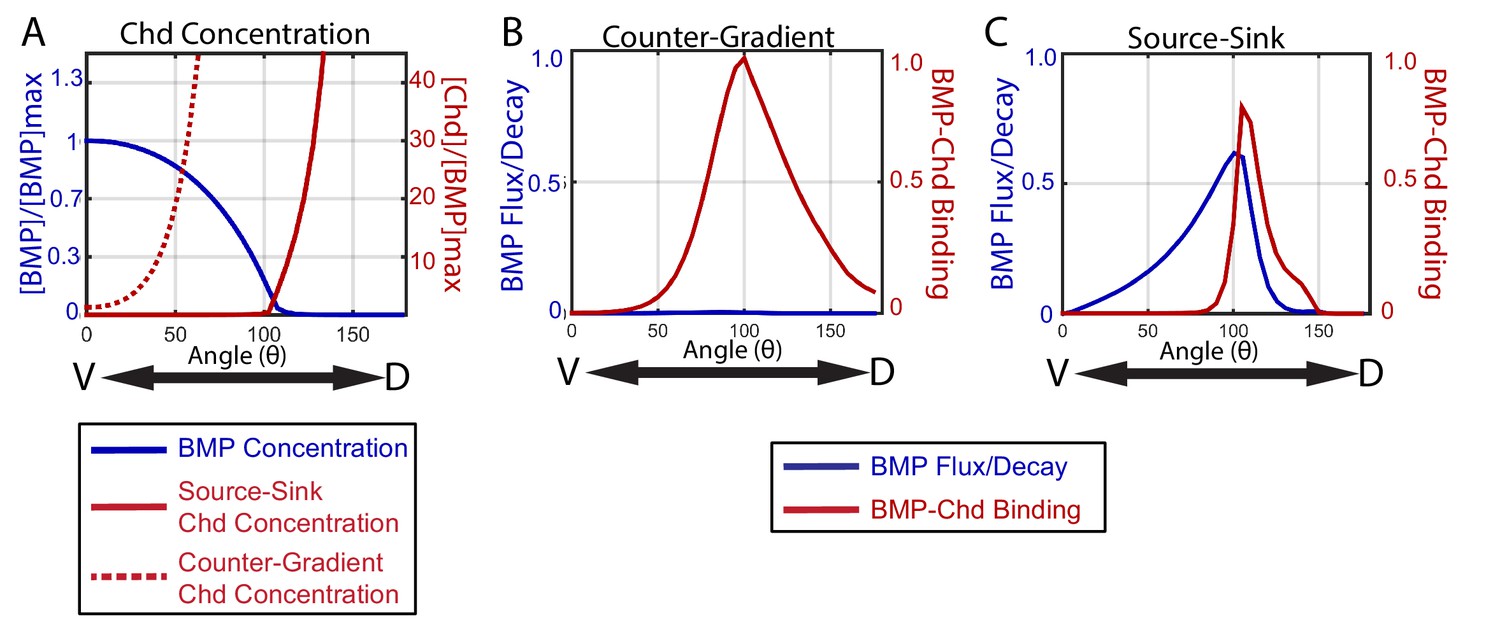
How the source-sink and counter-gradient mechanisms shape the gradient.
(A) The mean BMP and Chd concentrations in all source-sink and counter-gradient solutions fitting WT, chd LOF, and chd heterozygous P-Smad5 data and within a diffusivity between 2.4 and 6.4 µm2/s. (B) The diffusive flux divided by the decay [(DBMP/decBMP)*(d[BMP]/dx)*(1/[BMP]max)] of BMP (blue) with units of 103*µm and rate of binding of BMP to Chd (kon*[BMP]*[Chd]) (red) with units of 3.6*10−2*sec−1 for representitive (B) Counter-Gradient and (C) Source-Sink solutions fitting WT, chd LOF, and chd heterozygous P-Smad5 data and within a diffusivity between 2.4 and 6.4 µm2/s (Figure 8).
Figure 11
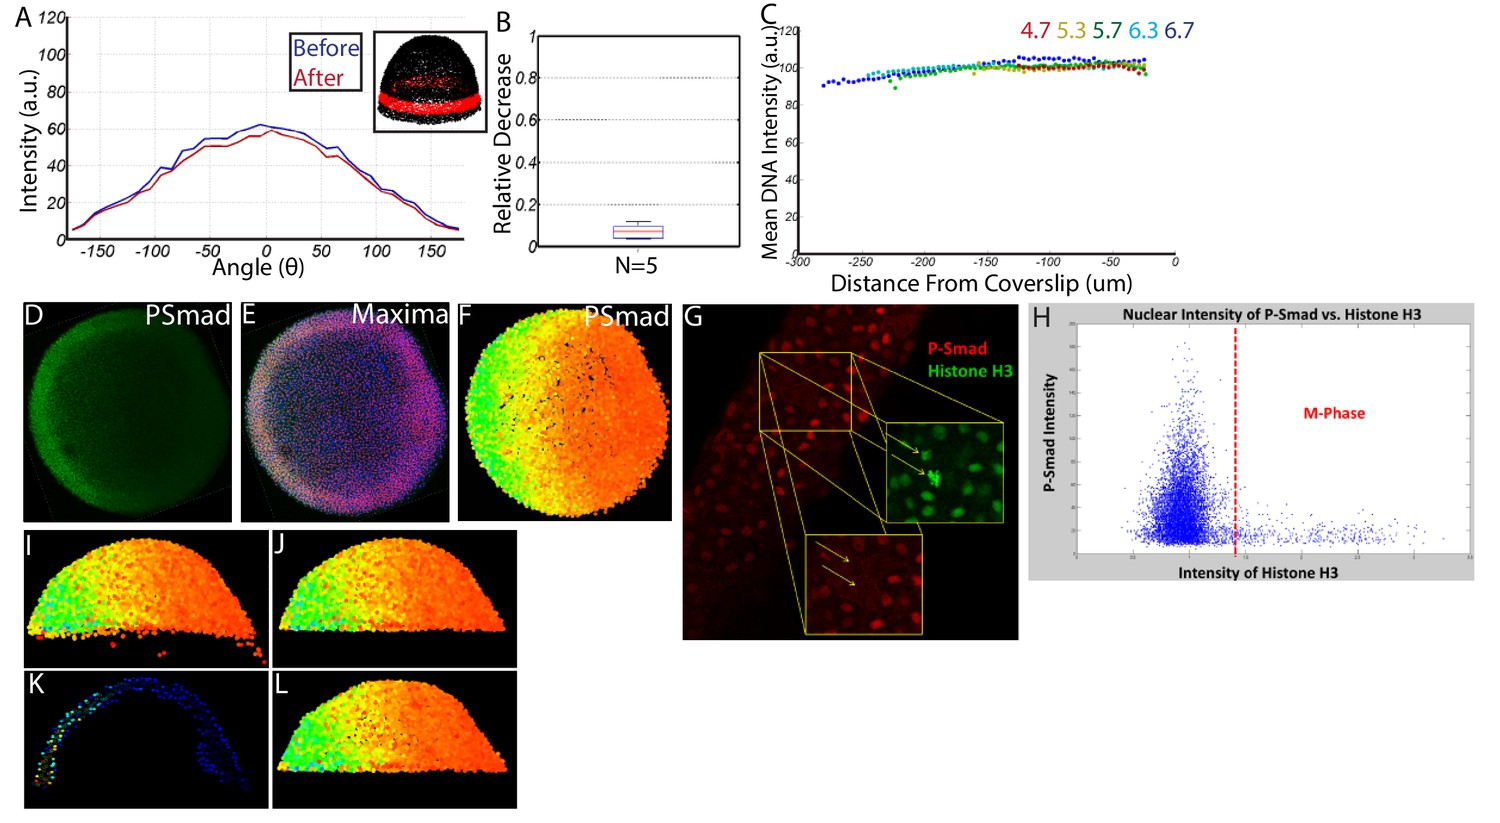
Quantifying nuclear P-Smad5 intensities embryo-wide.
(A) Marginal P-Smad5 intensity from a chd LOF embryo imaged twice. (B) Average P-Smad5 intensity drop-off from photo-bleaching of all nuclei in embryos imaged twice (N = 5). (C) There is minimal intensity drop-off due to spherical aberration, as shown by the average intensity of the nuclear DNA stain (Sytox Orange) versus distance from the coverslip (4.7: N = 3, 5.3: N = 4, 5.7: N = 13, 6.3: N = 11, 6.7: N = 4). (D) Maximum projection of an animal view of a single embryo. (E) Nuclei centerpoints (red dots) identified from the sytox nuclear stain (blue). (F) Measured centerpoint nuclear intensities displayed as a heatmap. (G) P-Smad5 is absent in dividing cells (red stain, yellow arrows). Dividing cells have bright condensed chromatin (green stain, yellow arrows). (H) Bright condensed chromatin was used to identify dividing cells. Cells with a 40% elevated DNA stain over the mean (red line) were eliminated from the analysis. (I) Lateral view of a single embryo. (J) Sparse Yolk Syncytial Layer nuclei below the margin are eliminated. (K) Single lateral slice depicting the elimination of remaining yolk syncytial layer nuclei and enveloping layer nuclei by subtracting the outer 15% of all nuclei (filled in circles) to leave only deep cell nuclei (open circles). (L) Lateral view of embryo after outer 15% has been eliminated.
Tables
Table 1
List of the parameter ranges used in the computational model-based screen.
Values range between the upper and lower bound. Note that the dissociation constant of BMP-Chd and BMP-Nog was held constant, but the on- and off- rates were allowed to vary.
| Parameter | Units | Symbol | Lower bound | Upper bound |
|---|---|---|---|---|
| BMP Production Rate | nM/s | ηB | 10−2 | 102 |
| BMP Decay Rate | 1/s | decB | 10−1 | 10−5 |
| BMP Diffusivity | µm2/s | DB | 10−2 | 102 |
| Chd Production Rate | nM/s | ηC | 10−2 | 102 |
| Chd Decay Rate | 1/s | decC | 10−1 | 10−5 |
| Chd Diffusivity | µm2/s | DC | 10−2 | 102 |
| Nog Production Rate | nM/s | ηN | 10−2 | 102 |
| Nog Decay Rate | 1/s | decN | 10−1 | 10−5 |
| Nog Diffusivity | µm2/s | DN | 10−2 | 102 |
| BMP-Nog Decay Rate | 1/s | decBN | 10−1 | 10−5 |
| BMP-Nog Diffusivity | µm2/s | DBN | 10−2 | 102 |
| BMP-Chd Decay Rate | 1/s | decBC | 10−1 | 10−5 |
| BMP-Chd Diffusivity | µm2/s | DBC | 10−2 | 102 |
| Chd Degradation by Tld | 1/s | λC | 100 | 10−4 |
| BMP-Chd Degradation by Tld | 1/s | λBC | 100 | 10−4 |
| Length of the Embryo | µm | - | 700 | 700 |
| Length of the Chd domain (from dorsal) | µm | - | 145 | 145 |
| Length of the Nog domain (from dorsal) | µm | - | 78 | 78 |
| Length of the Tolloid domain (from ventral) | µm | - | 400 | 400 |
| Dissociation Constant of BMP-Chd | nM | - | 1 | 1 |
| Dissociation Constant of BMP-Nog | nM | - | 0.1 | 0.1 |
| Time | min | t | 130 | 130 |
Additional files
-
Supplementary file 1
Image analysis and imaging data.
- https://doi.org/10.7554/eLife.22199.017
-
Transparent reporting form
- https://doi.org/10.7554/eLife.22199.018
Download links
A two-part list of links to download the article, or parts of the article, in various formats.
Downloads (link to download the article as PDF)
Open citations (links to open the citations from this article in various online reference manager services)
Cite this article (links to download the citations from this article in formats compatible with various reference manager tools)
Systems biology derived source-sink mechanism of BMP gradient formation
eLife 6:e22199.
https://doi.org/10.7554/eLife.22199


