Oncometabolite D-2-Hydroxyglutarate enhances gene silencing through inhibition of specific H3K36 histone demethylases
- University of California, Berkeley, United States
Figures
Figure 1 with 2 supplements
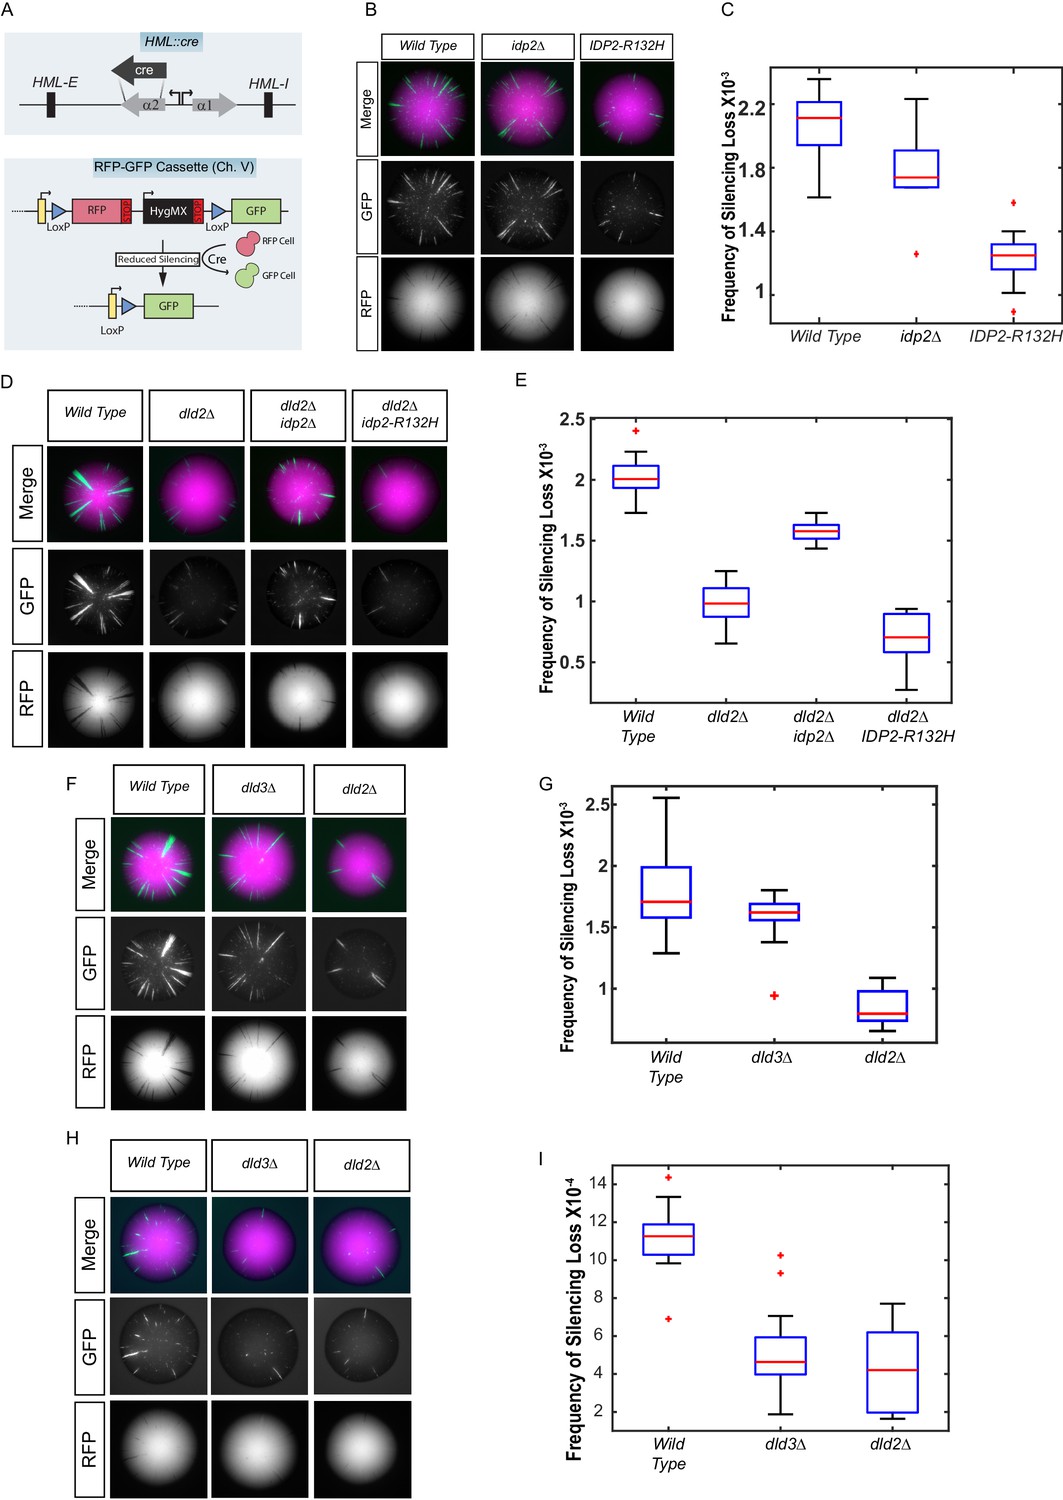
Yeast versions of tumor-associated isocitrate dehydrogenase mutation caused increased stabilization of heterochromatin.
(A) Illustration of the CRASH (Cre reported altered states of heterochromatin) assay used to measure the strength of heterochromatic gene silencing at the HML locus. (B) Images of colonies with the CRASH reporter assay that were wild type (JRY10791), idp2Δ (JRY10732), or IDP2-R132H (JRY10731). (C) Box plots of the average frequency of loss-of-silencing events from mutants in panel B calculated using MORPHE (Liu et al., 2016). (D) Representative colony images of CRASH reporter strains with wild type (JRY10790) or mutant dld2Δ (JRY10733), dld2Δ idp2Δ (JRY10735), or dld2Δ IDP2-R132H (JRY10734). (E) The frequency of silencing loss from mutants in panel D. (F) Representative colony images of CRASH reporter strains with wild type (JRY10790) or mutant dld3Δ (JRY10752) and dld2Δ (JRY10733). (G) Plots of the frequency of silencing loss from mutants in panel F. (H) Images of colonies with the CRASH reporter assay that were wild type (JRY10790), dld2∆ (JRY10733), or dld3∆ (JRY10752). Colonies were grown on CSM-Trp-glucose agar plates for 7 days at 30°C. Representative images show the merged and separate GFP and RFP channels. (I) Plots of the frequency of silencing loss from mutants in panel H.
Figure 1—figure supplement 1
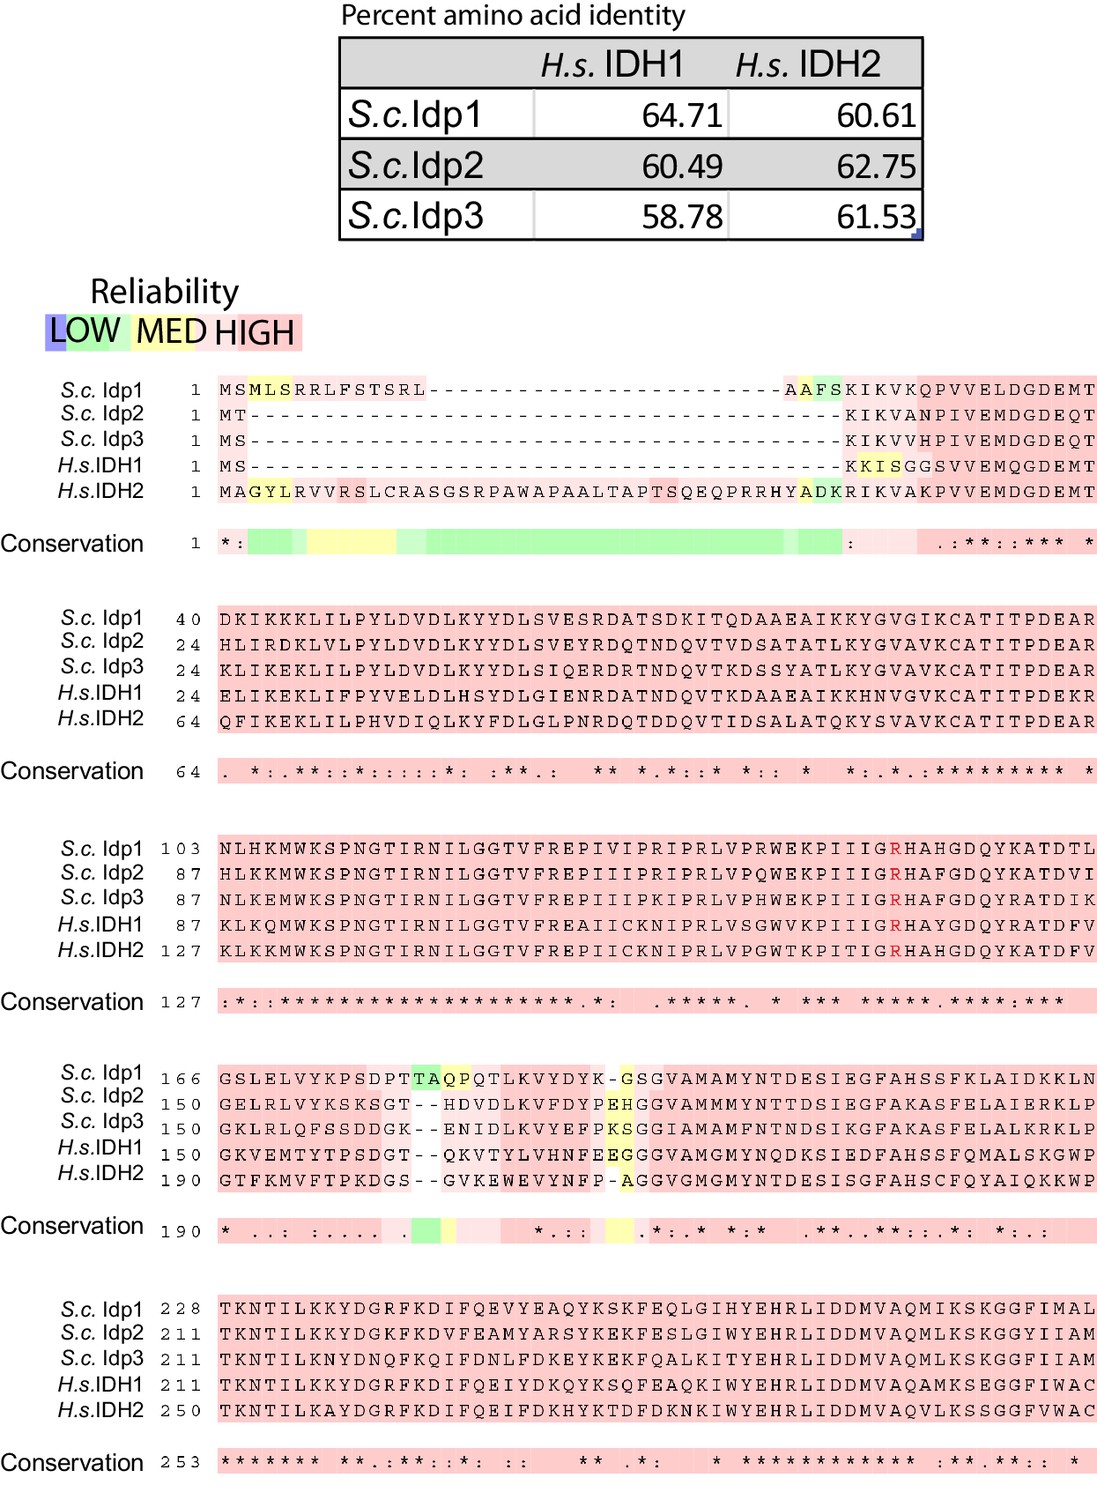
Multiple peptide sequence alignment of human and Saccharomyces cerevisiae NADP+-dependent isocitrate dehydrogenases.
Alignment of S. cerevisiae Idp1 (CAA98631.1), Idp2 (NP_013275.1), Idp3 (NP_014389.3) and H. sapiens IDH1 (CAG38738.1) and IDH2 (AAH71828.1) was generated using T-Coffee Multiple Sequence Alignment Tool (Notredame et al., 2000). Color shading indicates the reliability of the alignment from high reliability (Red) to low reliability (green/blue). Asterisk (*) indicates conserved amino acid in all sequences, colon (:) indicates a position with amino acids sharing physiochemical properties, and a dot (.) indicates semi-conserved substitutions occur in a given position of the alignment. Arginine 132 (or its equivalent residue) is noted by red text.
Figure 1—figure supplement 2
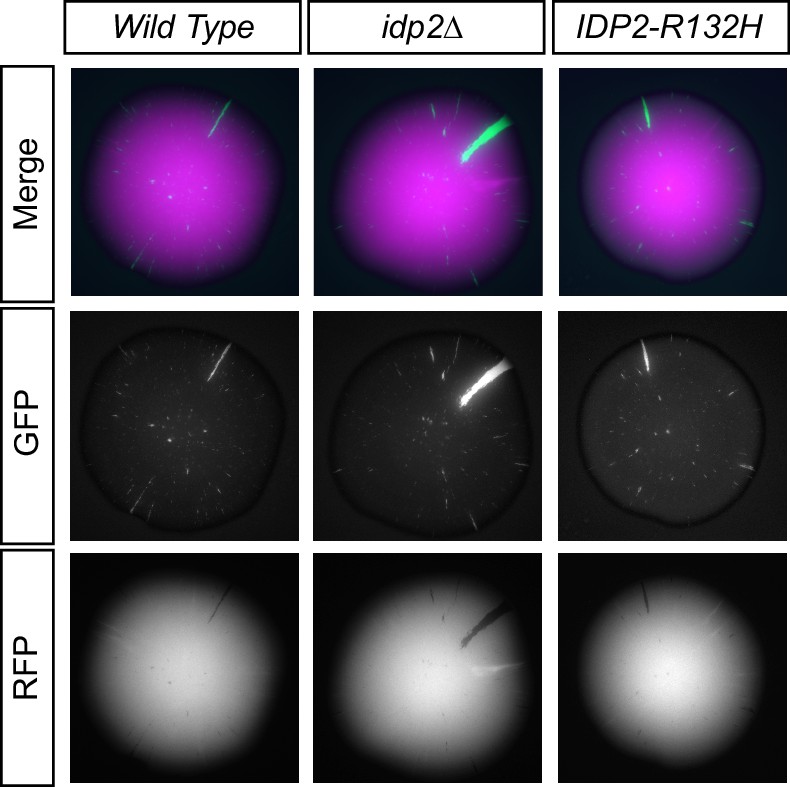
Images of colonies with the CRASH reporter assay and idp2∆ or IDP2-R132H mutations grown on glucose.
Cells were plated on CSM-Trp glucose agar plates and grown for 7 days at 30°C. Tops of colonies were imaged in GFP and RFP channels. The RFP and GFP channels for a single representative image of each strain are shown separately and as a merged image.
Figure 2
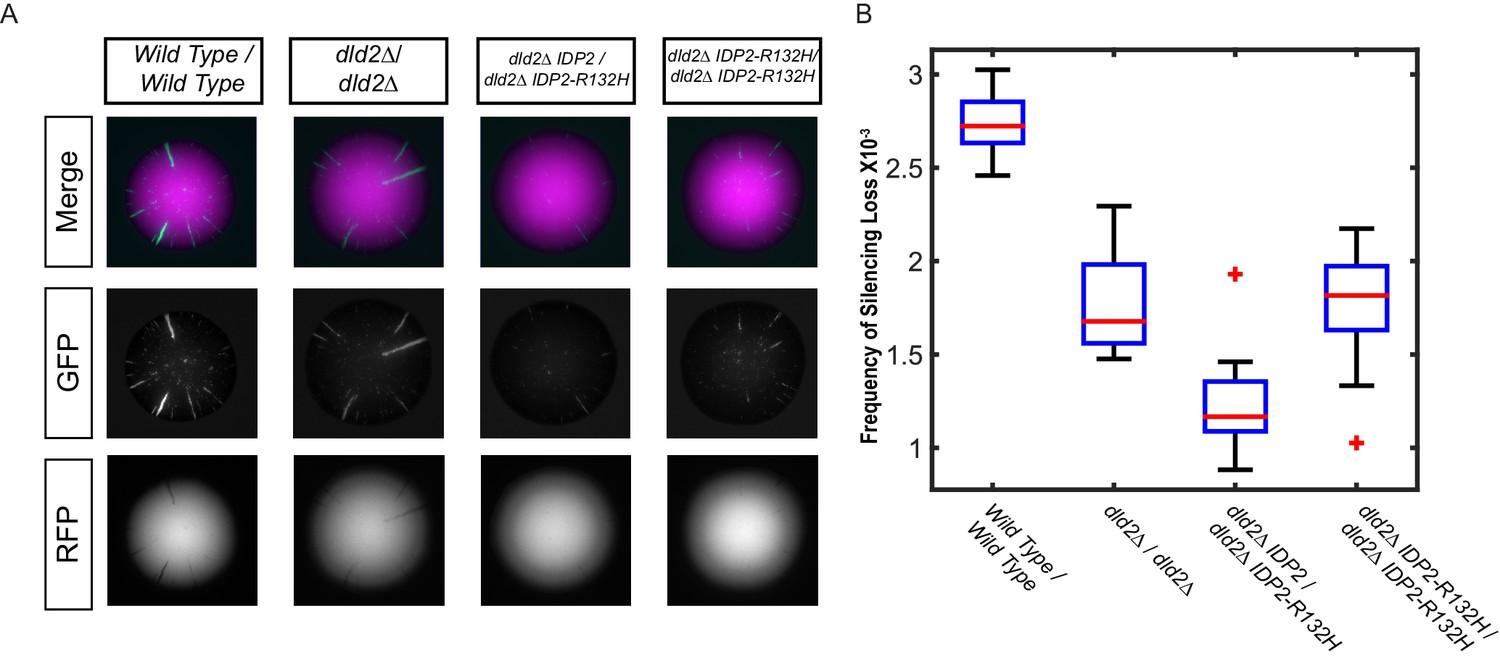
The silencing phenotype of IDP2-R132H was dominant.
(A) Images of diploid colonies with the CRASH reporter assay. The diploid strains have CRE inserted at both copies of HML and two copies of the CRASH RFP-GFP reporter cassette and were wild type (JRY10750), dld2Δ/dld2Δ (JRY10749), dld2Δ/dld2Δ IDP2/IDP2-R132H (JRY10751), or dld2Δ/dld2Δ IDP2-R132H/IDP2-R132H (JRY10748). Cells were plated on CSM-Trp glycerol agar plates and imaged after 7 days. (B) Plots of the frequency of silencing loss from mutants in panel A were calculated using MORPHE.
Figure 3 with 1 supplement
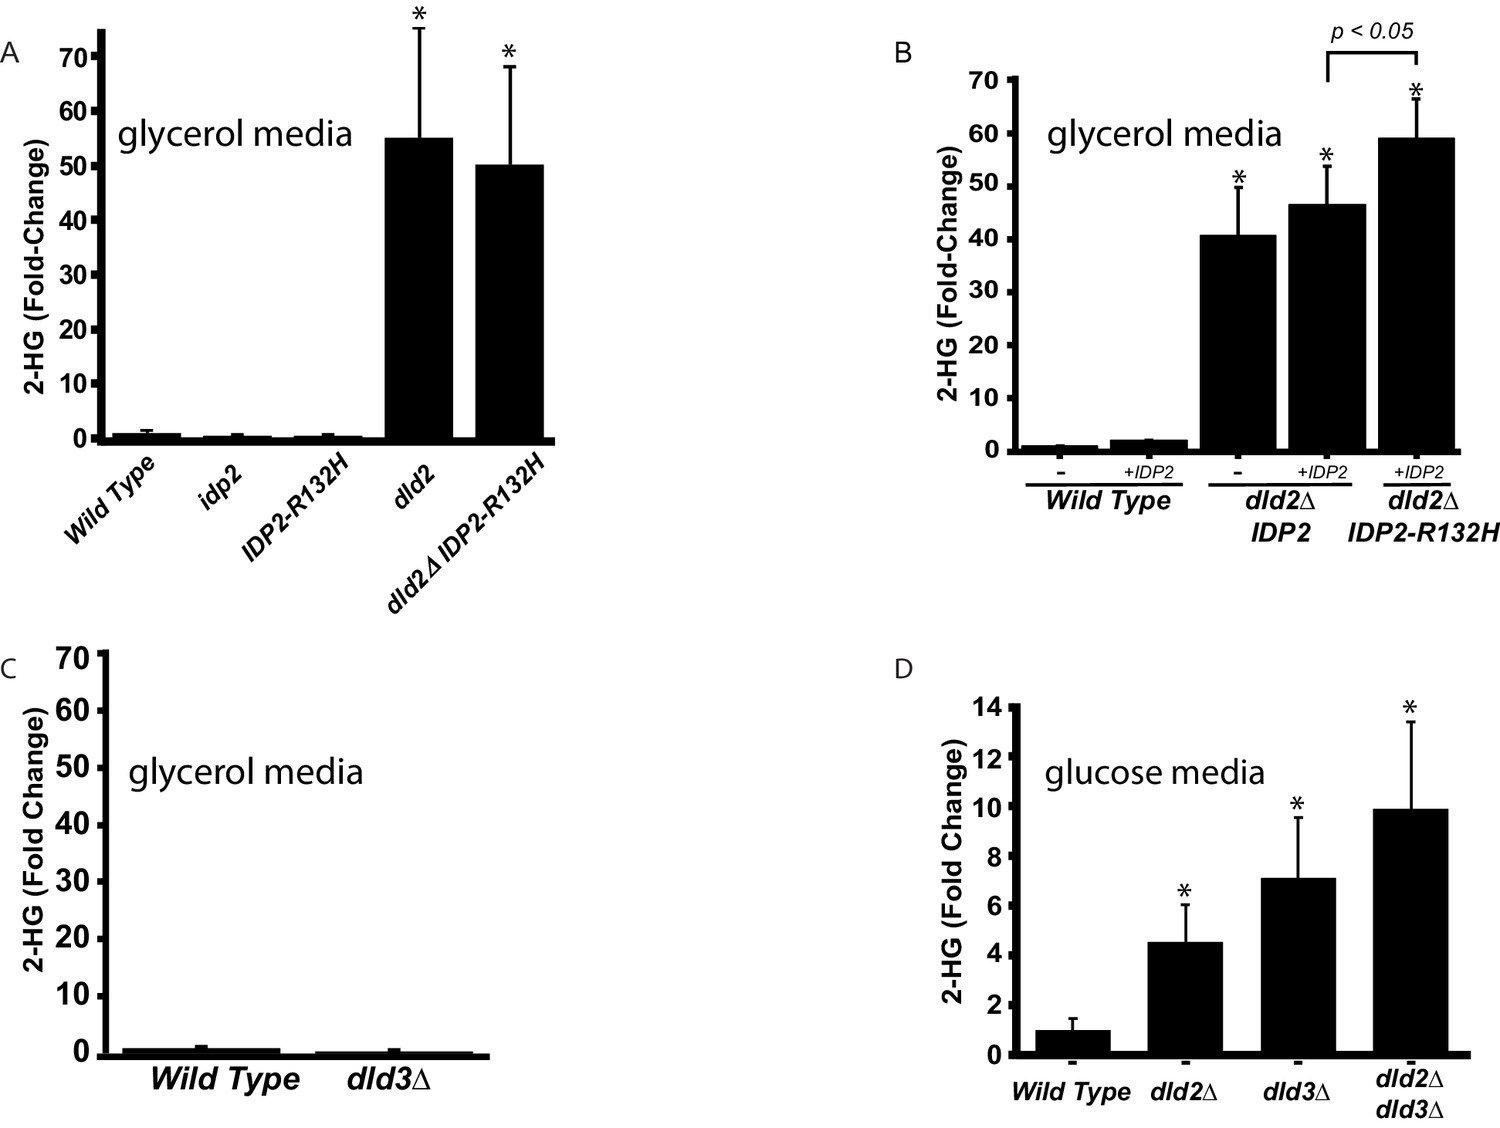
D2-HG levels increase in dld- and idp mutants.
(A) Plot of the average fold change from wild type (JRY10790) in levels of D-2-hydroxyglutarate from metabolite extracts of dld2Δ (JRY10733), idp2Δ (JRY10732), IDP2-R132H (JRY10731), and dld2Δ IDP2-R132H (JRY10734) mutant strains measured by LC-mass spectrometry. (B) Plot of the average fold change from wild type in levels of D-2-hydroxyglutarate from metabolite extracts from wild type (JRY10790), dld2Δ (JRY10733) and dld2Δ IDP2-R132H (JRY10734) cells transformed with the empty vector pRS315 (denoted as -) or plasmid pJR3399 containing a wild-type copy of IDP2 (denoted as +IDP2). (C) The average D-2-hydroxyglutarate levels from wild type (JRY10790) and dld3∆ (JRY10752) strains were measured and plotted as in part A. (D) The average D-2-hydroxyglutarate levels from wild type (JRY10790), dld2∆ (JRY10733), dld3∆ (JRY10752), and dld2Δ dld3Δ (JRY10753) mutants grown in minimal medium with 2% glucose were measured as in part A. For all panels, statistical analysis was performed using an unpaired, two-tailed (Student’s) t test. Error bars show the standard error of the mean. Bars marked by an asterisk (*) were statistically significantly different (p<0.05) from wild type.
Figure 3—figure supplement 1
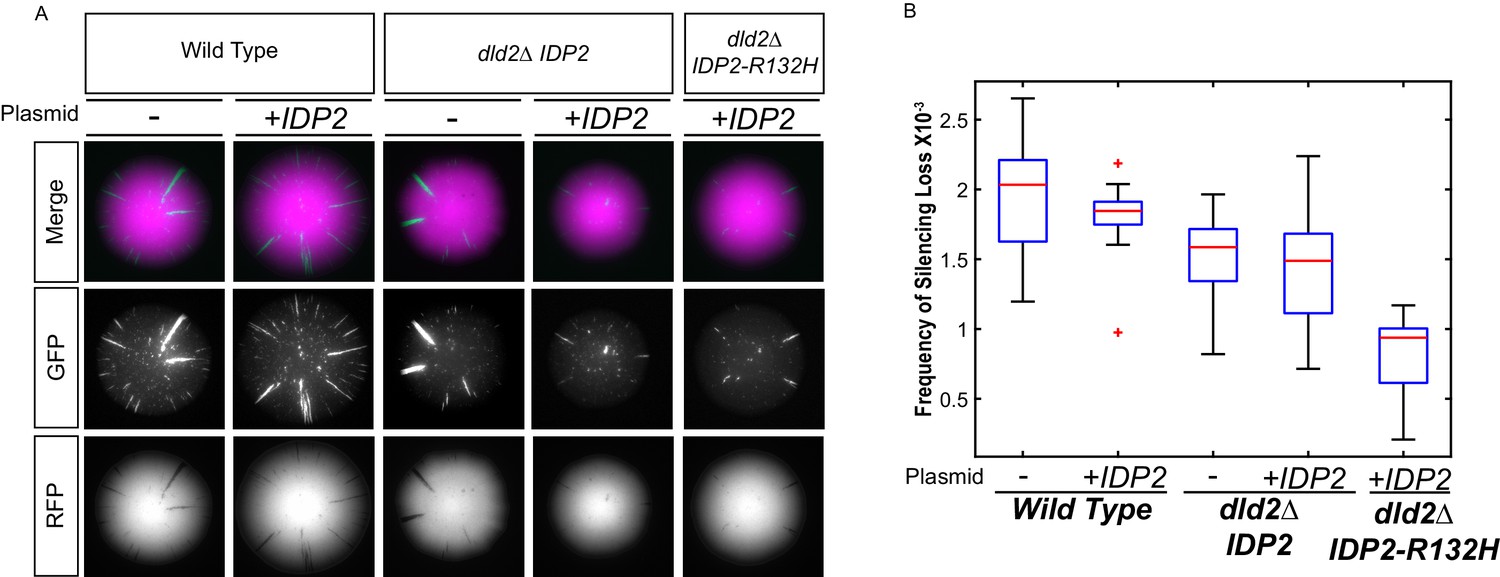
Increased D2-HG levels correspond to an increase in silencing.
(A) Images of colonies with the CRASH reporter assay from wild type (JRY10790), dld2Δ (JRY10733) and dld2Δ IDP2-R132H (JRY10734) cells transformed with the empty vector pRS315 (denoted as ‘-') or plasmid pJR3399 containing a copy of wild-type IDP2 (denoted as +IDP2). (B) Plots of the frequency of loss-of-silencing events from mutants in panel A calculated using MORPHE.
Figure 4
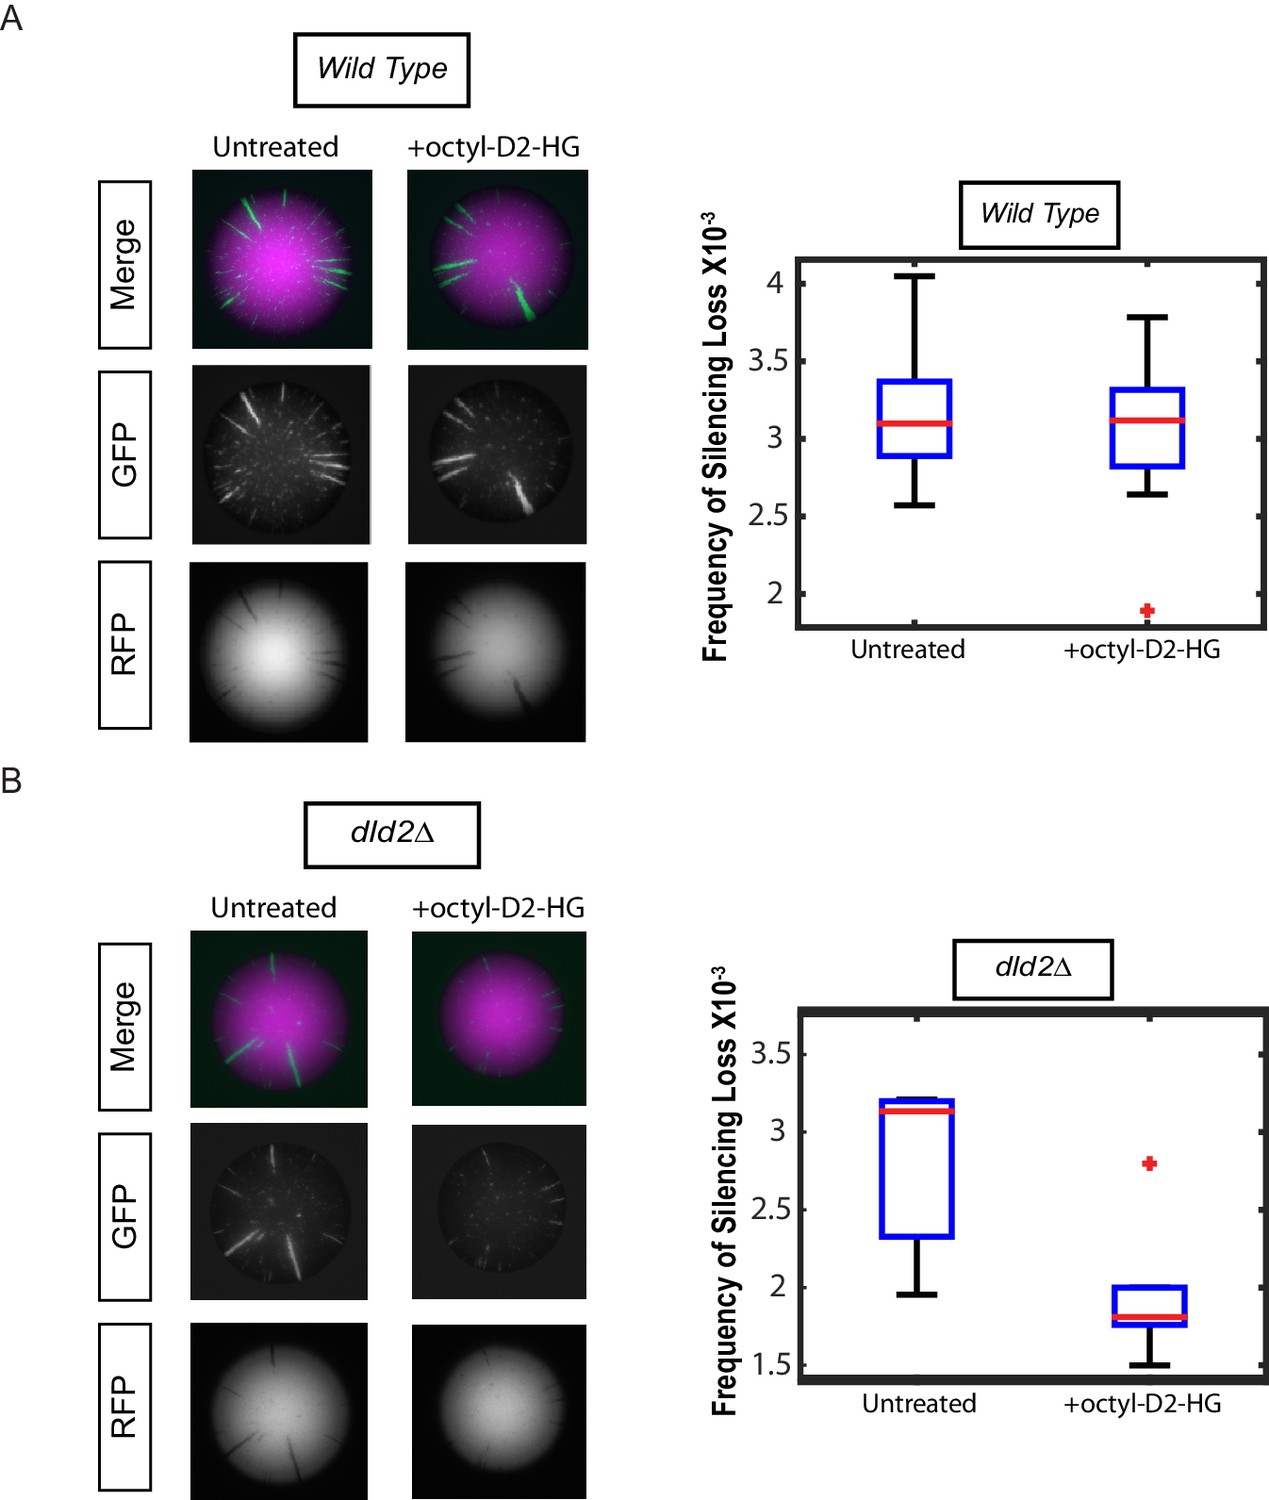
Treatment with cell-permeable octyl-D2-HG increased heterochromatin silencing.
(A) Images of wild type (JRY10790) CRASH assay reporter colonies that were grown on CSM-Trp 3% Glycerol (untreated) or with 100 µM octyl-D2-HG added to the medium (Left Panel). Plots of the frequency of silencing loss calculated using MORPHE (Right Panel). (B) Images of dld2Δ (JRY10733) CRASH assay reporter colonies that were grown on CSM-Trp 3% Glycerol (untreated) or with 100 µM octyl-D2-HG added to the medium (Left Panel). Plots of the frequency of silencing loss from colonies calculated using MORPHE. The data in Figure 4A and B were from independent experiments conducted on different days with different batches of media. MORPHE-based comparisons should be restricted to experiments performed in parallel at the same time (Liu et al., 2016).
Figure 5
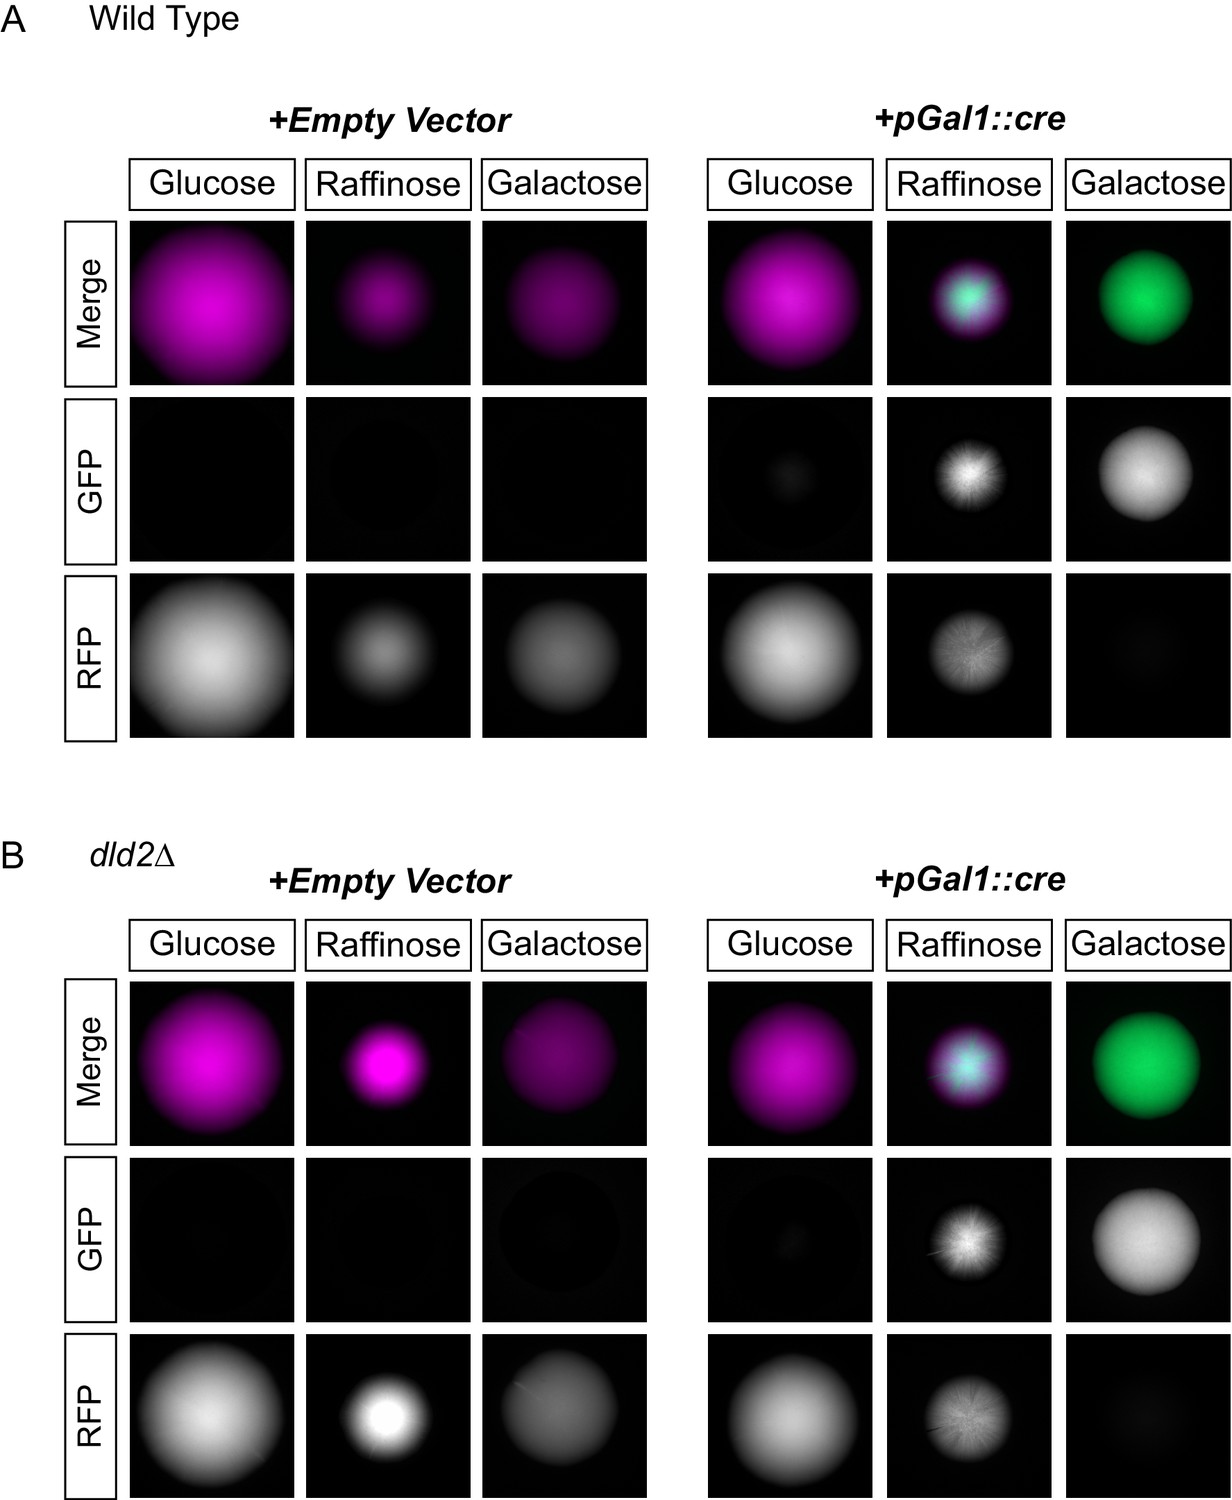
D2HG did not enhance a locus-specific gene repression mechanism.
(A) Images of colonies of CRASH reporter strains with wild-type HML (JRY10757) and either a pRS413 empty vector (left panels) or a vector with cre expressed from the GAL1 promoter (pSH62) (right panels). Cells were plated on CSM-His-Trp with the indicated carbon source and grown for 7 days at 30°C. Representative images show the merged and separate GFP and RFP channels. (B) The same experiment as in part A was performed in a strain containing a dld2 deletion (JRY10758).
Figure 6 with 1 supplement
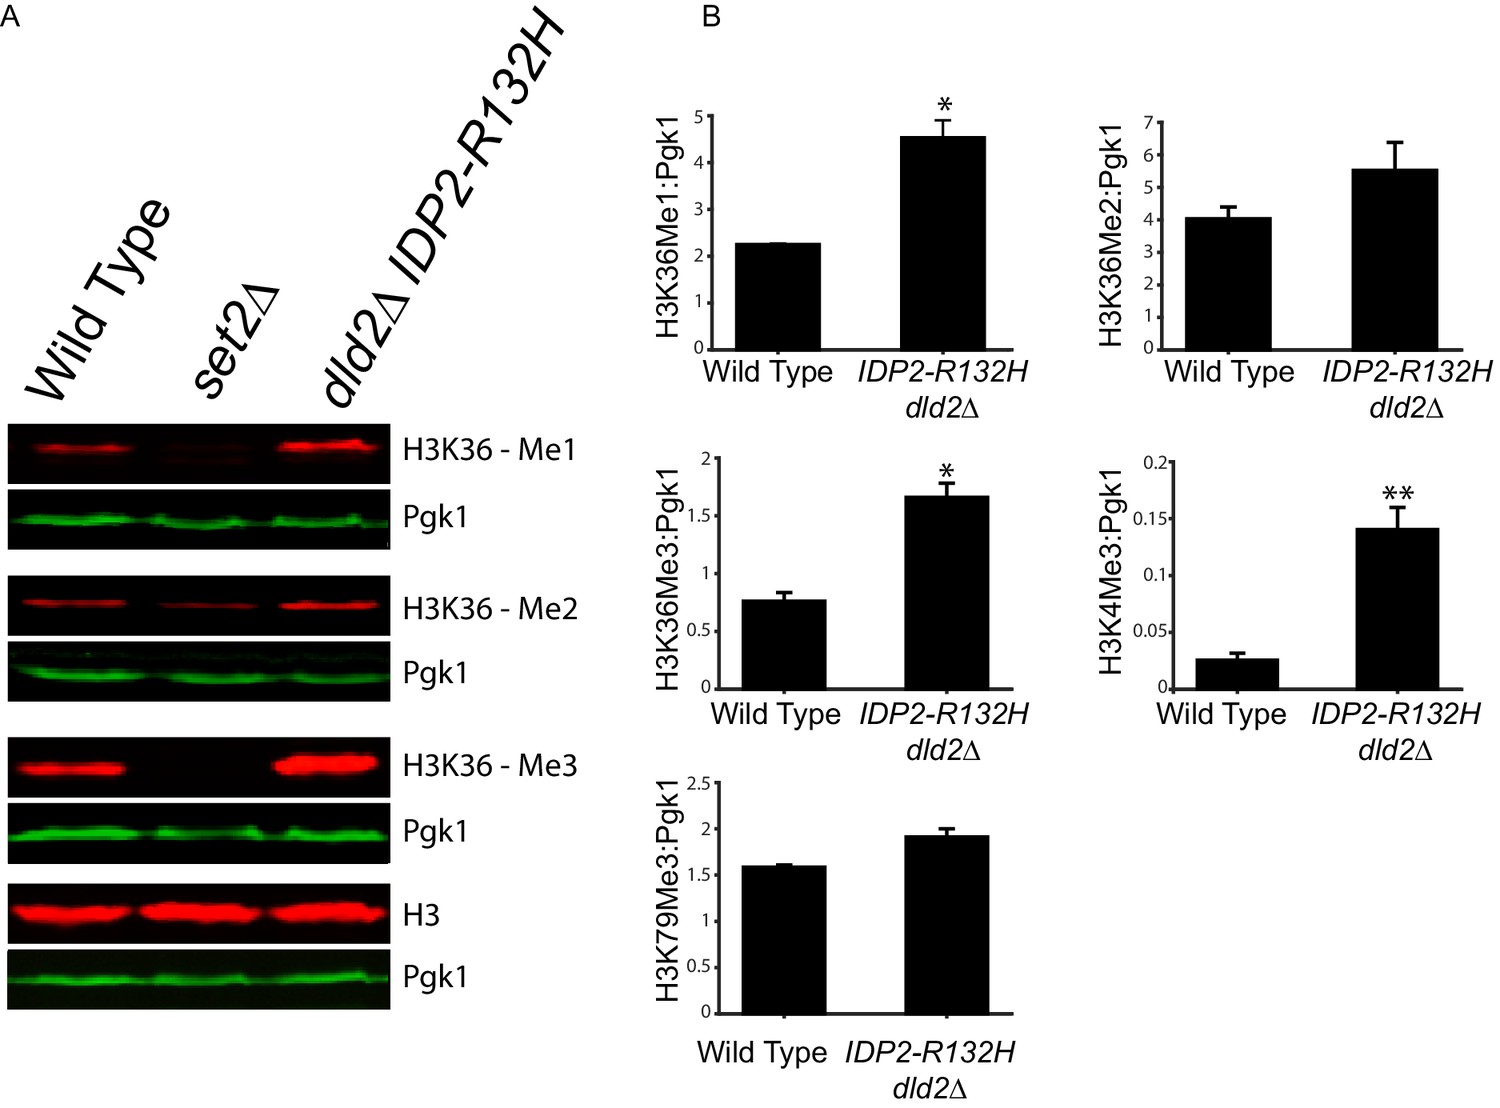
Bulk histone methylation increased in strains with high levels of D2-HG.
(A) Immuno-blot analysis of H3 histone methylation states from wild type (JRY10790), set2∆ (JRY10746), and dld2∆ IDP2-R132H (JRY10734) mutants. The upper panel of each set shows immuno-blot signals generated from antibodies against mono-, di-, or trimethyl H3K36, and total H3. The lower panel of each set shows a loading control immuno-blot signal generated from an antibody against Pgk1 from the same membrane as the panel above it. (B) Fluorescent immuno-blot signals from panel A and from Figure 6—figure supplement 1 were imaged and quantified using LI-COR Odyssey. The value of each methylation mark normalized to total H3 was calculated and the average of measurements from three independent clones, which serve as biological replicates, was plotted. The error bars represent standard error of the mean. Indicated p-values were generated by an unpaired, two-tailed (Student’s) t test (*p≤0.01, **p≤0.005).
Figure 6—figure supplement 1
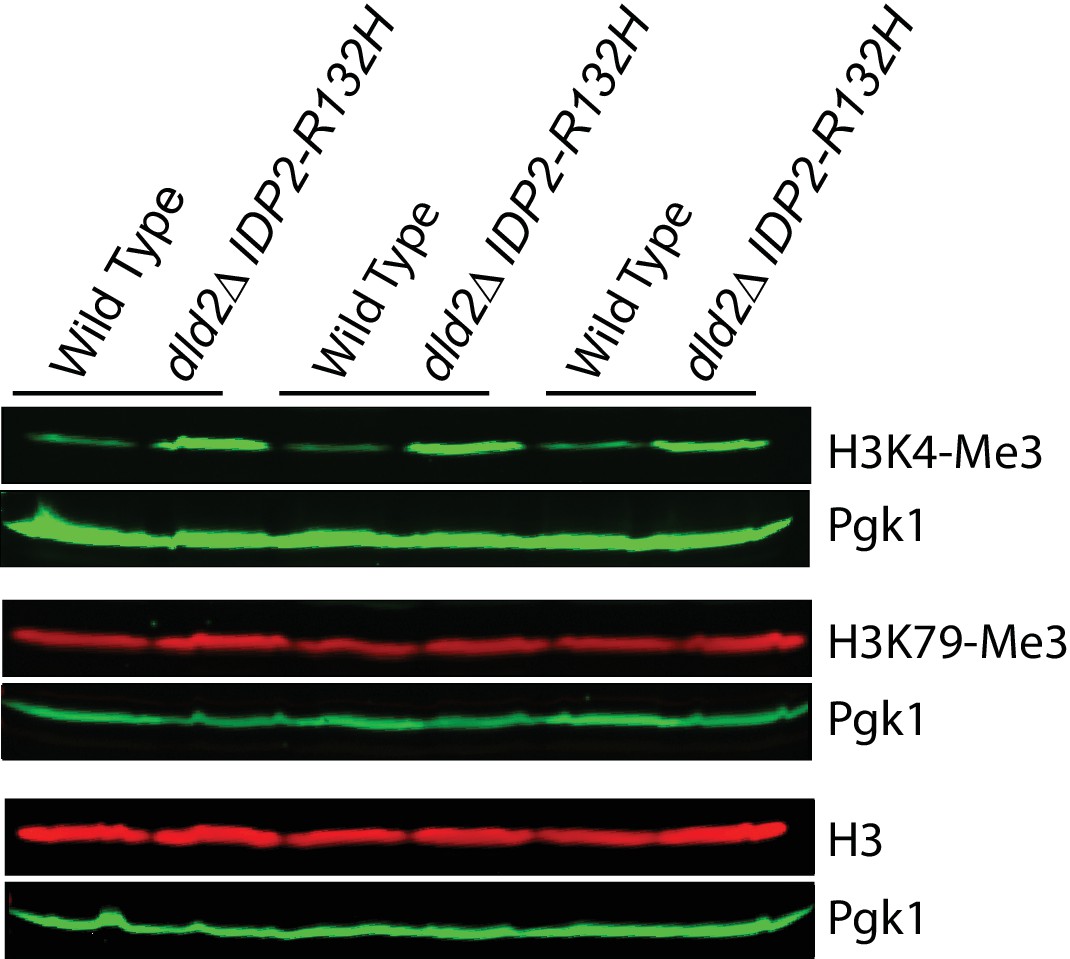
Immuno-blot analysis of H3 histone methyl states from wild type (JRY10790) and dld2∆ IDP2-R132H mutants (JRY10734).
The upper panel of each set shows immunoblot signals generated from antibodies against trimethyl H3K4, H3K79, and total H3, as imaged on a LI-COR Odyssey. The lower panel of each set shows a loading control immuno-blot signal generated from an antibody against Pgk1 from the same membrane as the panel above it.
Figure 7 with 1 supplement

Loss of H3K36 demethylases Gis1 and Rph1 increased heterochromatin stability.
(A) Images of CRASH assay reporter colonies that are wild type (JRY10790) or contain mutations in H3K36 demethylases. (B) Plots of the frequency of loss-of-silencing events from mutants in panel A calculated using MORPHE. (C) Images of CRASH assay reporter colonies (JRY10790) transformed with plasmids encoding Jumonji-domain demethylases overexpressed from a galactose-inducible promoter. The colonies were grown on agar plates containing 2% galactose. (D) Images of CRASH reporter strains with set2∆, gis1∆, and rph1∆ mutations. (E) Plots of the frequency of loss-of-silencing events from mutants in panel D calculated using MORPHE.
Figure 7—figure supplement 1
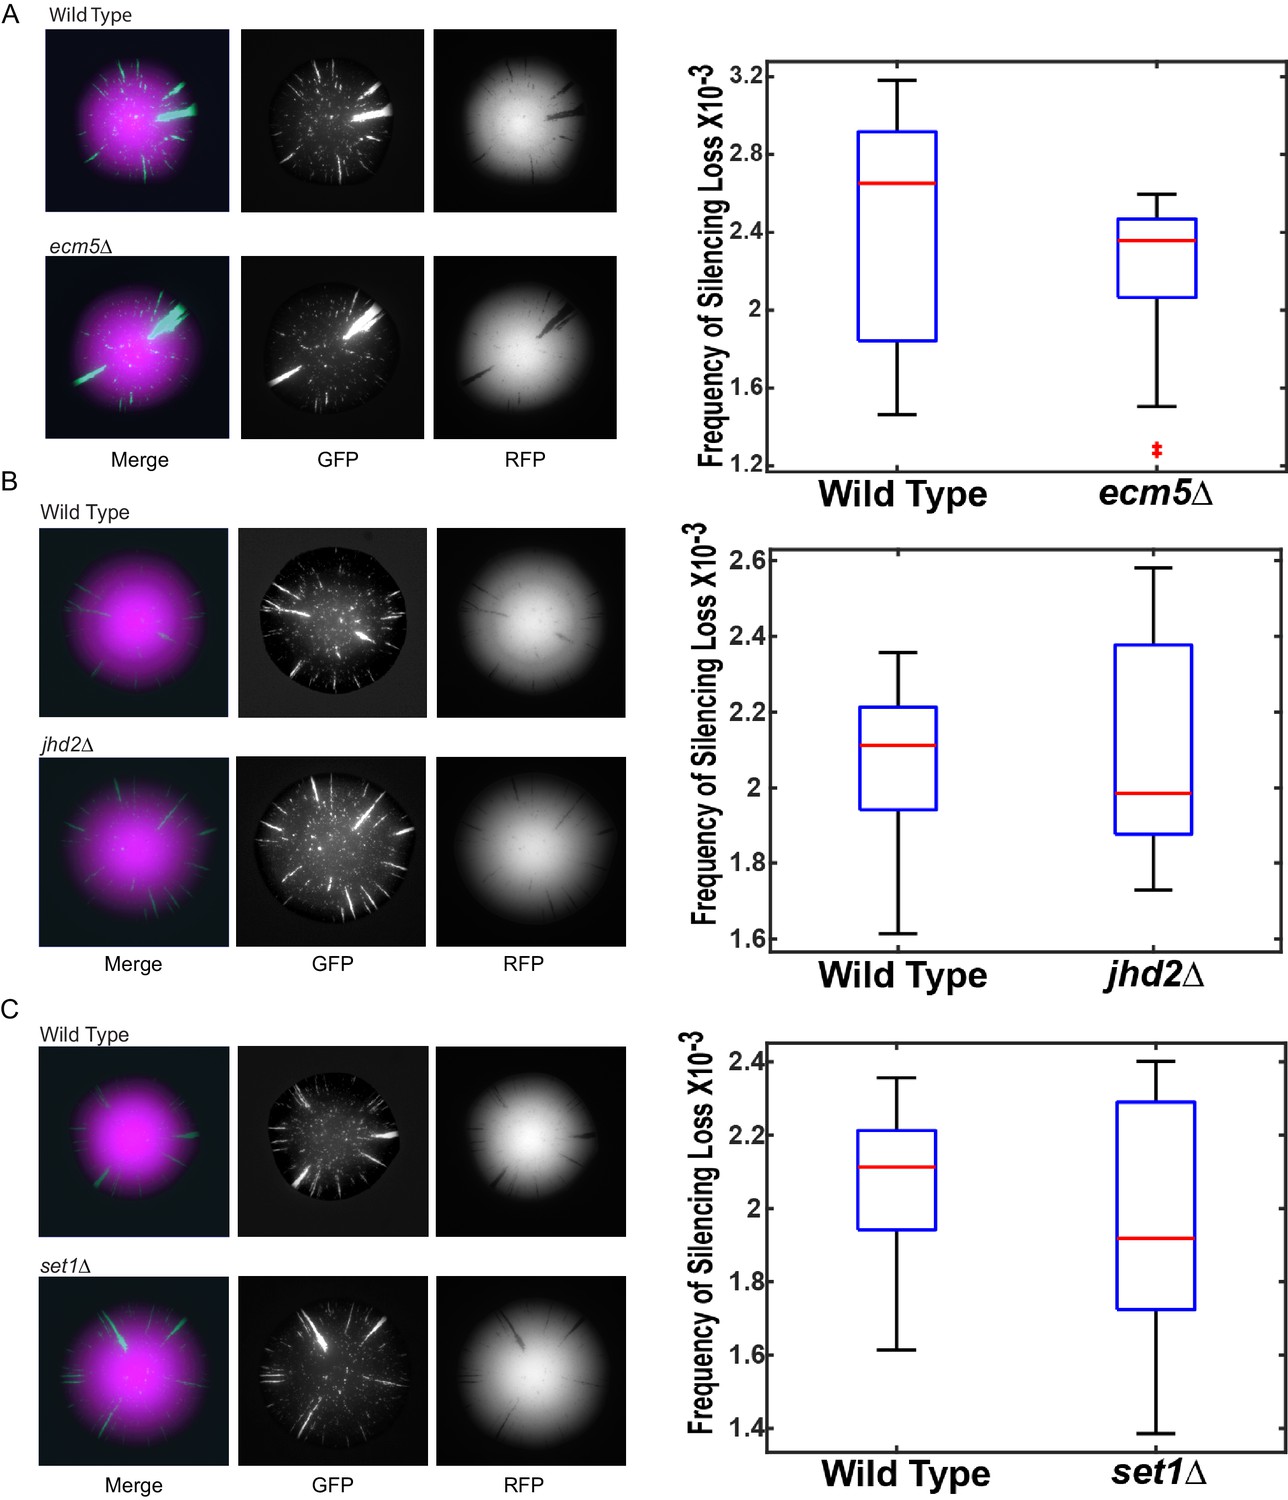
Images of colonies with the CRASH reporter assay and emc5Δ, jhd2Δ, and set1Δ mutations grown on glycerol.
Wild-type strains (JRY10790) and strains deleted for ecm5∆ (JRY10754) (A), jhd2∆ (JRY10755) (B), or set1Δ (JRY10756) (C) were grown on CSM-Trp-glycerol agar plates for 7 days at 30°C. Representative images show the merged and separate GFP and RFP channels. Plots of the frequency of silencing loss from mutants in each panel were calculated using MORPHE. For all panels, statistical analysis comparing wild type to the indicated mutant was performed using an unpaired, two-tailed (Student’s) t test. No statistically significant (p<0.05) differences were observed.
Figure 8
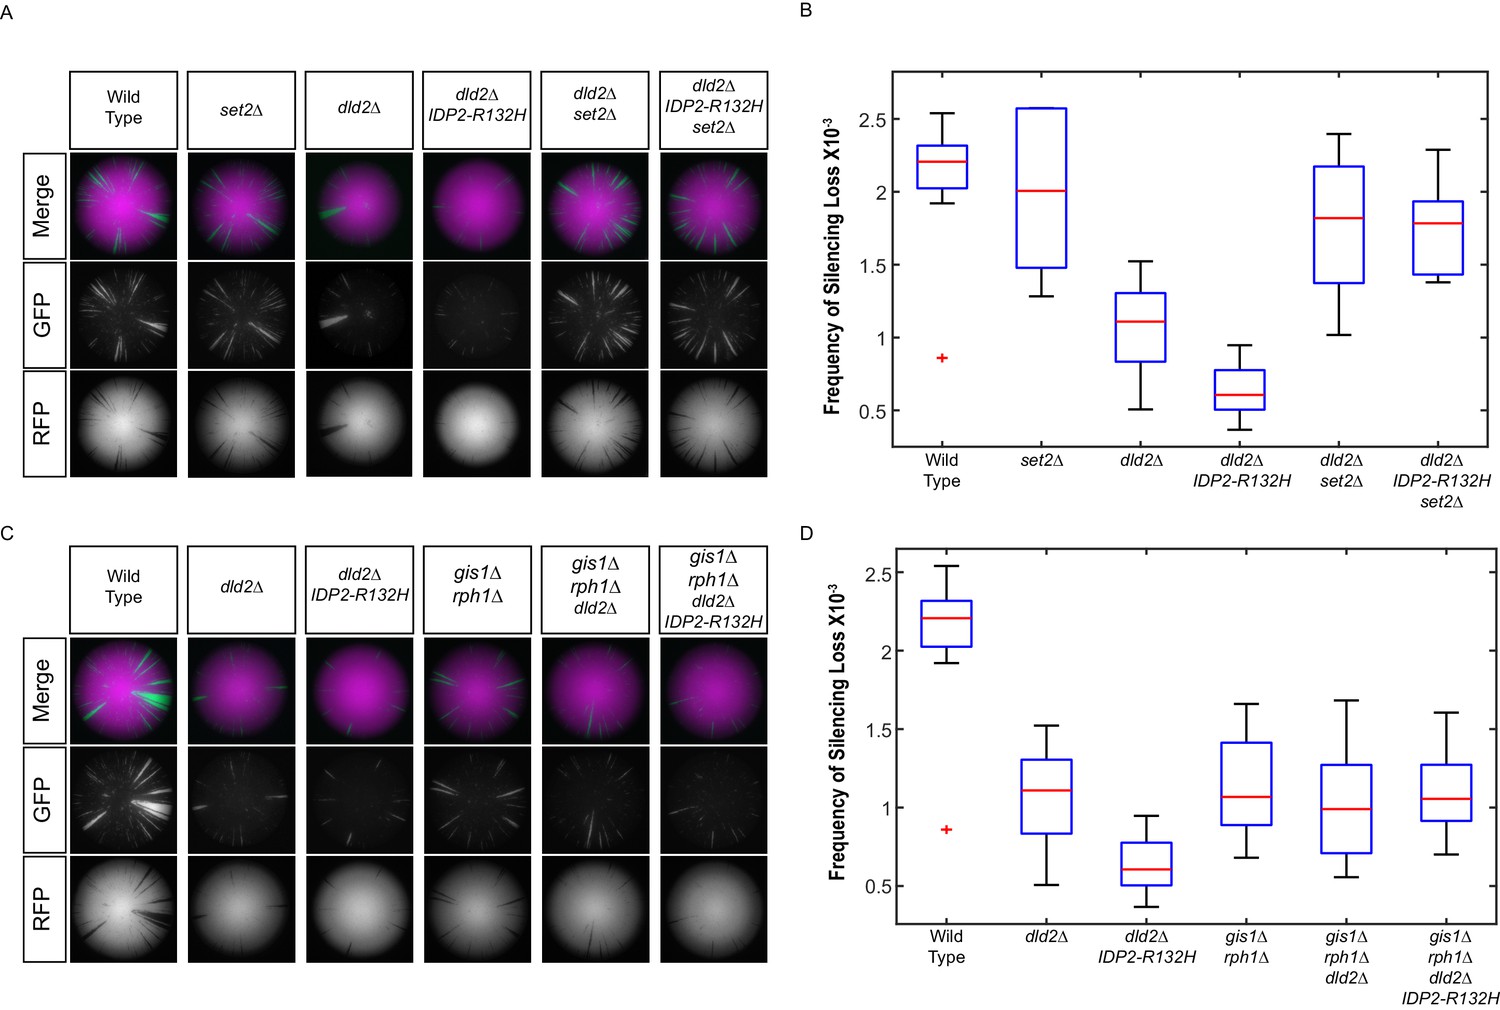
IDP2-R132H and dld2Δ silencing phenotypes depends on H3K36 hypermethylation.
(A) Images of CRASH assay reporter colonies that are wild type (JRY10790) or mutant dld2Δ (JRY10733), dld2Δ IDP2-R132H (JRY10734), set2∆ (JRY10746), dld2Δ set2∆ (JRY10794), or dld2Δ IDP2-R132H set2∆ (JRY10795). (B) Plots of the frequency of loss-of-silencing events from mutants in panel A calculated using MORPHE. (C) Images of CRASH assay reporter colonies. The same strains as in panel A were used with the addition of gis1Δ rph1Δ (JRY10742), gis1Δ rph1Δ dld2Δ (JRY10792), and gis1Δ rph1Δ dld2Δ IDP2-R132H (JRY10793). (D) Plots of the frequency of loss-of-silencing events from mutants in panel C calculated using MORPHE. The experiments in panel A and panel C were performed together, and the same batches of colony images were used in MORPHE analysis for wild type, dld2Δ, and dld2Δ IDP2-R132H (panels B and D).
Additional files
-
Supplementary file 1
Saccharomyces cerevisiae strains used in this study.
All strains were derived from W303 with the following genotype: can1-100 his3-11 leu2-3,11 lys2 TRP1 ADE2 ura3-1.
- https://doi.org/10.7554/eLife.22451.015
Download links
A two-part list of links to download the article, or parts of the article, in various formats.
Downloads (link to download the article as PDF)
Open citations (links to open the citations from this article in various online reference manager services)
Cite this article (links to download the citations from this article in formats compatible with various reference manager tools)
Oncometabolite D-2-Hydroxyglutarate enhances gene silencing through inhibition of specific H3K36 histone demethylases
eLife 6:e22451.
https://doi.org/10.7554/eLife.22451


